open access genomic expression program of with
TRANSCRIPT

Barbosa et al. Microb Cell Fact (2015) 14:124 DOI 10.1186/s12934-015-0318-1
RESEARCH
Genomic expression program of Saccharomyces cerevisiae along a mixed-culture wine fermentation with Hanseniaspora guilliermondiiCatarina Barbosa1, Arlete Mendes‑Faia1,2, Patrícia Lage1, Nuno P. Mira3,4 and Ana Mendes‑Ferreira1,2*
Abstract
Background: The introduction of yeast starter cultures consisting in a blend of Saccharomyces cerevisiae and non‑Saccharomyces yeast strains is emerging for production of wines with improved complexity of flavor. The rational use of this approach is, however, dependent on knowing the impact that co‑inoculation has in the physiology of S. cerevisiae. In this work the transcriptome of S. cerevisiae was monitored throughout a wine fermentation, carried out in single culture or in a consortium with Hanseniaspora guilliermondii, this being the first time that this relevant yeast–yeast interaction is examined at a genomic scale.
Results: Co‑inoculation with H. guilliermondii reduced the overall genome‑wide transcriptional response of S. cerevi-siae throughout the fermentation, which was attributable to a lower fermentative activity of S. cerevisiae while in the mixed‑fermentation. Approximately 350 genes S. cerevisiae genes were found to be differently expressed (FDR < 0.05) in response to the presence of H. guilliermondii in the fermentation medium. Genes involved in biosynthesis of vitamins were enriched among those up‑regulated in the mixed‑culture fermentation, while genes related with the uptake and biosynthesis of amino acids were enriched among those more expressed in the single‑culture. The dif‑ferences in the aromatic profiles of wines obtained in the single and in the mixed‑fermentations correlated with the differential expression of S. cerevisiae genes encoding enzymes required for formation of aroma compounds.
Conclusions: By integrating results obtained in the transcriptomic analysis performed with physiological data our study provided, for the first time, an integrated view into the adaptive responses of S. cerevisiae to the challenging environment of mixed culture fermentation. The availability of nutrients, in particular, of nitrogen and vitamins, stands out as a factor that may determine population dynamics, fermentative activity and by‑product formation.
Keywords: Mixed‑culture fermentation, Transcriptomics, Saccharomyces cerevisiae, Hanseniaspora guilliermondii, Wine
© 2015 Barbosa et al. This article is distributed under the terms of the Creative Commons Attribution 4.0 International License (http://creativecommons.org/licenses/by/4.0/), which permits unrestricted use, distribution, and reproduction in any medium, provided you give appropriate credit to the original author(s) and the source, provide a link to the Creative Commons license, and indicate if changes were made. The Creative Commons Public Domain Dedication waiver (http://creativecommons.org/publicdomain/zero/1.0/) applies to the data made available in this article, unless otherwise stated.
BackgroundVarious non-Saccharomyces yeasts have been examined as potential adjuncts to Saccharomyces cerevisiae exploit-ing their flavor properties in order to respond to the new challenges of consumer demands for wines with high complexity of flavor and stylistic distinction [1–5]. This beneficial impact of non-Saccharomyces yeasts on wine
composition has been found to be influenced by the spe-cies/strains of Saccharomyces and non-Saccharomyces used; by the size of the inocula and by the timing of inoc-ulation (simultaneous vs sequential), among other factors [reviewed in 2]. On the other hand, non-Saccharomyces yeasts have also been found to have an inhibitory effect over S. cerevisiae growth, presumably due to the produc-tion of toxic compounds such as fatty acids and killer factor [6–10]. In addition, competition for nutrients, in particular nitrogen and/or vitamins, were also proposed to limit growth and fermentative ability of S. cerevisiae
Open Access
*Correspondence: [email protected] 2 BioISI‑Biosystems and Integrative Sciences Institute, Campo Grande, Lisbon, PortugalFull list of author information is available at the end of the article

Page 2 of 17Barbosa et al. Microb Cell Fact (2015) 14:124
strains when co-cultured with non-Saccharomyces spe-cies [7, 11, 12]. Moreover, a recent study from our labo-ratory has shown that initial nitrogen levels of musts impact mixed-culture dynamics and final aroma compo-sition of wines [6].
Wine research has benefited enormously from the priv-ileged position of S. cerevisiae as an experimental system in life sciences research [13]. The budding yeast was the first eukaryote organism to have its genome sequenced [14], which paved the way for the development of robust advanced genetic tools that put this species at the fore-front of ‘-omics’ research. Using these genome-wide approaches, previous studies have elucidated cellular adaptive responses of S. cerevisiae during wine fermen-tation at different genomic levels including transcrip-tome, proteome and metabolome [15–22]. In particular, transcriptomic analysis has provided valuable insights to understand the molecular basis by which the nutritional composition of the growth medium and, in particular the initial concentration of nitrogen, impacts growth and performance of fermentations undertaken by S. cerevi-siae wine yeasts [15, 19, 23, 24]. This information, besides giving basic knowledge on S. cerevisiae physiology, has provided valuable data of practical interest for the con-trol and prevention of slow and premature fermentation arrest during winemaking and for the clarification of the impact of nitrogen metabolism of S. cerevisiae on aroma compounds formation during alcoholic fermentations. OMICS analyses also have the potential to provide a clear cut picture of the molecular mechanisms by which S. cer-evisiae responds to the presence of other microbes in the environment, however, up to now only a few studies have addressed that issue in the context of wine fermentations. Recently, the transcriptome-wide response of yeast cells in mixed cultures with different wine bacteria had been elucidated including Lactobacillus delbrueckii subsp. bul-garicus, which co-occur with yeast in kefir fermentations [25] and Oenococcus oeni, used for malolactic fermenta-tion [26–28, 29]. The results of this last study indicate that S. cerevisiae-O. oeni interaction during winemaking involves not only indirect competition for nutrients, but also direct antagonistic responses. Although yeast–yeast interactions have not been examined at a genome-wide scale, some attempts have been made to examine the influence exerted by the presence of Starmerella bom-bicola, on the expression of a few selected S. cerevisiae genes [30]. Exposure to the non-Saccharomyces species was found to lead to alterations in both expression and enzymatic activity of S. cerevisiae alcohol dehydrogenase 1 (encoded by ADH1 gene) and pyruvate decarboxylase (encoded by PDC1).
In this study it was performed the first genome-wide analysis of how S. cerevisiae adjusts its transcriptome
along fermentation of a natural grape must in single cul-ture or in consortium with Hanseniaspora guilliermon-dii. To our knowledge this is the first study focused on the elucidation at the molecular level of this yeast–yeast interaction, a knowledge that could be used to guide the rational development of mixed blends composed by these two yeasts and of its subsequent utilization in mixed fermentations.
ResultsIn a previous work the effect of grape-juice nitrogen availability on wine yeast mixed-culture fermentations has been evaluated using a strain of H. guilliermondii in consortium with S. cerevisiae [6]. The results obtained provided evidences that the presence of H. guilliermondii negatively affects S. cerevisiae growth and fermentation rate, irrespective of the initial nitrogen concentration of the grape-juice. Co-inoculation of S. cerevisiae with H. guilliermondii has also been found to significantly alter the panoply of aroma compounds found at the end of the fermentation [6]. In this work the alterations occurring in the transcriptome of S. cerevisiae along a mixed wine-fermentation with H. guilliermondii were monitored using DNA microarrays. Since H. guilliermondii is a non-standard model yeast for which comprehensive DNA microarrays are not available, we have focused on the effect of the co-inoculation only in the alteration of the S. cerevisiae transcriptome. The experimental conditions used were the same as those described in [6], being of notice the choice of cultivating the two yeasts in natural grape-juice supplemented with di-ammonium phosphate (DAP), as these were the conditions where the impact of co-inoculation on the formation of aroma compounds was more evident [6].
Transcriptional profiling of S. cerevisiae in single‑ and in mixed‑culture fermentationsThe transcriptomic profiling of the mixed-culture fer-mentations was performed at three different time-points (Fig. 1; Table 1): in mid-exponential growth phase (24 h), in early stationary-phase (48 h), and in late stationary growth-phase (96 h). To get a global view on how the presence of H. guilliermondii impacted the transcrip-tome of S. cerevisiae throughout the fermentation, the data obtained from the microarrays experiments were subjected to Principal Component Analysis (PCA). This multivariate statistical analysis revealed that gene expres-sion differences between the fermentation stages were much greater than those observed between the two inoculum types (Fig. 2). The first two principal compo-nents (PCs) accounted for more than 75 % of the vari-ation observed, with PC1 accounting for the majority (61.8 %) of the observed variability. Samples clustered

Page 3 of 17Barbosa et al. Microb Cell Fact (2015) 14:124
together in a fermentation stage-specific manner, group-ing along the first axes of variation, being observed minor variations between the independent biological replicates. Nevertheless, the separation of the samples collected at the same time-point rendered clear that the presence of H. guilliermondii affected S. cerevisiae transcriptome along fermentation. Notably, the maximal variation in S. cerevisiae genomic expression was reached at the later fermentation stages, in agreement with the much higher number of genes that was found to be differentially in the pair-wise comparisons performed between the two fer-mentations at the same time-point (see below, Additional file 1). As denoted by Maligoy et al. [27] caution should be taken when analyzing transcriptome data from two parallel cultures, since the variations of transcript levels observed could be either specific to the comparison of the two culture conditions or linked to a difference in the dynamics of the two cultures. To assure that the observed changes in the expression of S. cerevisiae genes truly reflects the influence of the presence of H. guilliermondii,
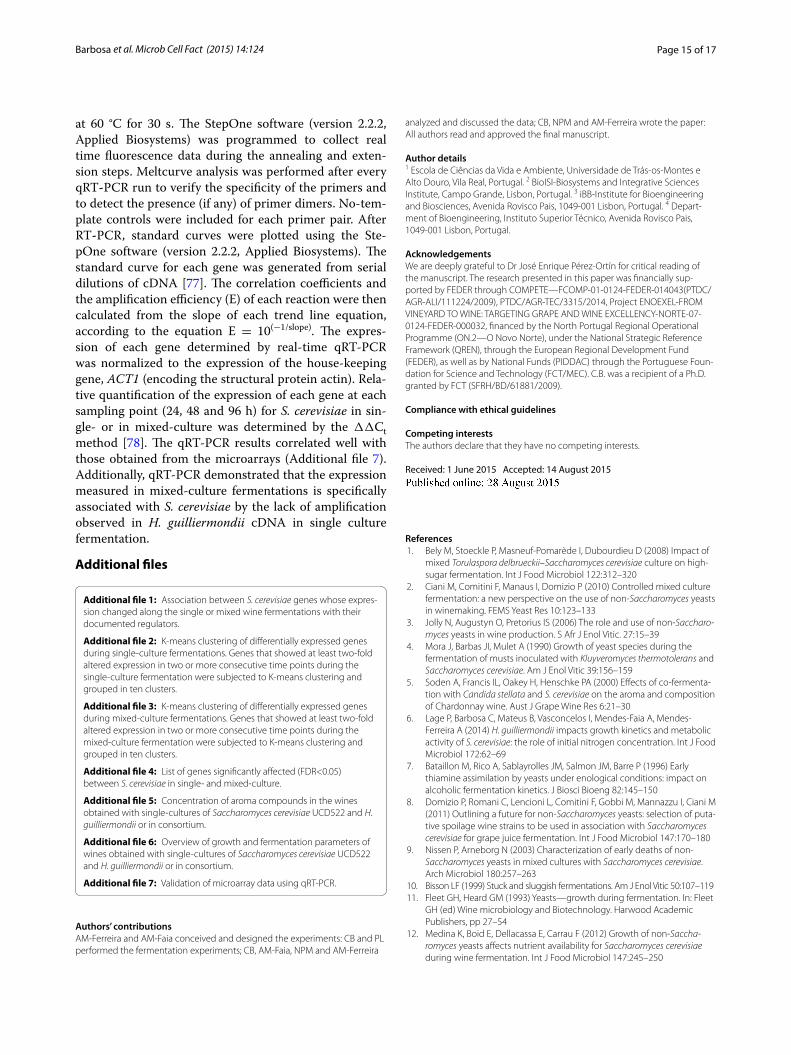
Fig. 1 Fermentation kinetics (a) and growth profiles (b) of single‑ or mixed‑cultures of S. cerevisiae and H. guilliermondii in natural grape‑juice. Values presented are the means from triplicate fermentations. Arrows indicate the sampling points for transcriptomic analysis (The data stem from Lage et al. [6])
Table 1 Overview of some fermentation parameters determined at the time-points selected for transcriptomic analysis
Data points are the means from triplicate fermentations
Sc single-culture, Mc mixed-culture, nd not detected
Values in the same column with different superscript letters are significantly different (p < 0.05)
Sampling point Glucose (g/L) Fructose (g/L) Ethanol (% v/v) Ammonium (mg/L) Glycerol (g/L)
24 h
Sc 104.31 ± 10.4a 110.89 ± 6.47ab 1.97 ± 0.07d 167.96 ± 19.24a 1.00 ± 0.13e
Mc 109.31 ± 5.86a 113.21 ± 5.29a 1.74 ± 0.10d 171.69 ± 21.15a 1.64 ± 0.14d
48 h
Sc 57.29 ± 5.77c 93.18 ± 3.41b 4.80 ± 0.28c 1.91 ± 1.10c 4.74 ± 0.45c
Mc 76.25 ± 2.72b 93.44 ± 1.91b 5.07 ± 0.54c 39.10 ± 8.46b 4.81 ± 0.49c
96 h
Sc 4.98 ± 1.64e 52.44 ± 1.32c 8.48 ± 0.07b nd 6.89 ± 0.19b
Mc 28.28 ± 5.09d 55.25 ± 5.58c 9.58 ± 0.43a nd 8.51 ± 0.35a
Fig. 2 Principal Component Analysis of the alterations registered in the transcriptome of S. cerevisiae along a wine fermentation per‑formed in single culture or in consortium with H. guilliermondii. The PCA plot shows variation in expression levels of S. cerevisiae genes either in single‑ (Sc) or mixed‑culture (Mc) at each fermentation stage (24, 48 and 96 h)

Page 4 of 17Barbosa et al. Microb Cell Fact (2015) 14:124
rather than being attributable to different fermentation stages of the mixed and single cultures, the expression of a given gene in a given fermentation stage was com-pared to its mean expression (calculated taking the aver-age of the expression levels obtained in the three time points analyzed). Although the mean expression value of each gene along the fermentation is merely an arbitrary reference point, such way of analyzing gene expression mitigates the influence exerted by fermentation dynam-ics, while maintaining the aptitude to identify expression differences [31]. Furthermore, this approach also has the advantage of providing information on how S. cerevisiae transcriptome adjusts to the different dynamics of the single or mixed-culture fermentation; an information that would be missed if only cross-comparisons between expression levels in single vs mixed cultures had been performed. Only genes having an increased or decreased expression of at least twofold were considered to be up- or down- regulated in a given fermentation stage. Using this criterion, two sets of 2224 genes and 1406 S. cer-evisiae genes were considered to be differently expressed along the single- or mixed-fermentations, respectively (Additional files 2, 3). K-mean clustering analysis of these genes revealed that the modifications of S. cerevisiae genomic expression occurring throughout the wine fer-mentations showed similar patterns in the single and in the mixed culture since the gene clusters obtained for the two datasets are, in general, the same (Additional files 2, 3). A closer look into the functional categories of genes included in each cluster revealed that the herein observed alterations of the S. cerevisiae transcriptome along wine fermentation, either in single or in mixed-culture, are
consistent with the results reported in other studies car-ried out with different S. cerevisiae strains and/or explor-ing different fermentation conditions [17, 19–21, 32]. In specific, genes involved in carbohydrate metabolism, mitochondrial respiration/oxidative phosphorylation, stress response were found to be induced at 48 h of fer-mentation, both in the single- (clusters II–IV; Additional file 2) and in the mixed-culture fermentation (clusters I–III and IX; Additional file 3), this being attributed to the higher fermentative activity exhibited by the yeast cells at this fermentation stage. Differently, genes involved in cell growth, protein biosynthesis and ribosomal processing, were found to have higher expression at the earlier fer-mentation stage being repressed afterwards in response to stress associated with alcoholic fermentation pro-gression and entrance in stationary phase. The fact that S. cerevisiae in single-culture displayed more noticeable changes in its transcriptome, in terms of both the num-ber of genes and the magnitude of expression changes, compared to mixed culture (Fig. 3), might reflect a higher need to adjust to a more challenging environment caused by the higher fermentative activity observed.
Inference of the dynamics of transcriptional regulatory networks underlying the control of S. cerevisiae transcriptome throughout single and mixed fermentationsThe expression and the activity of transcriptional regula-tors have been shown to be on the basis of different met-abolic/phenotypic traits of fermentations undertaken by different wine yeast strains [33]. In that sense, to better understand how co-inoculation with H. guilliermondii affected the overall S. cerevisiae regulatory network along
Fig. 3 Variation of the expression of S. cerevisiae genes in single or in mixed culture with H. guilliermondii. The expression of each S. cerevisiae gene after 24, 48 or 96 h of single or mixed wine fermentation was compared with its mean expression value along the fermentation. Genes exhibiting at least twofold difference in expression were considered to be differently expressed and were included in this analysis

Page 5 of 17Barbosa et al. Microb Cell Fact (2015) 14:124
the fermentation, the datasets of the differently expressed genes in the three time-points herein under study were analyzed using the tools available in the YEASTRACT database [34, 35]. The activity of each transcription factor along the two fermentations in each of the time points was predicted based on the number of documented tar-gets in the corresponding datasets considering only direct regulatory associations. The results obtained were compiled in heat maps, which are shown in Fig. 4 and in Additional file 1. An over-representation of genes regu-lated by Sfp1, Fhl1 and Ifh1 is observed in the dataset of
genes up-regulated after 24 h in both single and mixed-culture fermentations (Fig. 4a). These transcription factors are involved in regulation of ribosomal gene expression and their pattern of activity is consistent with the early up-regulation of these genes during the growth phase and subsequent repression once cells approach stationary phase, as discussed above. Within the data-set of genes up-regulated after 48 and 96 h in the single culture fermentation it is clear the enrichment of docu-mented targets of the Adr1, Hcm1, Hap1, Hap2, Oaf1 and Pip2 transcription factors, all positive regulators of
Fig. 4 Association between S. cerevisiae genes whose expression changed along the single or mixed wine fermentations with their documented regulators. The entire dataset of genes found to change their expression throughout the single or the wine fermentations was searched for docu‑mented targets of all described S. cerevisiae transcription factors using the tools and information available in the YEASTRACT database. The activity of each transcription factor was predicted based on the number of targets present in each dataset only considering direct regulatory associations in which binding of the transcription factor to the target gene promoter. The dataset of up‑regulated genes was only searched for targets of tran‑scriptional activators (a) while the dataset of down‑regulated genes was only searched for targets of transcriptional repressors (b). Transcriptional regulators found to work both as transcriptional activators or repressors were included in both analyses. In this figure only a selected set of regula‑tory associations is shown but the full list is available in Additional file 1

Page 6 of 17Barbosa et al. Microb Cell Fact (2015) 14:124
genes required for the use of alternative carbon sources (Fig. 4a). The activation of these transcription factors at these stages of the fermentation could be attributable to an alleviation of glucose repression which has been sug-gested to occur along wine fermentations, a response that was proposed to be mediated by Adr1, Cat8 and the members of the Hap complex [19, 20]. Notably, the relevance of the above-referred regulons was much less prominent in the dataset of genes up-regulated in the mixed-culture fermentation (Fig. 4b), which could be due to the much lower consumption of glucose that was registered in this fermentation, compared to the single-culture fermentation (Table 1). Over-representation of the regulons controlled by several stress-responsive transcription factors, including Msn2 and Msn4, already demonstrated to play an important role in the control of transcriptional response to “fermentation stress” [15–22], was also evident in the three fermentation points ana-lyzed, more pronounced at 48 and 96 h (Fig. 4). In the mixed-culture fermentation, the over-representation of these “stress-responsive” regulons was considerably less prominent, suggesting that the environment of the mixed fermentation could be less stressful for S. cerevisiae cells than the environment of the single-culture fermenta-tion, as discussed above. Significantly, Sko1, Hot1 and Skn7, three of the stress-responsive factors that emerged from our analysis, are all known to be become activated upon phosphorylation by the Hog1 kinase [36], which was found to play an essential role in S. cerevisiae abil-ity to ferment grape-juice medium [37]. Several positive regulators of pseudohyphal growth were also found to be over-represented in the dataset of genes up-regulated throughout the single and mixed-culture fermentations, albeit in this last dataset the enrichment is less pro-nounced (Fig. 4b). Previous studies have also reported different levels of expression and activity of Phd1 and Sok2 in different wine yeast strains and in this case Sok2 activity was correlated with the different metabolic prop-erties of the strains analyzed [33]. It is of notice the fact that the enrichment of these regulons related with pseu-dohyphal differentiation was less significant in the mixed culture fermentation (Fig. 4b). This difference could be attributable to the lower consumption of ammonium, considering the essential role played by nitrogen avail-ability in the control of transition to pseudohyphal differ-entiation [38].
Within the dataset of down-regulated genes it is evident an over-representation of genes regulated by the stress-responsive transcription factors Skn7, Yap6 and Cin5. All these transcription factors had been found to recruit the general transcriptional repressor Tup1, a response that is thought to contribute to fine-tune the balance between activated and repressed genes in response to
changing environment [39]. A similar function has also been attributed to Nrg1 [40], another transcription fac-tor found to be over-represented in the dataset of genes repressed throughout the two fermentations (Fig. 4). Interestingly, a significantly high number of documented targets of the drug-responsive transcription factor Yrm1 was found in the dataset of genes down-regulated along the single and mixed-culture fermentations (Fig. 4). Until so far the role of Yrm1 in wine fermentation has not been examined although previous transcriptomic analysis have suggested that transcription factors involved in the con-trol of pleiotropic drug response may play a role in the control of S. cerevisiae genomic expression along wine fermentations [20, 41].
Co‑inoculation with H. guilliermondii elicits dissimilar transcriptional responses in S. cerevisiaeIn this section the expression of S. cerevisiae genes in mixed culture and in single culture is compared to have a clearer picture of the effect exerted by the presence of H. guilliermondii in the growth medium. Since the dynamics of the two fermentations were not significantly different, as discussed above, the differences found in gene expres-sion in the two culture conditions are likely to result from S. cerevisiae response to the presence of H. guilliermon-dii. To identify genes that could discriminate the two inoculation strategies used, a Rank-Product (RP) analysis was performed considering all samples of the single-cul-ture fermentation as a group and those of mixed-culture fermentation as another group, irrespective of the fer-mentation stage. This unsupervised approach led to the identification of 120 S. cerevisiae genes that seem to respond to the presence of H. guilliermondii during the course of fermentation, 85 being up-regulated in the presence of the non-Saccharomyces species and 35 down-regulated. A list of the top 10 S. cerevisiae genes whose expression varied the most in the presence of H. guil-liermondii is shown in Table 2. In general, the majority of the differently expressed genes are involved in amino acid biosynthesis, uptake or catabolism of specific amino acids for nitrogen mobilization, biosynthesis of vitamins, and purine nucleotide biosynthetic process, as well as an important number of genes with no biological function associated (Table 3; Additional file 4). In the following section, the results obtained at each time point are sepa-rately discussed.
Fermentation stage 1 (24 h)In the pair wise comparison performed at 24 h only 27 genes were found to be differentially expressed (FDR < 0.05) between the single and mixed-culture fer-mentations (Additional file 4). Interestingly among the ten genes that were more expressed in S. cerevisiae in the

Page 7 of 17Barbosa et al. Microb Cell Fact (2015) 14:124
Table 2 Top10 of the genes differently expressed in S. cerevisiae in single-culture (Sc) and mixed-culture (Mc) fermenta-tions, at the three fermentation stages (24, 48 and 96 h)
ORF Gene Function Fold change Sc/Mc
24 h
YCL025C AGP1 Low‑affinity amino acid permease with broad substrate range 13.4
YDR508C GNP1 High‑affinity glutamine permease 8.1
YOL086 W‑A Molecular function unknown 5.7
YHR021 W‑A ECM12 Putative protein of unknown function 5.3
YKL183C‑A Putative protein of unknown function 5.1
YOR348C PUT4 Proline permease 4.8
YDR130C FIN1 Spindle pole body‑related intermediate filament protein 4.6
YBL042C FUI1 High affinity uridine permease 4.5
YAL037C‑A Putative protein of unknown function 4.4
YBL052C SAS3 Histone acetyltransferase activity 4.0
YHR044C DOG1 2‑deoxyglucose‑6‑phosphate phosphatase −11.8
YDR018C Transferase activity, transferring acyl groups −8.9
YPL258C THI21 Hydroxymethylpyrimidine (HMP) and HMP‑phosphate kinase; involved in thiamine biosynthesis
−7.9
YDL021 W GPM2 Molecular function unknown −7.1
YHR043C DOG2 2‑deoxyglucose‑6‑phosphate phosphatase −6.7
YCR020C PET18 Protein of unknown function −6.1
YLR176C RFX1 Major transcriptional repressor of DNA‑damage‑regulated genes −6.1
YHL048C‑A Putative protein of unknown function −5.9
YOL055C THI20 Trifunctional enzyme of thiamine biosynthesis, degradation and salvage −5.6
YHR076 W PTC7 Type 2C serine/threonine protein phosphatase (PP2C) −5.5
48 h
YLR142 W PUT1 Proline oxidase involved in utilization of proline as sole nitrogen source 55.3
YJR152 W DAL5 Allantoate permease 52.7
YKR039 W GAP1 General amino acid permease 25.3
YMR107 W SPG4 Molecular function unknown 23.3
YMR175 W SIP18 Phospholipid binding 21.2
YMR118C Putative mitochondrial inner membrane protein of unknown function 20.3
YPR194C OPT2 Oligopeptide transporter 18.3
YCR098C GIT1 Plasma membrane permease; mediates uptake of glycerophosphoinositol and glycerophosphocholine as sources of the nutrients inositol and phosphate
17.4
YHL016C DUR3 Plasma membrane transporter for both urea and polyamines 15.4
YCL064C CHA1 Catabolic l‑serine (l‑threonine) deaminase 13.8
YMR095C SNO1 Protein of unconfirmed function; involved in pyridoxine metabolism; expression is induced during stationary phase
−14.2
YCL026C‑A FRM2 Type II nitroreductase, using NADH as reductant −13.7
YGL117 W Putative protein of unknown function −12.9
YBR092C PHO3 Acid phosphatase activity −10.1
YMR094 W CTF13 Subunit of the CBF3 complex −9.9
YML116 W ATR1 Multidrug efflux pump of the major facilitator superfamily −8.2
YML123C PHO84 High‑affinity inorganic phosphate (Pi) transporter −8.0
YLR372 W SUR4 Elongase; involved in fatty acid and sphingolipid biosynthesis −7.8
YGL162 W SUT1 Transcription factor of the Zn(II)2Cys6 family; positively regulates genes involved in sterol uptake under anaerobic conditions
−7.2
YBR249C ARO4 3‑deoxy‑D‑arabino‑heptulosonate‑7‑phosphate (DAHP) synthase −6.9
96 h
YEL061C CIN8 Kinesin motor protein 86.2
YJL051 W IRC8 Bud tip localized protein of unknown function 43.0
YJL148 W RPA34 RNA polymerase I subunit A34.5 28.6

Page 8 of 17Barbosa et al. Microb Cell Fact (2015) 14:124
single-culture, compared to the mixed culture, was GAP1 (8.7-fold) and AGP1 (13.4-fold), encoding general amino acid carriers with broad substrate ranges, as well as PUT4 (4.8-fold), encoding a specific proline transporter. These three genes are under the nitrogen catabolite repression (NCR) and their higher expression in the single-culture might suggest an alleviation of this repressive effective. Consistent with this idea, the NCR-repressed MEP1 and MEP2 genes, encoding the specific permeases for
ammonium assimilation, were also found to be more actively transcribed in the single-culture fermentation than in the mixed fermentation, 1.97- and 1.95- fold, respectively. Although amino acid consumption profile was not assessed in this study, high levels of ammonium were detected at 24 h in both fermentations (Table 1). In this context, our results suggest that the presence of H. guilliermondii could be restraining the efficient assimila-tion of nitrogen compounds available in grape-juice by S. cerevisiae, this being in line with the results of a pre-vious report [42]. Thus, the higher expression of these genes involved in the uptake and utilization of alterna-tive nitrogen sources in single-culture fermentation may reflect a higher yeast cells ability to scavenge for nitrogen available in fermentation medium. On another hand 17 S. cerevisiae genes were found to have an increased expres-sion in the mixed-culture (Additional file 4). Among them we found THI20 (5.6-fold), and THI21 (7.9-fold), whose expression is regulated in the dependence of thia-mine availability [43]. Thiamine has a pivotal role in fer-mentative activity as it is necessary for the biosynthesis of thiamine-pyrophosphate, a cofactor essential for the activity of pyruvate decarboxylase. The higher expression of THI20 and THI21 in the mixed-culture suggest that S. cerevisiae and H. guilliermondii might be competing for thiamine which could lead to a depletion of this vitamin in the must.
Indeed, depletion of thiamine in musts in co-cultures of S. cerevisiae with Kloeckera apiculata have been reported leading to a reduction in the fermentation rate and to higher levels of glycerol in final wines [7].
Table 2 continued
ORF Gene Function Fold change Sc/Mc
YNL129 W NRK1 Nicotinamide riboside kinase 27.6
YLR265C NEJ1 Protein involved in regulation of non homologous end joining 25.9
YOR177C MPC54 Component of the meiotic outer plaque 21.9
YOR305 W RRG7 Protein of unknown function 21.0
YLR151C PCD1 8‑oxo‑dGTP diphosphatase 21.0
YKL011C CCE1 Mitochondrial cruciform cutting endonuclease 21.0
YDR523C SPS1 Putative protein serine/threonine kinase 19.5
YBR194 W AIM4 Protein proposed to be associated with the nuclear pore complex −4.5
YOR090C PTC5 Mitochondrial type 2C protein phosphatase (PP2C) −3.6
YGR213C RTA1 Protein involved in 7‑aminocholesterol resistance −3.3
YDR434 W GPI17 Transmembrane protein −3.2
YBR111C YSA1 Nudix hydrolase family member with ADP‑ribose pyrophosphatase activity −3.2
YOL131 W Putative protein of unknown function −3.2
YER061C CEM1 Mitochondrial beta‑keto‑acyl synthase −3.1
YNR058 W BIO3 7,8‑diamino‑pelargonic acid aminotransferase (DAPA) −3.1
YCL032 W STE50 Adaptor protein for various signaling pathways −3.0
YOR353C SOG2 Key component of the RAM signaling network −3.0
Table 3 Distribution in functional categories of the genes significantly (FDR < 0.05) higher expressed in S. cerevisiae in mixed-culture (Mc) and in single-culture (Sc) fermenta-tions, irrespective of the fermentation stage
k represents the number of genes of each category that appears in our experiment. f is the total number of genes in that category and p-value (single hypothesis one-sided P value of the association between the total number of genes and the genes that are differentially expressed)
k f p‑value Category
Sc
3 7 6.94E−05 Allantoin catabolic process
2 2 1.64E−04 Urea catabolic process
11 815 1.62E−03 Transmembrane transport
Mc
3 17 8.82E−06 Biotin biosynthetic process
6 110 2.04E−05 Biosynthesis of vitamins, cofac‑tors, and prosthetic groups
5 98 1.48E−04 Cellular amino acid biosyn‑thetic process
3 29 4.54E−04 Purine nucleotide/nucleoside/nucleobase anabolism

Page 9 of 17Barbosa et al. Microb Cell Fact (2015) 14:124
Notably, our results are in line with these observations, as in addition to the lower fermentative activity noticed in mixed-culture fermentations, a higher amount of glyc-erol was produced in the mixed-fermentation (Table 1). Similar results were obtained by Milanovic et al. [30] while studying wine mixed-culture fermentations with Starmerella bombicola and S. cerevisiae. As also seen herein, mixed-culture produced more glycerol and faster than S. cerevisiae single culture. From the winemaking point of view, these effect exerted by non-Saccharomyces species, including H. guilliermondii, are very interest-ing as, although it has no direct impact on the aromatic characteristics, wines can benefit from an increased glyc-erol production to improve the mouth feel and perceived sweetness of wine.
Fermentation stage 2 (48 h)At 48 h we found S. cerevisiae 186 genes differentially expressed between the single and the mixed fermen-tations, 77 being more expressed in the single-culture fermentation, and 109 genes more expressed in the mixed-culture fermentation (Additional file 4) (Table 2). Among the set of genes found to be more expressed in the single culture we found 20 genes (p value 1.9 × 10⁻¹²) included in the so-called Fermentation Stress Response (FSR) [20]. The increased expression of these genes in the single-culture could be correlated with a higher activity of S. cerevisiae in single-culture, as discussed above. As observed after 24 h of fermentation, several genes more expressed in single-culture are known to be under the NCR response, namely those encoding proteins required for the uptake and utilization of allantoin—DAL5 (52.7-fold more expressed in the single-culture), DAL4 (5.7-fold)-; proline—PUT1 (55.3-fold), PUT4 (12.3-fold), PUT2 (6.0-fold), -and urea—DUR3 (15.4-fold), DUR1,2 (7.7-fold), as well as the regulator of nitrogen catabolite repression DAL80 (11.9-fold). Altogether these obser-vations reinforce the concept that in single-culture S. cerevisiae is sensing nitrogen limitation, this being con-firmed, at least in part, by the lower levels of ammonium available registered at 48 h in the single-culture fermen-tation, compared to the levels registered in the mixed culture fermentation (Table 1). Notably, we found that the strain of H. guilliermondii used exhibits a particu-larly high proteolytic activity, which could contribute to enrich the medium in amino acids in the mixed-culture fermentation.
The most significantly overrepresented category among the genes that were found to be more expressed in the mixed-culture fermentation is “amino acid biosynthesis” (Table 2), which is consistent with the higher ammonia levels present in the growth medium [24]. In particular, several genes involved in biosynthesis of aromatic amino
acids (five out of 12), serine (two out of 4), histidine (four out of 11), tryptophan (three out of five), lysine (two out of eight), serine (two out of four), threonine (three out of six), arginine (two out of ten) and lysine (two out of eight) were found to be up-regulated in response to the presence of H. guilliermondii. Interestingly, almost all the genes required for biosynthesis of the purine nucleo-tide monophosphate are more expressed in the mixed-culture fermentation: ADE1 (4.8-fold), ADE2 (4.3-fold), ADE4 (4.2-fold), ADE5,7 (5.2-fold), ADE12 (3.8-fold) and ADE17 (5.7-fold). It is possible that the higher expres-sion of these genes in the mixed culture could result from the higher concentration of ammonium present in the growth medium since this has been found to exert a negative effect in the uptake of adenine [44]. Indeed, previous studies also report up-regulation of ADE genes during wine fermentations performed in the presence of ammonium [45].
Higher mRNA levels of several stationary growth-phase associated genes [46] were also obtained in mixed-culture at 48 h, namely SNO1 (14.2-fold) and SNZ3 (4.0-fold). Since at this point of the fermenta-tion S. cerevisiae cells have ceased growth, both in the mixed-culture and in the single-culture fermentations (Fig. 1), the transcriptional activation of these genes is more likely to reflect the limitation of vitamins in the growth medium, as these genes were also found to be up-regulated under these conditions [47]. Also the increased expression of genes involved in biotin bio-synthesis—BIO3 (3.4-fold) and BIO5 (3.3-fold)—and in the uptake of thiamine—PHO3 (10.1-fold)—sup-ports this hypothesis, as these genes’ expression has been described to be regulated in the dependence of the concentration of these vitamins present in the growth medium.
Fermentation stage 3 (96 h)At the final fermentation stage analyzed, the expression of 214 S. cerevisiae genes was significantly altered in both fermentations, 71 genes being more expressed in mixed-culture and 143 in the single culture (Table 2) (Additional file 4). More than 38 % of the genes found to be more actively transcribed in the mixed culture (27 out of 71) have no known biological function. Among those that do have an associated biological function, we found BIO3 (3.1-fold) and BIO5 (2.5-fold) which are involved in bio-tin biosynthesis, reinforcing the suggestion that depletion of vitamins is one of the main consequences of mixed-culture fermentations. The dataset of genes found to be more expressed in the single culture at this fermentation stage was very broad in terms of physiological function, not being possible to identify significantly enriched func-tional classes.

Page 10 of 17Barbosa et al. Microb Cell Fact (2015) 14:124
Analysis of the expression of genes related to aroma compounds productionThe production of volatile compounds in the final wines was found to be significantly affected when S. cerevisiae was cultivated in the presence of H. guilliermondii [6]. While higher alcohols, acetate esters and acetaldehyde were highly detected in the wines fermented by mixed-culture of these two yeasts, the levels of ethyl esters, ethanol and H2S were more abundant in the wines that were only fermented by S. cerevisiae (Additional file 5). Transcriptome analysis of genes related to aroma pro-duction in S. cerevisiae have proven, at some extent, to be correlated with aroma compounds production during wine [22, 48, 49] and beer fermentation [50]. Given this, we have compared the expression of S. cerevisiae genes involved in the formation of different aroma compounds during single-fermentation or in the mixed fermenta-tion with H. guilliermondii and the results obtained are summarized in Figs. 5 and 6. The variation of the expres-sion of these genes along the two fermentations is also shown. The results show that, aside quantitative variation for each gene found within the different fermentations, most of them displayed the same trend in each fermenta-tion. In the following sections are detailed the differences found in the expression of genes involved in production of higher alcohols, acetate and ethyl esters and H2S.
Higher alcoholsHigher alcohols formation entails the activity of amino acid transporters, transaminases, decarboxylases and dehydrogenases. Amino acid permeases are encoded by GAP1, BAP2, BAP3, MMP1 and MUP3 genes [51], branched-chain amino acids transaminases by BAT1 and BAT2 genes, aromatic amino acids transaminases by ARO8 and ARO9 genes, decarboxylases encoded by PDC1, PDC5, PDC6, THI3 and ARO10, and dehydroge-nases by ADH1, ADH2, ADH3, ADH4, ADH5, ADH6, ADH7 and SFA1 [51, 52] (Fig. 5). Furthermore, aryl-alco-hol dehydrogenases, AAD10 and AAD14, are believed to be responsible for the degradation of aromatic alde-hydes into their corresponding higher alcohols [53]. The increased levels of higher alcohols in mixed-culture fermented wines (Additional file 5) was in line with the higher expression of the majority of the genes involved in their metabolism that was observed under these con-ditions, comparing to the expression registered in the single-culture. The higher expression of BAT1 and of genes involved in isoleucine-valine-leucine biosynthesis pathway (LEU genes and ILV genes) is also in agreement with the higher levels of isobutanol and 2-methyl-1-bu-tanol detected in the wines produced by the mixed-cul-tures (Additional file 5). Despite the expression of ARO1, ARO7, and ARO8 genes, involved in aromatic amino acid
biosynthesis, was higher in the mixed-culture fermenta-tion (Additional file 5), the amount of 2-phenylethanol produced was similar to the one produced by the single-culture (Additional file 5). These results are in agreement with those obtained by Rossouw et al. [22] who found a modest correlation between the expression levels of these three genes and 2-phenylethanol production.
Acetate estersThe formation of acetate esters results from the conden-sation of acetyl-CoA with higher alcohols by acetyl trans-ferases, encoded by the ATF1 and ATF2 genes [54–56]. AYT1 gene, encoding a transferase of unknown substrate specificity, was also found to be associated with pro-duction of acetate esters production [32], while IAH1, encoding an esterase that preferentially acts on isomyl acetate, is associated to a decrease in acetate esters pro-duction [57]. Taking all this information in considera-tion, the higher levels of isoamyl-acetate, ethyl acetate and 2-phenyethyl acetate found in the mixed-culture fermented wine were positively correlated with higher expression levels of ATF1 throughout the overall fermen-tation, and with higher expression of ATF2 and AYT1 at 48 h. Although IAH1 was more actively transcribed in the mixed-culture this did not led to a reduced produc-tion of acetate esters, consistent with the results obtained by Molina et al. [48]. Taken together these results con-firm the idea that acetate ester accumulation requires an appropriate control of these two opposed enzymatic activities in yeast [57].
Ethyl estersIn ethyl ester formation, the condensation of acyl-CoA with ethanol is catalyzed by acyl-transferases, encoded by the EEB1 and EHT1 genes and YMR210W [58]. Nevertheless, similarly to acetate esters, ethyl esters might be degraded by the IAH1-encoded esterase [55]. Accordingly, the higher expression of EEB1, EHT1 and YMR210W along with the lower expression of IAH1 in S. cerevisiae in single-culture, could explain the higher levels of ethyl-esters detected in these wines (Additional file 5).
Ethanol, acetaldehyde and acetic acidThe two final steps of alcoholic fermentation involves the decarboxylation of pyruvate, catalyzed by pyruvate decarboxylases (PDC), yielding acetaldehyde which in turn is reduced by the activity of several iso-enzymes of alcohol dehydrogenase (ADH) to ethanol. In S. cerevisiae there are three pyruvate decarboxylases, PDC1, PDC5 and PDC6 but only PDC1 and PDC5 are assumed to be active in yeast during fermentation [59]. Also five alcohol dehydrogenases are found in S. cerevisiae, ADH1-5 which

Page 11 of 17Barbosa et al. Microb Cell Fact (2015) 14:124
can in principle catalyze the reaction in both directions (i.e. acetaldehyde-to-ethanol and ethanol-to-acetalde-hyde), although with different catalytic efficiencies [60]. The cytosolic ADH1 gene product is the major enzyme responsible for converting acetaldehyde to ethanol [61]. Acetaldehyde can also be reduced to acetate by the action of aldehyde dehydrogenases encoded by ALD2-6 [62, 63]. It has been hypothesized that ALD4 and ALD6 are the
major contributors of acetate formation during wine fer-mentations [63], since ALD3 and ALD5 seem to be glu-cose-repressed [64].
Surprisingly, at the early stages of fermentation the mixed-culture produced higher levels of ethanol and at a faster rate, compared to the S. cerevisiae single-culture (Table 1). Hitherto, the ethanol levels present in the growth medium in the end of single-culture
Fig. 5 Biochemical pathways involved in flavor‑active compounds formation. a Yeast genes encoding the enzymes that catalyze each step in the different pathways are shown in italic. b Expression of genes involved in aroma compounds formation: (1) comparison of Sc vs Mc gene expression at each fermentation stage, T1 (24 h), T2 (48 h) and T3 (96 h) red higher expressed in Sc and green higher expressed in Mc—Comparative analysis; and dynamics of genes expression along each fermentation. In this case ratios were obtained using the corresponding T1 as reference—Time‑course analysis (red up‑regulated and green down‑regulated)

Page 12 of 17Barbosa et al. Microb Cell Fact (2015) 14:124
fermentation were significantly higher than those of the mixed culture wines (Additional file 6). Milanovic et al. [30] have also reported the same trend of ethanol pro-duction in mixed-culture fermentations of S. cerevisiae with Starmerella bombicola. The higher ethanol produc-tion at the earlier stages of mixed-culture fermentations is particularly intriguing since sugars consumption was higher in the single-culture fermentations. In this study, the higher expression of ADH genes in mixed-culture fermentation could be associated to such observation but do not explain the less ethanol obtained in the end of fermentation. One possible explanation could be the rerouting of the carbon flux towards glycerol leading to the decrease in ethanol yield, and increase in acetalde-hyde levels. The significantly higher levels of glycerol and acetaldehyde obtained in wines fermented by S. cer-evisiae and H. guilliermondii supports this assumption (Table 3; Additional file 6). Moreover the higher expres-sion of PDC1, PDC2 and PDC5 and the reduced expres-sion of ALD2, ALD4 and ALD6 in the mixed culture can also underlie the increased acetaldehyde concentra-tion that was obtained in these wines. Surprisingly, this decreased expression of ALD genes in the mixed culture did not led to lower levels of acetic acid in the fermented wine (Additional file 6).
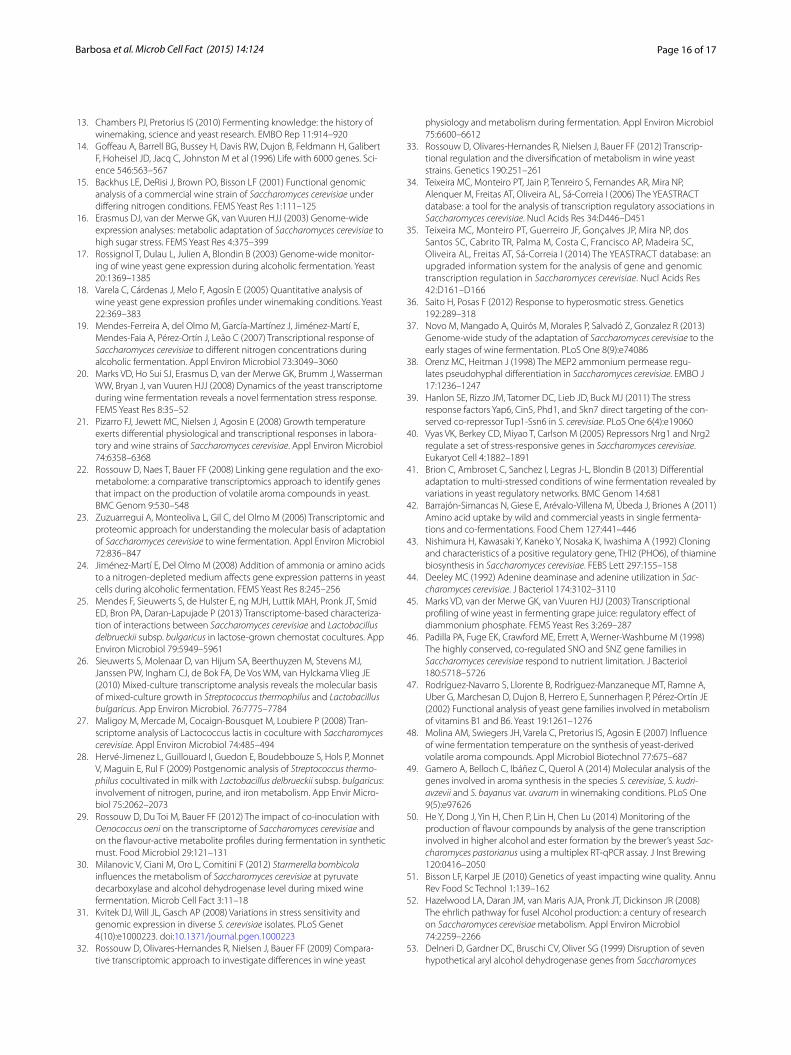
H2SH2S production during wine fermentation results largely from the enzymatic activity of the Sulfate Reduction Sequence (SRS) pathway (Fig. 6a). The effect of S. cerevi-siae cultivation in the presence of H. guilliermondii in the expression of genes involved in this pathway is shown in Fig. 6b. As seen for the other genes involved in the for-mation of other volatile compounds, aside quantitative variation for each gene found within the different fermen-tations, most of them displayed the same trend in each fermentation. It is known that MET genes expression is tightly correlated with yeast growth [65]. Indeed, most of the genes of the SRS pathway were highly expressed at the beginning of fermentation, where no H2S could be detected, being down-regulated in the later stages, coin-ciding with H2S liberation (Fig. 7). The higher expression of SRS genes in the mixed-culture fermentation does not correlate with the lower levels of H2S liberation observed. It is possible that this is the result of the higher expression of MET10, MET5, MET17 and MET2 genes, since their activity was correlated with reduced H2S production, [66–68]. On the overall it becomes evident that genes that impact H2S liberation during wine fermentation are under a tight regulatory control both during biosynthesis (MET5 and MET10) and sulfide incorporation (MET17, MET2). Also, the results obtained in this study are not in agreement with the previous suggestion [69] that
correlated high sulfide production with a higher expres-sion of genes involved in the biosynthesis of thiamine.
ConclusionsIn this study, a transcriptomics-based approach was used to examine how H. guilliermondii impacted molecular
Fig. 6 Biochemical pathways involved sulfur amino acid biosynthesis in S. cerevisiae. a Yeast genes encoding the enzymes that catalyze each step in the different pathways are shown in italic. b Expression of genes involved in hydrogen sulfide (H2S) formation: (1) comparison of Sc vs Mc gene expression at each fermentation stage, T1 (24 h), T2 (48 h) and T3 (96 h)—Comparative analysis (red higher expressed in Sc and green higher expressed in Mc) and dynamics of genes expression along each fermentation. In this case ratios were obtained using the corresponding T1 as reference—Time‑course analysis (red up‑regulated and green down‑regulated)

Page 13 of 17Barbosa et al. Microb Cell Fact (2015) 14:124
responses of a S. cerevisiae wine yeast strain during a wine fermentation. This genome-wide analysis detected a large set of S. cerevisiae genes differentially expressed as a result of the presence of H. guilliermondii in the must. Several changes that could be detected in the transcriptome of S. cerevisiae appear to result from a cellular response to changes in nutrient availability in the fermenting must attributable to H. guilliermondii metabolic activity. These observations are of paramount interest since it is well recognized the effect of nitrogen availability on yeast growth and fermentation kinetics and on the production of the major metabolites arising from sugar fermentation that establish the wine aroma profile. Indeed, the presence of H. guilliermondii dra-matically influenced the expression patterns of various flavor-active compounds associated genes, which could underlie the differences obtained on the aroma profiles of the wines. These findings raise the question whether the impact of non-Saccharomyces strains on the senso-rial profile of wines results from an additive production of aroma compounds and/or from influencing the met-abolic behavior of the fermentative yeast S. cerevisiae through modulation of the must nutritional properties.
In sum, our study underline the importance of such a global approach for the study of yeast–yeast interactions shedding light on the molecular basis of yeast dynamics during wine fermentation. This new information will be useful for the rational development of mixed-starter cul-tures o be use in winemaking industry.
MethodsYeasts strainsA strain of H. guilliermondii, previously isolated in our laboratory from a fermenting grape-juice from Douro Region [70], was selected for this study based on inter-esting oenological traits such as high ethanol tolerance and low potential for hydrogen sulfide production. S. cerevisiae UCD522 was supplied by the Enology Culture
Collection, Department of Viticulture and Enology, Uni-versity of California, Davis, USA.
Fermentation conditions and aroma compounds analysisFermentation conditions are described in Lage et al. [6]. Briefly, S. cerevisiae UCD522 and a natural H. guil-liermondii strain were used to conduct alcoholic fer-mentation, of a natural grape-juice, either in single or mixed-culture. The initial pH of grape-juice was 3.26 and the concentration of sugars and nitrogen were 23.4 Brix and 387 mg YAN/L, respectively. Starter cultures of each strain were prepared by growing the yeast over-night in 100 mL-flasks, containing 50 mL of synthetic grape-juice medium with 267 mg YAN/L, supplied as DAP [19]. The flasks were incubated at 25 °C in an orbital shaker set at 150 rpm. Each yeast species was inoculated at a cell count of 106 CFU/mL. The fermentations were conducted in 500 mL-flasks filled to 2/3 of their volume fitted with a side-arm port sealed with a rubber septum to allow anaerobic sampling, and were maintained at 20 °C in an orbital shaker set at 120 rpm. Samples were collected daily for assessing fermentation and growth parameters and, at the end of fermentations, for chemical analysis. Growth and fermentation parameters as well as the final concentration of aroma compounds in the wines can be found in Lage et al. [6].
Analytical determinationsGlucose, fructose, glycerol and ethanol extracellular lev-els in the samples collected at the time points selected for transcriptomic analysis were determined with commer-cial biochemical kits (NZY Tech, Lda).
Microarray and expression data analysisCell samples for DNA microarray analysis were obtained from both single- or mixed culture fermentations (Sc or Mc, respectively) at three different points: 24, 48 and 96 h after inoculation. Total RNA extraction was performed according to the hot phenol method. Concentration and purity was determined by spectrophotometry and integ-rity was confirmed using an Agilent 2100 Bioanalyzer with a RNA 6000 Nano Assay (Agilent Technologies, Palo Alto, CA, USA). RNA was processed for use on Affym-etrix (Santa Clara, CA, USA) GeneChip Yeast Genome 2.0 Arrays, according to the manufacturer’s GeneChip 3′ IVT Express kit user manual. Briefly, 100 ng of total RNA containing spiked in Poly-A RNA controls was used in a reverse transcription reaction (GeneChip 3′ IVT Express Kit; Affymetrix) to generate first-strand cDNA. After sec-ond-strand synthesis, double-stranded cDNA was used in a 16 h in vitro transcription (IVT) reaction to generate aRNA (GeneChip 3′ IVT Express Kit; Affymetrix). Size distribu-tion of the aRNA and fragmented aRNA, respectively, was
Fig. 7 Hydrogen sulfide (H2S) liberation in single‑culture—Sc (red) and mixed‑culture—Mc (green) fermentations. Data points are the mean from triplicate fermentations ± SD

Page 14 of 17Barbosa et al. Microb Cell Fact (2015) 14:124
assessed using an Agilent 2100 Bioanalyzer with a RNA 6000 Nano Assay. 5 µg of fragmented aRNA was used in a 100-µl hybridization cocktail containing added hybridi-zation controls. 80 µl of mixture was hybridized on arrays for 16 h at 45 °C. Standard post hybridization wash and double-stain protocols (FS450_0003; GeneChip HWS kit, Affymetrix) were used on an Affymetrix GeneChip Fluidics Station 450. Arrays were scanned on an Affymetrix Gene-Chip scanner 3000 7G.
Scanned arrays were analyzed first with Affymetrix Expression Console software for quality control. Subse-quent analysis was carried out with DNA-Chip Analyzer (dChip) 2010 (http://www.dchip.org, Wong Lab, Harvard) applying a probe set mask file excluding all probes on the array representing Schizosaccharomyces pombe tran-scripts. The arrays were normalized to a baseline array with median CEL intensity by applying an Invariant Set Normalization Method [71]. Normalized CEL intensities of the 16 arrays were used to obtain model-based gene expression indices based on a PM (Perfect Match)-only model [72]. Replicate data for the same sample type were weighted gene-wise by using inverse squared standard error as weights. All genes compared were considered to be differentially expressed if the 90 % lower confidence bound of the fold change between experiment and base-line was above 1.2. The lower confidence bound criterion means that we can be 90 % confident that the fold change is a value between the lower confidence bound and a varia-ble upper confidence bound. Li and Hung Wong [72] have shown that the lower confidence bound is a conservative estimate of the fold change and therefore more reliable as a ranking statistic for changes in gene expression.
As H. guilliermondii RNA was present in mixed-culture RNA, there was a potential warning within this experiment related with the possible cross-hybridization of H. guilliermondii RNA on S. cerevisiae arrays which was considered. In this line, a total of 1.5 µg of H. guilli-ermondii genomic DNA was labelled using the Bioprime DNA labelling System (Invitrogen) following a strategy for genomic DNA hybridizations to GeneChips devel-oped by Hammond et al. [73]. Cleanup was performed using MinElute PCR Purification kit (Qiagen) and qual-ity was checked on an Agilent 2100 Bioanalyser using a DNA 1000 assay. Five micrograms was analyzed on Affy-metrix GeneChip Yeast Genome 2.0 Arrays following the protocol described above for RNA samples. Genes whose signal was above the cut-off were designated cross-hybridizing genes, and were later removed from the anal-ysis (223 ORFs).
Statistical and bioinformatic analysisTo assess the changes in S. cerevisiae transcriptome in the response to the presence of H. guilliermondii throughout
the fermentation, different analysis were performed. The transcriptomic data were first analyzed using a princi-pal component analysis, PCA method. PCA was applied as an exploratory data analysis method to visualize dif-ferences between the diverse data sets. Also EPCLUST online software (http://ep.ebi.ac.uk/EP/EPCLUST/) was used for cluster analysis by the K-means method. For the identification of differentially expressed genes, the data were analyzed using Rank Product (RP) [74], as imple-mented in the MeV software [75]. RP, a nonparametric two-class unpaired method with a false discovery rate (FDR) multiple testing correction (P < 0.05, 5 % FDR) was used to identify differentially expressed genes between single- and mixed-culture fermentations, either irre-spective of fermentation stage or at each fermentation stage separately. Comparisons by RP analysis were done using single-culture fermentations as one experimen-tal group and mixed-culture fermentations as another experimental group, in order to identify specific genes associated with the response of S. cerevisiae to the pres-ence of H. guilliermondii. The gene lists were analyzed for enrichment of functional categories using the FunSpec interpreter [76], available online at http://funspec.med.utoronto.ca.
Microarray accession numbersThe microarrays hybridization data are available at the Gene Expression Omnibus (http://www.ncbi.nlm.nih.gov/geo) under accession number GSE66521.
Validation of microarray data by qRT‑PCR assaysTo evaluate the overall quality of the microarray data we employed quantitative real-time (kinetic) PCR to amplify cDNA products reversely transcribed from mRNA (RT) (real time RT-PCR). We analyzed the expression of some genes, THI20, DAL80, EEB1, ARO8, MEP2, BAT1, MET5 and MET10, using the same RNA from the original microarray experiments. In the Additional file 7 are depicted the sequences of the primers used in this analysis. Total RNA (5 µg) was reverse transcribed using SuperScript III Platinum (Invitrogen). 1 µL of the reverse-transcribed RNA was used as template to amplify the genes, using specific primers. Reaction mixtures con-tained 12.5 μL of SYBR Green supermix (Platinum SYBR Green qPCR Supermix UGD with Rox, Invitrogen), 0.8 μL each of the forward and reverse primers, 2 μL cDNA and sterile nuclease free H2O to a total volume of 25 μL.
Real-time qRT-PCR reaction conditions were 5 min at 95 °C for initial denaturation and activation of the DNA polymerase, followed by 50 cycles of denaturation at 95 °C for 30 s, annealing at the appropriate tempera-ture specific for each primer pair for 30 s and extension
Page 15 of 17Barbosa et al. Microb Cell Fact (2015) 14:124
at 60 °C for 30 s. The StepOne software (version 2.2.2, Applied Biosystems) was programmed to collect real time fluorescence data during the annealing and exten-sion steps. Meltcurve analysis was performed after every qRT-PCR run to verify the specificity of the primers and to detect the presence (if any) of primer dimers. No-tem-plate controls were included for each primer pair. After RT-PCR, standard curves were plotted using the Ste-pOne software (version 2.2.2, Applied Biosystems). The standard curve for each gene was generated from serial dilutions of cDNA [77]. The correlation coefficients and the amplification efficiency (E) of each reaction were then calculated from the slope of each trend line equation, according to the equation E = 10(−1/slope). The expres-sion of each gene determined by real-time qRT-PCR was normalized to the expression of the house-keeping gene, ACT1 (encoding the structural protein actin). Rela-tive quantification of the expression of each gene at each sampling point (24, 48 and 96 h) for S. cerevisiae in sin-gle- or in mixed-culture was determined by the ΔΔCt method [78]. The qRT-PCR results correlated well with those obtained from the microarrays (Additional file 7). Additionally, qRT-PCR demonstrated that the expression measured in mixed-culture fermentations is specifically associated with S. cerevisiae by the lack of amplification observed in H. guilliermondii cDNA in single culture fermentation.
Authors’ contributionsAM‑Ferreira and AM‑Faia conceived and designed the experiments: CB and PL performed the fermentation experiments; CB, AM‑Faia, NPM and AM‑Ferreira
Additional files
Additional file 1: Association between S. cerevisiae genes whose expres‑sion changed along the single or mixed wine fermentations with their documented regulators.
Additional file 2: K‑means clustering of differentially expressed genes during single‑culture fermentations. Genes that showed at least two‑fold altered expression in two or more consecutive time points during the single‑culture fermentation were subjected to K‑means clustering and grouped in ten clusters.
Additional file 3: K‑means clustering of differentially expressed genes during mixed‑culture fermentations. Genes that showed at least two‑fold altered expression in two or more consecutive time points during the mixed‑culture fermentation were subjected to K‑means clustering and grouped in ten clusters.
Additional file 4: List of genes significantly affected (FDR<0.05) between S. cerevisiae in single‑ and mixed‑culture.
Additional file 5: Concentration of aroma compounds in the wines obtained with single‑cultures of Saccharomyces cerevisiae UCD522 and H. guilliermondii or in consortium.
Additional file 6: Overview of growth and fermentation parameters of wines obtained with single‑cultures of Saccharomyces cerevisiae UCD522 and H. guilliermondii or in consortium.
Additional file 7: Validation of microarray data using qRT‑PCR.
analyzed and discussed the data; CB, NPM and AM‑Ferreira wrote the paper: All authors read and approved the final manuscript.
Author details1 Escola de Ciências da Vida e Ambiente, Universidade de Trás‑os‑Montes e Alto Douro, Vila Real, Portugal. 2 BioISI‑Biosystems and Integrative Sciences Institute, Campo Grande, Lisbon, Portugal. 3 iBB‑Institute for Bioengineering and Biosciences, Avenida Rovisco Pais, 1049‑001 Lisbon, Portugal. 4 Depart‑ment of Bioengineering, Instituto Superior Técnico, Avenida Rovisco Pais, 1049‑001 Lisbon, Portugal.
AcknowledgementsWe are deeply grateful to Dr José Enrique Pérez‑Ortín for critical reading of the manuscript. The research presented in this paper was financially sup‑ported by FEDER through COMPETE—FCOMP‑01‑0124‑FEDER‑014043(PTDC/AGR‑ALI/111224/2009), PTDC/AGR‑TEC/3315/2014, Project ENOEXEL‑FROM VINEYARD TO WINE: TARGETING GRAPE AND WINE EXCELLENCY‑NORTE‑07‑0124‑FEDER‑000032, financed by the North Portugal Regional Operational Programme (ON.2—O Novo Norte), under the National Strategic Reference Framework (QREN), through the European Regional Development Fund (FEDER), as well as by National Funds (PIDDAC) through the Portuguese Foun‑dation for Science and Technology (FCT/MEC). C.B. was a recipient of a Ph.D. granted by FCT (SFRH/BD/61881/2009).
Compliance with ethical guidelines
Competing interestsThe authors declare that they have no competing interests.
Received: 1 June 2015 Accepted: 14 August 2015
References 1. Bely M, Stoeckle P, Masneuf‑Pomarède I, Dubourdieu D (2008) Impact of
mixed Torulaspora delbrueckii–Saccharomyces cerevisiae culture on high‑sugar fermentation. Int J Food Microbiol 122:312–320
2. Ciani M, Comitini F, Manaus I, Domizio P (2010) Controlled mixed culture fermentation: a new perspective on the use of non‑Saccharomyces yeasts in winemaking. FEMS Yeast Res 10:123–133
3. Jolly N, Augustyn O, Pretorius IS (2006) The role and use of non‑Saccharo-myces yeasts in wine production. S Afr J Enol Vitic. 27:15–39
4. Mora J, Barbas JI, Mulet A (1990) Growth of yeast species during the fermentation of musts inoculated with Kluyveromyces thermotolerans and Saccharomyces cerevisiae. Am J Enol Vitic 39:156–159
5. Soden A, Francis IL, Oakey H, Henschke PA (2000) Effects of co‑fermenta‑tion with Candida stellata and S. cerevisiae on the aroma and composition of Chardonnay wine. Aust J Grape Wine Res 6:21–30
6. Lage P, Barbosa C, Mateus B, Vasconcelos I, Mendes‑Faia A, Mendes‑Ferreira A (2014) H. guilliermondii impacts growth kinetics and metabolic activity of S. cerevisiae: the role of initial nitrogen concentration. Int J Food Microbiol 172:62–69
7. Bataillon M, Rico A, Sablayrolles JM, Salmon JM, Barre P (1996) Early thiamine assimilation by yeasts under enological conditions: impact on alcoholic fermentation kinetics. J Biosci Bioeng 82:145–150
8. Domizio P, Romani C, Lencioni L, Comitini F, Gobbi M, Mannazzu I, Ciani M (2011) Outlining a future for non‑Saccharomyces yeasts: selection of puta‑tive spoilage wine strains to be used in association with Saccharomyces cerevisiae for grape juice fermentation. Int J Food Microbiol 147:170–180
9. Nissen P, Arneborg N (2003) Characterization of early deaths of non‑Saccharomyces yeasts in mixed cultures with Saccharomyces cerevisiae. Arch Microbiol 180:257–263
10. Bisson LF (1999) Stuck and sluggish fermentations. Am J Enol Vitic 50:107–119 11. Fleet GH, Heard GM (1993) Yeasts—growth during fermentation. In: Fleet
GH (ed) Wine microbiology and Biotechnology. Harwood Academic Publishers, pp 27–54
12. Medina K, Boid E, Dellacassa E, Carrau F (2012) Growth of non‑Saccha-romyces yeasts affects nutrient availability for Saccharomyces cerevisiae during wine fermentation. Int J Food Microbiol 147:245–250
Page 16 of 17Barbosa et al. Microb Cell Fact (2015) 14:124
13. Chambers PJ, Pretorius IS (2010) Fermenting knowledge: the history of winemaking, science and yeast research. EMBO Rep 11:914–920
14. Goffeau A, Barrell BG, Bussey H, Davis RW, Dujon B, Feldmann H, Galibert F, Hoheisel JD, Jacq C, Johnston M et al (1996) Life with 6000 genes. Sci‑ence 546:563–567
15. Backhus LE, DeRisi J, Brown PO, Bisson LF (2001) Functional genomic analysis of a commercial wine strain of Saccharomyces cerevisiae under differing nitrogen conditions. FEMS Yeast Res 1:111–125
16. Erasmus DJ, van der Merwe GK, van Vuuren HJJ (2003) Genome‑wide expression analyses: metabolic adaptation of Saccharomyces cerevisiae to high sugar stress. FEMS Yeast Res 4:375–399
17. Rossignol T, Dulau L, Julien A, Blondin B (2003) Genome‑wide monitor‑ing of wine yeast gene expression during alcoholic fermentation. Yeast 20:1369–1385
18. Varela C, Cárdenas J, Melo F, Agosín E (2005) Quantitative analysis of wine yeast gene expression profiles under winemaking conditions. Yeast 22:369–383
19. Mendes‑Ferreira A, del Olmo M, García‑Martínez J, Jiménez‑Martí E, Mendes‑Faia A, Pérez‑Ortín J, Leão C (2007) Transcriptional response of Saccharomyces cerevisiae to different nitrogen concentrations during alcoholic fermentation. Appl Environ Microbiol 73:3049–3060
20. Marks VD, Ho Sui SJ, Erasmus D, van der Merwe GK, Brumm J, Wasserman WW, Bryan J, van Vuuren HJJ (2008) Dynamics of the yeast transcriptome during wine fermentation reveals a novel fermentation stress response. FEMS Yeast Res 8:35–52
21. Pizarro FJ, Jewett MC, Nielsen J, Agosin E (2008) Growth temperature exerts differential physiological and transcriptional responses in labora‑tory and wine strains of Saccharomyces cerevisiae. Appl Environ Microbiol 74:6358–6368
22. Rossouw D, Naes T, Bauer FF (2008) Linking gene regulation and the exo‑metabolome: a comparative transcriptomics approach to identify genes that impact on the production of volatile aroma compounds in yeast. BMC Genom 9:530–548
23. Zuzuarregui A, Monteoliva L, Gil C, del Olmo M (2006) Transcriptomic and proteomic approach for understanding the molecular basis of adaptation of Saccharomyces cerevisiae to wine fermentation. Appl Environ Microbiol 72:836–847
24. Jiménez‑Martí E, Del Olmo M (2008) Addition of ammonia or amino acids to a nitrogen‑depleted medium affects gene expression patterns in yeast cells during alcoholic fermentation. FEMS Yeast Res 8:245–256
25. Mendes F, Sieuwerts S, de Hulster E, ng MJH, Luttik MAH, Pronk JT, Smid ED, Bron PA, Daran‑Lapujade P (2013) Transcriptome‑based characteriza‑tion of interactions between Saccharomyces cerevisiae and Lactobacillus delbrueckii subsp. bulgaricus in lactose‑grown chemostat cocultures. App Environ Microbiol 79:5949–5961
26. Sieuwerts S, Molenaar D, van Hijum SA, Beerthuyzen M, Stevens MJ, Janssen PW, Ingham CJ, de Bok FA, De Vos WM, van Hylckama Vlieg JE (2010) Mixed‑culture transcriptome analysis reveals the molecular basis of mixed‑culture growth in Streptococcus thermophilus and Lactobacillus bulgaricus. App Environ Microbiol. 76:7775–7784
27. Maligoy M, Mercade M, Cocaign‑Bousquet M, Loubiere P (2008) Tran‑scriptome analysis of Lactococcus lactis in coculture with Saccharomyces cerevisiae. Appl Environ Microbiol 74:485–494
28. Hervé‑Jimenez L, Guillouard I, Guedon E, Boudebbouze S, Hols P, Monnet V, Maguin E, Rul F (2009) Postgenomic analysis of Streptococcus thermo-philus cocultivated in milk with Lactobacillus delbrueckii subsp. bulgaricus: involvement of nitrogen, purine, and iron metabolism. App Envir Micro‑biol 75:2062–2073
29. Rossouw D, Du Toi M, Bauer FF (2012) The impact of co‑inoculation with Oenococcus oeni on the transcriptome of Saccharomyces cerevisiae and on the flavour‑active metabolite profiles during fermentation in synthetic must. Food Microbiol 29:121–131
30. Milanovic V, Ciani M, Oro L, Comitini F (2012) Starmerella bombicola influences the metabolism of Saccharomyces cerevisiae at pyruvate decarboxylase and alcohol dehydrogenase level during mixed wine fermentation. Microb Cell Fact 3:11–18
31. Kvitek DJ, Will JL, Gasch AP (2008) Variations in stress sensitivity and genomic expression in diverse S. cerevisiae isolates. PLoS Genet 4(10):e1000223. doi:10.1371/journal.pgen.1000223
32. Rossouw D, Olivares‑Hernandes R, Nielsen J, Bauer FF (2009) Compara‑tive transcriptomic approach to investigate differences in wine yeast
physiology and metabolism during fermentation. Appl Environ Microbiol 75:6600–6612
33. Rossouw D, Olivares‑Hernandes R, Nielsen J, Bauer FF (2012) Transcrip‑tional regulation and the diversification of metabolism in wine yeast strains. Genetics 190:251–261
34. Teixeira MC, Monteiro PT, Jain P, Tenreiro S, Fernandes AR, Mira NP, Alenquer M, Freitas AT, Oliveira AL, Sá‑Correia I (2006) The YEASTRACT database: a tool for the analysis of transcription regulatory associations in Saccharomyces cerevisiae. Nucl Acids Res 34:D446–D451
35. Teixeira MC, Monteiro PT, Guerreiro JF, Gonçalves JP, Mira NP, dos Santos SC, Cabrito TR, Palma M, Costa C, Francisco AP, Madeira SC, Oliveira AL, Freitas AT, Sá‑Correia I (2014) The YEASTRACT database: an upgraded information system for the analysis of gene and genomic transcription regulation in Saccharomyces cerevisiae. Nucl Acids Res 42:D161–D166
36. Saito H, Posas F (2012) Response to hyperosmotic stress. Genetics 192:289–318
37. Novo M, Mangado A, Quirós M, Morales P, Salvadó Z, Gonzalez R (2013) Genome‑wide study of the adaptation of Saccharomyces cerevisiae to the early stages of wine fermentation. PLoS One 8(9):e74086
38. Orenz MC, Heitman J (1998) The MEP2 ammonium permease regu‑lates pseudohyphal differentiation in Saccharomyces cerevisiae. EMBO J 17:1236–1247
39. Hanlon SE, Rizzo JM, Tatomer DC, Lieb JD, Buck MJ (2011) The stress response factors Yap6, Cin5, Phd1, and Skn7 direct targeting of the con‑served co‑repressor Tup1‑Ssn6 in S. cerevisiae. PLoS One 6(4):e19060
40. Vyas VK, Berkey CD, Miyao T, Carlson M (2005) Repressors Nrg1 and Nrg2 regulate a set of stress‑responsive genes in Saccharomyces cerevisiae. Eukaryot Cell 4:1882–1891
41. Brion C, Ambroset C, Sanchez I, Legras J‑L, Blondin B (2013) Differential adaptation to multi‑stressed conditions of wine fermentation revealed by variations in yeast regulatory networks. BMC Genom 14:681
42. Barrajón‑Simancas N, Giese E, Arévalo‑Villena M, Úbeda J, Briones A (2011) Amino acid uptake by wild and commercial yeasts in single fermenta‑tions and co‑fermentations. Food Chem 127:441–446
43. Nishimura H, Kawasaki Y, Kaneko Y, Nosaka K, Iwashima A (1992) Cloning and characteristics of a positive regulatory gene, THI2 (PHO6), of thiamine biosynthesis in Saccharomyces cerevisiae. FEBS Lett 297:155–158
44. Deeley MC (1992) Adenine deaminase and adenine utilization in Sac-charomyces cerevisiae. J Bacteriol 174:3102–3110
45. Marks VD, van der Merwe GK, van Vuuren HJJ (2003) Transcriptional profiling of wine yeast in fermenting grape juice: regulatory effect of diammonium phosphate. FEMS Yeast Res 3:269–287
46. Padilla PA, Fuge EK, Crawford ME, Errett A, Werner‑Washburne M (1998) The highly conserved, co‑regulated SNO and SNZ gene families in Saccharomyces cerevisiae respond to nutrient limitation. J Bacteriol 180:5718–5726
47. Rodríguez‑Navarro S, Llorente B, Rodríguez‑Manzaneque MT, Ramne A, Uber G, Marchesan D, Dujon B, Herrero E, Sunnerhagen P, Pérez‑Ortín JE (2002) Functional analysis of yeast gene families involved in metabolism of vitamins B1 and B6. Yeast 19:1261–1276
48. Molina AM, Swiegers JH, Varela C, Pretorius IS, Agosin E (2007) Influence of wine fermentation temperature on the synthesis of yeast‑derived volatile aroma compounds. Appl Microbiol Biotechnol 77:675–687
49. Gamero A, Belloch C, Ibáñez C, Querol A (2014) Molecular analysis of the genes involved in aroma synthesis in the species S. cerevisiae, S. kudri-avzevii and S. bayanus var. uvarum in winemaking conditions. PLoS One 9(5):e97626
50. He Y, Dong J, Yin H, Chen P, Lin H, Chen Lu (2014) Monitoring of the production of flavour compounds by analysis of the gene transcription involved in higher alcohol and ester formation by the brewer’s yeast Sac-charomyces pastorianus using a multiplex RT‑qPCR assay. J Inst Brewing 120:0416–2050
51. Bisson LF, Karpel JE (2010) Genetics of yeast impacting wine quality. Annu Rev Food Sc Technol 1:139–162
52. Hazelwood LA, Daran JM, van Maris AJA, Pronk JT, Dickinson JR (2008) The ehrlich pathway for fusel Alcohol production: a century of research on Saccharomyces cerevisiae metabolism. Appl Environ Microbiol 74:2259–2266
53. Delneri D, Gardner DC, Bruschi CV, Oliver SG (1999) Disruption of seven hypothetical aryl alcohol dehydrogenase genes from Saccharomyces

Page 17 of 17Barbosa et al. Microb Cell Fact (2015) 14:124
cerevisiae and construction of a multiple knock‑out strain. Yeast 15:1681–1689
54. Lilly M, Lambrechts MG, Pretorius IS (2000) Effect of increased yeast alcohol acetyltransferase activity on flavor profiles of wine and distillates. Appl Environ Microbiol 66:744–753
55. Lilly M, Bauer FF, Lambrechts MG, Swiegers JH, Cozzolino D, Pretorius IS (2006) The effect of increased yeast alcohol acetyltransferase and esterase activity on the flavour profiles of wine and distillates. Yeast 23:641–659
56. Verstrepen KJ, Derdelinckx G, Dufour JP, Winderickx J, Thevelein JM, Preto‑rius IS, Delvaux FR (2003) Flavour‑active esters: adding fruitiness to beer. J Biosci Bioeng 96:110–118
57. Fukuda K, Yamamoto N, Kiyokawa Y et al (1998) Balance of activities of alcohol acetyltransferase and esterase in Saccharomyces cerevisiae is important for production of isoamyl acetate. Appl Environ Microbiol 64:4076–4078
58. Saerens SMG, Delvaux F, Verstrepen KJ, Van Dijck P, Thevelein JM, Delvaux FR (2008) Parameters affecting ethyl ester production by Saccharomyces cerevisiae during fermentation. Appl Environ Microbiol 74:454–461
59. Pronk JT, Steensma HY, Van Dijken J (1996) Pyruvate metabolism in Sac-charomyces cerevisiae. Yeast 12:1607–1633
60. Piskur J, Rozpedowska E, Polakova S, Merico A, Compagno C (2006) How did Saccharomyces evolve to become a good brewer? Trends Genet 22:183–186
61. Leskovac V, Trivić S, Peričin D (2002) The three zinc‑containing alcohol dehydrogenases from baker’s yeast Saccharomyces cerevisiae. FEMS Yeast Res 2:481–494
62. Navarro‑Aviño JP, Prasad R, Miralles VJ, Benito RM, Serrano R (1999) A proposal for nomenclature of aldehyde dehydrogenases in Saccharomy-ces cerevisiae and characterization of the stress‑inducible ALD2 and ALD3 genes. Yeast 15:829–842
63. Remize F, Andrieu E, Dequin S (2000) Engineering of the pyruvate dehy‑drogenase bypass in Saccharomyces cerevisiae: role of the cytosolic Mg2+ and mitochondrial K+ acetaldehyde dehydrogenase Ald6p and Ald4p in acetate formation during alcoholic fermentation. Appl Environ Microbiol 66:3151
64. Saint‑Prix F, Bönquist L, Dequin S (2004) Functional analysis of the ALD gene family of Saccharomyces cerevisiae during anaerobic growth on glucose: the NADP+‑dependent Ald6p and Ald5p isoforms play a major role in acetate formation. Microbiol 150:2209–2220
65. Patton EE, Peyraud C, Rouillon A, Surdin‑Kerjan Y, Tyers M, Thomas D (2000) SCFMet30‑mediated control of the transcriptional activator Met4 is required for the G1–S transition. EMBO J 19:1613–1624. doi:10.1093/emboj/19.7.1613
66. Cordente AG, Heinrich A, Pretorius IS, Swiegers JH (2009) Isolation of sulfite reductase variants of a commercial wine yeast with significantly reduced hydrogen sulfide production. FEMS Yeast Res 9:446–459
67. Spiropoulos A, Bisson LF (2000) MET17 and hydrogen sulfide formation in Saccharomyces cerevisiae. Appl Environ Microbiol 66:4421–4426
68. Huang C, Roncoroni M, Gardner RC (2014) MET2 affects production of hydrogen sulfide during wine fermentation. Appl Microbiol Biotechnol 98:7125–7135
69. Bartra E, Casado M, Carro D, Campamà C, Piña B (2010) Differential expression of thiamine biosynthetic genes in yeast strains with high and low production of hydrogen sulfide during wine fermentation. J Appl Microbiol 109:272–281
70. Neto L, Mendes‑Ferreira A (2005) Pesquisa de atividade Sulfito Redutase em Leveduras de origem enológica. Ciência e Tecnologia dos Alimentos Campinas 25:275–278
71. Li C, Wong WH (2001) Model‑based analysis of oligonucleotide arrays: expression index computation and outlier detection. Proc Natl Acad Sci USA 98:31–36
72. Li C, Wong WH (2001) Model‑based analysis of oligonucleotide arrays: model validation, design issues and standard error application. Genome Biol. 2(8):0032
73. Hammond JP, Broadley MR, Craigon DJ, Higgins J, Emmerson Z, Townsend H, White PJ, May ST (2005) Using genomic DNA‑based probe‑selection to improve the sensitivity of high‑density oligonucleotide arrays when applied to heterologous species. Plant Methods 1:10
74. Breitling R, Armengaud P, Amtmann A, Herzyk P (2004) Rank products: a simple, yet powerful, new method to detect differentially regulated genes in replicated microarray experiments. FEBS Lett 573:83–92
75. Saeed AI, Bhagabati NK, Braisted JC, Liang W, Sharov V, Howe EA, Li J, Thiagarajan M, White JA, Quackenbush J (2006) TM4 microarray software suite. Methods Enzymol. 411:134–193
76. Robinson MD, Grigull J, Mohammad N, Hughes TR (2002) FunSpec: a web‑based cluster interpreter for yeast. BMC Bioinformatics 3:35
77. Pfaffl MW (2001) A new mathematical model for relative quantification in real‑time RT PCR. Nucleic Acids Res 29(9):e45
78. Livak KJ, Schmittgen TD (2001) Analysis of relative gene ex‑ pression data using real‑time quantitative PCR and the 2−ΔΔCt method. Methods 25:402–408
Submit your next manuscript to BioMed Centraland take full advantage of:
• Convenient online submission
• Thorough peer review
• No space constraints or color figure charges
• Immediate publication on acceptance
• Inclusion in PubMed, CAS, Scopus and Google Scholar
• Research which is freely available for redistribution
Submit your manuscript at www.biomedcentral.com/submit