open city: london after brexit open city: london after ... · open city: london after brexit has...
TRANSCRIPT

Richard Brown Nicolas Bosetti
OPE
N C
ITY:
LON
DO
N A
FTER
BR
EXIT
OPEN
CITY: LO
ND
ON
AFTER B
REX
IT Richard B
rown and N
icolas Bosetti

Published by Centre for London, July 2017
OPEN CITY:LONDON AFTER BREXITRichard Brown and Nicolas Bosetti

Open Access. Some rights reserved.
As the publisher of this work, Centre for London wants to encourage the circulation of our work as widely as possible while retaining the copyright. We therefore have an open access policy which enables anyone to access our content online without charge. Anyone can download, save, perform or distribute this work in any format, including translation, without written permission. This is subject to the terms of the Centre for London licence.
Its main conditions are:
· Centre for London and the author(s) are credited · This summary and the address www.centreforlondon.org are displayed · The text is not altered and is used in full · The work is not resold · A copy of the work or link to its use online is sent to Centre for London.
You are welcome to ask for permission to use this work for purposes other than those covered by the licence. Centre for London gratefully acknowledges the work of Creative Commons in inspiring our approach to copyright.
To find out more go to www.creativecommons.org
Published by: Centre for London 2017 © Centre for London. Some rights reserved. T: 020 3757 5555 [email protected] www.centreforlondon.org Company Number: 8414909 Charity Number: 1151435
Typeset by Soapbox, www.soapbox.co.uk

Centre for London is a politically independent, not‑for‑profit think tank focused on the big challenges facing London. Through its research and events, the Centre acts as a critical friend to London’s leaders and policymakers, promotes a wider understanding of the challenges facing London, and develops long‑term, rigorous and radical policy solutions for the capital. It looks for support from a mixture of private, voluntary and public sector funders and works collaboratively with its supporters, drawing on their experience and expertise. Launched in 2011, the Centre is quickly developing relationships with sister organisations across the globe. Find out more about our work at www.centreforlondon.org.
Centre for London is a registered charity and a company limited by guarantee. Company Number: 8414909. Charity Number: 1151435.


v
PARTNERSHIP
Open City: London after Brexit has been producedin partnership with and funded by the Institute for Policy Research at the University of Bath. The report includes and refers to additional research contributions authored by Dr Catherine Barnaby (Commercial Research Associate, Bath Institute for Mathematical Innovation), Professor Nick Pearce (Director, Institute for Policy Research), Dr Rita Griffiths (Research Programme Lead, Institute for Policy Research) and Marsha Wood (Research Assistant, Institute for Policy Research).

vii
ABOUT THE AUTHORS
Richard BrownRichard Brown is Research Director at Centre for London. He was previously Strategy Director at London Legacy Development Corporation, Manager of the Mayor of London’s Architecture and Urbanism Unit, and an urban regeneration researcher at the Audit Commission.
Nicolas BosettiNicolas Bosetti is a Senior Researcher at Centre for London. He has been working across the Centre’s research programme since he joined in March 2015. Nicolas has an MSc in Urban Policy from the London School of Economics and Sciences Po, Paris.


ix
ACKNOWLEDGEMENTS
We are grateful to our advisory group for their expert advice and feedback: James Ashton (Business writer and consultant), Van DuBose (Institute for Policy Research Advisory Board Member), Ben Johnson (Senior Advisor, Mayor of London), Charles Leadbeater (Independent writer and advisor), Professor Nick Pearce (Director, Institute for Policy Research), Professor Jonathan Portes (King’s College London), Pat Saini (Head of Immigration, Penningtons Manches LLP), Professor Tony Travers (Director, Greater London Group, LSE) and Matthew Whittaker (Chief Economist, Resolution Foundation).
We would also like to thank Des Gunewardena (CEO, D&D London), Julia Onslow‑Cole (Partner, Global Head of Immigration and Legal Markets Leader, PwC LLP), David Slater (Director of International Trade and Investment, London & Partners) and Margarethe Theseira (independent consultant) for their advice on improving the draft.
Our thanks also go to our colleagues at Centre for London, particularly to Ben Rogers, Silviya Barrett and Tom Colthorpe. The views in this report are nevertheless solely those of Centre for London and the Institute for Policy Research – and all errors and omissions remain our own.
Open City: London after Brexit has been produced in partnership with and funded by the Institute for Policy Research at the University of Bath, on the basis of a generous donation from Eva and Van DuBose.


EXECUTIVE SUMMARY 4
INTRODUCTION 10
PART 1 A BETTER BREXIT 14
1. GLOBAL CITY STRENGTHS AND STRAINS 16
2. TRADE AND TALENT – THE IMPACT OF BREXIT 24
3. KEEPING LONDON OPEN 36

PART 2 A BETTER LONDON 52
4. HOUSING AND INFRASTRUCTURE 54
5. FISCAL DEVOLUTION AND REFORM 62
6. CONCLUSIONS 76


EXECUTIVE SUMMARY
5
Brexit is the biggest event in London’s history for a generation, perhaps since the Second World War. It presents big challenges to the capital – challenges that are different both in degree and in character from those posed for the rest of the UK. Addressing these challenges – and the opportunities that Brexit could offer – in the upcoming negotiations, and in domestic devolution, will be essential to ensuring a prosperous future for the UK.
In the short term, London needs continuing access to domestic, European and global talent, and the terms of trade that enable prosperity – a better Brexit. In the longer term, to maintain competitiveness from outside the EU, London needs new powers over taxation to meet its housing and infrastructure needs, and to better manage its property market – a better city.
Devolved skills and regionally managed migration to retain talentThe capital is much more reliant on European workers than other areas of the country, with EU citizens working at all skills levels and in all sectors. There are twice as many EU workers in London’s workforce compared to the rest of the UK, and proportions of students are similar. Losing access to talent from across the EU would drain London’s businesses and its universities, but could also impair London’s character – as an open and welcoming city.
The vote to leave the EU makes it more important than ever that we ensure Londoners have the skills they need to thrive. Unemployment rates are as low as they have ever been, but more could be done to help Londoners into work. High childcare costs mean that London has lower rates of employment for women with children, while national apprenticeship and skills programmes are not offering Londoners the skills they need for London’s growth sectors.
6
• The Government should commit to devolving responsibility for early years education and childcare to London and other cities, and give them greater control over apprenticeships and other skills funding.
But London needs to remain open to international talent too. This includes high‑skilled professionals in medicine, law, and other highly specialised sectors, but it doesn’t end there. London also relies on the mid‑skilled workers who keep the city’s bars, cafes, building sites and care homes running, and on the young people who visit to learn languages and skills and start new enterprises. London and other UK regions need to be able to take control of their own labour needs, rather than having blunt nationwide quotas imposed on them.
• The Government should introduce a regionally‑managed migration system, with different regions able to define their skills needs and to agree work permit quotas with Government.
• In London’s case, one‑year ‘City Maker Visas’ would allow European citizens to visit the city to look for employment or start‑up opportunities, with fast‑track work permits for those who are successful.
• The Government should also extend working holiday visas to the EU, allowing easy access for young people for two years, with fast‑tracked work permit applications permitted at the end of that period.
• Open access to higher education across the EU should be maintained, with student numbers removed from net migration targets, and a new post‑study visa should be introduced in London to enable graduates to stay on to work.

7
Clarity on transitional arrangements for tradeLondon already trades globally as well as within the EU, but its growing service sector exports are traded within EU regulatory frameworks. International banks can trade across the EU from a London base, professional services firms rely on mutual recognition of qualifications and jurisdiction, UK airlines can fly within Europe and between Europe and the USA by using EU aviation agreements, while EU regulations allow tech firms to share data over borders.
If the UK leaves the European Single Market, it is in the interests of both the UK and other EU countries to negotiate trade agreements that minimise the impact of regulatory barriers on trade in these service sectors, as well as reducing tariff barriers to trade in goods. The problem is urgent. If the UK leaves without a deal in March 2019, many businesses exporting services within the EU will find it very hard to do so from London.
Given the challenge of securing a comprehensive deal by that stage, transitional arrangements will be needed. These should be confirmed as quickly as possible, rather than left till the last minute. If the issue is left unresolved, the danger is that employers will seek to manage the risks associated with a potential ‘hard Brexit’ by moving operations out of London and other UK cities. We recommend that interim membership of the European Free Trade Association (EFTA) is seriously considered: this would enable continuing access to most elements of the Single Market through the European Economic Area, though this would also require interim continuation of freedom of movement.
• The Government should confirm that regulatory frameworks for services will be prioritised in discussions of future trade relationships with the EU.
8
• The Government should work with the EU to clarify transitional trade arrangements as soon as possible after the election, with EFTA membership representing one ‘ready‑packaged’ option.
Devolved taxes to tackle London’s housing and infrastructure crisesSince London’s population began to recover in the 1990s, house prices and strains of infrastructure have soared. These problems are not new, nor are they caused by Brexit, but the UK’s scheduled departure from the EU should sharpen our focus. London can no longer afford to be complacent about its offer, to its residents and to visitors alike.
One fundamental issue for London’s housing market is the tax system. Domestic property taxes – council tax and stamp duty land tax – are outdated, regressive and perverse. They tax expensive property very lightly, adding to its attraction as an investment, and make buying and selling homes more expensive. Devolution of these taxes, as recommended by the London Finance Commission earlier this year, would help London to meet its needs and tackle its problems, while supporting the UK economy as a whole.
At the very least Council Tax should be reformed, to bring values up to date, and allow more variation between tax rates for the cheapest and most expensive property. A more radical approach is land value tax, which would tax the land that a property occupies (or, for the rent that would be paid for that land). The tax would be hard to evade, and by taxing empty or underused sites would encourage more efficient land use in a city where development sites are scarce. The tax would be politically risky, but recent work on land value capture by Transport for London underlines the extent to which private landowners can benefit from unearned value increases as the result of public investment in infrastructure.
9
• The next Government should devolve property taxes to the Mayor of London, and enable him to experiment with reforms, from updating council tax ratios to exploring the impact of land value taxation in London.
Building a city alliance for a better BrexitMany other UK cities share London’s interests, and most voted to remain in the EU. They have diverse and cosmopolitan populations, major universities, and look to knowledge-based service sectors for their growth.
The election of new metro mayors across the country gives the Mayor of London the opportunity to work with other UK cities and their elected leaders, to argue for a Brexit deal that reflects their interests, and allows them to take control of their own affairs through devolution of taxes and services.
• The Mayor of London should join with the mayors and leaders of the UK’s major cities to form a Convention of City Leaders on Brexit, and the next Government should actively engage with these cities, to ensure that their needs are properly addressed in negotiations and further devolution.
Keeping London OpenLondon faces both short- and long-term risks from Brexit. In threatening London, these threaten the prosperity of the UK as a whole.
Retaining membership of the European Single Market would mitigate most of these risks, but falling out of the Single Market without a comprehensive trade deal or adequate transitional arrangements would be catastrophic for London businesses, as would the sudden loss of EU workers. The longer-term risk is more subtle but no less serious – the erosion of the creative edge, conviviality and variety that distinguishes London from so many other cities that offer well-equipped offices and international airports.
London’s resilience and ingenuity will help the city to mitigate these risks and seize the opportunities that will come with them. But, like other UK cities, London needs to be open, liveable and affordable to do so.

INTRODUCTION
11
Brexit is probably the most dramatic event in London’s history in a generation, possibly since World War II. It creates opportunity and risk for a city that has, since the 1970s, capitalised on its position between continental Europe and the USA, sharing proximity with the first and language with the second, to become a world‑leading business capital.
London suffered from depopulation after the war, but began to bounce back in terms of population and economic growth from the late 1980s, fuelled by the expansion of the deregulated financial service sector and a re‑emergent cultural confidence driven by inward migration and increased diversity. This trajectory has faced setbacks, including the recessions of the early 1990s and the late 2000s, but London has proved remarkably resilient. However, London’s long boom has placed severe pressure on its infrastructure, particularly its housing stock, and its growth has been accompanied by a rise in inequality and stubbornly high levels of relative poverty, caused in part by high housing costs.
With Brexit impending, London is facing a major change in its relationship to Europe, and with it, to the rest of the world. The capital has an international stature as a global city, and voted to remain by a margin of 60:40 (though some areas of London voted heavily in favour of leaving). Furthermore London’s economic and social structures make it particularly vulnerable to changes in international trading and migration.
This report considers the challenges Brexit poses for London’s position as a global city and proposes ways of addressing these challenges. It was written in the period between the EU Referendum of June 2016, and the initiation of negotiations a year later. It therefore reflects the atmosphere of uncertainty and possibility that has accompanied discussions of ‘Brexit before Brexit’, with the June 2017 general election result compounding uncertainty.
The report is not comprehensive but seeks to set out the most urgent areas for action. Some of these are about influencing the Brexit negotiations, to ensure
12
the best possible outcome for London and the rest of the UK; others are about using Brexit as an opportunity for London to develop innovative solutions to its long‑term problems.
In particular, the report argues that increased devolution of power and resources has become imperative if London is to continue to thrive as a dynamic, inclusive global city after Brexit:
• Chapter One looks at the evolution of the global city concept, at London’s success factors and at the growing pains that have accompanied that success;
• Chapter Two examines the principal threats posed to London’s economy by Brexit, particularly restrictions on freedom of movement and withdrawal from the EU’s Single Market;
• Chapter Three considers policy responses to the specific and urgent skills challenges facing London, from devolved skills funding to regionally managed immigration;
• Chapter Four asks how London can be empowered to meet its housing and infrastructure needs, addressing which will be crucial to retaining global talent and serving its expanding population;
• Chapter Five argues that radical reform to London’s system of property tax could create a fairer city, a more stable market, and more money to invest in services and infrastructure.
In considering how London can maintain and enhance its existing economic model this report sets to one side bigger questions about London’s future, which have been brought into sharp focus by Brexit. What trajectory should the city choose? Should we, for example, seek to become an offshore entrepot, semi‑detached from both the UK and mainland Europe,
13
offering a low tax, high‑skills base for trading and business services? Or should we pay more attention to repairing our fractious relationships with the rest of the UK, while other cities in Europe and beyond take on the mantle of global city functions? Should London double down on tech, on cultural industries, or should it seek to preserve its current balance of economic sectors and trading relationships while tackling the chronic problems that have dogged its recent success? Or can these be combined?
The point of raising these questions is that London is entering uncharted and choppy waters, and it needs to consider the course it wants to set. Brexit offers an opportunity to address these big issues, but the arguments made in this report underline the extent to which talent, trade and infrastructure will be needed to underpin any future success.
This report does not argue that London needs ‘special treatment’, but rather, rests on the assumption that different economic and social models operate in London (and its south‑eastern hinterland) to the rest of the UK. If, after Brexit, London is to continue to play a leading role in the UK economy, we need a devolution settlement that will allow innovation and responsiveness in terms of skills, migration, housing and tax regimes. One size governance fits fewer and fewer parts of the UK.

PART 1 A BETTER BREXIT


1 GLOBAL CITY STRENGTHS AND STRAINS
17
London’s pre‑eminence in the world economy is matched only by a handful of cities. Research on the phenomenon of ‘global cities’ has consistently placed London in their front rank. This chapter reviews the characteristics and components of London’s global reach – enabling the city to draw in companies, and migrants rich and poor – and how these global functions impact on London.
London’s success as a global cityLondon’s influence today draws on the city’s longstanding status as a centre of international power, first as a trading centre then as an imperial capital. London’s population has long reflected the city’s international character, and was augmented by waves of political and economic refugees – by 1901 around five per cent of the population was born overseas.1
London was characterised as a global city even as it was going through a period of economic and population decline after World War II. British urbanist Peter Hall characterised London in the 1960s as one of the few ‘world cities’, with growing dominance over trade, information handling and innovation2 – despite the unravelling of the British Empire and government attempts to rebalance the economy away from the capital.
Research has since explored further the growth of London’s global city functions, focusing first on the role played by corporations. Sociologist Saskia Sassen explored how advanced service firms concentrated their executive offices in New York, London and Tokyo from the 1980s onwards – giving these cities a heavier weight in the global economy. Financial and professional service firms are seen as an essential component of London’s global reach (even though they only employ circa 15 per cent of London’s workforce), because their structure is heavily skewed towards London and a few other cities; London’s stock market is not the world’s biggest, but it is the most international in character.
This concentration of decision‑making functions has been confirmed by an extensive analysis of the
18
branch structure of 175 top professional services corporations by scholars at the University of Loughborough,3 and by recent surveys suggesting that 40 per cent of the 250 top global companies chose London for their global or regional headquarters.4
Global city success factors
Agglomeration effectsThe tendency for high value services (professional, creative, financial)5 to cluster in a few global cities over the long term is quite remarkable. Many industries that used to dominate London’s economy – and have contributed to its wealth – have left the capital for places where tasks can be completed more cheaply. Yet advanced services and generally knowledge‑intensive sectors seem to group in the capital, despite higher costs.
Economic geographers identify a strong force – the “agglomeration effect” – enticing firms with employees performing knowledge‑intensive work to locate near similar or closely related supplier firms.6 The agglomeration of skilled workers increases their productivity: they are more likely to learn new skills from others and find a job that fits their qualifications and interests, and all benefit from the same urban infrastructure. Publishing and finance may not directly affect each other, but their employees, clients and suppliers use the same airports, transport systems, restaurants and theatres. Furthermore, the co‑location of leading financial and creative sectors together with tech start‑ups incubated in London’s multitude of co‑working spaces creates opportunities for innovation and disruption, as in the growth of ‘fintech’. Post‑industrial, service and knowledge sectors relying on non‑routine tasks that require education and face‑to‑face interaction gain most from theses forces, creating a strong incentive for them to stick together.7, 8
The productivity benefits that these sectors derive from locating their knowledge‑intensive functions
19
in global cities like London enables them to offer a wage premium and learning opportunities, attracting and retaining skilled workers in the capital.9 The productivity of London’s service industries has boosted their exports, which have doubled in value since 2003.10
Institutions and legislationLondon’s economic advantage also relies on institutional factors that include the UK’s tax and legislative framework, and the performance of the various tiers of government. London generally fares well on ‘ease of doing business’ indicators11 and the national tax system is deemed attractive for corporations to invest – with lower corporation tax rates than the OECD average and the ability for foreign shareholders to receive their dividends tax‑free.12 Recent analysis also highlights the global focus of London’s third sector, which has developed out of its links with government, business and legal services. The UK legal protection framework granted to charities in 1601 has encouraged organisations with an international charitable focus to operate from London, and gave London’s civil society an internationalist agenda early on.13
Many would argue that the UK’s membership of the EU has also conferred significant institutional advantage for London, including through embedding its financial and legal services as leading European sectors. The UK, for its part, has had significant influence within the EU, promoting the concept of the Single Market, and both the Greater London Authority and the City of London have offices in Brussels, intended to ensure that London’s interests are represented in policymaking and regulation.
Culture, openness and ‘soft power’But London’s global city character is not just a matter of business services specialisation, agglomeration and institutions. Peter Hall had noted in 1966 that London’s economic and cultural strength were fuelled by the city’s ability to attract and retain workers.
20
Higher education also forms an important element of this, as well as an export sector in its own right: UCL and Imperial College London regularly feature in the top ten universities globally, and London has more than 100,000 overseas students.14 Academics and students from around the world come to London to research, teach and study. In doing so, they create global networks of connection with the city.
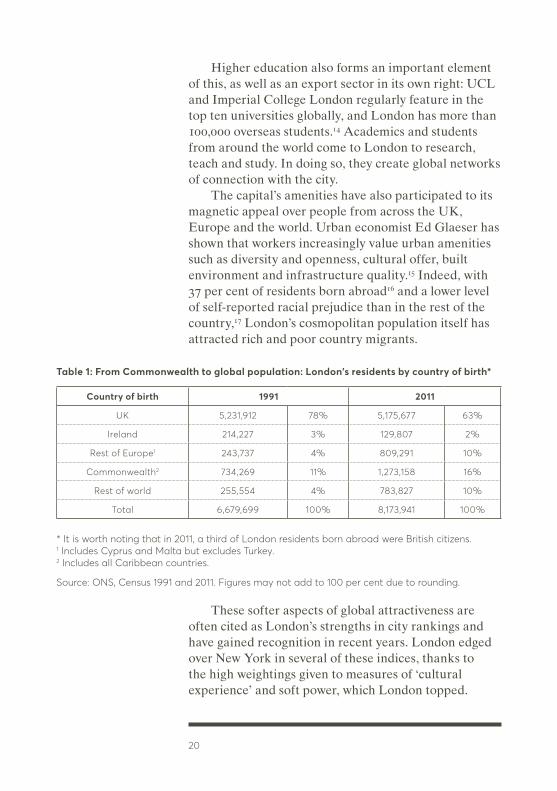
The capital’s amenities have also participated to its magnetic appeal over people from across the UK, Europe and the world. Urban economist Ed Glaeser has shown that workers increasingly value urban amenities such as diversity and openness, cultural offer, built environment and infrastructure quality.15 Indeed, with 37 per cent of residents born abroad16 and a lower level of self‑reported racial prejudice than in the rest of the country,17 London’s cosmopolitan population itself has attracted rich and poor country migrants.
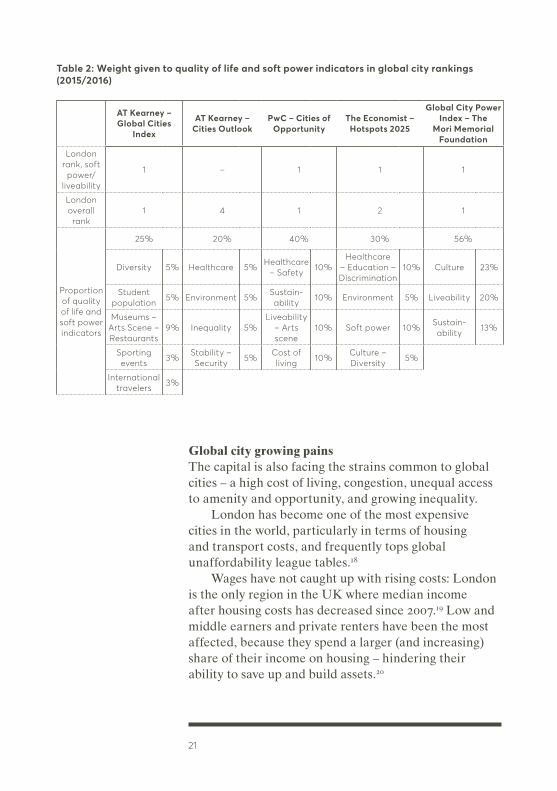
These softer aspects of global attractiveness are often cited as London’s strengths in city rankings and have gained recognition in recent years. London edged over New York in several of these indices, thanks to the high weightings given to measures of ‘cultural experience’ and soft power, which London topped.
Table 1: From Commonwealth to global population: London’s residents by country of birth*
Country of birth 1991 2011
UK 5,231,912 78% 5,175,677 63%
Ireland 214,227 3% 129,807 2%
Rest of Europe1 243,737 4% 809,291 10%
Commonwealth2 734,269 11% 1,273,158 16%
Rest of world 255,554 4% 783,827 10%
Total 6,679,699 100% 8,173,941 100%
* It is worth noting that in 2011, a third of London residents born abroad were British citizens.1 Includes Cyprus and Malta but excludes Turkey.2 Includes all Caribbean countries.
Source: ONS, Census 1991 and 2011. Figures may not add to 100 per cent due to rounding.
21
Global city growing painsThe capital is also facing the strains common to global cities – a high cost of living, congestion, unequal access to amenity and opportunity, and growing inequality.
London has become one of the most expensive cities in the world, particularly in terms of housing and transport costs, and frequently tops global unaffordability league tables.18
Wages have not caught up with rising costs: London is the only region in the UK where median income after housing costs has decreased since 2007.19 Low and middle earners and private renters have been the most affected, because they spend a larger (and increasing) share of their income on housing – hindering their ability to save up and build assets.20
Table 2: Weight given to quality of life and soft power indicators in global city rankings (2015/2016)
AT Kearney – Global Cities
Index
AT Kearney – Cities Outlook
PwC – Cities of Opportunity
The Economist – Hotspots 2025
Global City Power Index – The
Mori Memorial Foundation
London rank, soft power/
liveability
1 – 1 1 1
London overall rank
1 4 1 2 1
Proportion of quality of life and soft power indicators
25% 20% 40% 30% 56%
Diversity 5% Healthcare 5%Healthcare
– Safety10%
Healthcare – Education – Discrimination
10% Culture 23%
Student population
5% Environment 5%Sustain-ability
10% Environment 5% Liveability 20%
Museums – Arts Scene – Restaurants
9% Inequality 5%Liveability
– Arts scene
10% Soft power 10%Sustain-ability
13%
Sporting events
3%Stability – Security
5%Cost of living
10%Culture – Diversity
5%
International travelers
3%
22
Rapid growth in demand is taking much of the city’s infrastructure over capacity,21 and this is felt strongly on public and surface transport. Quality of life in the capital is also affected by air pollution: longer delays on inner London roads since 2012 have prevented the improvements in air quality expected from the decline in car use.
The benefits of London’s growth are also shared too narrowly – both within the capital and with other regions. 37 per cent of London’s children grow up in poverty (the UK average is 26 per cent), showing no improvement since 2000.22 A steady increase in number of jobs has helped raise employment rates since the downturn, but the unemployment rate is higher than any other English region, and there are barriers to employment specific to the capital. One of these is the cost of childcare, which is keeping London’s maternal employment rate much below that of the rest of the country.23
There are also high rates of young people Not in Education, Employment and Training (NEET) in poorer parts of the city. This suggests that education and training in London is not equipping young people for London’s workforce (even though its schools are the best‑performing in the UK). It may also reflect higher‑skilled workers in London ‘trading down’ to take jobs previously held by people with lower qualifications, while developing their skills or seeking new opportunities.

23

2 TRADE AND TALENT – THE IMPACT OF BREXIT
25
London’s status as a world city has been resilient to global economic and political change over the past 50 years, and even to shocks like the financial crisis of 2008–09. However, as the last chapter argued, London’s success has been accompanied by long‑standing problems, common to many world cities. These challenges of strained infrastructure, soaring living costs and social polarisation inhibit London’s success and help prevent its economic and cultural wealth being shared more fairly.
The UK’s decision to leave the European Union presents a much more immediate challenge, posing risks, threats and opportunities for the capital. Before the June 2017 general election, Brexit was expected to entail an end to freedom of movement for EU nationals and the UK leaving the European Single Market and Customs Union – as set out by Prime Minister Theresa May in January 2017.24 Subsequent chapters propose specific policy responses to these risks, and more general measures that will help London to maintain its position.
Many risks involved in departure from the EU are common to all parts of the UK. This report focuses on the London specifics – the risks that disproportionately affect the capital. Primary among these are the challenges to London’s openness to trade and talent.
World city tradeLondon is the first exporter region for services (46 per cent of the UK’s service exports), and the second for goods, after the South East.25, * Exports have generated a value of around £130bn a year in recent years, up from £75bn in 2002.26
London is slightly less reliant on the EU than other regions: roughly 40 per cent of London’s exports go to EU markets, representing circa seven per cent of London’s GDP – whereas other regions send on average half of their exports to the EU, representing
* London accounts for 30 per cent of the UK’s total exports.

26
10 per cent of their GDP. This is partly because the capital is already more engaged in worldwide trading,27 but mostly because London’s economy is so much larger and diverse than that of the other regions, meaning the capital is more self‑reliant than other UK regions.28
Recent analysis also suggests that London and the South East are the only regions that have become less dependent on EU markets between 2000 and 2010.29
We should not make too much of estimates of London’s exports by destination. Measuring trade by sector and region is complex, and the figures miss important ways in which London’s trade is bound up with the EU. For example, they do not pick up the services that London businesses provide to exporters outside the capital. Nor do they take account of the firms who export globally, but are based in London at least partly because of its access to the European Single Market. In addition, trade between London‑based businesses and the subsidiaries they set up in other EU does not show in the UK’s trade balance.30
In coming years, looking beyond Europe and North America will become increasingly important for exporters. Europe’s share of global middle‑class consumption is expected to fall from 38 to 20 per cent from 2009 to 2030, and North America’s from 26 to 10 per cent, while the Asia‑Pacific region will account for nearly 60 per cent (up from 23 per cent in 2009).31 Although trade relationships thrive on proximity,32 this shift in export opportunity will be crucial to London’s future success, and strengthens the case (made in Centre for London’s 2014 report Trading Places) for the Mayor of London to be given a strategic lead role for trade in London.33
London’s goods and services exportsWhile goods still account for around 25 per cent of London’s exports, growth in recent years has been concentrated in services, which have doubled in value to around £100 billion in the past decade (not adjusted for inflation). As we set out below, London’s growing

27
strength in service sector exports has important implications for post‑Brexit negotiations, which will need to address the complexities of regulatory, as well as tariff, barriers to trade.
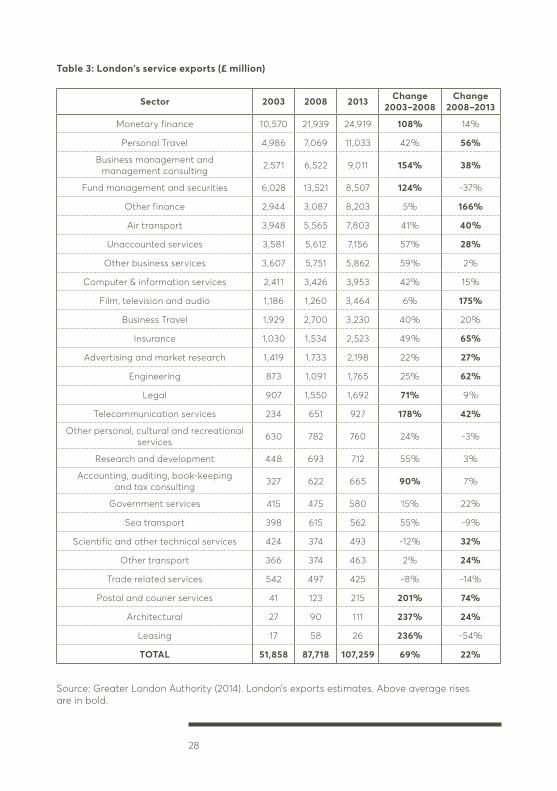
Within services, financial and business services and other specialised services such as architecture were the largest components of growth in the 2000s. Since 2008, growth has been slower overall, but smaller export categories like travel and transport, engineering, and film/television (see table below) have been growing faster.34 Nonetheless, financial and business services still account for around 50 per cent of London’s exports.
For many of the service sectors in which London is most strongly represented, the greatest challenge to trade after Brexit will be continuing access to the regulatory regimes that seek to ensure common standards across EU boundaries, rather than the tariff barriers that are applied to goods. The challenge is sharply accentuated if the UK fails to agree a trade deal – long‑term or transitional – before March 2019. In the case of goods, there are World Trade Organisations rules to fall back on. These do not apply to many of London’s critical service sectors. Leaving without a deal would present real problems for service sector businesses in trading from the UK; for the more mobile sectors, an obvious solution would be to move operations to other EU states.
The potential impact of different regulatory regimes is illustrated by TheCityUK’s research estimating that the impact on the UK’s economy could range from a loss of 3–4,000 jobs and £2 billion of revenue, if UK financial services were able to retain access on similar terms to today’s, to a loss of up to 35,000 jobs UK‑wide, revenue of £20 billion and tax revenues of up to £5 billion, if the UK had nothing beyond World Trade Organisation rules to rely on. In the latter scenario, knock‑on effects could double the impact.35
28
Table 3: London’s service exports (£ million)
Sector 2003 2008 2013 Change 2003–2008
Change 2008–2013
Monetary finance 10,570 21,939 24,919 108% 14%
Personal Travel 4,986 7,069 11,033 42% 56%
Business management and management consulting 2,571 6,522 9,011 154% 38%
Fund management and securities 6,028 13,521 8,507 124% -37%
Other finance 2,944 3,087 8,203 5% 166%
Air transport 3,948 5,565 7,803 41% 40%
Unaccounted services 3,581 5,612 7,156 57% 28%
Other business services 3,607 5,751 5,862 59% 2%
Computer & information services 2,411 3,426 3,953 42% 15%
Film, television and audio 1,186 1,260 3,464 6% 175%
Business Travel 1,929 2,700 3,230 40% 20%
Insurance 1,030 1,534 2,523 49% 65%
Advertising and market research 1,419 1,733 2,198 22% 27%
Engineering 873 1,091 1,765 25% 62%
Legal 907 1,550 1,692 71% 9%
Telecommunication services 234 651 927 178% 42%
Other personal, cultural and recreational services 630 782 760 24% -3%
Research and development 448 693 712 55% 3%
Accounting, auditing, book-keeping and tax consulting 327 622 665 90% 7%
Government services 415 475 580 15% 22%
Sea transport 398 615 562 55% -9%
Scientific and other technical services 424 374 493 -12% 32%
Other transport 366 374 463 2% 24%
Trade related services 542 497 425 -8% -14%
Postal and courier services 41 123 215 201% 74%
Architectural 27 90 111 237% 24%
Leasing 17 58 26 236% -54%
TOTAL 51,858 87,718 107,259 69% 22%
Source: Greater London Authority (2014). London’s exports estimates. Above average rises are in bold.

29
Similar arguments have been made for legal services, where the UK’s legal framework and courts system make it a jurisdiction of choice for contract administration and dispute resolution. TheCityUK has argued that the UK Government needs to work with EU partners to ensure that legal judgments are mutually enforceable, and that parties to contracts can continue to specify that these will be interpreted under English law.36
The House of Lords’ Select Committee on the European Union has reviewed barriers to other sectors. These include mutual recognition of qualifications, without which it would be impossible for lawyers, accountants and architects to work with clients in other EU states – and for the NHS to hire staff trained on the continent.37
Leaving the EU without a new air services agreement would hamper growth in air transport exports (and damage London’s connectivity). Flying between EU cities depends on membership of the European Common Aviation Area (ECAA), and the ability of airlines to fly from the UK to the USA rests on the Open Skies agreements negotiated by the EU.38 Following Brexit, the UK would need to negotiate membership of the ECAA or reach bespoke agreements with the EU, and the USA and other countries with whom the EU currently has air services agreements.39
Digital services would require UK data protection standards to be recognised as adequate by the EU to be able to share data over borders. Industry experts suggest that this may not be automatically or easily acquired, and could require an EU review of UK security and surveillance legislation. WTO rules still lag behind digital innovation, and could put the UK at a significant disadvantage as a tech centre.40
Creative industries, including film, television and audio exports have been among London’s fastest growing in recent years – these will also need specific agreements to ensure mutual recognition

30
of intellectual property rights and the ability of UK broadcasters to export to the EU.41
Other exports, like tourism and education, rely on EU citizens being able to travel freely to London, and could be damaged by more restrictive immigration rules.42 And many service sector exports are closely tied to freedom of movement. Service professionals move temporarily to another country to deliver services to a customer. These transfers represent a relatively small share of service exports (around five per cent),43 but help to establish and cement new trading relationships, which London has been spearheading these thanks to its rail link to the EU.
World city skillsLondon is far more dependent on EU workers than any other region or nation within the UK, so restrictions on freedom of movement are far more challenging for London’s economy. The erosion or loss of London’s EU workforce would not just hamper the ability of world‑leading industries in financial and business services, design and creative industries to hunt for the best talent in a labour market of 500 million, but would also rob London’s hotels, restaurants, construction sites and care homes of the staff who keep the city running.
London is home to 13 per cent of the UK’s population but a third of the country’s EU citizens. Reliance on EU workers has grown as the government has sought to curtail non‑EU migration, while EU nationals work freely in the UK.
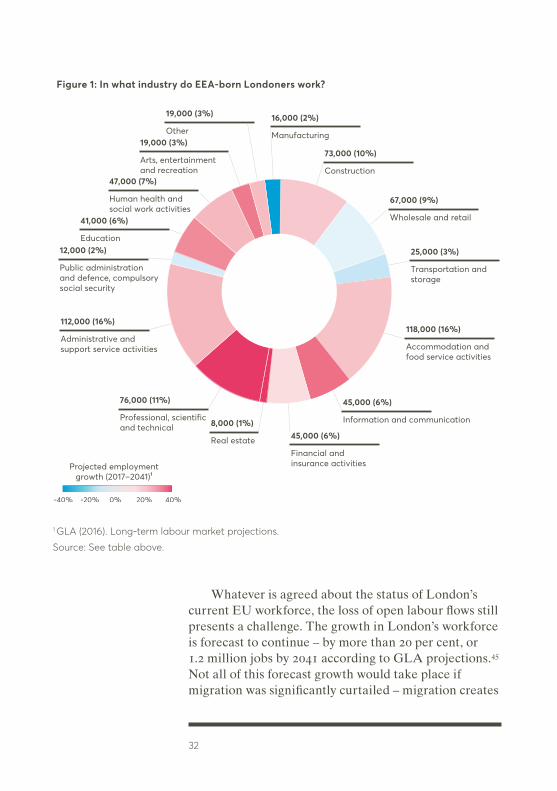
Workers born in the European Economic Area (EEA) now hold 13 per cent of London’s jobs overall, but a quarter to a third of jobs in lower‑paid sectors like construction and catering (table below). These sectors will face big challenges if migration from the EU is reduced, but they are not where most of the EEA‑born in London work (chart below). Most of the EU citizens working in London are employed in a middle‑ to high‑skilled role (82 per cent, against 73 per cent in the rest of the UK).44
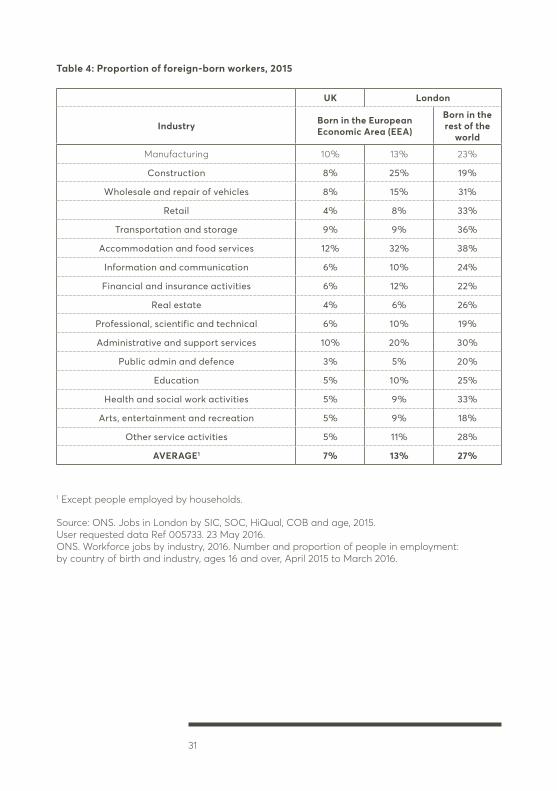
31
Table 4: Proportion of foreign-born workers, 2015
UK London
Industry Born in the European Economic Area (EEA)
Born in the rest of the
world
Manufacturing 10% 13% 23%
Construction 8% 25% 19%
Wholesale and repair of vehicles 8% 15% 31%
Retail 4% 8% 33%
Transportation and storage 9% 9% 36%
Accommodation and food services 12% 32% 38%
Information and communication 6% 10% 24%
Financial and insurance activities 6% 12% 22%
Real estate 4% 6% 26%
Professional, scientific and technical 6% 10% 19%
Administrative and support services 10% 20% 30%
Public admin and defence 3% 5% 20%
Education 5% 10% 25%
Health and social work activities 5% 9% 33%
Arts, entertainment and recreation 5% 9% 18%
Other service activities 5% 11% 28%
AVERAGE1 7% 13% 27%
1 Except people employed by households.
Source: ONS. Jobs in London by SIC, SOC, HiQual, COB and age, 2015. User requested data Ref 005733. 23 May 2016.ONS. Workforce jobs by industry, 2016. Number and proportion of people in employment: by country of birth and industry, ages 16 and over, April 2015 to March 2016.
32
Whatever is agreed about the status of London’s current EU workforce, the loss of open labour flows still presents a challenge. The growth in London’s workforce is forecast to continue – by more than 20 per cent, or 1.2 million jobs by 2041 according to GLA projections.45 Not all of this forecast growth would take place if migration was significantly curtailed – migration creates
Figure 1: In what industry do EEA-born Londoners work?
1 GLA (2016). Long-term labour market projections.
Source: See table above.
Construction
73,000 (10%)
Wholesale and retail
67,000 (9%)
Transportation and storage
25,000 (3%)
Accommodation and food service activities
118,000 (16%)
Information and communication
45,000 (6%)
Financial and insurance activities
45,000 (6%)
Professional, scientific and technical
76,000 (11%)
Administrative and support service activities
112,000 (16%)
Public administration and defence, compulsory social security
12,000 (2%)Education
41,000 (6%)
Human health and social work activities
47,000 (7%)
Arts, entertainment and recreation
19,000 (3%)Other
19,000 (3%)
Manufacturing
16,000 (2%)
Real estate
8,000 (1%)
Projected employment growth (2017–2041)¹
-40% -20% 0% 20% 40%
33
jobs as well as filling them – but on the basis of current employment patterns, more than 150,000 of these new jobs would be filled by people born in the EEA.
Furthermore, the existing population is not static. Every year between 10,000 and 50,000 EEA‑born Londoners move from London to the continent.46 Indeed, London’s pattern of EU migration seems qualitatively different to that in the rest of the UK’s: the number of EEA citizens arriving to work in the capital (measured by registrations for national insurance numbers), has grown much faster than the population of EEA citizens living London, and the difference is much wider than in the rest of the UK. This suggests that many European workers – like UK workers – come to London for a few years, then leave the city (either to return to their home nation or to other parts of the UK). The imminence of Brexit may encourage those EEA citizens who are already in London to stay put, but restrictions on immigration could also combine with existing outflows to reduce significantly London’s EU population in coming years.*
Migration, students and soft powerThe potential effects of reducing migration into London go beyond the challenge of skills shortages: there are collateral longer‑term effects on public finances, London’s economy and soft power.
The National Institute for Economic and Social Research has outlined the positive fiscal and employment impacts of migration.47 Research from the Office for Budget Responsibility suggests reductions in migration would have a larger impact on public
* While London would be highly impacted by the curtailing of freedom of movement with other EU countries, we know little about the effects of public policies on migration. More restrictive migration policies are unlikely to provide full control on migration into the UK: the number of work permits delivered by the Home Office to non-Europeans declined by around 30 per cent between 2005 and 2016, but the non-European population in the UK still rose by 70 per cent since 2002. See www.gov.uk/government/publications/immigration-statistics-july-to-september-2016/work and ONS, resident population by region and nationality, 2000/01 to 2015.
34
finances than changes in trade48 – but the figures are minor compared to broader changes in productivity and employment. Links between immigration levels and productivity that have been established anecdotally, but are difficult to quantify.49 There is also some evidence on the positive impact of diversity on innovation in the US50 and the UK51 – though measuring innovation remains a challenge.
Universities across the UK face challenges in maintaining participation in EU‑funded research programmes, and in attracting EU students, but the latter challenge is particularly pressing in London. In 2014/15, around 33,000 of London’s 360,000 students were from other EU countries – almost 10 per cent, compared to six per cent in the rest of the UK.52 Many of these students, who pay the same fees as domestic students under reciprocal EU arrangements, would be put off by the higher fees paid by international students (which are around twice as high as the domestic levels, and do not qualify for grants or student loans). EU applications to UK universities have fallen slightly since the EU referendum53 (though the picture is mixed; some leading London institutions have seen growth).
The number of non‑EU students in London universities has stalled in recent years, despite larger global student cohorts, party because of the restrictions placed on student visa numbers and the clampdown on post‑study work permits. Limiting EU student numbers further, in order to meet net migration targets, could undermine one of London’s leading export sectors, challenge the funding model of London’s universities, and damage London’s economy and soft power.
The next chapter proposes policies that could reduce uncertainty around service trading, keep London open to European talent, and preserve London’s role as one of Europe’s main economic and cultural centres.

35

3 KEEPING LONDON OPEN
37
Access to markets and access to skills are the two areas where London faces particular challenges from Brexit. London’s role in service sector exports means the capital is exposed to different risks than other parts of the UK from leaving the Single Market, and London’s reliance on an EU workforce means that the capital is simply more exposed to any sudden or dramatic curtailing of EU migration.
This chapter looks at what can be done to maintain openness to talent and trade, to enable London to continue its contribution to the UK economy.
Human capital – can London and the UK fill the gap?As urbanists and commentators have long observed, cities are powered by people: “To thrive, cities must attract smart people and enable them to work collaboratively. There is no such thing as a successful city without human capital.”54
The last chapter set out the challenges facing London’s economy in maintaining the supply of skills that drive industries from banking to baking, if Brexit results in restrictions on freedom of movement. Can London or other UK citizens take on the jobs that European workers have filled, through enhanced training or other measures to promote employability? Before examining the options for doing so, it is important to bear in mind that there is not “a lump of labour”, a fixed quantity of jobs that need filling: migrants create new economic activity, and open new businesses, as well as filling specific vacancies.
Unemployment in London is already low: at the end of 2016, 268,000 Londoners (5.6 per cent of economically active people) were unemployed. Though higher than unemployment across the UK (which stood at 4.7 per cent), this was nearly the lowest rate for 25 years.55 That said, the headline figure masks the lower employment rates for women, young people, those over 50 and those from some minority ethnic backgrounds.
This chapter will argue for continued openness to European workers. Nonetheless, whatever migration

38
regime is put in place in the long term, hiring European workers is unlikely to be as straightforward in future as it has been in recent years, so Brexit enables and requires a renewed focus on ensuring employability for all Londoners. Below we set out what could be done to enhance employability, if childcare and apprenticeship policies were tailored to London’s needs through greater devolution.
Maternal employment and childcareMothers of dependent children in London are much less likely to be working, with a 61.4 per cent employment rate, compared to 72.1 per cent in the rest of the UK (rates for men with dependent children on the other hand are very similar in London and the rest of the UK).56 These lower levels of employment have been identified as a major factor in the high levels of child poverty in the capital.57 Bringing the maternal employment rate in London up to the same level as the rest of the UK would add more than 100,000 people to the capital’s workforce.
There are many factors affecting maternal employment rates nationally such as parental attitudes, family‑friendly work opportunities, work incentives in the social security system and education opportunities.58 In addition to these factors, childcare is a significant barrier to maternal employment, and particularly so in London, where supported provision does not take account of the longer and more flexible hours that Londoners work, and where high wages, rent and business rates make childcare less affordable, particularly to provide day care or nursery places for children from the most deprived families.
There are many ways to improve access to childcare, including through reforms to the tax and benefits system, which remain the preserve of central government. Nonetheless, the Mayor of London could better shape childcare and early years education in London to meet the capital’s needs – as other Mayors such as New York’s Bill de Blasio have done – if powers and resources currently held in the Department for Education were devolved to London.

39
In particular, if responsibility for early years education – potentially totalling more than £670 million59 – was devolved as one of the service areas to be funded by retained business rates, the Mayor and boroughs could choose to spend these resources in new ways, such as expanding part‑time childcare provision for children whose parents are returning to work from maternity/parental leave, for which there is currently very limited public funding. The inclusion of early years education in the services to be funded through retained business rates was part of a recent consultation, but the decision was deferred.60 We recommend that this continue to be considered as a priority.
With new resources and powers, the Mayor could work with London’s boroughs and its businesses to expand and strengthen childcare provision – helping provide new choices and opportunities to London’s families. The Mayor could support and explore more innovative approaches, such as loans and start‑up advice for providers, promotion of family‑friendly work patterns, and the incorporation of childcare facilities into new developments on GLA and TfL land, or funded by GLA grants.
ApprenticeshipsLondon has exceptionally high levels of graduates in the workforce, but lags behind the rest of the UK in providing apprenticeships, particularly for young people.*
For many young Londoners, apprenticeships also offer poor quality, low‑level training; only three per cent of apprenticeship starts in London in 2013/14 were Level 3 Higher Apprenticeships.61 This reflects the low‑level entry qualifications of many recruits, and the concentration of London apprenticeships in low‑skilled, low paid sectors and occupations. There is also significant drop out; more than a quarter of apprentices do not finish their training62 and many apprenticeships fail to lead to secure, decently paid employment.
* With apprentices comprising only 0.8 per cent of its workforce in 2015/2016, London is the region with the lowest proportion of apprenticeships in England (English average is two per cent).
40
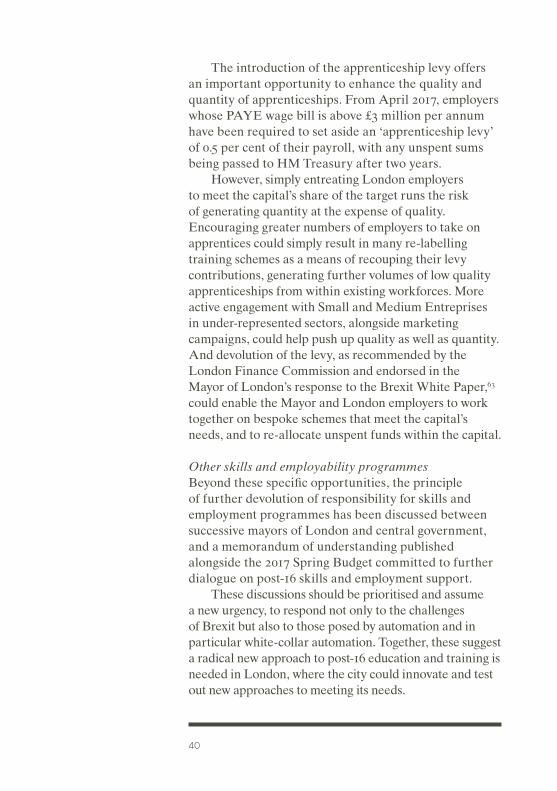
The introduction of the apprenticeship levy offers an important opportunity to enhance the quality and quantity of apprenticeships. From April 2017, employers whose PAYE wage bill is above £3 million per annum have been required to set aside an ‘apprenticeship levy’ of 0.5 per cent of their payroll, with any unspent sums being passed to HM Treasury after two years.
However, simply entreating London employers to meet the capital’s share of the target runs the risk of generating quantity at the expense of quality. Encouraging greater numbers of employers to take on apprentices could simply result in many re‑labelling training schemes as a means of recouping their levy contributions, generating further volumes of low quality apprenticeships from within existing workforces. More active engagement with Small and Medium Entreprises in under‑represented sectors, alongside marketing campaigns, could help push up quality as well as quantity. And devolution of the levy, as recommended by the London Finance Commission and endorsed in the Mayor of London’s response to the Brexit White Paper,63 could enable the Mayor and London employers to work together on bespoke schemes that meet the capital’s needs, and to re‑allocate unspent funds within the capital.
Other skills and employability programmesBeyond these specific opportunities, the principle of further devolution of responsibility for skills and employment programmes has been discussed between successive mayors of London and central government, and a memorandum of understanding published alongside the 2017 Spring Budget committed to further dialogue on post‑16 skills and employment support.
These discussions should be prioritised and assume a new urgency, to respond not only to the challenges of Brexit but also to those posed by automation and in particular white‑collar automation. Together, these suggest a radical new approach to post‑16 education and training is needed in London, where the city could innovate and test out new approaches to meeting its needs.
41
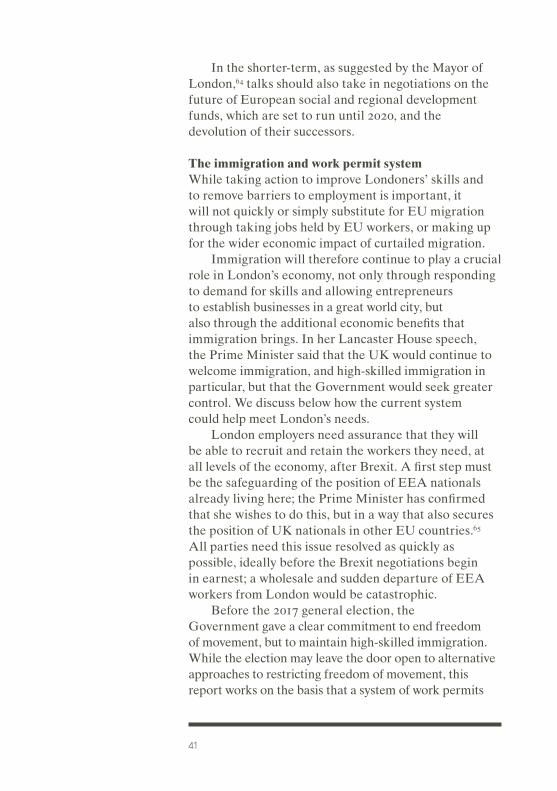
In the shorter‑term, as suggested by the Mayor of London,64 talks should also take in negotiations on the future of European social and regional development funds, which are set to run until 2020, and the devolution of their successors.
The immigration and work permit systemWhile taking action to improve Londoners’ skills and to remove barriers to employment is important, it will not quickly or simply substitute for EU migration through taking jobs held by EU workers, or making up for the wider economic impact of curtailed migration.
Immigration will therefore continue to play a crucial role in London’s economy, not only through responding to demand for skills and allowing entrepreneurs to establish businesses in a great world city, but also through the additional economic benefits that immigration brings. In her Lancaster House speech, the Prime Minister said that the UK would continue to welcome immigration, and high‑skilled immigration in particular, but that the Government would seek greater control. We discuss below how the current system could help meet London’s needs.
London employers need assurance that they will be able to recruit and retain the workers they need, at all levels of the economy, after Brexit. A first step must be the safeguarding of the position of EEA nationals already living here; the Prime Minister has confirmed that she wishes to do this, but in a way that also secures the position of UK nationals in other EU countries.65 All parties need this issue resolved as quickly as possible, ideally before the Brexit negotiations begin in earnest; a wholesale and sudden departure of EEA workers from London would be catastrophic.
Before the 2017 general election, the Government gave a clear commitment to end freedom of movement, but to maintain high‑skilled immigration. While the election may leave the door open to alternative approaches to restricting freedom of movement, this report works on the basis that a system of work permits
42
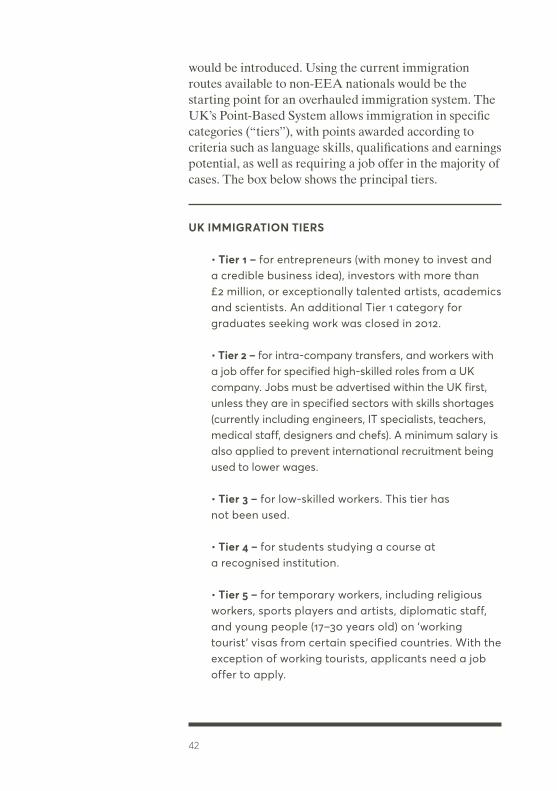
would be introduced. Using the current immigration routes available to non‑EEA nationals would be the starting point for an overhauled immigration system. The UK’s Point‑Based System allows immigration in specific categories (“tiers”), with points awarded according to criteria such as language skills, qualifications and earnings potential, as well as requiring a job offer in the majority of cases. The box below shows the principal tiers.
UK IMMIGRATION TIERS
• Tier 1 – for entrepreneurs (with money to invest and a credible business idea), investors with more than £2 million, or exceptionally talented artists, academics and scientists. An additional Tier 1 category for graduates seeking work was closed in 2012.
• Tier 2 – for intra-company transfers, and workers with a job offer for specified high-skilled roles from a UK company. Jobs must be advertised within the UK first, unless they are in specified sectors with skills shortages (currently including engineers, IT specialists, teachers, medical staff, designers and chefs). A minimum salary is also applied to prevent international recruitment being used to lower wages.
• Tier 3 – for low-skilled workers. This tier has not been used.
• Tier 4 – for students studying a course at a recognised institution.
• Tier 5 – for temporary workers, including religious workers, sports players and artists, diplomatic staff, and young people (17–30 years old) on ‘working tourist’ visas from certain specified countries. With the exception of working tourists, applicants need a job offer to apply.
43
Tailoring the systemGiven the government’s emphasis on the need to maintain high‑skilled immigration, we might expect a modified version of Tier 2 immigration to be put in place, with a wider range of specified occupations, and perhaps lower thresholds in terms of earnings.
Such a system might also, as Centre for London, the Corporation of London, London Chamber of Commerce and Industry and others have argued, have a regional dimension, allowing regional work permits that would reflect regional skills shortages, but maintaining a central quota. Australia and Canada are two countries that have regional/provincial powers in relation to immigration, seeking to divert immigrants away from a limited number of urban hotspots. The policy intention may be reversed in the UK, where a regional system would work with the labour market rather than against it, but the principle is the same.
PwC has undertaken research into the feasibility of this approach for the Corporation of London.66 Under the model it proposes, skills shortages would be assessed regionally, and quotas of visas issued to employers (alongside initiatives to enhance the skills of local people). Visas could be issued for one to six years, depending on the nature of the skills gap, and longer‑term visa holders would have the opportunity to apply for UK residency.
This approach would tackle the challenge of filling specialised roles in high value added sectors like finance and business services, where employers would be able to invest the time and money into recruiting overseas, either directly or through a intermediaries such as the Work Permit Sponsorship Body proposed by London Chamber.67
But, given the range and extent of London’s skills needs, it is worth thinking about going further. Sectors such as construction, hotels and catering are not used to international recruitment, and smaller employers in particular might be reluctant to take on the paperwork and significant cost of becoming a sponsoring employer.
44
For these sectors, and many others, recruitment takes place locally. The people come to where the jobs are.
One recruitment route, which has been widely adopted by industrial and warehousing sectors, has been the use of employment agencies, some of whom recruit directly in other EU countries. However, many of these agencies have a negative reputation in terms of working conditions, with agency workers paid at lower rates than their directly‑employed equivalents, and additional costs for employers in meeting agency fees.68
The regulated system of work permits tied to specific jobs, with minimum salaries and specific professional qualifications, also seems badly suited to the young mobile workforce of tech companies. And it misses out on another important aspect of migration between London and other EU cities – the free flow of young people, who travel between cities to learn languages, hone skills and make new friends, supporting themselves through work. These people not only help meet London’s labour needs, but also develop ideas for start‑ups, for cultural events, for new social movements – for the rich humus of creativity that supports a city like London. Most entrepreneurs do not come to London with £50,000 in investment funds, as is required for the Tier 1 (Entrepreneur) visa.
A London solution?We recommend, therefore, a regionally managed immigration system that recognises the unique needs of London’s economy and the unique characteristics of London’s labour market, enabling numbers to be controlled in line with national and regional policy, while retaining as much as possible of the flexibility of the current system. The details of regional schemes would need further discussion, but London’s scheme might include the elements listed in the box below.
45
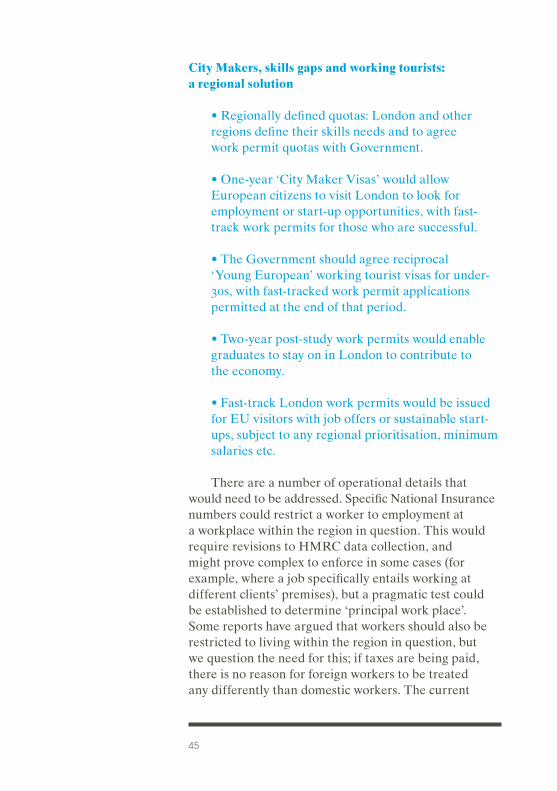
City Makers, skills gaps and working tourists: a regional solution
• Regionally defined quotas: London and other regions define their skills needs and to agree work permit quotas with Government.
• One‑year ‘City Maker Visas’ would allow European citizens to visit London to look for employment or start‑up opportunities, with fast‑track work permits for those who are successful.
• The Government should agree reciprocal ‘Young European’ working tourist visas for under‑30s, with fast‑tracked work permit applications permitted at the end of that period.
• Two‑year post‑study work permits would enable graduates to stay on in London to contribute to the economy.
• Fast‑track London work permits would be issued for EU visitors with job offers or sustainable start‑ups, subject to any regional prioritisation, minimum salaries etc.
There are a number of operational details that would need to be addressed. Specific National Insurance numbers could restrict a worker to employment at a workplace within the region in question. This would require revisions to HMRC data collection, and might prove complex to enforce in some cases (for example, where a job specifically entails working at different clients’ premises), but a pragmatic test could be established to determine ‘principal work place’. Some reports have argued that workers should also be restricted to living within the region in question, but we question the need for this; if taxes are being paid, there is no reason for foreign workers to be treated any differently than domestic workers. The current
46
restrictions on claiming benefits would also need to be reviewed, and potentially extended to cover overseas workers who lose work, as well as visitors seeking work.
In some cases, these proposals could be adopted nationwide. Government has already floated the idea of a ‘barista visa’ for young people. The principle is welcome, but the contribution of free movement for young Europeans goes far beyond the froth on a cappuccino. It will be important that any youth mobility scheme does not restrict the occupations that can be undertaken, and allows for longer‑term extensions where people have found a longer‑term role in London.
Finally, some of these schemes might reasonably be limited to the European Union on the basis of proximity, and ease of return home. Others, including the post‑study and youth programmes, might reach wider over time, especially since trade negotiations with other states are likely to include requests for preferential treatment in terms of migration.
Beyond the operational complexity, are such proposals politically feasible, given the results of the EU referendum? For many voters, immigration was the issue that tipped the balance against the EU at the ballot box. Much political debate subsequently has turned on the issue of whether freedom of movement is a ‘price worth paying’ for access to the Single Market, and the Prime Minister’s Lancaster House Speech confirmed that controlling immigration was one of the Government’s twelve negotiating objectives.69
London sees it differently, perhaps reflecting the relatively slow growth of London’s European population in recent years, compared to the rest of the UK. In a poll conducted by ComRes for Centre for London in late 2016, only 30 per cent of Londoners prioritised cracking down on immigration, compared to 60 per cent prioritising remaining in the EU Single Market.70 Concern about immigration in London is not negligible, particularly in some of the areas that have seen most rapid change in recent years. But it is far lower than in any other part of the UK: 54 per cent of Londoners

47
were positive about the economic effect of immigration, compared to 28 per cent of people in other regions.71 What other regions see as a cost, London generally sees as a benefit.
Nonetheless, would other regions resent ‘special treatment’ for the capital? This is a risk, but the argument should be clearly stated: a regionally managed migration system would enable London’s economy, which is heavily dependent on migrant labour, to continue to operate as the engine of growth in the UK, without ‘imposing’ immigration on other areas (though other areas might well wish to establish their own systems to meet their own needs). One benefit of a regional approach to migration might be that local and regional leaders would have to start making the
Figure 2: Residents who are nationals from the other EU-27 countries
Source: ONS. Annual Population Survey. Population of the United Kingdom by Country of Birth and Nationality. Data prior to 2004 from March to February.
0
1,000,000
500,000
1,500,000
2,000,000
2,500,000
2000
2001
2002
2003
2004
2005
2006
2007
2008
2009
2010
20
11 20
12
2013
20
14
2015
Rest of UK London
48
case for the economic contribution that migrants can make – for too long the case for migration has been left to a national politicians and business leaders.
Lastly, there is the risk that the relevant government agencies would be unable to cope. Alongside the implicit undesirability of any regional variation, the administrative burden was cited in 2016 by immigration minister Robert Goodwill MP as a reason to reject subnational immigration arrangements: “Applying different immigration rules to different parts of the UK would complicate the immigration system, harming its integrity, and cause difficulties for employers with a presence in more than one part of the UK,” he said.72 We suspect that several aspects of Brexit will lead to administrative complexity, so this does not seem a reason to reject such proposals out of hand.
Access to marketsLondon already exports many services that are global in reach, but the principal destination for critical sectors, like legal and business services, remains the EU, with the USA close behind. Growth in Asian markets has been more limited,73 though the scope for exporting services from the UK is perhaps limited to areas of particular specialisation.
As the last chapter set out, there are specific concerns for some of London’s strongest sectors, and the regulatory regime that will govern their access to the European Single Market following Brexit. Sectors such as financial services are not exclusive to London, but higher value‑adding functions are concentrated within the capital, and generate significant tax revenues. Access to sectors such as finance and law is also of huge importance to other EU states, so interests should be aligned to securing a supportive regulatory infrastructure.
Even with such an alignment of interests, complexity, tight timescales and political pressure could conspire to deliver a ‘lose:lose’ outcome. EU negotiators have suggested that a deal needs to be concluded in late
49
2018, to allow time for ratification before the Article 50 deadline of March 2019. With the French and German elections in 2017, the time available to negotiate a comprehensive free trade agreement that addresses services and regulations, as well as goods and tariffs, is tight. And defaulting to WTO rules would be extremely problematic for London’s service sectors, some of which (e.g. broadcasting and aviation) are not even covered by WTO arrangements, as set out in the last chapter.
Internationally trading businesses need to manage their risks. Without clarity on transitional arrangements, some businesses will anticipate the outcome of Brexit negotiations, seeking to mitigate the risk of leaving the EU without a deal by pre‑emptively moving some or all operations into other countries, or at the very least delaying investment decisions. The uncertainty during the negotiation process could become more damaging than its eventual outcome.
So there is a strong case for a transitional deal, and for giving clarity on this as soon as possible. The UK could, for example, re‑join the European Free Trade Association (of which we were a founder member), enabling us to remain within the European Economic Area and to participate in most elements of the Single Market in the short term, while leaving the European Union. This would also require temporary continuation of freedom of movement (with the potential for some restrictions on, for example, the length of time jobseekers can stay), though this would give more time to work through the complexities of overhauling the UK immigration system. UK regulations would also need to continue to track the EU’s, albeit through domestic parliamentary and executive processes, rather than through automatic adoption.
In the longer term, it will be essential for London’s Mayor and business leaders to continue to work with the UK Government to ensure that the service sectors that drive London’s growth, and the regulatory regimes that govern them, are not overlooked or marginalised in debates on terms of access to the Single Market.

50
They should also seek urgent clarity on what type of transitional arrangements will be put in place; otherwise the uncertainties attendant on negotiations may lead more and more firms to pre‑empt the outcome by moving overseas.
Furthermore, the imminent impact of Brexit strengthens the case made by Centre for London two years ago, for the Mayor to lead the development of an exports plan for London, setting regional targets, tailoring support to London’s needs and leveraging the city’s brand strength, and orchestrating the work of different agencies in London.74 This could helpfully be accompanied by the devolution of funding from the Department for International Trade.
But maintaining London’s success requires more than openness to talent; outside the EU, London needs to work harder to make the city liveable and attractive for international investors and workers. Other European cities may have the edge in terms of EU membership, so London needs to enhance its own offer. The next chapters identify some ways in which this might be done.

51

PART 2 A BETTER LONDON


4 HOUSING AND INFRA-STRUCTURE
55
As the previous chapters have argued, the challenges posed by Brexit do not replace but rather amplify the growing pains that London has been suffering as a world city. In many cases, they make tackling London’s chronic problems more urgent: if immigration and trading become more complex, will businesses and skilled workers be prepared to put up with London’s high costs of living, and congested public transport, for all its attractions?
As Chapter One set out, for 25 years the city’s mixture of openness, economic specialisation and cultural richness has proved an enticing blend. In recent years, however, the rise in living costs, and in particular the cost of housing, has begun to sour this mix. Brexit adds further uncertainty. While other push factors – including transport costs, congestion and air pollution – should not be discounted, housing costs loom largest in opinion polls on the biggest challenges facing Londoners and London businesses, so the next two chapters focus on what can be done to boost housing supply, and how a radically reformed local property tax system can raise funding for services and infrastructure, while moderating price inflation in London’s housing market.
London’s housing and infrastructure challengesLondon’s house prices quickly recovered from the 2008/09 recession, increasing by 67 per cent over the past five years, five times faster than wages.75 Buying or renting a home on the open market is becoming affordable to fewer and fewer Londoners, and more than three quarters of employers report concerns about the impact of housing costs on recruitment and retention.76 Centre for London’s previous research identifies housing costs as the principal factor in widening disparities of income and wealth in the capital.77
The causes of this runaway growth, increasingly viewed as a cause for concern rather than celebration, have been much discussed. There has clearly been a shortfall in housing supply, which has generally added 20–30,000 net additional dwellings per year78 against
56
targets that have been raised from 32,000 to 50,000 since the first London Plan was issued in 2004. Many culprits have been identified: the business model and structure of the housebuilding industry, complex and constrained sites, speculation and landbanking, or supply restriction by planners.
The other side of the equation has been demand; London residential property has looked like an excellent bet for domestic and international investors for some time. The property market is open and accessible, borrowing rates are extremely low, and the property tax system is a speculator’s dream. Property transactions are taxed heavily, but holding property is treated much more lightly. In addition, capital gains on principal residences are tax free for private individuals, and buy‑to‑let investors have been able to offset borrowing costs against rental income for tax purposes, while benefitting from annual capital appreciation of 10 per cent or more.
At the same time, London’s infrastructure is under increasing strain. Roads are as congested as they were before congestion charging was introduced, air quality is notoriously poor, and crowding on public transport is increasing – as a result of population growth, reducing private car use, and changing work and commuting patterns.79
While a number of improvements to London’s rail infrastructure – including Crossrail – are planned, the extra capacity these will create will be used up by 2020, and a significant increase in crowding on London transport is anticipated by 2031. The National Infrastructure Commission has recommended the implementation of Crossrail 2, connecting Northeast to Southwest London, to address this level of congestion, and open up capacity for 200,000 new homes. The scheme is estimated to cost £30 billion,80 with Transport for London suggesting that 50 per cent of the costs could be met from London sources such as fares, business rate supplement, community infrastructure levy, council tax and property sales.81 The scheme is awaiting government sign off of its business case.
57
Crossrail 2 is the most significant single item in London’s infrastructure needs. Analysis undertaken by Arup on the then Mayor of London’s 2050 Infrastructure Plan estimated that the total bill for infrastructure improvements would be £1,324 billion. Of this, around £1,000 billion would be for transport and housing, with around £135 billion ‘unfunded’. Other infrastructure costs – for energy, schools, water, waste, green and digital infrastructure – were assumed to be largely ‘unfunded’.82
Arup’s report concluded that unpredictable grant regimes were not capable of providing the certainty for long‑term infrastructure planning, and recommended exploration of alternative funding models, including fiscal devolution: “As would be the case for Britain’s other major cities, London is likely to benefit from fiscal autonomy that matches continuous, stable funding streams with the ability to determine local need. Greater local control similarly should enhance political accountability, fiscal discipline and responsibility.”
How devolution can meet the infrastructure challengeMeeting London’s infrastructure challenges will be essential if London is to retain its position as a leading global city that tackles chronic problems of poverty and exclusion as well as maintaining economic growth. The Mayor of London’s powers – of taxation and regulation – are limited, meaning that the city is reliant on making the case to the UK government for infrastructure investment. While London infrastructure schemes typically score well against HM Treasury business case metrics, the concentration of investment in the capital is politically contentious, especially given the perceived strength of London’s private sector.83
Debating the relative merits of investment in London and other parts of the UK risks being a zero‑sum game, especially when fiscal constraint is continuing to put pressure on budgets as a whole. Centre for London has argued that, across a range of issues, devolution
58
rather than central government diktat is the key to unlocking London’s potential without disadvantaging other regions.
Recent Centre for London reports have pushed for further devolution:
• Going Large, our report on bringing forward large sites, suggested that new types of partnership were required to enable up front infrastructure investment, and rapid build‑out of schemes, and recommended clarity on local authorities powers to enter into new partnerships.84 Our report on estate redevelopment, Another Storey, made an estimate of what could be achieved through redeveloping London’s estates, but also emphasised the need for consultation processes and compensation packages that treat all residents fairly and ensure adequate levels of social and affordable housing are built.85
• A number of reports have addressed the challenges of building sub‑market housing, in a policy context that relies on developer contributions and the vagaries of viability assessments, rather than grant regimes, for the bulk of its funding. Our Intermediate Housing Commission report, Fair to Middling, looked at housing policies aimed at modest earners and found that many of these had little bite in London, recommending devolution of funding for Help to Buy, alongside the development of products that fitted London’s circumstances better.86
• More recently, Strength in Numbers argued for greater flexibility for local authorities in their ability to borrow and redeploy capital receipts to build more social and affordable housing, and for more collaboration between local authorities to maximise the numbers of homes built.87 And In No Uncertain Terms argued that devolution of housing benefit to

59
the Mayor of London, coupled with backing for a guarantee that rates would rise with inflation, could build another 250,000 affordable homes to rent.88
• Turning South London Orange made the case for the Mayor of London taking over suburban rail services in south London, enabling integrated management and investment in improvements that would unlock 13,000 new homes around stations.89
We are planning to further work, on the scope for increasing density in London’s established residential neighbourhoods, on the role that boroughs can play in leading the construction of new homes, and on the scope for precision off‑site manufacturing to improve the speed and quality of house building in London.
Beyond these approaches, London may need to think more radically about land. For many years, de‑industrialisation was seen as a plentiful source of ‘brownfield’ land, but London has lost such sites much faster than anticipated, and the next London Plan is expected to seek to restrain further loss. Another option is remodelling of the green belt, which has a growing number of advocates. Centre for London has not undertaken research on this issue, but any proposals for remodelling would need to be carefully managed to avoid land becoming the used for speculation or suburban sprawl rather than planned urban development. The current Mayor of London has ruled out greenbelt remodelling, though government policy is against it in any case; there is certainly a strong argument for future mayors of London being empowered to review the greenbelt, whether or not they use this power.
Finally, the Mayor should be enabled and encouraged to work more closely with London’s satellite towns and cities. Since the abolition of regional planning in 2010, discussions between London and its neighbours have relied on the “duty to co‑operate”. As London continues to grow, the potential for more formal and

60
collaboration arrangements addressing a wider range of issues should be considered.
The next chapter reviews how a devolved and reformed tax system could be more progressive, productive and positive in terms of its impact on London’s property market, and its ability to support London infrastructure investment.


5 FISCAL DEVOLUTION AND REFORM
63
Compared to authorities in other capital cities of developed economies around the world, the Mayor of London and the London boroughs have very limited powers over taxation. Nearly 70 per cent of London’s revenue comes from central government, compared to 26 per cent in New York, 16.3 per cent in Paris, and 5.6 per cent in Tokyo.90 The city has very limited fiscal autonomy. National government sets the tax base and bands for Council Tax, and both sets and levies non‑domestic business rates and property transaction taxes. There are no London‑specific rates of income or sales taxes, or locally‑assigned revenues. London’s fiscal powers operate at the margins: setting the level of Council Tax and the Metropolitan Police precept, within clearly defined limits; charging a supplementary non‑domestic levy for Crossrail; and operating the Congestion Charge.
These constraints on London’s fiscal powers limit its ability to respond to changing economic and social needs. It cannot levy new taxes to fund the infrastructure it needs to grow, or properly capture the uplift in land values that is created by public investment in transport or local amenities. It is constrained from taxing the wealth and income generated in the city in order to reduce London’s high levels of inequality and poverty, or to provide more and better housing. It is not accountable for the majority of the taxes that are levied on its residents and businesses for the public services they receive, and by the same token, it cannot propose different or better ways of raising those taxes. The political pressures facing national governments – and the political risks national politicians are prepared to take – effectively determine the scope for fiscal policy changes in London.
Reform of London’s property tax system is particularly pressing: the current system is inefficient and unfair. Council Tax is regressive in that more expensive properties benefit from a much lower tax rate, and provides no incentive for efficient use of land or property.91 The tax base is also outdated: bills are
64
calculated using 1991 property values, meaning the proportion of the property value that is charged has halved on average across London, and even more in areas where prices have risen the fastest.92 This has weakened the incentives to use property more efficiently. Different approaches to tax policy across boroughs have also built up wide variations over time – a band D property in Barking and Dagenham is liable to higher Council Tax than the most expensive properties in Westminster.
Stamp Duty Land Tax is more progressive, but only taxes property wealth at the time of transaction, inhibiting transactions and liquidity. Additionally, our property tax system is very poor at capturing land value uplifts: it allows for nearly all the property wealth generated by public investment to flow to landowners untaxed. Transport for London estimated that its rail projects would yield twice their cost in (uncaptured) land value uplifts.93
The case for increasing fiscal devolution to London has been made in the two reports of the London Finance Commission, a body of independent experts and interested parties convened by the Mayor of London. In its most recent report, Devolution: A Capital Idea, the Commission argued that the power to make long term commitments on infrastructure, housing, and employment policy would best enable London to meet the challenges of uncertainty caused by Brexit. It proposed the devolution of the full suite of property taxes to London, including Council Tax, business rates and Stamp Duty Land Taxes; the assignment of a proportion of income tax and VAT yields to London; the creation of new powers for London to levy business rate supplements, charges and minor taxes; and consideration of a new charge to tax the uplift in property value created by new transport or regeneration schemes, such as tube line extensions.94 In a recent report, Transport for London sketched out how such a charge could work. A levy on new buyers and renters of properties around new transport links would enable capture of some of the value uplift resulting

65
from improvements in connectivity, and its reinvestment into further transport upgrades.95
The case for greater fiscal devolution to London has been strengthened in recent years by the transfer of powers over property and income tax powers to the governments of Scotland and Wales. The Scottish Government has levied its own Land and Buildings Transaction Tax and Landfill Tax since 2015, and a Scottish rate of income tax has been in place since 2016. From this year onwards, Scotland will have full powers over tax rates and bands on non‑savings and non‑dividend income, and will receive a half share of VAT receipts in Scotland.
The Welsh Government now has power over Stamp Duty Land Tax, landfill tax and business rates, and will set a new Welsh Income Tax rate from 2019. Both the Scottish and Welsh governments have also introduced marginal reforms of Council Tax. There are neither principled nor practical reasons for not extending a similar measure of devolution to London.
In what follows, we model some of the options proposed by the London Finance Commission, and consider a series of incremental reforms to taxation in London. We analyse the effects of potential Council Tax reform; examine the revenue raised by Stamp Duty Land Tax under different scenarios for the London housing market; and sketch out what a tax on land value in London could look like.
Council Tax ReformCouncil Tax is levied in nine bands, based on 1991 property values. Each London borough sets tax levels annually to meet its funding needs (after taking grants into account), as well as costs for the GLA, and Police and Fire Services. The ratio between the bands is fixed: the tax charge for the highest value properties (Band H) within any local authority is fixed at three times the tax rate for the cheapest properties (Band A).
Numerous experts have recommended that Council Tax be reformed. Because of its exceptional
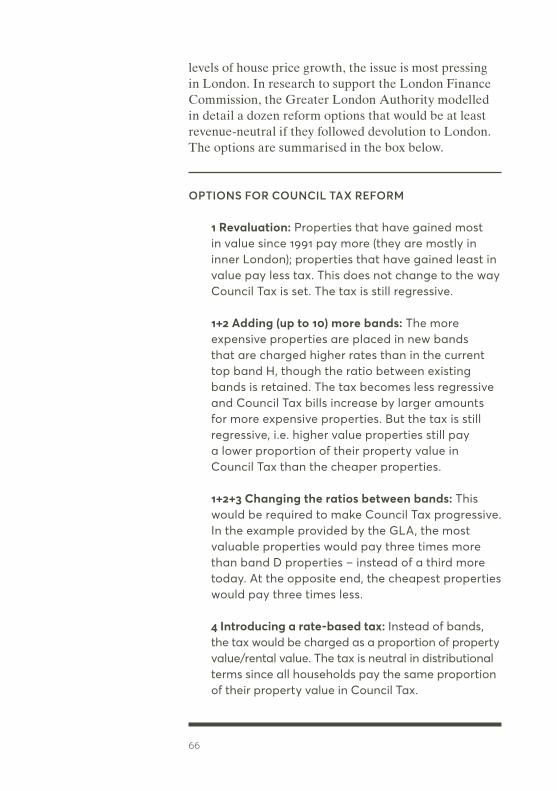
66
levels of house price growth, the issue is most pressing in London. In research to support the London Finance Commission, the Greater London Authority modelled in detail a dozen reform options that would be at least revenue‑neutral if they followed devolution to London. The options are summarised in the box below.
OPTIONS FOR COUNCIL TAX REFORM
1 Revaluation: Properties that have gained most in value since 1991 pay more (they are mostly in inner London); properties that have gained least in value pay less tax. This does not change to the way Council Tax is set. The tax is still regressive.
1+2 Adding (up to 10) more bands: The more expensive properties are placed in new bands that are charged higher rates than in the current top band H, though the ratio between existing bands is retained. The tax becomes less regressive and Council Tax bills increase by larger amounts for more expensive properties. But the tax is still regressive, i.e. higher value properties still pay a lower proportion of their property value in Council Tax than the cheaper properties.
1+2+3 Changing the ratios between bands: This would be required to make Council Tax progressive. In the example provided by the GLA, the most valuable properties would pay three times more than band D properties – instead of a third more today. At the opposite end, the cheapest properties would pay three times less.
4 Introducing a rate-based tax: Instead of bands, the tax would be charged as a proportion of property value/rental value. The tax is neutral in distributional terms since all households pay the same proportion of their property value in Council Tax.

67
Centre for London has modelled a similar system for domestic property to that currently used for business rates – that is, charging Council Tax as a proportion of the annual rental yield of the property. We modelled revenue in the London Borough of Hackney – one of the boroughs where property values have risen most rapidly since the 1990s. In Hackney, taxing seven per cent of the annual rental yield (assumed to be four per cent of property value)96 sustains revenue at current levels, and equates to a 0.27 per cent tax on property values.
This level of tax would keep Council Tax bills at the same level for the median band D property. Lower value properties would see their tax bill fall; higher value homes would pay more – as set out in the table below. These findings are comparable with the GLA’s: they suggested property values be taxed at 0.2 per cent London‑wide to raise the same revenue as current Council Tax.97
Table 5: Council Tax bills in the London Borough of Hackney, under the current and a rate based system*
Band1 1991 BandingNumber of
properties in band (2015)
2015 Council Tax bill (£)
Bill for median property based on 7% of rental
yield (£)
A Up to £40,000 6,730 863 599
B £40,001 to £52,000 31,520 1,007 827
C £52,001 to £68,000 33,200 1,151 1,035
D £68,001 to £88,000 21,210 1,294 1,294
E £88,001 to £120,000 10,800 1,582 1,689
F £120,001 to £160,000 4,100 1,870 2,344
G £160,001 to £320,000 1,110 2,157 3,541
H More than £320,000 50 2,589 N/A2
* The distribution of sales across bands was estimated from Land Registry sales data (average for years 1995/1996/1997 (earliest available) and 2013/2014/ 2015). We assumed that the distribution of sales in both time periods was similar. The Land Registry sales data was then cross-referenced with ONS’s House Prices estimates.1 Average property in each band.2 There are too few properties in Band H in the London Borough of Hackney to estimate a reliable average property price – but a £12m property would face bills of £34,000 a year under this rate-based system.
Source: Centre for London estimates.
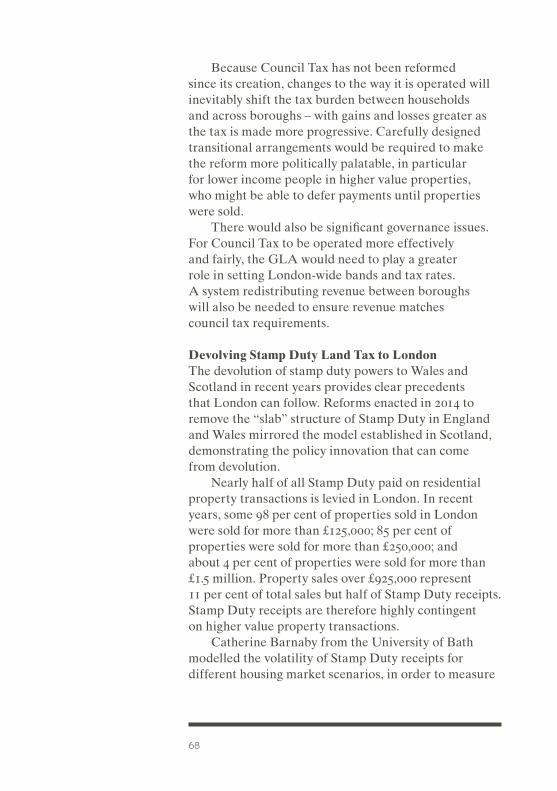
68
Because Council Tax has not been reformed since its creation, changes to the way it is operated will inevitably shift the tax burden between households and across boroughs – with gains and losses greater as the tax is made more progressive. Carefully designed transitional arrangements would be required to make the reform more politically palatable, in particular for lower income people in higher value properties, who might be able to defer payments until properties were sold.
There would also be significant governance issues. For Council Tax to be operated more effectively and fairly, the GLA would need to play a greater role in setting London‑wide bands and tax rates. A system redistributing revenue between boroughs will also be needed to ensure revenue matches council tax requirements.
Devolving Stamp Duty Land Tax to LondonThe devolution of stamp duty powers to Wales and Scotland in recent years provides clear precedents that London can follow. Reforms enacted in 2014 to remove the “slab” structure of Stamp Duty in England and Wales mirrored the model established in Scotland, demonstrating the policy innovation that can come from devolution.
Nearly half of all Stamp Duty paid on residential property transactions is levied in London. In recent years, some 98 per cent of properties sold in London were sold for more than £125,000; 85 per cent of properties were sold for more than £250,000; and about 4 per cent of properties were sold for more than £1.5 million. Property sales over £925,000 represent 11 per cent of total sales but half of Stamp Duty receipts. Stamp Duty receipts are therefore highly contingent on higher value property transactions.
Catherine Barnaby from the University of Bath modelled the volatility of Stamp Duty receipts for different housing market scenarios, in order to measure
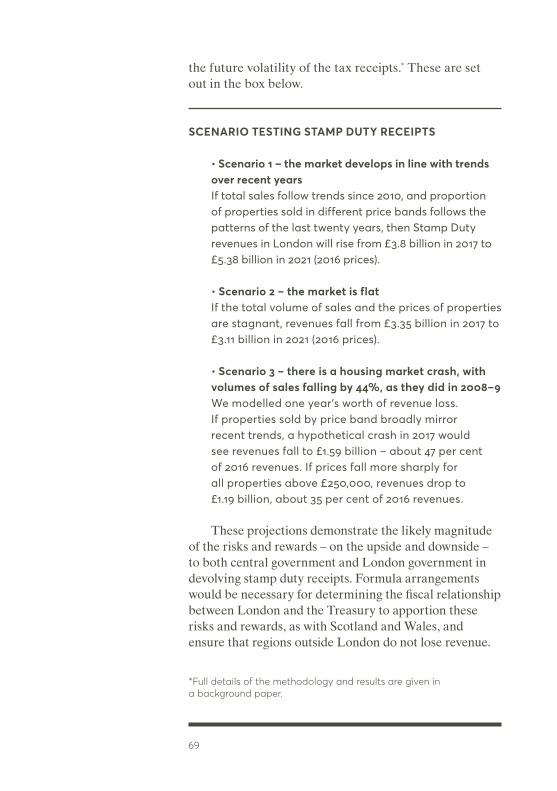
69
the future volatility of the tax receipts.* These are set out in the box below.
SCENARIO TESTING STAMP DUTY RECEIPTS
• Scenario 1 – the market develops in line with trends over recent years If total sales follow trends since 2010, and proportion of properties sold in different price bands follows the patterns of the last twenty years, then Stamp Duty revenues in London will rise from £3.8 billion in 2017 to £5.38 billion in 2021 (2016 prices).
• Scenario 2 – the market is flat If the total volume of sales and the prices of properties are stagnant, revenues fall from £3.35 billion in 2017 to £3.11 billion in 2021 (2016 prices).
• Scenario 3 – there is a housing market crash, with volumes of sales falling by 44%, as they did in 2008–9 We modelled one year’s worth of revenue loss. If properties sold by price band broadly mirror recent trends, a hypothetical crash in 2017 would see revenues fall to £1.59 billion – about 47 per cent of 2016 revenues. If prices fall more sharply for all properties above £250,000, revenues drop to £1.19 billion, about 35 per cent of 2016 revenues.
These projections demonstrate the likely magnitude of the risks and rewards – on the upside and downside – to both central government and London government in devolving stamp duty receipts. Formula arrangements would be necessary for determining the fiscal relationship between London and the Treasury to apportion these risks and rewards, as with Scotland and Wales, and ensure that regions outside London do not lose revenue.
*Full details of the methodology and results are given in a background paper.
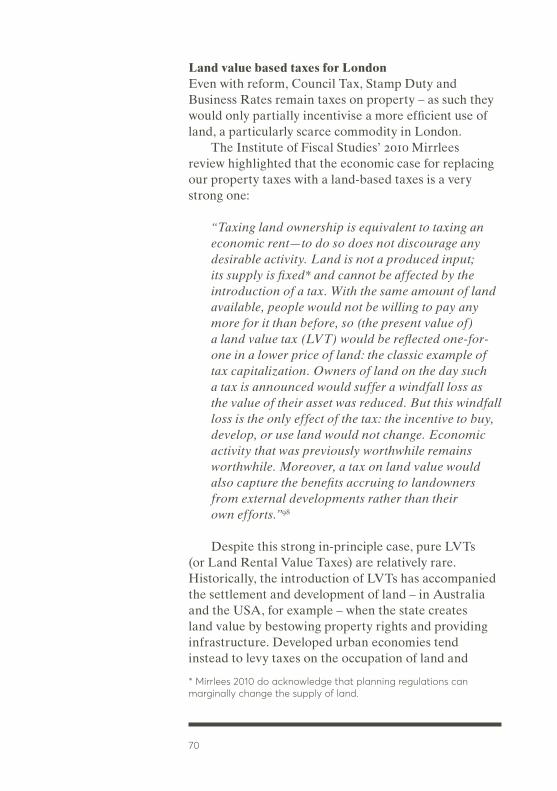
70
Land value based taxes for LondonEven with reform, Council Tax, Stamp Duty and Business Rates remain taxes on property – as such they would only partially incentivise a more efficient use of land, a particularly scarce commodity in London.
The Institute of Fiscal Studies’ 2010 Mirrlees review highlighted that the economic case for replacing our property taxes with a land‑based taxes is a very strong one:
“Taxing land ownership is equivalent to taxing an economic rent—to do so does not discourage any desirable activity. Land is not a produced input; its supply is fixed* and cannot be affected by the introduction of a tax. With the same amount of land available, people would not be willing to pay any more for it than before, so (the present value of) a land value tax (LVT) would be reflected one-for-one in a lower price of land: the classic example of tax capitalization. Owners of land on the day such a tax is announced would suffer a windfall loss as the value of their asset was reduced. But this windfall loss is the only effect of the tax: the incentive to buy, develop, or use land would not change. Economic activity that was previously worthwhile remains worthwhile. Moreover, a tax on land value would also capture the benefits accruing to landowners from external developments rather than their own efforts.”98
Despite this strong in‑principle case, pure LVTs (or Land Rental Value Taxes) are relatively rare. Historically, the introduction of LVTs has accompanied the settlement and development of land – in Australia and the USA, for example – when the state creates land value by bestowing property rights and providing infrastructure. Developed urban economies tend instead to levy taxes on the occupation of land and
* Mirrlees 2010 do acknowledge that planning regulations can marginally change the supply of land.
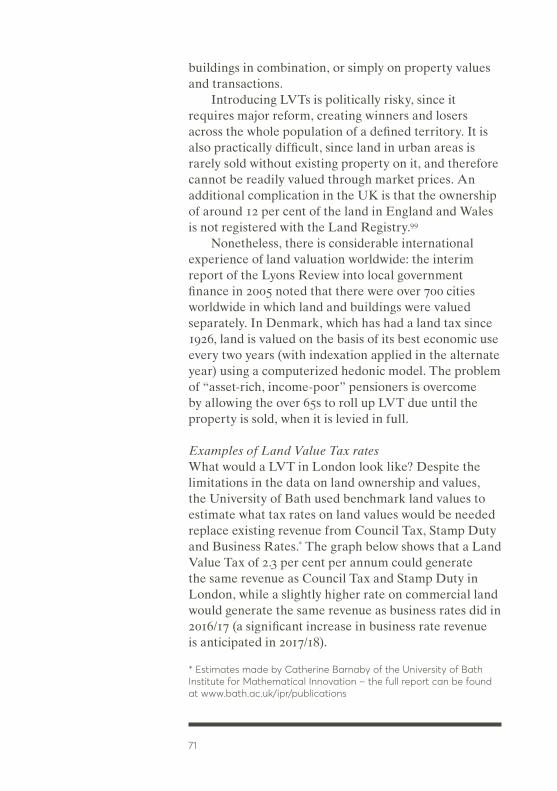
71
buildings in combination, or simply on property values and transactions.
Introducing LVTs is politically risky, since it requires major reform, creating winners and losers across the whole population of a defined territory. It is also practically difficult, since land in urban areas is rarely sold without existing property on it, and therefore cannot be readily valued through market prices. An additional complication in the UK is that the ownership of around 12 per cent of the land in England and Wales is not registered with the Land Registry.99
Nonetheless, there is considerable international experience of land valuation worldwide: the interim report of the Lyons Review into local government finance in 2005 noted that there were over 700 cities worldwide in which land and buildings were valued separately. In Denmark, which has had a land tax since 1926, land is valued on the basis of its best economic use every two years (with indexation applied in the alternate year) using a computerized hedonic model. The problem of “asset‑rich, income‑poor” pensioners is overcome by allowing the over 65s to roll up LVT due until the property is sold, when it is levied in full.
Examples of Land Value Tax ratesWhat would a LVT in London look like? Despite the limitations in the data on land ownership and values, the University of Bath used benchmark land values to estimate what tax rates on land values would be needed replace existing revenue from Council Tax, Stamp Duty and Business Rates.* The graph below shows that a Land Value Tax of 2.3 per cent per annum could generate the same revenue as Council Tax and Stamp Duty in London, while a slightly higher rate on commercial land would generate the same revenue as business rates did in 2016/17 (a significant increase in business rate revenue is anticipated in 2017/18).
* Estimates made by Catherine Barnaby of the University of Bath Institute for Mathematical Innovation – the full report can be found at www.bath.ac.uk/ipr/publications
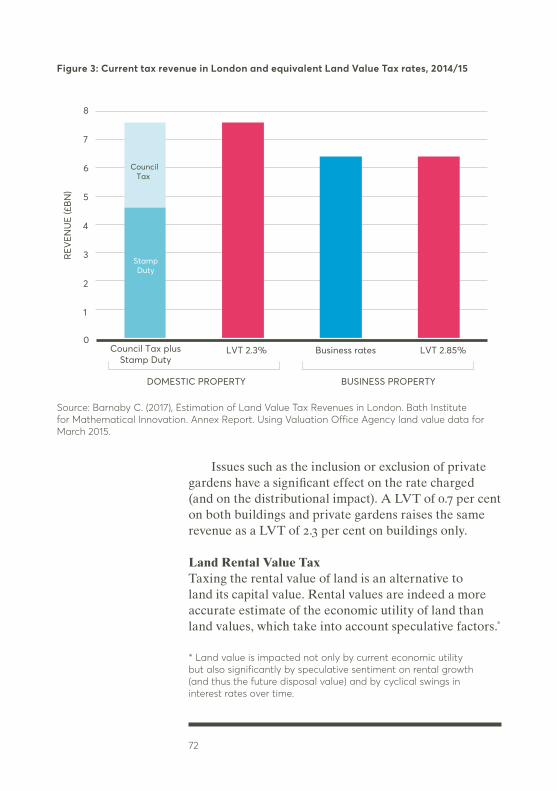
72
Issues such as the inclusion or exclusion of private gardens have a significant effect on the rate charged (and on the distributional impact). A LVT of 0.7 per cent on both buildings and private gardens raises the same revenue as a LVT of 2.3 per cent on buildings only.
Land Rental Value TaxTaxing the rental value of land is an alternative to land its capital value. Rental values are indeed a more accurate estimate of the economic utility of land than land values, which take into account speculative factors.*
* Land value is impacted not only by current economic utility but also significantly by speculative sentiment on rental growth (and thus the future disposal value) and by cyclical swings in interest rates over time.
Figure 3: Current tax revenue in London and equivalent Land Value Tax rates, 2014/15
Source: Barnaby C. (2017), Estimation of Land Value Tax Revenues in London. Bath Institute for Mathematical Innovation. Annex Report. Using Valuation Office Agency land value data for March 2015.
0
1
2
3
4
5
6
7
8
Council Tax plus Stamp Duty
LVT 2.3% Business rates LVT 2.85%
DOMESTIC PROPERTY BUSINESS PROPERTY
REV
ENU
E (£
BN
)
Council Tax
Stamp Duty
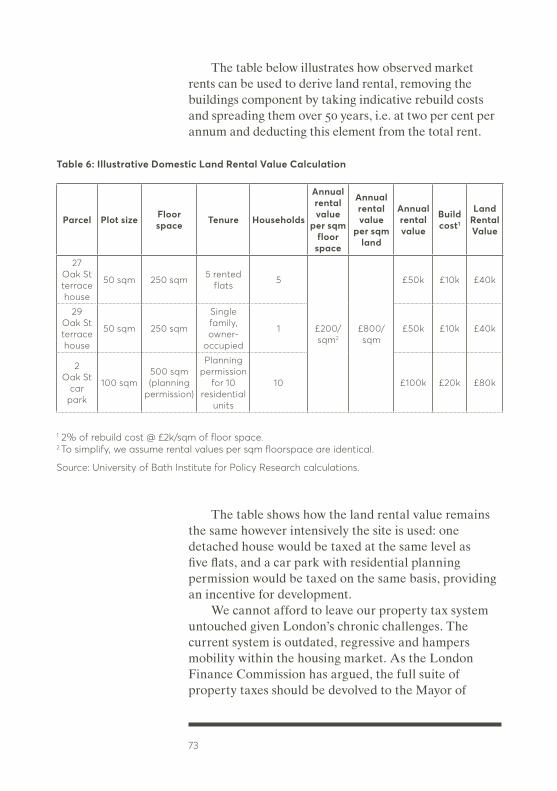
73
The table below illustrates how observed market rents can be used to derive land rental, removing the buildings component by taking indicative rebuild costs and spreading them over 50 years, i.e. at two per cent per annum and deducting this element from the total rent.
The table shows how the land rental value remains the same however intensively the site is used: one detached house would be taxed at the same level as five flats, and a car park with residential planning permission would be taxed on the same basis, providing an incentive for development.
We cannot afford to leave our property tax system untouched given London’s chronic challenges. The current system is outdated, regressive and hampers mobility within the housing market. As the London Finance Commission has argued, the full suite of property taxes should be devolved to the Mayor of
Table 6: Illustrative Domestic Land Rental Value Calculation
Parcel Plot size Floor space Tenure Households
Annual rental value
per sqm floor
space
Annual rental value
per sqm land
Annual rental value
Build cost1
Land Rental Value
27 Oak St terrace house
50 sqm 250 sqm 5 rented flats 5
£200/sqm2
£800/sqm
£50k £10k £40k
29 Oak St terrace house
50 sqm 250 sqm
Single family, owner-
occupied
1 £50k £10k £40k
2 Oak St
car park
100 sqm500 sqm (planning
permission)
Planning permission
for 10 residential
units
10 £100k £20k £80k
1 2% of rebuild cost @ £2k/sqm of floor space.2 To simplify, we assume rental values per sqm floorspace are identical.
Source: University of Bath Institute for Policy Research calculations.

74
London and London boroughs to enable reform and respond to the city’s specific challenges.
Brexit opens the door to and strengthens the case for considering radical options for reform after devolution, to create a tax system that is fairer for Londoners, supports infrastructure and housing delivery, and send better signals to the market. This chapter has reviewed some possible routes for this – including the case for land‑based taxes – and we recommend that further research is undertaken to explore their distributional impacts (in line with the recent report by the London Assembly Planning Committee).100
After over two decades of status quo, any reform to property taxes would create a large number of winners and losers, making transitional arrangements essential. Reform would also require governance reform to enable effective administration and distribution of tax between the Mayor of London and London boroughs. But the reforms reviewed in this chapter should be considered as sequential. Revaluation and reform of Council Tax as a first step (accompanied by the creation of a London Valuation Office to take on these duties) would make marked progress towards fairer and more effective taxes on land in London.


CONCLUSIONS
77
Twelve months after the referendum in which the UK voted to leave the European Union, it is still too early to predict with any degree of certainty what the impact will be for London, especially since the June 2017 general election appears to have re‑opened debates about negotiating remit and red lines. In some respects, the capital’s highly‑globalised economy is less exposed to the risks of Brexit than the rest of the UK, and more ready to grasp the opportunities that might arise: London operates in an economic domain that includes New York, Hong Kong and Kuala Lumpur, as well as Paris, Vienna and Madrid.
From other perspectives, London is far more exposed: our universities, hotels, restaurants, offices and building sites are powered by students and workers from across the EU – to a far greater extent than the rest of the country. And our global city service sectors need urgent clarity on how access to the Single Market will be regulated.
The risks to London’s economy, from the loss of these workers and students, and access to the European Single Market, are considerable. 70,000 jobs could be lost in financial and related services alone. This would be a significant blow for financial services, but not a mortal one – highly‑specialised clusters like financial services and other world city functions are ‘sticky’, and London would still retain the critical mass to be one of the major global centres for financial services. Furthermore, the issues of access to high‑skilled workers and regulatory access to the Single Market are clearly issues that are high up the UK Government’s agenda as it prepares to begin Brexit negotiations in earnest.
But global city status is about more than highly specialised business services. London’s pre‑eminence is not just a product of legal frameworks, access to markets and ease of business operation. It is founded on the city’s strength as a cultural hub, as a centre for education, as a beacon to young people from across the world. Some of the international students who

78
come to London today will be the global decision‑makers of 2040; the young musicians and artists who make ends meet working in restaurants and hotels may be the superstars of the future. These people are the foundations of future success, alongside the thousands of EU nationals who work as delivery drivers, chefs, construction workers and care assistants. London’s success rests on their work as well as on the highly‑prized global talent that fills boardrooms, design studios and trading floors.
So London faces both short‑ and long‑term risks. Falling out of the Single Market without a comprehensive trade deal or adequate transitional arrangements would be catastrophic for many London businesses, as would the sudden loss of EU workers. But the longer‑term risk is more subtle but no less serious – the erosion of the creative edge, liveability and variety that distinguishes London from so many other cities that can offer well‑equipped offices and international airports.
London needs to remain open, and also needs to become more affordable and liveable. It needs to continue to attract students from across the world, and to speak out against attempts to hit arbitrary immigration targets by cutting their numbers: beyond their financial contribution, many overseas students become life‑long ambassadors for London. And it needs to balance a renewed effort to alleviate poverty and unemployment, with an understanding of the scale of labour demanded by sectors like construction, hotels and catering.
Many of the keys to continuing success are in London’s hands. The Mayor and boroughs may not be able to conclude trade agreements or set regulatory frameworks, but they can make London more open and affordable to live and travel in, and can augment the soft power that is rooted in education and culture. The Mayor has clearly identified affordability of housing and transport, and the importance of the cultural sector, as priorities.
79
As the new government plunges into Brexit negotiations, the Mayor should take a more prominent role pressing London’s case. He should do so in alliance with newly‑elected metro mayors and other city leaders, who have a common interest in openness to trade and migration, large student populations, and growing strength in knowledge‑based service sectors. In particular – each of the main cities in the UK alongside London, from Manchester and Glasgow, to Bristol and Newcastle, has an airport that is vital for regional trade and tourism. Securing continued membership of the European Common Aviation Area should be an early priority for the city leaders in the Brexit negotiations.
London is a powerful global city, with acknowledged strengths in higher education, finance, business services, architecture and other service sectors, and should speak with a powerful voice. The continuing economic success of these sectors is not just important to the capital, but to the nation as a whole: London contributes almost a third of economic taxes in the UK.101 It may be that resentment of ‘London’ was a factor in the EU referendum, but the neither capital nor country can afford for London to decline economically or to retreat from international engagement.
The Mayor should build on the ‘London is Open’ campaign to maintain London’s global presence, while at the same time pushing for the devolution of tax‑raising and service delivery powers that will enable the capital and its people to thrive, alongside the other conurbations that have just elected their own mayors. Our report argues that the urgency of Brexit strengthens the case for a substantial package of devolution, which acknowledges that London’s needs are different from the rest of the UK’s, and that systems that try to work for every region tend to work well for none.
We have argued that London needs to be able to ensure that it can access the talent it needs, through a regionally managed migration integrated with devolved funding and responsibility for post‑school training, and employment programmes. We have also

80
argued that London needs to take control of its own property tax regime, to help damp down the irrational exuberance of the London property market, to generate funding for housing and infrastructure, and to create incentives for more efficient use of land and buildings.
Summary of recommendations
• The Mayor of London should join with the mayors and leaders of the UK’s major cities and combined authorities to form a Convention of City Leaders on Brexit, and the next Government should actively engage with these cities, to ensure that their needs are properly addressed in negotiations and further devolution.
• The Government should commit to devolving responsibility for early years education and childcare to London and other cities, and give them greater control over apprenticeships and other skills funding.
• The Government should introduce a regionally‑managed migration system, with different regions able to define their skills needs and to agree work permit quotas with Government.
• In London’s case, one‑year ‘City Maker Visas’ would allow European citizens to visit the city to look for employment or start‑up opportunities, with fast‑track work permits for those who are successful.
• The Government should also extend working holiday visas to the EU, allowing easy access for young people for two years, with fast tracked work permit applications permitted at the end of that period.
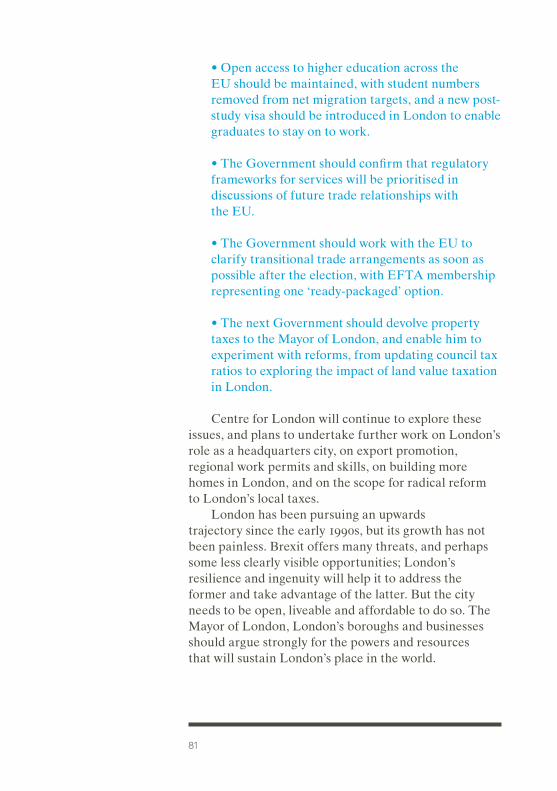
81
• Open access to higher education across the EU should be maintained, with student numbers removed from net migration targets, and a new post‑study visa should be introduced in London to enable graduates to stay on to work.
• The Government should confirm that regulatory frameworks for services will be prioritised in discussions of future trade relationships with the EU.
• The Government should work with the EU to clarify transitional trade arrangements as soon as possible after the election, with EFTA membership representing one ‘ready‑packaged’ option.
• The next Government should devolve property taxes to the Mayor of London, and enable him to experiment with reforms, from updating council tax ratios to exploring the impact of land value taxation in London.
Centre for London will continue to explore these issues, and plans to undertake further work on London’s role as a headquarters city, on export promotion, regional work permits and skills, on building more homes in London, and on the scope for radical reform to London’s local taxes.
London has been pursuing an upwards trajectory since the early 1990s, but its growth has not been painless. Brexit offers many threats, and perhaps some less clearly visible opportunities; London’s resilience and ingenuity will help it to address the former and take advantage of the latter. But the city needs to be open, liveable and affordable to do so. The Mayor of London, London’s boroughs and businesses should argue strongly for the powers and resources that will sustain London’s place in the world.
82
ENDNOTES
1. The Proceedings of Old Bailey, London’s Central Criminal Court, 1674–1913. See www.oldbaileyonline.org/static/Population-history-of-london.jsp
2. Hall, P. (1966). The world cities. London: Weidenfeld and Nicolson.
3. Taylor, P. J., Derudder, B., Faulconbridge, J., Hoyler, M., Ni, P. (2014). Advanced Producer Service Firms as Strategic Networks, Global Cities as Strategic Places. Economic Geography, 90: 267–291. See also: Beaverstock, J. V., Smith, R. G., Taylor, P. J. (1999). A roster of world cities. Cities, 16(6), 445–458.
4. Deloitte, London Futures: London crowned business capital of Europe, 2014.
5. Often termed ‘advanced producer services’: See Taylor, P. J. (2011). Advanced producer service centres in the world economy. Global urban analysis: A survey of cities in globalization, 22–39.
6. Storper, M., Kemeny, T., Makarem, N., Osman, T. (2015). The Rise and Fall of Urban Economies: Lessons from San Francisco and Los Angeles. Stanford University Press, p23.
7. Graham, D. J. (2007). Agglomeration, productivity and transport investment. Journal of transport economics and policy (JTEP), 41(3), 317–343.
8. Cheshire, P. C., Nathan, M., Overman, H. G. (2014). Urban economics and urban policy: Challenging conventional policy wisdom. Edward Elgar Publishing.
9. See Gordon, I., Champion, T., Coombes, M. (2015). Urban escalators and interregional elevators: the difference that location, mobility, and sectoral specialisation make to occupational progression. Environment and Planning A, 47(3), 588–606.
10. Keijonen, M. (2015). An analysis of London’s exports, GLA Economics, Working Paper 69.
11. PricewaterhouseCoopers (2016). Cities of opportunity 7.12. Oxford University Centre for Business Taxation (2015).
Business Taxation under the Coalition Government. Edited by Giorgia Maffini.
13. Sriskandarajah D. (2015). Global civil society: London’s role. London Essays, Soft Power. Centre for London.
14. See QS World University Rankings 2016–2017.15. Glaeser, E. L., Kolko, J., Saiz, A. (2001). Consumer city.
Journal of economic geography, 1(1), 27–50.16. ONS, Annual Population Survey 2015.17. British social values survey, Self-reported racial prejudice.18. PricewaterhouseCoopers 2016.
83
19. Corlett A., Finch D., Whittaker M. (2016). Living Standards 2016. The experiences of low to middle income households in downturn and recovery. Resolution Foundation.
20. Clark S., Corlett A., Judge L. (2016) The Housing Headwind. Resolution Foundation.
21. GLA Economics (2016). Economic Evidence Base for London 2016. Water supply and drainage, p295–296
22. Aldridge et al. (2015). London’s Poverty Profile. New Policy Institute, Trust for London, Figure 3.3, p24.
23. ONS, Labour Force Survey 2015.24. UK Government. The government’s negotiating objectives
for exiting the EU: PM speech. 17 January 2017.25. Keijonen 2015.26. Theseira, M. (2014). Trading Places; Maximizing London’s
Exports Potential. Centre for London.27. Los et al. 2017.28. McCann, P. (2016). The UK regional–national economic
problem: Geography, globalisation and governance. Routledge.29. Los, B., McCann, P., Springford, J., Thissen, M. (2017). The
mismatch between local voting and the local economic consequences of Brexit. Regional Studies, 1–14.
30. House of Lords European Union Committee (2017). Brexit: trade in non-financial services. Authority of the House of Lords.
31. Kharas, H., Gertz, G. (2010). The new global middle class: A cross-over from West to East. Wolfensohn Center for Development at Brookings, 1–14.
32. McCann 2016.33. Theseira 2014.34. Keijonen 2015.35. Oliver Wyman (2016). The impact of the UK’s exit from the
EU on the UK-based financial services sector.36. TheCityUK (2016). The impact of Brexit on the UK-based
legal services sector.37. House of Lords European Union Committee 2017.38. House of Lords European Union Committee 2017.39. IATA, The Impact of Brexit on UK Air Transport, June 2016.40. House of Lords European Union Committee 2017.41. House of Lords European Union Committee 2017.42. House of Lords European Union Committee 2017.43. House of Lords Select Committee on the European
Union (2017). Corrected oral evidence: Brexit: Future Trade between the UK and the EU. http://data.parliament.uk/writtenevidence/committeeevidence.svc/evidencedocument/eu-internal-market-subcommittee/brexit-future-trade-between-the-uk-and-the-eu-in-services/oral/42064.html
84
44. ONS (2016) International immigration and the labour market, UK: regional data. For definition of skill levels, see: ONS (2016). Article: International immigration and the labour market, UK: 2016.
45. GLA (2016). Long-term labour market projections.46. ONS Provisional Long-term International Migration 2001–
2014, based on ONS International Passenger Survey.47. Portes J., Forte G. (2016). The Economic Impact of Brexit-
induced Reductions in Migration. National Institute of Economic and Social Research.
48. Portes J. (2016) Brexit, Migration and the UK Economy. www.niesr.ac.uk/blog/brexit-migration-and-uk-economy#.WJMhykWLRZh
49. Rolfe, H., Rienzo, C., Lalani, M., Portes, J. (2013). Migration and productivity: employers’ practices, public attitudes and statistical evidence. National Institute of Economic and Social Research.
50. Hunt, J., Gauthier-Loiselle, M. (2010). How much does immigration boost innovation?. American Economic Journal: Macroeconomics, 2(2), 31–56.
51. Nathan, M., Lee, N. (2011). Does cultural diversity help innovation in cities. Evidence from London’s firms. SERC Discussion Paper69, Spatial Economics Research Centre, LSE.
52. Higher Education Statistics Agency (2015).53. UCAS (2017). Applicants by domicile at the 15
January deadline.54. Glaeser, E. L. (2012). Triumph of the city: how our greatest
invention makes us richer, smarter, greener, healthier, and happier. New York, NY: Penguin Books.
55. ONS, Labour Force Survey, 2017.56. ONS, Employment in London and UK by parental status,
sex, ethnicity, 2012 to 2015, User Requested Data Ref 005893, 8 July 2016.
57. Child Poverty Action Group. Child Poverty in London – key facts. www.cpag.org.uk/campaigns/child-poverty-london/keyfacts
58. Butler, A., Rutter, J. (2016). Creating an anti-poverty childcare system.
59. Department for Education (2016). Early years national funding formula: local authority allocations – 2017 to 2018 financial year.
60. Department for Communities and Local Government (2017). Self-sufficient local government: 100% Business Rates Retention Consultation: Summary of responses and Government response.
61. London Councils, London Enterprise Panel, Mayor of London (2015). Skills Devolution for London: A Proposal to Government, p24.
85
62. London Assembly Economic Committee (2017). Apprenticeships: an un-level playing field.
63. London Finance Commission (2017). Devolution – a capital idea. Greater London Authority and Mayor of London (2017). London’s Global and European Future.
64. Mayor of London (2017). London’s Global and European Future.
65. UK Government, The Government’s negotiating objectives for exiting the EU: PM speech. 17 January 2017.
66. PricewaterhouseCoopers (2016). Regional Visas: A unique immigration solution?
67. London Chamber of Commerce and Industry (2016). Permits and Points, securing practical immigration for post-Brexit London.
68. Judge, L. and Tomlinson, D. (2016). Secret agents: agency workers in the new world of work. Resolution Foundation.
69. UK Government, The Government’s negotiating objectives for exiting the EU: PM speech. 17 January 2017.
70. Hanna, K. (2016). Londoners’ Views on Brexit. Centre for London.
71. Park, Alison et al. (2014). British Social Attitudes 31, NatCen.72. Quoted in Dickie, M., Social Visa schemes for regions
rejected, Financial Times, 28 October 2016.73. ONS. International trade in services: 2014.
Statistical Bulletin.74. Theseira M, Trading places: maximizing London’s exports
potential, Centre for London, 201475. ONS. House Price Index, December 2016.76. Social Market Foundation (2016). London employers and
assistance to employees with housing, 2016.77. Travers T., Sims S., Bosetti N. (2016). Housing and
Inequality in London. Centre for London.78. DCLG (2016). LiveTable122: Housing supply; net additional
dwellings, by local authority district, England 2001–02 to 2015–16.
79. Martin E. (2016). Just how overcrowded has transport in London become? Business Analytics Blog. Capgemini.
80. Crossrail 2. Funding. How would Crossrail 2 be funded?81. National Infrastructure Commission (2016). Transport for
a World City.82. Arup (2014). The cost of London’s long term infrastructure.83. Blakely, G. (2017). Paying for our progress: how will the
Northern Powerhouse be financed and funded? IPPR North.84. Brown R. and Wilson B. (2016). Going Large: making the
most of London’s large sites. Centre for London.85. Hanna K., Oduwaiye A. and Redman P. (2016). Another
Storey: the real potential for estate regeneration. Centre for London.
86
86. Hanna K. (2015). Fair to Middling: report of the Commission on Intermediate Housing. Centre for London.
87. Barrett S. and Dilke T. (2017). Strength in Numbers: funding and building more affordable housing in London. Centre for London.
88. Ratcliffe J. (2016). In No Uncertain Terms: securing long term investment for genuinely affordable homes. Centre for London.
89. Sims S., Roberts J. and Wilson B. (2016). Turning South London Orange: reforming suburban rail to support London’s next wave of growth. Centre for London.
90. Slack E. (2016). International Comparisons of Global City Financing: A Report to the London Finance Commission. Institute on Municipal Finance and Governance Munk School of Global Affairs. University of Toronto.
91. Mirrlees, J. A., Adam, S. (2010). Dimensions of tax design: the Mirrlees review. Oxford University Press.
92. Wingham M. (2017). Council tax in London. A publication for the London Finance Commission. Working Paper 80. GLA Economics.
93. Transport for London. Infrastructure investment and land value uplift. Presentation to the London Finance Commission 20.10.2016.
94. London Finance Commission 2017.95. Transport for London (2017). Land Value Capture.96. Marsden J. (2015). House prices in London – an economic
analysis of London’s housing market. Working Paper 72. GLA Economics. and Portico. London Rental Yield Map. www.portico.com/yields (accessed on 27.04.2017).
97. Wingham 2017.98. Mirrlees 2010.99. HM Land Registry (2016). Annual Report and Accounts
2015/16.100. London Assembly Planning Committee (2016). Tax Trial:
A Land Value Tax for London.101. McGough L and Piazza G, 10 years of tax: how cities
contributed to the national exchequer from 2004/05 to 2014/15. Centre for Cities, 2016.

Brexit is probably the most dramatic event in London’s history in a generation. London is facing a major change in its relationship to Europe, and with it, to the rest of the world. This report considers the challenges Brexit poses for London’s position as a global city and seeks to set out the most urgent areas for action. Some of these are about influencing the Brexit negotiations, to ensure the best possible outcome for London and the rest of the UK; others are about using Brexit as an opportunity for London to develop innovative solutions to its long-term problems.
© Centre for London, 2017
OPEN
CITY: LO
ND
ON
AFTER B
REX
IT Richard B
rown and N
icolas Bosetti