open for business - shusterman law · pdf fileopen for business how immigrants are ... 2...
TRANSCRIPT

OPEN FOR BUSINESSHOW IMMIGR ANTS ARE DRIVING
SMALL BUSINESS CREATION IN THE UNITED STATES
A REPORT BY THE PARTNERSHIP FOR A NEW AMERICAN ECONOMY
— AUGUS T 2012 —

The Partnership for a New American Economy brings together more than 450 Republican, Democratic, and Independent mayors and business leaders who support immigration reforms that will help create jobs for Americans today. The Partnership’s members include mayors of more than 35 million people nationwide and business leaders of companies that generate more than $1.5 trillion and employ more than 4 million people across all sectors of the economy, from Agriculture to Aerospace, Hospitality to High Tech, and Media to Manufacturing. Partnership members understand that immigration is essential to maintaining the productive, diverse, and flexible workforce that America needs to ensure prosperity over the coming generations.
Learn more at: www.renewoureconomy.org
REPORT AUTHORED BY ROBERT W. FAIRLIE
Professor of Economics University of California, Santa Cruz
Executive Summary . . . . . . . . . . . . . . . . . . . . . . . . . . . . . . . . . . . . . . . . . . . . . . . . . . . . . . . . . . . . . . . . . . . . . .2
1 Introduction . . . . . . . . . . . . . . . . . . . . . . . . . . . . . . . . . . . . . . . . . . . . . . . . . . . . . . . . . . . . . . . . . . . . . . . .4
2 Immigrant Entrepreneurs Start Businesses at Growing Rates While Native-Born Entrepreneurship Falters . . . . . . . . . . . . . . . . . . . . . . . . . . . . . . . . . . . . . . . . . . . . . . . .6
3 Immigrant-Owned Firms Drive the U.S. Export Economy . . . . . . . . . . . . . . . . . . . . . . . . . . . . . . . . . . . . .10
4 Immigrant-Owned Businesses Generate Substantial Business Income and Revenue . . . . . . . . . . . . . . . . 12
5 Immigrant-Owned Businesses Create Millions of Jobs and Pay Out Billions of Dollars in Employee Salaries . . . . . . . . . . . . . . . . . . . . . . . . . . . . . . . . . . . . . . . . 14
6 Immigrant-Owned Businesses Power Many Sectors of the American Economy . . . . . . . . . . . . . . . . . . . .16
7 Immigrants Punch Above Their Weight in States Across the Country . . . . . . . . . . . . . . . . . . . . . . . . . . . . .20
8 Immigrant Entrepreneurs in the United States Come from Around the World . . . . . . . . . . . . . . . . . . . . . .22
9 Immigrants of All Education Levels Are Contributing to Business Creation and Growth . . . . . . . . . . . . . .24
Conclusion . . . . . . . . . . . . . . . . . . . . . . . . . . . . . . . . . . . . . . . . . . . . . . . . . . . . . . . . . . . . . . . . . . . . . . . . . . . .26
Appendices . . . . . . . . . . . . . . . . . . . . . . . . . . . . . . . . . . . . . . . . . . . . . . . . . . . . . . . . . . . . . . . . . . . . . . . . . . .28
References . . . . . . . . . . . . . . . . . . . . . . . . . . . . . . . . . . . . . . . . . . . . . . . . . . . . . . . . . . . . . . . . . . . . . . . . . . . .34
OPEN FOR BUSINESS 1
OPEN FOR BUSINESSHOW IMMIGRANTS ARE DRIVING SMALL BUSINESS CREATION IN THE UNITED STATES
THE A XIOM THAT SMALL BUSINESSES DRIVE JOB GROW TH IS NOT QUITE CORRECT. IT IS YOUNG BUSINESSES THAT DRIVE JOB GROW TH.
Businesses under five years old are responsible for all net job creation over the past three decades in America.1 Unfortunately, the rate of new-business generation is declining: In 2010, it reached the low-est rate in the 30-year history of recorded data.2 So as America attempts to grow its way out of the re-cession and create more jobs for American work-ers, new-business generation should be one of, if not the, primary focus of our economic strategy.
This report examines and assesses a critical driver of new business creation in America: entre-preneurial immigrants. Leaving one’s home and immigrating to a new country to start a new life is itself an entrepreneurial act, so it is perhaps un-surprising that immigrants are disproportionately entrepreneurial.
Previous research has shown how greatly we depend on immigrant entrepreneurs. The Partner-ship for a New American Economy found that im-migrants or their children founded more than 40 percent of America’s Fortune 500 companies, and the Fiscal Policy Institute recently reported that immigrants now own more than 18 percent of all incorporated businesses in the United States.
This report shows that the prevalence of immigrant entrepreneurs and their importance to the U.S. economy are only growing. Over the last 15 years, while native-born Americans have become less likely to start a business, immigrants have steadily picked up the slack. Immigrants are now more than twice as likely as the native-born to start a busi-ness and were responsible for more than one in every four (28 percent) U.S. businesses founded in 2011, significantly outpacing their share of the population (12.9 percent).
Relying on the American Community Survey, the Current Population Survey, and the Survey of Business Owners, this report analyzes the expand-ing role that immigrant entrepreneurs play in our economy. While their businesses tend to be smaller than those started by their native-born counter-parts, collectively immigrant businesses are having an enormous impact on the U.S. economy. Immi-grant-owned businesses now employ one out of every ten U.S. workers at privately owned-compa-nies and add more than $775 billion dollars of rev-enue to the U.S. gross domestic product.
From new laundromats in the neighborhood to new listings on NASDAQ, immigrants are making their mark – playing an ever-increasing role in start-ing new businesses, creating jobs, increasing ex-ports, and growing the economy. Even more remark-able, immigrant entrepreneurship is increasing at a time when the economy has lagged. As the country looks for ways to generate economic growth and new jobs, any serious discussion must include the growing impact of immigrants as drivers of new-business creation.
2 PARTNERSHIP FOR A NEW AMERICAN ECONOMY
EXECUTIVE SUMMARY
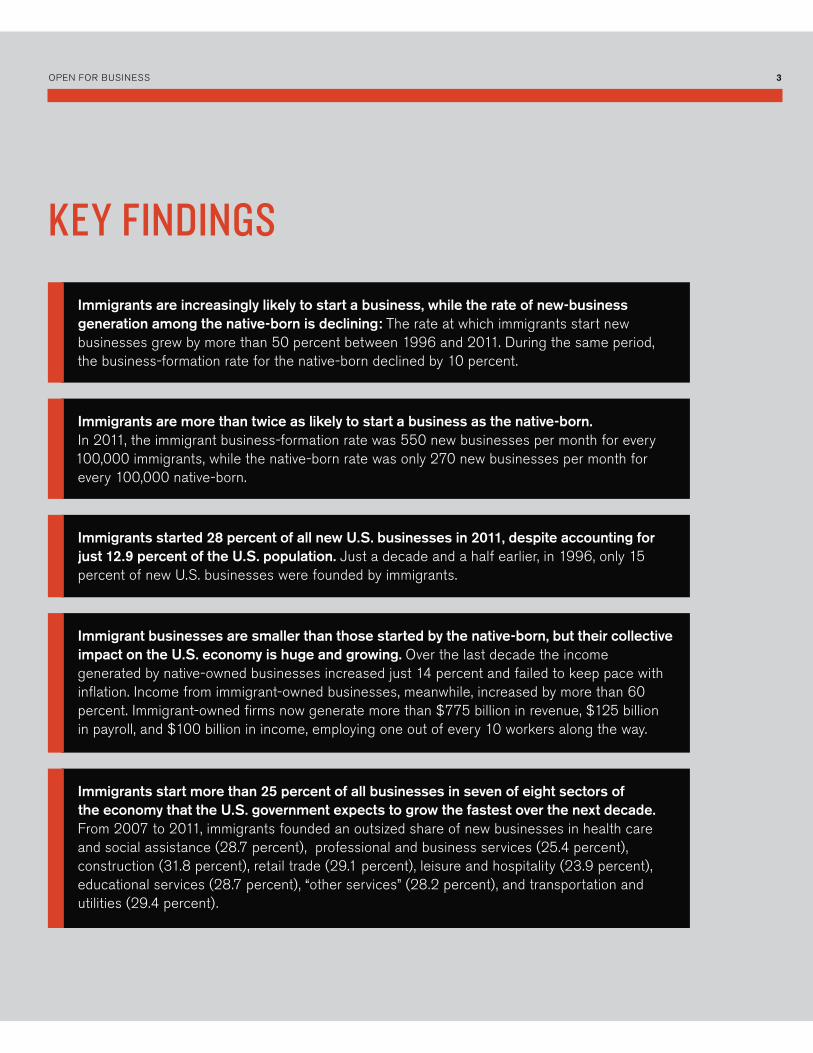
Immigrants are increasingly likely to start a business, while the rate of new-business generation among the native-born is declining: The rate at which immigrants start new businesses grew by more than 50 percent between 1996 and 2011. During the same period, the business-formation rate for the native-born declined by 10 percent.
Immigrants are more than twice as likely to start a business as the native-born. In 2011, the immigrant business-formation rate was 550 new businesses per month for every 100,000 immigrants, while the native-born rate was only 270 new businesses per month for every 100,000 native-born.
Immigrants started 28 percent of all new U.S. businesses in 2011, despite accounting for just 12.9 percent of the U.S. population. Just a decade and a half earlier, in 1996, only 15 percent of new U.S. businesses were founded by immigrants.
Immigrant businesses are smaller than those started by the native-born, but their collective impact on the U.S. economy is huge and growing. Over the last decade the income generated by native-owned businesses increased just 14 percent and failed to keep pace with inflation. Income from immigrant-owned businesses, meanwhile, increased by more than 60 percent. Immigrant-owned firms now generate more than $775 billion in revenue, $125 billion in payroll, and $100 billion in income, employing one out of every 10 workers along the way.
Immigrants start more than 25 percent of all businesses in seven of eight sectors of the economy that the U.S. government expects to grow the fastest over the next decade. From 2007 to 2011, immigrants founded an outsized share of new businesses in health care and social assistance (28.7 percent), professional and business services (25.4 percent), construction (31.8 percent), retail trade (29.1 percent), leisure and hospitality (23.9 percent), educational services (28.7 percent), “other services” (28.2 percent), and transportation and utilities (29.4 percent).
OPEN FOR BUSINESS 3
KEY FINDINGS

INTRODUCTION
4 PARTNERSHIP FOR A NEW AMERICAN ECONOMY
Alex Torrenegra saw a computer for the first time at his grandfather’s office in Bogota, Colombia when he was 4 years old, and he knew immediately that he needed to have one. Computers were not preva-lent in Colombia at the time, so it took Alex until he was 14 years old to obtain one. But it didn’t take him long to figure out how to use it. The same year he got a computer he founded his first computer busi-ness to offer IT solutions to small and mid-sized Co-lombian companies. By the time he was 19 he al-ready had 20 employees working for him.
Alex left Colombia with his family in 1998 for security reasons and came to the United States, where he found not only safety, but also a ripe en-vironment to put his entrepreneurial savvy to work. The first computer company he founded in the United States hired six employees in its first year. That success inspired Alex to become a serial en-trepreneur founding roughly a dozen companies that together transact about $35 million each year.
Alex’s latest venture, VoiceBunny.com, uses pat-ented technology to connect voiceover artists with companies that need them. VoiceBunny already employs 11 people in the United States, has a pool of over 100,000 voiceover artists using the site, and has clients that include the movie giant Pixar. The company even engages in what is effectively reverse-outsourcing, since many of its clients are overseas companies that hire American voiceover artists to promote their products.3
Alex’s story is repeated throughout the economy every day. From Vietnamese immigrant Nancy Nguy-en’s burgeoning Sweet T Salon in Raleigh, North Carolina to the empire that Belgian immigrant Liz Claiborne launched with her eponymous fashion line, more than four thousand immigrants start new busi-nesses in America every day.4 Their path to come here is often fraught with legal, economic, and social obstacles, but the entrepreneurial opportunities that await them in America are enough to draw many of the most creative, risk-taking individuals in the world. As the findings of this report demonstrate, millions of Americans have their jobs today because of busi-nesses founded by immigrants, and more than $100 billion dollars in income is generated each year by immigrant-owned businesses.
Past research has shown that immigrants play an enormous role in founding American businesses, including a recent study by the Fiscal Policy Insti-tute that found that immigrants own 18 percent of incorporated businesses.5 As this report explains, U.S. dependence on immigrant entrepreneurs is only increasing, while native-born entrepreneurial-ism has faltered. As the U.S. attempts to grow its way out of the recession, new-business creation by native-born Americans has hit a 30-year low. But immigrant entrepreneurs are filling the gap and starting more businesses, creating more jobs, and bringing more revenue to the economy, facts that should be critical to policymakers looking for viable ways to promote economic recovery.
To quantify the rise of immigrant entrepreneurship, this report relies on three nationally representative datasets – the 2006-2010 American Community Survey (ACS), the 2007-2011 Current Population Survey (CPS), and the 2007 Survey of Business Owners (SBO). These datasets allow for analysis of the role that immigrants and the native-born have in starting businesses, generating business reve-nue and income, employing workers, and growing our export economy.6 And to better understand who the new immigrant entrepreneurs are and in what regions and industries they are having the most impact, the report also examines where im-migrant business owners come from, what sectors of the economy they contribute to most, and which states are the most impacted by their contributions.
The findings demonstrate that immigrant entre-preneurs like Alex Torrenegra are playing a large and increasing role in creating American jobs, ex-porting goods, and driving the U.S. economy.
‘96 ‘97 ‘98 ‘99 ‘00 ‘01 ‘02 ‘03 ‘04 ‘05 ‘06 ‘07 ‘08 ‘09 ‘10 ‘11
700
600
500
400
300
200
100
0
NUM
BER
OF N
EW B
USIN
ESS
OWNE
RS P
ER M
ONTH
PE
R 10
0,00
0 AD
ULTS
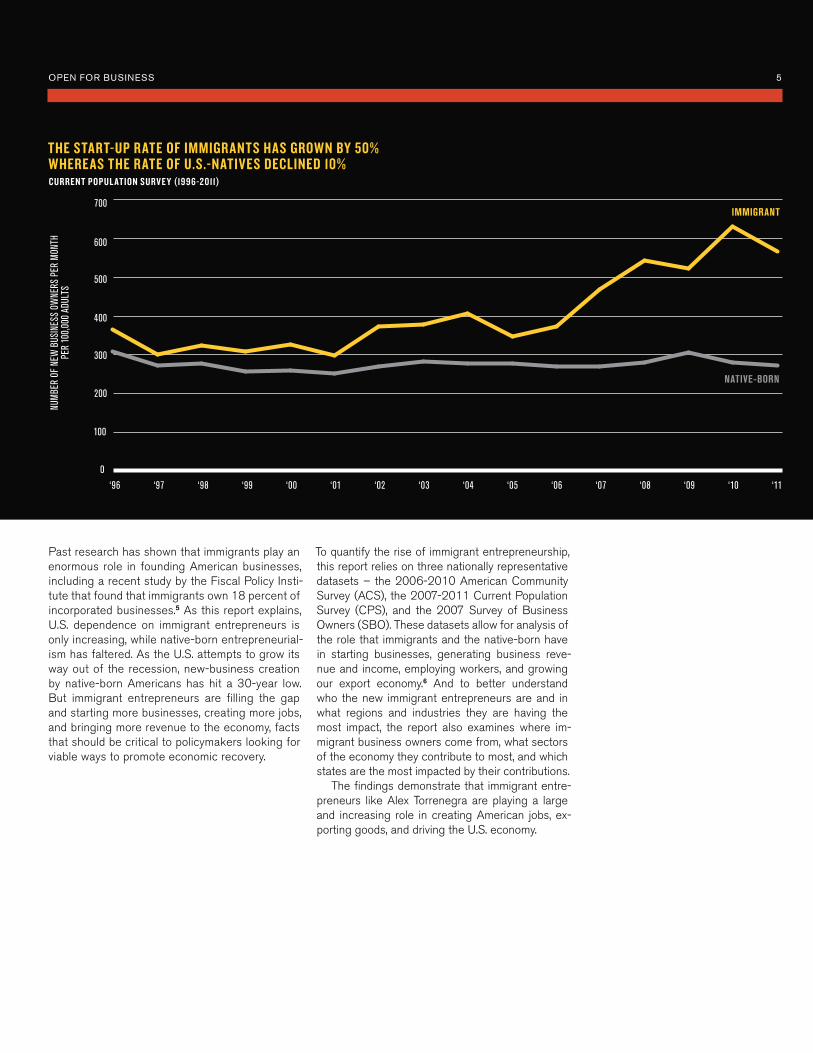
THE START-UP R ATE OF IMMIGR ANTS HAS GROWN BY 50% WHEREAS THE R ATE OF U.S.-NATIVES DECLINED 10%CURRENT POPUL ATION SURV E Y (1996-2011)
IMMIGRANT
NATIVE-BORN
OPEN FOR BUSINESS 5

Young businesses are essential to job creation. After reviewing 30 years of Census Bureau busi-ness data, the Kauffman Foundation found that startups create an average of 3 million new jobs in their first year, and that without them, “there would be no net job growth in the U.S. economy.”7 Re-forms to encourage startup activity are central to the job growth strategies of both Republican and Democratic leaders. A recent example is the Jump-start Our Business Startups (JOBS) Act, a bill to make it easier to finance new startups that was introduced by House Republicans and signed into
law by President Obama in April of 2012, out of a belief that “small businesses and startups are driv-ing the recovery and job creation.” 8
Unfortunately, the rate of new startups in the U.S. has fallen dramatically since 2006, and in 2010 reached the lowest rate in 30 years of recorded data.9 But even as the overall startup rate declines, immigrant entrepreneurs are playing an increasingly important role in new-business creation across the United States, and many are stepping up to fill that role at a crucial time for our economy.
IMMIGR ANT ENTREPRENEURS START BUSINESSES AT GROWING R ATES WHILE NATIVE-BORN ENTREPRENEURSHIP FALTERS
6 PARTNERSHIP FOR A NEW AMERICAN ECONOMY
KEY FINDINGS
28 percent of all new small businesses started in the United States in 2011 were founded by immigrants.
The business startup rate of immigrants has increased by more than 50 percent since 1996, while the business startup rate of the native-born has decreased by 10 percent over the same time period.
Immigrants are now more than twice as likely to start a business as their native-born counterparts.
OPEN FOR BUSINESS 7
30 %
25%
20 %
15%
10 %
5%
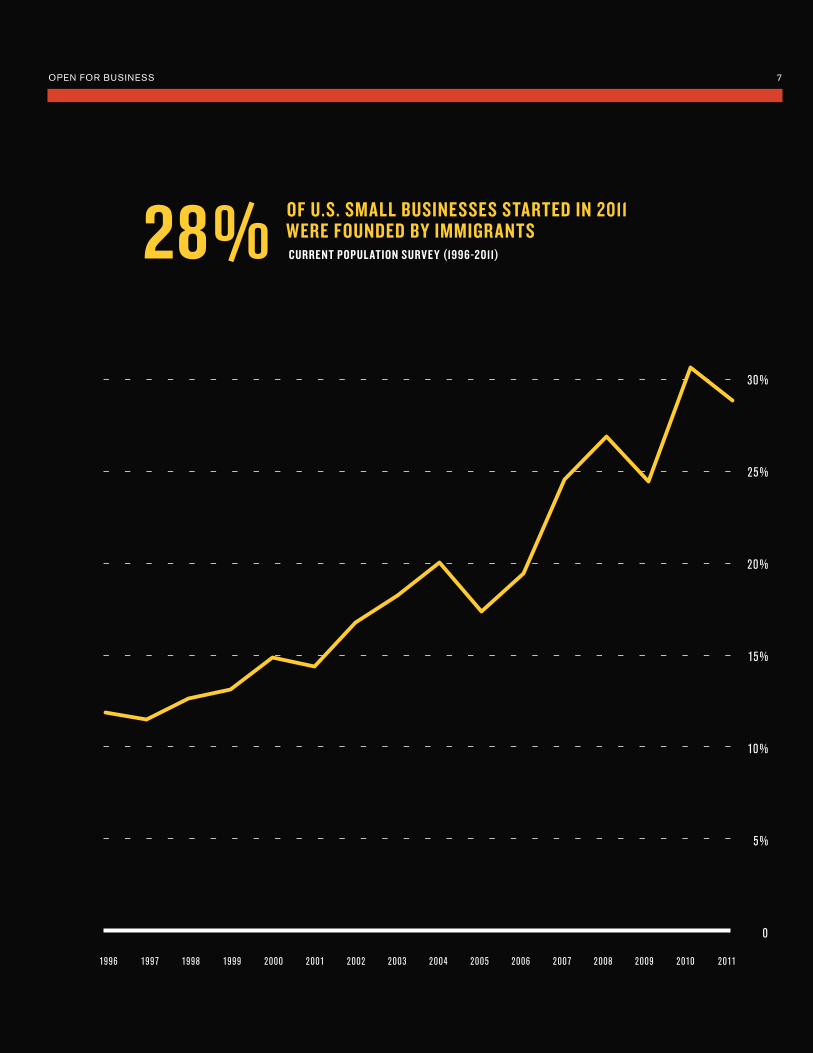
28% OF U.S. SMALL BUSINESSES STARTED IN 2011 WERE FOUNDED BY IMMIGR ANTS CURRENT POPUL ATION SURVE Y (1996-2011)
0
1996 2004 20082002 2006 201020012000199919981997 2005 20092003 2007 2011
8 PARTNERSHIP FOR A NEW AMERICAN ECONOMY
U.S. Census data makes clear that we are in-creasingly relying on immigrant entrepreneurs to drive new business growth in America. Twenty-eight percent of all new businesses started in the United States in 2011 had immigrant founders. Not only does this number far outpace the immi-grant share of the U.S. population (12.9 percent) and the U.S. workforce (16.3 percent), but it also represents a substantial jump over the role immi-grant entrepreneurs played in the U.S. just 15 years earlier. In 1996 immigrant entrepreneurs started 15 percent of all new businesses in Amer-ica, which exceeded their share of the population at the time (roughly 9 percent10). While some of the growth experienced from 1996 to 2011 was the result of immigrants’ increasing share of the workforce and population, most of the growth was due to the fact that immigrants are becoming in-creasingly entrepreneurial. In 1996 the business-formation rate for immigrants was 360 business-es started per month for every 100,000 immigrants. By 2011 this number had jumped to 550 businesses per month for every 100,000 im-migrants, an increase of more than 50 percent.
An increase in the business-formation rate of immi-grants could not have come at a better time, consid-ering that the native-born population became less likely to start a business over the 15-year period from 1996 to 2011. The native-born business for-mation rate declined 10 percent during that period, dropping from 300 new businesses per month per 100,000 native-born to just 270 new businesses monthly. So while immigrants were 20 percent more likely to start a business in 1996, their increasing business-formation rate and the declining native-born business-formation rate meant that by 2011, immigrants were more than twice as likely to start a business as the native-born.
OPEN FOR BUSINESS 9
ROHIT ARORAHELPING MORE ENTREPRENEURS ACHIEVE THE AMERICAN DREAM
Rohit Arora, an immigrant entrepreneur from India, noticed something surprising in the mid-2000s, when he was working at Deloitte Consulting in New York City: Despite small businesses being among banking institutions’ most profitable loan clients, many entrepreneurs and small business owners from South Asia and India seemed to be having trouble securing bank loans— even though such entrepreneurs boasted low default rates. In some less desirable neighborhoods, the problem was particularly acute, inhibiting the success of local businesses like gas stations, grocery stores, and medical practices. “Like any global entrepreneur,” Arora says, “I wanted to do something that would have a big impact.” So in 2007, Arora and his brother Ramit, who had long dreamed of founding a business together, started Biz2Credit, a New York City-based firm that helps match small business owners with banking loans, credit reports, and other financial products.
Much like Arora imagined, his company is already dramatically changing the way many immigrant entrepreneurs access bank loans. Biz2Credit’s online platform lets small business owners—both immigrants and non-immigrants — upload information online that can be viewed by the company’s nationwide network of more than 1,000 financial institutions. Monthly subscribers are also able to tap into additional benefits like financial advice or in-person meetings with Biz2Credit’s loan specialists.
Arora says that by connecting small businesses with the capital they need to expand, Biz2Credit has contributed to the creation of more than 11,000 new jobs since its founding in 2007. The firm is on target this year to facilitate $600 million in new business loans, up from $200 million just two years ago. “The work,” Arora says, “is incredibly fulfilling.”
The company has also created its own jobs. Biz2Credit currently employs about 25 people in the United States, many of them highly experienced loan specialists, and the business continues to expand. Arora, a native of Delhi, says he’s proud of what he has built in the United States, a country he moved to in 2003 to pursue an MBA degree at Columbia University. But he frequently meets would-be immigrant entrepreneurs, however, who head home after being unable to secure visas. “Our business has created real opportunities for people in America,” Arora says, “but many entrepreneurs never have that chance.”11
These two factors – the increase in entrepreneurial-ism of immigrants combined with the decrease in entrepreneurialism of the native-born – resulted in immigrants owning a growing share of all business-es in America. In the year 2000, when immigrants accounted for 11.1 percent of the U.S. population, they owned 12 percent of all U.S. businesses, roughly equal to their share of the population. But by 2010, when the immigrant share of the U.S. popula-tion had risen to 12.9 percent, their share of busi-ness ownership greatly exceeded it, and they left the decade owning a full 20 percent of all U.S. busi-nesses.
Perhaps the part of the economy benefitting most from the increased prominence of immigrant-started U.S. businesses has been U.S. exports. Over the past three decades, exports as a percentage of GDP have increased by 20 percent, growing from 10.1 percent to 12.6 percent of GDP,12 and the value of U.S. exports has increased by 60 percent in the last decade alone.13
This is important because, as think tanks like the CATO Institute have argued, exports are a good proxy for the state of our economy and job growth.14 When exports increase, so do economic output and job creation. When they decrease, our economy tends to shrink and we tend to shed jobs. In 22 of the 25 years from 1983 to 2007, GDP, trade, and job creation all increased together or decreased together.15 Increasing exports helps al-leviate the large U.S. trade imbalance with the rest of the world and, more importantly, helps create U.S. jobs. By 2008, there were more than 10 mil-lion jobs in the United States supported by ex-ports.16 And these exports are driving the recent, limited growth of the U.S. economy. While exports account for only about one-eighth of the nation’s economy, they have accounted for about half of the nation’s economic growth in recent years.17
Worryingly, exports have declined in recent years. According to the Bureau of Labor Statistics, U.S. exports fell 2.1 percent between June 2011 and June 2012, the largest yearly decline since the period right after the stock market crashed, Octo-ber 2008 to October 2009.18 Fortunately. mmi-
grant-owned businesses helped cushion this fall. As the economists Giovanni Peri and Francisco Requena-Silvente have shown, “[t]hrough business and social networks, expatriates increase the diffu-sion of information and reduce the cost of doing business with their ‘mother’ country.” 19 To the ex-tent that immigrant-owned businesses can export to their home countries or elsewhere, they can help stem the decline in U.S. exports, expand total reve-nues coming into the country, and create jobs for American workers.
The data establishes that immigrant-owned firms have a powerful role in promoting the U.S. ex-port economy. Immigrant-owned businesses are more than 60 percent more likely to export than are non-immigrant owned businesses. And this is not surprising. Immigrants often face lower barriers of entry to foreign markets because they have estab-lished networks in their home countries, an under-standing of local markets, and shared languages and culture.20 Only 4.4 percent of non-immigrant firms export, compared with 7.1 percent of immi-grant firms. For high-exporting companies, immi-grants play an even more dominant role. While just 1.2 percent of non-immigrant-owned firms export more than 20 percent of their sales, 3.2 percent of immigrant-owned firms do, making immigrant firms more than two and a half times more likely to be high-exporting companies.
IMMIGR ANT-OWNED FIRMS DRIVE THE U.S. EXPORT ECONOMY
10 PARTNERSHIP FOR A NEW AMERICAN ECONOMY
Immigrant-owned businesses are more than 60 percent more likely to export than non-immigrant owned businesses.
Immigrant-owned businesses are more than two and a half times more likely to be high-exporting companies.
KEY FINDINGS
OPEN FOR BUSINESS 11
METTA MURDAYABRINGING THE INGREDIENTS OF HOME TO THE BEAUTY BUSINESS
Metta Murdaya, the co-founder of the beauty firm Juara Skin-care, says she’s always had an appreciation for the unique vir-tues of Eastern and Western culture. Born in Indonesia, her parents decided to send her to live with an aunt in America when she was just seven years old, hoping she’d receive a bet-ter education and more opportunities in the United States.
Murdaya says she loved American culture and quickly ac-climated, but she also went back to Indonesia to visit her fam-ily each summer, developing a fondness for many of the health tonics, flowers, and body treatments so ubiquitous there. “It’s a culture with an innate understanding of beauty traditions,” Murdaya explains. “I was intrigued by the rituals they’ve developed over hundreds of years.”
It wasn’t until after she obtained an MBA degree, however, that Murdaya saw her fascination as the seed of a potential busi-ness idea. In 2004, intent on breaking from their corporate jobs, she and three female friends founded Juara Skincare, a com-pany that uses the ingredients and remedies commonly found in Indonesia and Bali — such as candlenut and turmeric—to make organic, all-natural beauty products like face masks, perfumes, and body scrubs.
The company launched with just three products, and Mur-daya says one of her partners trekked out in the snow to con-vince the first store to carry their brand, a small pharmacy chain in New York City. Within a year, the high-end Los Angeles bou-tique Fred Segal was carrying Juara. Today, Murdaya says more than 100 stores in the U.S. and Canada stock the company’s 30-product line, which has also appeared on the QVC shopping network. It’s a fitting result for Juara — a company whose name literally means “winner” or “champion” in Indonesian.
Murdaya says that just as her immigrant experience helped her found the company, it will also help it grow. Immigrant-owned businesses are more than 60 percent more likely than non-im-migrant owned firms to export their goods and services, and Juara is certainly no exception. “As an immigrant,” Murdaya says,
“you always view the world as your marketplace, instead of the city or country you happen to be in.” From the beginning, her team made sure all their ingredients were compliant with Euro-pean Union standards. And later this year, Murdaya says the company’s products will begin to appear in South America and Indonesia for the first time.23
Data on the exports of immigrant-owned firms were not collected until 2007,21 so the extent to which we are dependent on the growth in exports from these firms cannot be precisely made. But the data do show that immigrants are increasingly starting businesses and that those businesses are far more likely to export. And that means that policy makers need to think about immigrant-owned firms when they think about reviving our export economy. America was the world’s leading exporter for the half-century after World War II, until surpassed early this century by Germany and more recently by China.22 If America is again to lead the world in exports, immigrant entrepreneurs — with knowledge of, and access to, foreign markets— will need to play a crucial role.
IMMIGRANT SHARE OF EXPORT ECONOMY: IMMIGRANTS ACCOUNT FOR A HIGHER PERCENTAGE OF HIGH-EXPORT COMPANIESSPECIAL TABULATIONS FROM SURVEY OF BUSINESS OWNERS (2007)
PERCENTAGE OF TOTAL SALES EXPORTED OUTSIDE OF THE U.S.
PERCENT OF FIRMS THAT ARE OWNED BY IMMIGRANTS
None 12.7%
Less than 1% 11.1%
1% to 4% 14.7%
5% to 9% 17.1%
10% to 19% 20.2%
20% to 49% 24.8%
50% to 99% 35.1%
100% 50.5%
Total Reporting 13.0%
Note: The sample includes firms that are classified by the IRS as sole proprietorships, partnerships, 1120 corporations, or employers, and that have sales of $1000 or more. Excludes publicly held and other firms not classifiable by owner status.
The toll that the recession took on our GDP and our national fiscal health was severe. The U.S. government estimates that the GDP shrank by more than eight percent in the last quarter of 2008 and an additional four percent in the first quarter of 2009.24 To put that in context, it has been 50 years since the GDP shrank by four percent or more in two successive fiscal quarters.25 U.S. GDP has recovered slowly since, but our fiscal situation has remained unstable. Until 2008, the U.S. had never before run a budget deficit of $1 trillion. Since 2008, the U.S. budget deficit has exceeded $1 trillion in every single year, according to the Congressional Budget Office.26 When the loss of tax revenues, the spending and tax cuts included in the stimulus, the bank bailouts, and other recession-related expenses are taken into account, the recent recession added an estimated $4.2 trillion to the federal deficit.27
Our GDP and our fiscal health present worrisome economic trends, but the data from this report plainly show that immigrant business owners have helped prevent a far worse economic picture. While immigrants are not starting massive companies at the same rate as their native-born counterparts, they are far more prolific in starting small businesses. And these businesses collectively generated $779.8 billion in revenue and $109.1 billion in income in 2010,28 strengthening U.S. GDP, paying taxes to help balance the budget, and creating ripple effects throughout the broader economy due to higher consumption of goods and services by the companies and their employees.29
IMMIGR ANT-OWNED BUSINESSES GENER ATE SUBSTANTIAL BUSINESS INCOME AND REVENUE
12 PARTNERSHIP FOR A NEW AMERICAN ECONOMY
Immigrant-owned businesses generated more than $775 billion in sales and more than $100 billion in income in 2010.
The $109 billion in business income generated by immigrant-owned firms in 2010 was a 60 percent increase over 2000. This growth greatly outpaced the increase in business income generated by native-owned firms, whose 14 percent rise failed to outpace inflation.
KEY FINDINGS
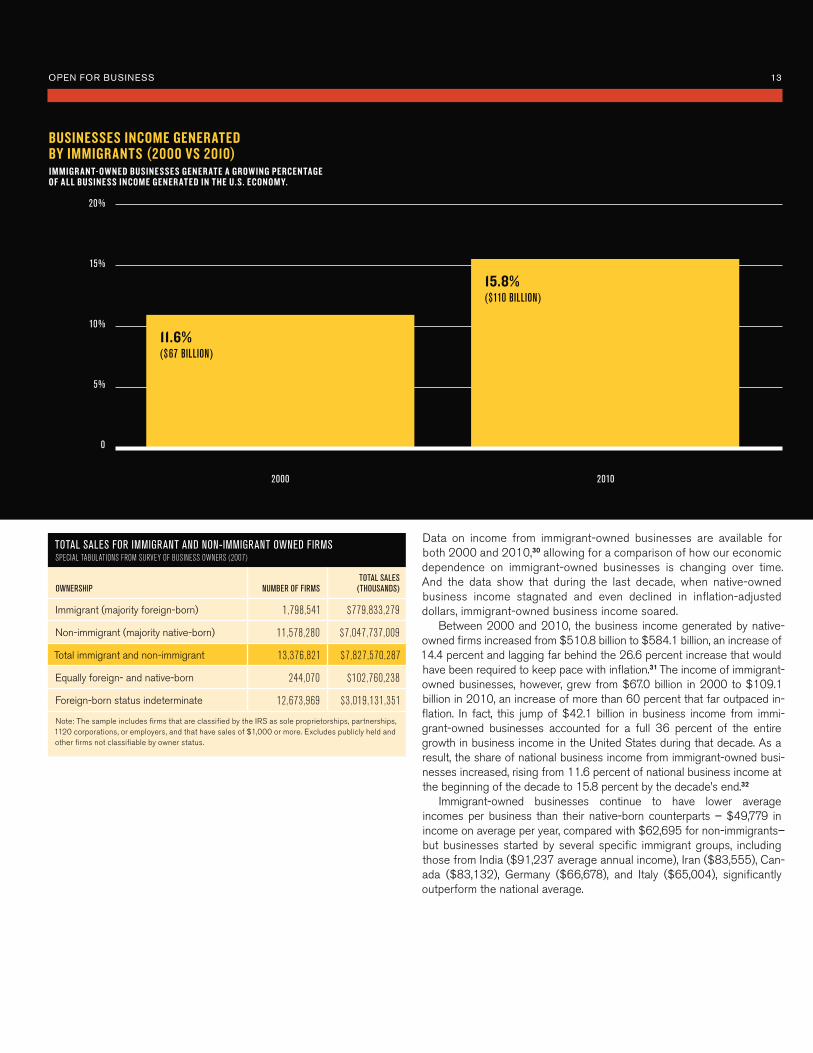
Data on income from immigrant-owned businesses are available for both 2000 and 2010,30 allowing for a comparison of how our economic dependence on immigrant-owned businesses is changing over time. And the data show that during the last decade, when native-owned business income stagnated and even declined in inflation-adjusted dollars, immigrant-owned business income soared.
Between 2000 and 2010, the business income generated by native-owned firms increased from $510.8 billion to $584.1 billion, an increase of 14.4 percent and lagging far behind the 26.6 percent increase that would have been required to keep pace with inflation.31 The income of immigrant-owned businesses, however, grew from $67.0 billion in 2000 to $109.1 billion in 2010, an increase of more than 60 percent that far outpaced in-flation. In fact, this jump of $42.1 billion in business income from immi-grant-owned businesses accounted for a full 36 percent of the entire growth in business income in the United States during that decade. As a result, the share of national business income from immigrant-owned busi-nesses increased, rising from 11.6 percent of national business income at the beginning of the decade to 15.8 percent by the decade’s end.32
Immigrant-owned businesses continue to have lower average incomes per business than their native-born counterparts – $49,779 in income on average per year, compared with $62,695 for non-immigrants– but businesses started by several specific immigrant groups, including those from India ($91,237 average annual income), Iran ($83,555), Can-ada ($83,132), Germany ($66,678), and Italy ($65,004), significantly outperform the national average.
OPEN FOR BUSINESS 13
BUSINESSES INCOME GENER ATED BY IMMIGR ANTS (2000 VS 2010)IMMIGR A NT-OW NED BUSINES SES GENER ATE A GROW ING PERCENTAGE OF A LL BUSINES S INCOME GENER ATED IN THE U.S. ECONOM Y.
20%
15%
10%
5%
0
2000 2010
11.6% ($67 BILLION)
15.8% ($110 BILLION)
TOTAL SALES FOR IMMIGRANT AND NON- IMMIGRANT OWNED FIRMSSPECIAL TABULATIONS FROM SURVEY OF BUSINESS OWNERS (2007)
OWNERSHIP NUMBER OF FIRMSTOTAL SALES
(THOUSANDS)
Immigrant (majority foreign- born) 1,798,541 $779,833,279
Non-immigrant (majority native- born) 11,578,280 $7,047,737,009
Total immigrant and non- immigrant 13,376,821 $7,827,570,287
Equally foreign- and native- born 244,070 $102,760,238
Foreign- born status indeterminate 12,673,969 $3,019,131,351
Note: The sample includes firms that are classified by the IRS as sole proprietorships, partnerships, 1120 corporations, or employers, and that have sales of $1,000 or more. Excludes publicly held and other firms not classifiable by owner status.
OPEN FOR BUSINESS 13
The U.S. economy lost nearly 9 million jobs during the recent recession.33 Unemployment reached 10 percent, a figure seen in only one other brief peri-od over the last sixty years.34 Long term unemploy-ment – defined as persons out of works for 27 weeks or more– reached 4.4 percent in early 2009, dwarfing its previous high of 2.6 percent in the early 1980s.35 And even though some jobs have returned, more than 12 million Americans are still unemployed, and millions more left the la-bor force entirely.36
One fact, however, is abundantly clear. But for the recent increase in business startup activity among immigrants, the economic situation facing millions of Americans would be markedly worse. Immigrants are starting companies that are smaller on average than the native-born in terms of payroll and number of employees, but they are starting these companies in increasingly large numbers and these small compa-nies collectively create millions of jobs and pay out billions upon billions of dollars in payroll to workers in
America.37 One out of every 10 workers at privately-owned U.S. companies38 now works at an immi-grant-owned company. While immigrant-owned busi-nesses with employees each hire eight employees on average, as compared to 12 employees hired by businesses owned by the native-born — millions of workers in America have their jobs today because of immigrants. Altogether, immigrant-owned business-es have collectively created four million jobs that ex-ist today in the United States.
Similarly, although the average payroll gener-ated by immigrant businesses is smaller than that of businesses owned by the native-born – $252,758 on average for immigrant-owned busi-nesses compared with $428,546 for businesses owned by the native-born – their aggregate con-tribution to the U.S. payroll is massive in scale. Immigrant-owned businesses pay out more than $126 billion per year in payroll.
IMMIGR ANT-OWNED BUSINESSES CREATE MILLIONS OF JOBS AND PAY BILLIONS OF DOLL ARS IN EMPLOYEE SAL ARIES
14 PARTNERSHIP FOR A NEW AMERICAN ECONOMY
One in every 10 people employed at a privately-owned U.S. company works at an immigrant-owned firm.
Immigrant-owned businesses pay out $126 billion in payroll per year.
KEY FINDINGS
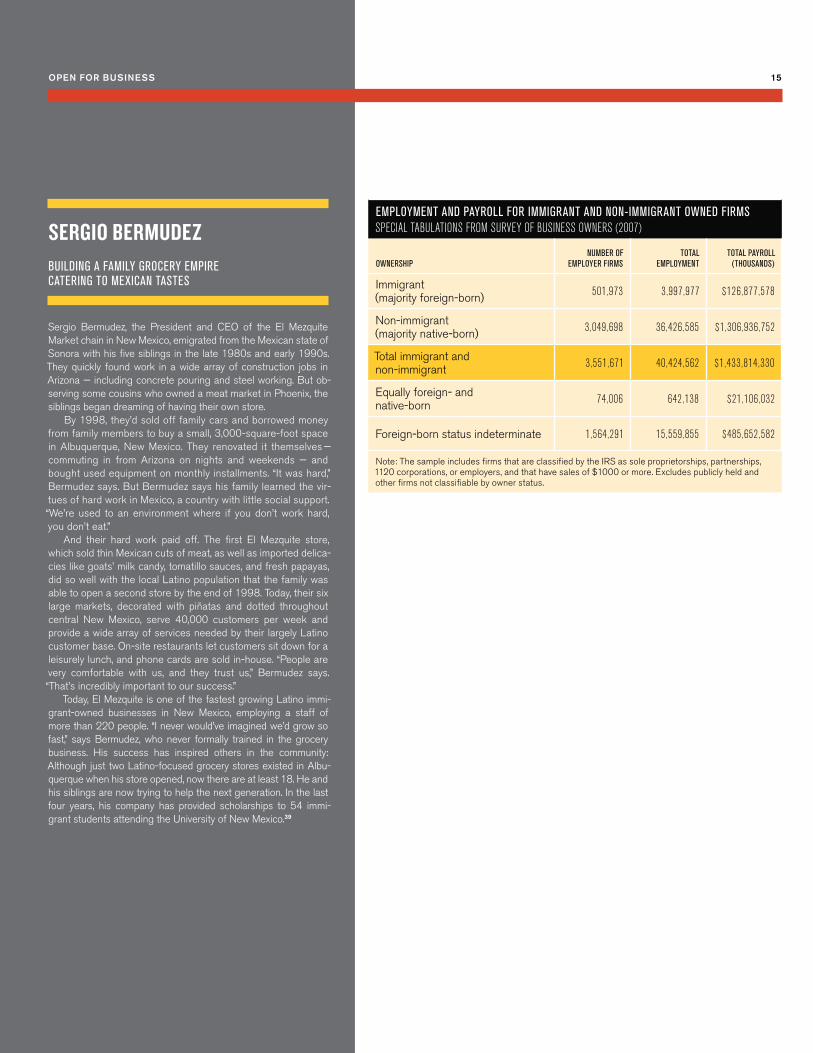
EMPLOYMENT AND PAYROLL FOR IMMIGRANT AND NON-IMMIGRANT OWNED FIRMS SPECIAL TABULATIONS FROM SURVEY OF BUSINESS OWNERS (2007)
OWNERSHIPNUMBER OF
EMPLOYER FIRMSTOTAL
EMPLOYMENTTOTAL PAYROLL
(THOUSANDS)
Immigrant (majority foreign- born) 501,973 3,997,977 $126,877,578
Non- immigrant (majority native- born) 3,049,698 36,426,585 $1,306,936,752
Total immigrant and non- immigrant 3,551,671 40,424,562 $1,433,814,330
Equally foreign- and native- born 74,006 642,138 $21,106,032
Foreign- born status indeterminate 1,564,291 15,559,855 $485,652,582
Note: The sample includes firms that are classified by the IRS as sole proprietorships, partnerships, 1120 corporations, or employers, and that have sales of $1000 or more. Excludes publicly held and other firms not classifiable by owner status.
OPEN FOR BUSINESS 15
25 Telephone Interview with Sergio Bermudez (July 24, 2012).
SERGIO BERMUDEZBUILDING A FAMILY GROCERY EMPIRE CATERING TO MEXICAN TASTES
Sergio Bermudez, the President and CEO of the El Mezquite Market chain in New Mexico, emigrated from the Mexican state of Sonora with his five siblings in the late 1980s and early 1990s. They quickly found work in a wide array of construction jobs in Arizona — including concrete pouring and steel working. But ob-serving some cousins who owned a meat market in Phoenix, the siblings began dreaming of having their own store.
By 1998, they’d sold off family cars and borrowed money from family members to buy a small, 3,000-square-foot space in Albuquerque, New Mexico. They renovated it themselves — commuting in from Arizona on nights and weekends — and bought used equipment on monthly installments. “It was hard,” Bermudez says. But Bermudez says his family learned the vir-tues of hard work in Mexico, a country with little social support. “We’re used to an environment where if you don’t work hard, you don’t eat.”
And their hard work paid off. The first El Mezquite store, which sold thin Mexican cuts of meat, as well as imported delica-cies like goats’ milk candy, tomatillo sauces, and fresh papayas, did so well with the local Latino population that the family was able to open a second store by the end of 1998. Today, their six large markets, decorated with piñatas and dotted throughout central New Mexico, serve 40,000 customers per week and provide a wide array of services needed by their largely Latino customer base. On-site restaurants let customers sit down for a leisurely lunch, and phone cards are sold in-house. “People are very comfortable with us, and they trust us,” Bermudez says. “That’s incredibly important to our success.”
Today, El Mezquite is one of the fastest growing Latino immi-grant-owned businesses in New Mexico, employing a staff of more than 220 people. “I never would’ve imagined we’d grow so fast,” says Bermudez, who never formally trained in the grocery business. His success has inspired others in the community: Although just two Latino-focused grocery stores existed in Albu-querque when his store opened, now there are at least 18. He and his siblings are now trying to help the next generation. In the last four years, his company has provided scholarships to 54 immi-grant students attending the University of New Mexico.39
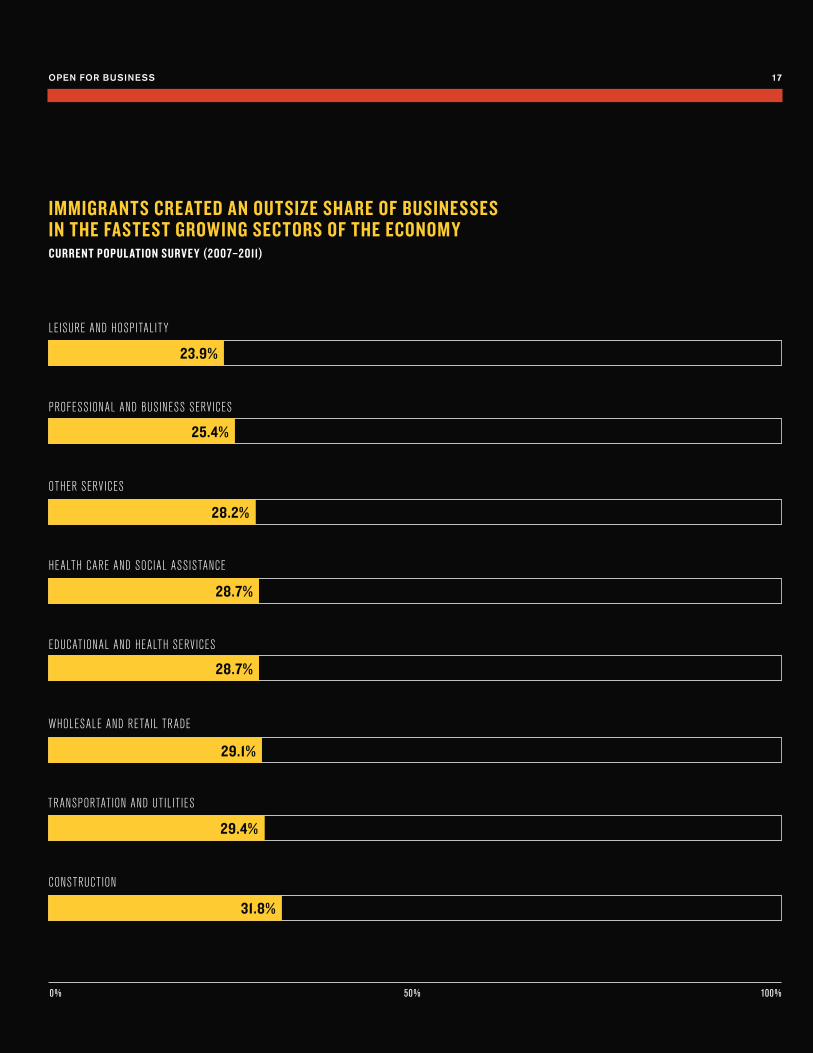
As important as the frequency with which immi-grants are starting businesses is the diversity of fields in which they are starting them. Past research has highlighted the role that immigrant entrepre-neurs have had in isolated sectors of the economy such as technology,40 but the data from this report make clear that immigrant entrepreneurs are founding companies all over the economy, particu-larly in sectors that the U.S. government expects to be the fastest growing in the next decade.41
In seven of the eight industries that the U.S. Bu-reau of Labor Statistics estimates will grow fastest this decade, immigrants start an outsized share of all new companies. From 2007 to 2011, immi-grants founded 28.7 percent of health care and social assistance companies,42 25.4 percent of pro-fessional and business services, 31.8 percent of construction firms, 29.1 percent of retail trade com-panies,43 23.9 percent of leisure and hospitality companies, 28.7 percent of educational services,44
28.2 percent of “other services,”45 and 29.4 percent of transportation and utilities firms.
In each of these sectors, immigrants are founding an even larger share of new companies than the share they currently own in them. For instance, while im-migrants already own an impressive 17 percent of businesses in construction, they started 31.8 per-cent of all new construction businesses from 2007 to 2011. Unless immigrant businesses in construc-tion fail at a much higher rate than those of their native-born counterparts – data that were not avail-able for the purposes of this report 46 – their share of construction companies will only increase. Similar patterns are observed across the top growth sectors
— from wholesale and retail trade to transportation and utilities, to educational and health services — all fields where immigrants in recent years have been responsible for nearly 30 percent of all new busi-nesses start ups, far higher than their current share of business ownership.47
IMMIGR ANT-OWNED BUSINESSES POWER MANY SECTORS OF THE AMERICAN ECONOMY
16 PARTNERSHIP FOR A NEW AMERICAN ECONOMY
Immigrants start more than 25 percent of all businesses in seven of the eight sectors of the economy that the U.S. government expects to grow fastest over the next decade.
Immigrant-owned businesses generate more than 20 percent of all income in the retail trade; transportation; health care and social assistance; and accommodation, recreation and entertainment sectors.
KEY FINDINGS
OPEN FOR BUSINESS 17
IMMIGR ANTS CREATED AN OUTSIZE SHARE OF BUSINESSES IN THE FASTEST GROWING SECTORS OF THE ECONOMY CURRENT POPUL ATION SURVE Y (2007–2011)
LEISURE AND HOSPITAL IT Y
PROFESSIONAL AND BUSINESS SERVICES
CONSTRUCT ION
EDUCAT IONAL AND HEALTH SERVICES
HEALTH CARE AND SOCIAL ASSISTANCE
OTHER SERVICES
WHOLESALE AND RE TAIL TRADE
TRANSPORTAT ION AND UT IL IT IES
23.9%
25.4%
28.2%
28.7%
28.7%
29.1%
29.4%
31.8%
0% 50% 100%
18 PARTNERSHIP FOR A NEW AMERICAN ECONOMY
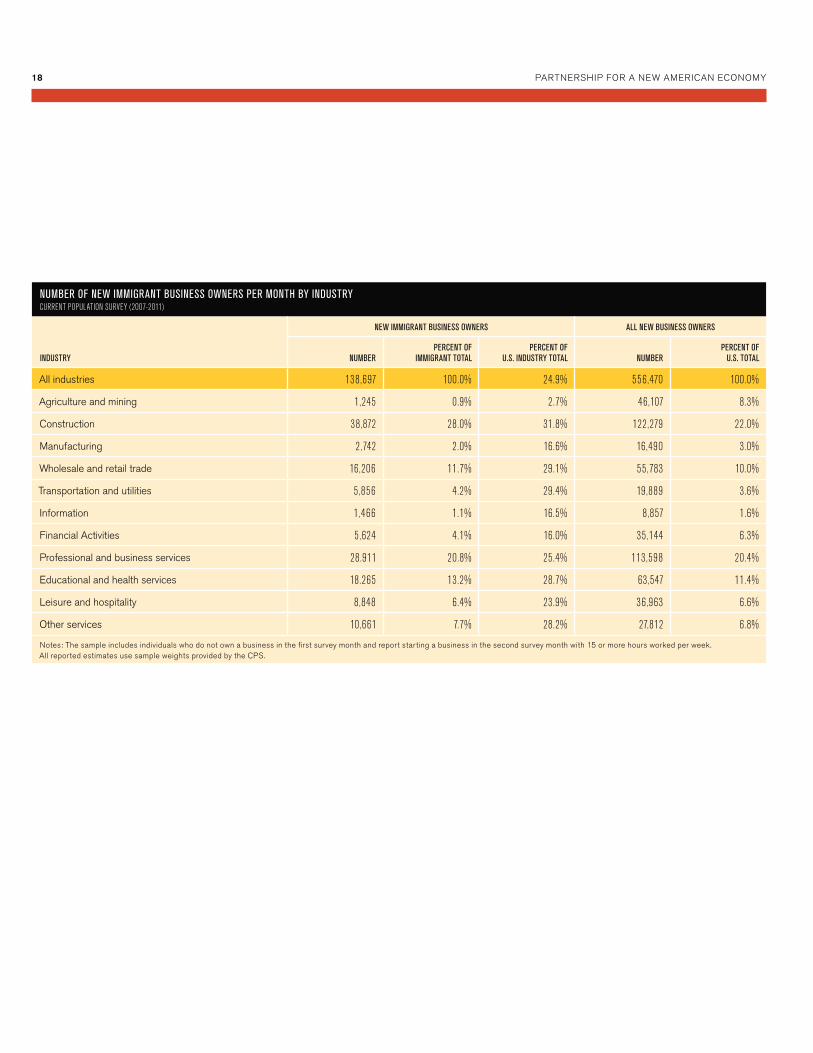
NUMBER OF NEW IMMIGRANT BUSINESS OWNERS PER MONTH BY INDUSTRYCURRENT POPULATION SURVEY (2007-2011)
INDUSTRY
NEW IMMIGRANT BUSINESS OWNERS ALL NEW BUSINESS OWNERS
NUMBERPERCENT OF
IMMIGRANT TOTALPERCENT OF
U.S. INDUSTRY TOTAL NUMBERPERCENT OF
U.S. TOTAL
All industries 138,697 100.0% 24.9% 556,470 100.0%
Agriculture and mining 1,245 0.9% 2.7% 46,107 8.3%
Construction 38,872 28.0% 31.8% 122,279 22.0%
Manufacturing 2,742 2.0% 16.6% 16,490 3.0%
Wholesale and retail trade 16,206 11.7% 29.1% 55,783 10.0%
Transportation and utilities 5,856 4.2% 29.4% 19,889 3.6%
Information 1,466 1.1% 16.5% 8,857 1.6%
Financial Activities 5,624 4.1% 16.0% 35,144 6.3%
Professional and business services 28.911 20.8% 25.4% 113,598 20.4%
Educational and health services 18.265 13.2% 28.7% 63,547 11.4%
Leisure and hospitality 8,848 6.4% 23.9% 36,963 6.6%
Other services 10,661 7.7% 28.2% 27,812 6.8%
Notes: The sample includes individuals who do not own a business in the first survey month and report starting a business in the second survey month with 15 or more hours worked per week. All reported estimates use sample weights provided by the CPS.
OPEN FOR BUSINESS 19
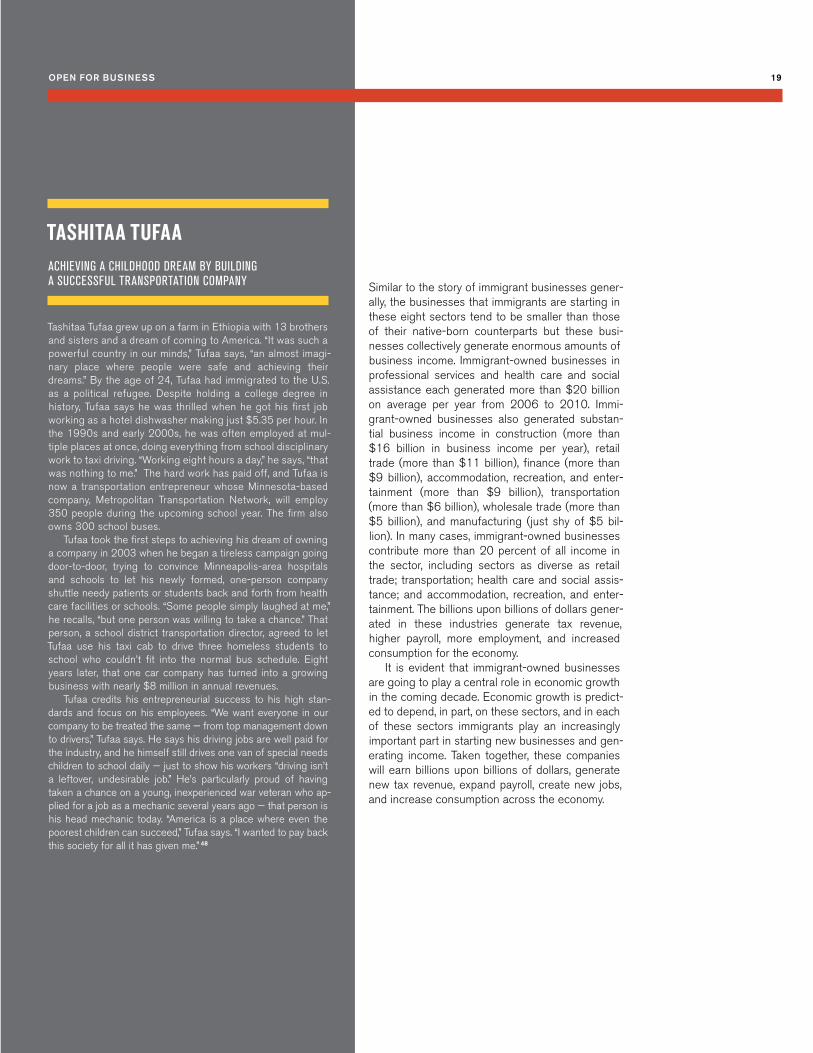
TASHITAA TUFAAACHIEVING A CHILDHOOD DREAM BY BUILDING A SUCCESSFUL TRANSPORTATION COMPANY
Tashitaa Tufaa grew up on a farm in Ethiopia with 13 brothers and sisters and a dream of coming to America. “It was such a powerful country in our minds,” Tufaa says, “an almost imagi-nary place where people were safe and achieving their dreams.” By the age of 24, Tufaa had immigrated to the U.S. as a political refugee. Despite holding a college degree in history, Tufaa says he was thrilled when he got his first job working as a hotel dishwasher making just $5.35 per hour. In the 1990s and early 2000s, he was often employed at mul-tiple places at once, doing everything from school disciplinary work to taxi driving. “Working eight hours a day,” he says, “that was nothing to me.” The hard work has paid off, and Tufaa is now a transportation entrepreneur whose Minnesota-based company, Metropolitan Transportation Network, will employ 350 people during the upcoming school year. The firm also owns 300 school buses.
Tufaa took the first steps to achieving his dream of owning a company in 2003 when he began a tireless campaign going door-to-door, trying to convince Minneapolis-area hospitals and schools to let his newly formed, one-person company shuttle needy patients or students back and forth from health care facilities or schools. “Some people simply laughed at me,” he recalls, “but one person was willing to take a chance.” That person, a school district transportation director, agreed to let Tufaa use his taxi cab to drive three homeless students to school who couldn’t fit into the normal bus schedule. Eight years later, that one car company has turned into a growing business with nearly $8 million in annual revenues.
Tufaa credits his entrepreneurial success to his high stan-dards and focus on his employees. “We want everyone in our company to be treated the same — from top management down to drivers,” Tufaa says. He says his driving jobs are well paid for the industry, and he himself still drives one van of special needs children to school daily — just to show his workers “driving isn’t a leftover, undesirable job.” He’s particularly proud of having taken a chance on a young, inexperienced war veteran who ap-plied for a job as a mechanic several years ago — that person is his head mechanic today. “America is a place where even the poorest children can succeed,” Tufaa says. “I wanted to pay back this society for all it has given me.” 48
Similar to the story of immigrant businesses gener-ally, the businesses that immigrants are starting in these eight sectors tend to be smaller than those of their native-born counterparts but these busi-nesses collectively generate enormous amounts of business income. Immigrant-owned businesses in professional services and health care and social assistance each generated more than $20 billion on average per year from 2006 to 2010. Immi-grant-owned businesses also generated substan-tial business income in construction (more than $16 billion in business income per year), retail trade (more than $11 billion), finance (more than $9 billion), accommodation, recreation, and enter-tainment (more than $9 billion), transportation (more than $6 billion), wholesale trade (more than $5 billion), and manufacturing (just shy of $5 bil-lion). In many cases, immigrant-owned businesses contribute more than 20 percent of all income in the sector, including sectors as diverse as retail trade; transportation; health care and social assis-tance; and accommodation, recreation, and enter-tainment. The billions upon billions of dollars gener-ated in these industries generate tax revenue, higher payroll, more employment, and increased consumption for the economy.
It is evident that immigrant-owned businesses are going to play a central role in economic growth in the coming decade. Economic growth is predict-ed to depend, in part, on these sectors, and in each of these sectors immigrants play an increasingly important part in starting new businesses and gen-erating income. Taken together, these companies will earn billions upon billions of dollars, generate new tax revenue, expand payroll, create new jobs, and increase consumption across the economy.
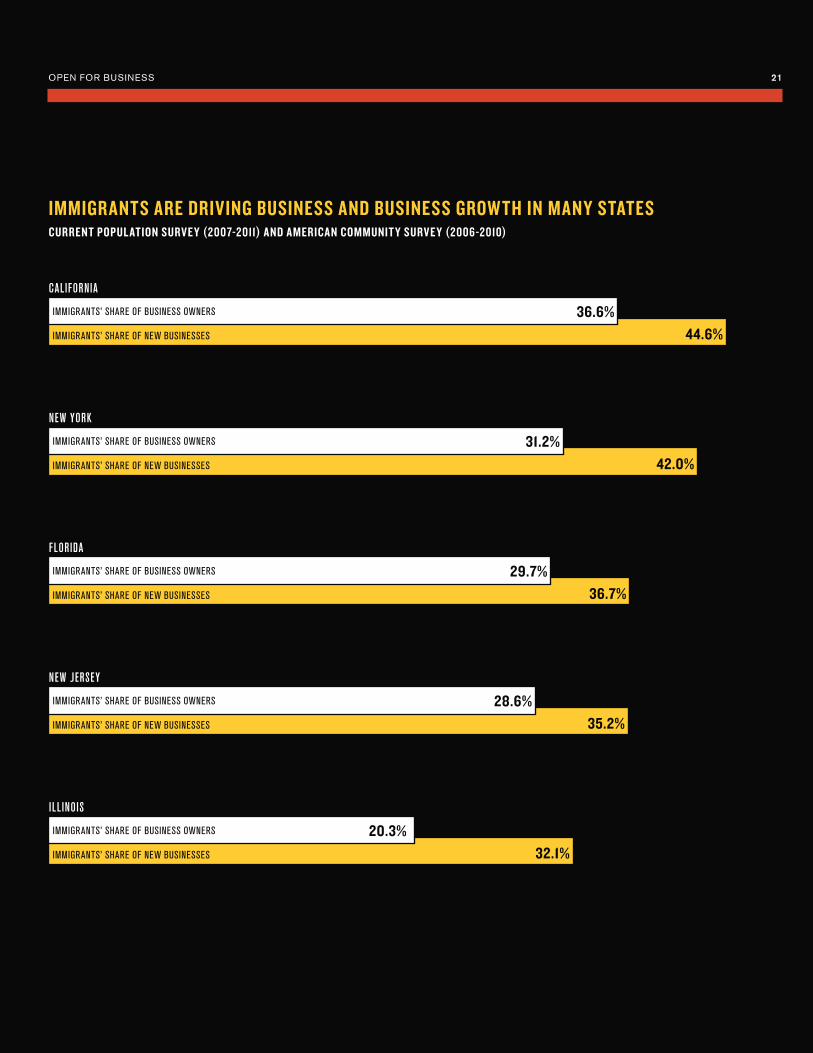
The impact of the businesses that immigrants are starting is felt all over the country. In states that are large enough for data to be available, immigrants are starting businesses at rates that greatly exceed their share of the population.
In California, immigrants make up 27.2 percent of the population49 but own 36.6 percent of all busi-nesses – 676,537 in total – and start 44.6 percent of all new businesses.50 The same can be said for New York, where immigrants make up 22.2 percent of the population, own 31.2 percent of businesses, and are now starting 42.0 percent of new businesses. Similar stories exist for states like New Jersey (im-migrants make up 21.0 percent of population, own 28.6 of businesses, and start 35.2 percent of new businesses), Florida (19.4 percent of population; own 29.7 percent of businesses, and start 36.7 percent of new businesses), Texas (16.4 percent of population; own 24.9 percent of businesses, and start 31.3 per-cent of new businesses), Illinois (13.7 percent of population; own 20.3 percent of businesses, and start 32.1 percent of new businesses), Arizona (13.4 per-cent of population; own 19.6 percent of businesses, and start 31.5 percent of new businesses), and Geor-gia (9.7 percent of population; own 15.5 percent of businesses, and start 29.5 percent of new business-es). Provided that the rate that immigrant-owned businesses fail does not dramatically exceed the fail-ure rate for businesses owned by the native-born – data that is not available for this report 51 – the find-ings suggests that immigrant business-ownership rates will only continue to increase.
To provide context for what this increase in busi-ness generation will mean to the income generated by theses states, consider that immigrant-owned businesses already produce more than $34 billion per year in California alone, constituting 28.1 percent of all business income produced in the state and 4.2 percent of all business income in the United States. In Florida the total income of immigrant business owners represents nearly one-fourth of all business income in the state. And in New York, New Jersey, and Hawaii, immigrant-owned businesses already produce 20 percent or more of the state’s income.
IMMIGR ANTS PUNCH ABOVE THEIR WEIGHT IN STATES ACROSS THE COUNTRY
20 PARTNERSHIP FOR A NEW AMERICAN ECONOMY
TOM SZAKYTURNING TRASH INTO TREASURE
Tom Szaky, a green energy entrepreneur, credits his immigrant experience with helping him see a business opportunity few others did — and hav-ing the motivation to pursue it. Szaky, who was born in Hungary, fled the country at the age of four with his family. Settling in Toronto, Canada, Tom says he and his parents were quickly amazed by the things they saw neighbors casu-ally throwing out in the trash, including fully-functioning televisions, a true luxury in a country as poor as Hungary. Away from the Iron Curtain, young Tom also quickly developed an admiration for the success that self-made entrepreneurs could achieve in the Western world. “The idea of going from nothing to everything in a lifetime,” he says, “was inspiring to me.”
So it’s little surprise that Tom soon began exploring entrepreneurship. By age 14, he had a small but successful graphic design business. Five years later, while a sophomore in college in the United States, Szaky dropped out of col-lege to run TerraCycle, a New Jersey-based company he founded that recycles materials previously viewed as unrecyclable. It also up-cycles other items of trash — turning refuse like candy and gum wrappers into products like backpacks, stereo speakers, and pencil cases. The 120-person company, which collects trash in 22 countries and two-thirds of public schools in America, says it has rescued three billion pieces of garbage that would otherwise be in a landfill. It projects it will earn $18.5 mil-lion in revenues this year.
Szaky says he sees much bigger things in store. This winter, TerraCycle is planning to launch a recycling program that will allow dirty diapers to be recycled into park benches — a powerful idea considering that in the U.S. alone disposable diapers account for 3.7 million tons of municipal waste each year.52 Szaky says he sees a multibillion-dollar market in his unique corner of the recyclables industry. “I want to wake up at the end of my life and know I’ve cre-ated a truly substantial business,” Szaky says. The way things are going, he’s already well on his way to achieving that dream.53
OPEN FOR BUSINESS 21
IMMIGR ANTS ARE DRIVING BUSINESS AND BUSINESS GROW TH IN MANY STATES CURRENT POPUL ATION SURVE Y (2007-2011) AND AMERICAN COMMUNIT Y SURVE Y (2006-2010)
IMMIGRANTS’ SHARE OF NEW BUSINESSES 44.6%
IMMIGRANTS’ SHARE OF BUSINESS OWNERS 36.6%
CAL IFORNIA
IMMIGRANTS’ SHARE OF NEW BUSINESSES 42.0%
IMMIGRANTS’ SHARE OF BUSINESS OWNERS 31.2%
NEW YORK
IMMIGRANTS’ SHARE OF NEW BUSINESSES 35.2%
IMMIGRANTS’ SHARE OF BUSINESS OWNERS 28.6%
NEW JERSEY
IMMIGRANTS’ SHARE OF NEW BUSINESSES 36.7%
FLORIDA
IMMIGRANTS’ SHARE OF BUSINESS OWNERS 29.7%
IMMIGRANTS’ SHARE OF NEW BUSINESSES 32.1%
IMMIGRANTS’ SHARE OF BUSINESS OWNERS
ILL INOIS
20.3%
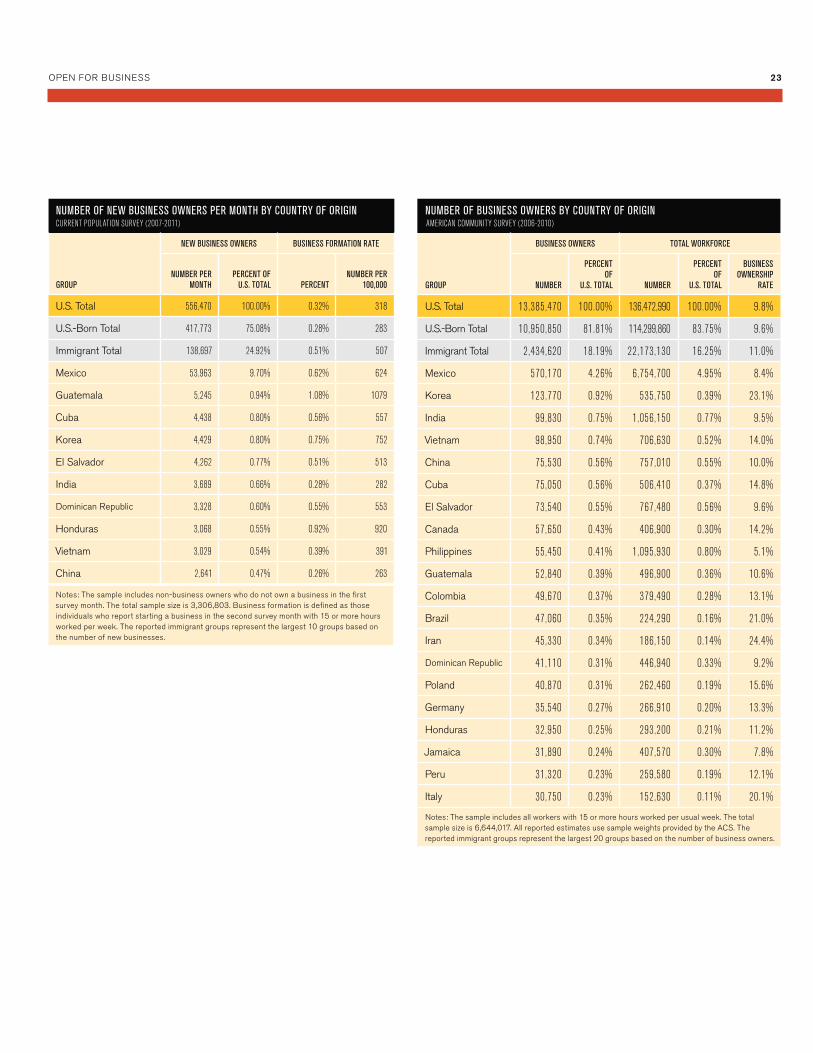
There is no one country of origin for the immi-grants driving new-business creation in America. The largest number of immigrants starting new businesses come from Mexico, whose expatriates start more than 50,000 new U.S. businesses every month. There are now more than 570,000 U.S. businesses that are owned by immigrants from Mexico, constituting more than 1 in every 25 busi-nesses in this country. But the immigrants starting new businesses in the United States hail from all over the world. Immigrants from Guatemala, Cuba, Korea, El Salvador, India, Dominican Republic, Honduras, Vietnam, and China all start more than 2,500 U.S. businesses per month.54 More than 20 percent of Koreans, Iranians, Brazilians, and Ital-ians currently living in the United States own a business, compared to 9.6 percent of native-born Americans. Immigrants from Poland (15.6 percent of whom own a business), Cuba (14.8 percent), Canada (14.2 percent), Vietnam (14.0 percent), Germany (13.3 percent), Colombia (13.1 percent), Peru (12.1 percent), Honduras (11.2 percent), Guatemala (10.6 percent), and China (10.0 per-cent) all own businesses at higher rates than their
native-born counterparts. This diversity opens up new economic opportunities, bringing outside knowhow to the U.S. and providing language skills and cultural understanding that allow American businesses to grow and service customer bases both here and abroad.
The businesses that these immigrant groups start are generating billions of dollars in income for the U.S. economy. Immigrants from Mexico pro-vide the largest contribution to total U.S. business income at nearly $17 billion per year (2.1 percent of total business income), but immigrants from In-dia ($9.1 billion in business income), Korea ($7.1 billion), Canada ($4.8 billion), Vietnam ($4.3 bil-lion), China ($3.9 billion), Iran ($3.8 billion), Cuba ($3.7 billion), the Philipines ($3.3 billion), Germany ($2.4 billion), El Salvador ($2.2 billion), and Poland ($2.2 billion) also make large contributions to U.S. business income.
THE IMMIGR ANTS STARTING BUSINESSES IN THE UNITED STATES COME FROM ALL OVER THE WORLD
22 PARTNERSHIP FOR A NEW AMERICAN ECONOMY
NUMBER OF BUSINESS OWNERS BY COUNTRY OF ORIGIN AMERICAN COMMUNITY SURVEY (2006-2010)
GROUP
BUSINESS OWNERS TOTAL WORKFORCE
NUMBER
PERCENT OF
U.S. TOTAL NUMBER
PERCENT OF
U.S. TOTAL
BUSINESS OWNERSHIP
RATE
U.S. Total 13,385,470 100.00% 136,472,990 100.00% 9.8%
U.S.-Born Total 10,950,850 81.81% 114,299,860 83.75% 9.6%
Immigrant Total 2,434,620 18.19% 22,173,130 16.25% 11.0%
Mexico 570,170 4.26% 6,754,700 4.95% 8.4%
Korea 123,770 0.92% 535,750 0.39% 23.1%
India 99,830 0.75% 1,056,150 0.77% 9.5%
Vietnam 98,950 0.74% 706,630 0.52% 14.0%
China 75,530 0.56% 757,010 0.55% 10.0%
Cuba 75,050 0.56% 506,410 0.37% 14.8%
El Salvador 73,540 0.55% 767,480 0.56% 9.6%
Canada 57,650 0.43% 406,900 0.30% 14.2%
Philippines 55,450 0.41% 1,095,930 0.80% 5.1%
Guatemala 52,840 0.39% 496,900 0.36% 10.6%
Colombia 49,670 0.37% 379,490 0.28% 13.1%
Brazil 47,060 0.35% 224,290 0.16% 21.0%
Iran 45,330 0.34% 186,150 0.14% 24.4%
Dominican Republic 41,110 0.31% 446,940 0.33% 9.2%
Poland 40,870 0.31% 262,460 0.19% 15.6%
Germany 35,540 0.27% 266,910 0.20% 13.3%
Honduras 32,950 0.25% 293,200 0.21% 11.2%
Jamaica 31,890 0.24% 407,570 0.30% 7.8%
Peru 31,320 0.23% 259,580 0.19% 12.1%
Italy 30,750 0.23% 152,630 0.11% 20.1%
Notes: The sample includes all workers with 15 or more hours worked per usual week. The total sample size is 6,644,017. All reported estimates use sample weights provided by the ACS. The reported immigrant groups represent the largest 20 groups based on the number of business owners.
OPEN FOR BUSINESS 23
NUMBER OF NEW BUSINESS OWNERS PER MONTH BY COUNTRY OF ORIGINCURRENT POPULATION SURVEY (2007-2011)
GROUP
NEW BUSINESS OWNERS BUSINESS FORMATION RATE
NUMBER PER MONTH
PERCENT OF U.S. TOTAL PERCENT
NUMBER PER 100,000
U.S. Total 556,470 100.00% 0.32% 318
U.S.-Born Total 417,773 75.08% 0.28% 283
Immigrant Total 138,697 24.92% 0.51% 507
Mexico 53,963 9.70% 0.62% 624
Guatemala 5,245 0.94% 1.08% 1079
Cuba 4,438 0.80% 0.56% 557
Korea 4,429 0.80% 0.75% 752
El Salvador 4,262 0.77% 0.51% 513
India 3,689 0.66% 0.28% 282
Dominican Republic 3,328 0.60% 0.55% 553
Honduras 3,068 0.55% 0.92% 920
Vietnam 3,029 0.54% 0.39% 391
China 2,641 0.47% 0.26% 263
Notes: The sample includes non-business owners who do not own a business in the first survey month. The total sample size is 3,306,803. Business formation is defined as those individuals who report starting a business in the second survey month with 15 or more hours worked per week. The reported immigrant groups represent the largest 10 groups based on the number of new businesses.
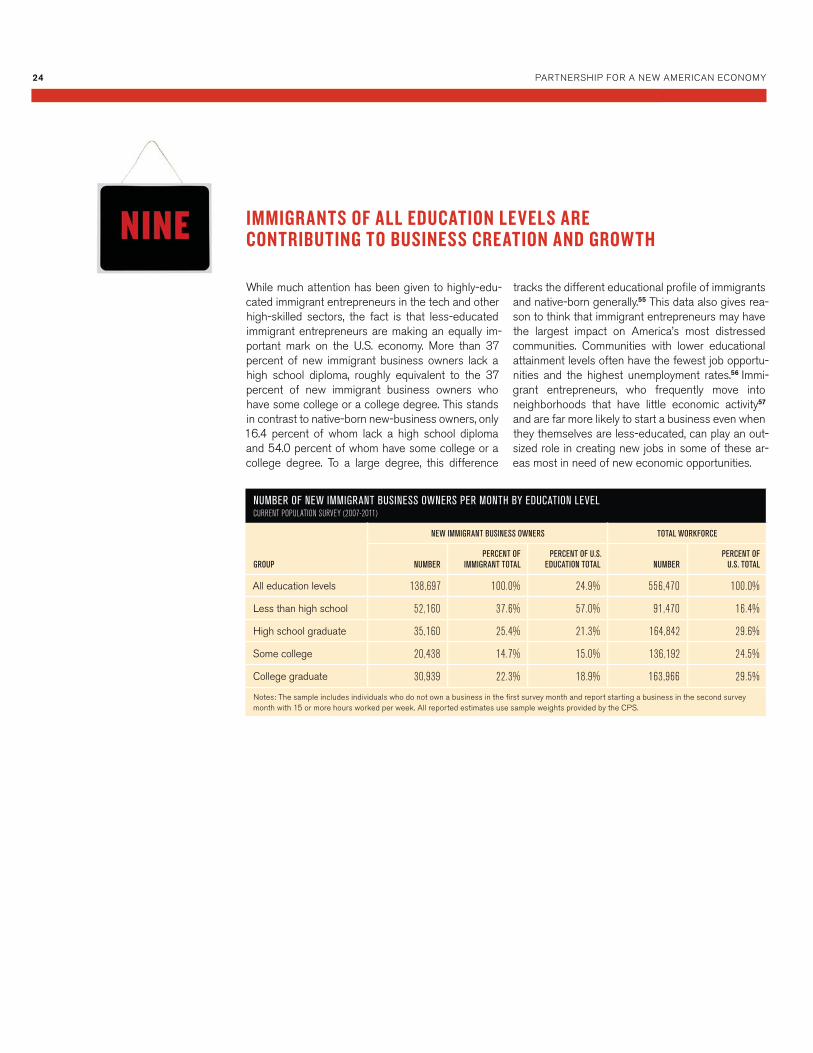
While much attention has been given to highly-edu-cated immigrant entrepreneurs in the tech and other high-skilled sectors, the fact is that less-educated immigrant entrepreneurs are making an equally im-portant mark on the U.S. economy. More than 37 percent of new immigrant business owners lack a high school diploma, roughly equivalent to the 37 percent of new immigrant business owners who have some college or a college degree. This stands in contrast to native-born new-business owners, only 16.4 percent of whom lack a high school diploma and 54.0 percent of whom have some college or a college degree. To a large degree, this difference
tracks the different educational profile of immigrants and native-born generally.55 This data also gives rea-son to think that immigrant entrepreneurs may have the largest impact on America’s most distressed communities. Communities with lower educational attainment levels often have the fewest job opportu-nities and the highest unemployment rates.56 Immi-grant entrepreneurs, who frequently move into neighborhoods that have little economic activity57 and are far more likely to start a business even when they themselves are less-educated, can play an out-sized role in creating new jobs in some of these ar-eas most in need of new economic opportunities.
IMMIGR ANTS OF ALL EDUCATION LEVELS ARE CONTRIBUTING TO BUSINESS CREATION AND GROW TH
NUMBER OF NEW IMMIGRANT BUSINESS OWNERS PER MONTH BY EDUCATION LEVELCURRENT POPULATION SURVEY (2007-2011)
GROUP
NEW IMMIGRANT BUSINESS OWNERS TOTAL WORKFORCE
NUMBER PERCENT OF
IMMIGRANT TOTALPERCENT OF U.S.
EDUCATION TOTAL NUMBERPERCENT OF
U.S. TOTAL
All education levels 138,697 100.0% 24.9% 556,470 100.0%
Less than high school 52,160 37.6% 57.0% 91,470 16.4%
High school graduate 35,160 25.4% 21.3% 164,842 29.6%
Some college 20,438 14.7% 15.0% 136,192 24.5%
College graduate 30,939 22.3% 18.9% 163,966 29.5%
Notes: The sample includes individuals who do not own a business in the first survey month and report starting a business in the second survey month with 15 or more hours worked per week. All reported estimates use sample weights provided by the CPS.
24 PARTNERSHIP FOR A NEW AMERICAN ECONOMY

SHUKRI ALI AND MAHAMED MAHAMUDREVITALIZING DOWNTOWN LEWISTON WITH THE TASTE OF HOME
Shukri Ali and her husband Mahamed Mahamud were realizing a dream when they opened The Taste of Three One Café in Lewiston, Maine in 2008. The couple, both of whom fled Soma-lia during the chaos of the 1990s, arrived in Lewiston in 2002. By the following year Ali had already begun working double shifts as an interpreter in the community — sometimes putting in as many as 18 hours per day — so that she and her husband, a hospital chef, could open their own restaurant. Five years later, they debuted The Taste of Three One Cafe, a small, homey spot downtown that serves Somali food, as well as Caribbean, East African, and other international fare. “We wanted to create a restaurant where everyone was welcome, a real community space,” Ali says. And they quickly achieved that: By early this year as many as 200 people were cycling through the beloved 15-seat restaurant on its busiest days, enjoying everything from curried goat to spaghetti with muufa, or Somali flatbread.58
Ali’s story is part of a long history of Somali immigrants in Lewiston, Maine. Somali immigrants began arriving in the community in 2002, and now make up almost one in 10 resi-dents. After some initial community tension — most notably, the decision by an outside white supremacist church to hold a rally protesting the Somali migration in 2003 — immigrants from the war-torn East African country began contributing heavily to Lewiston’s economic revitalization and growth in the last five years. Somali-owned businesses now crowd Lisbon Street, a stretch of downtown Lewiston once plagued by high vacancy rates and empty store fronts. “It used to be the kind of place people were afraid to go to at night,” says Ismail Ahmed, who used to work with newly arrived immigrants in the com-munity, “but the Somali businesses changed it.” 59
OPEN FOR BUSINESS 25

26 PARTNERSHIP FOR A NEW AMERICAN ECONOMY
Politicians are looking to entrepreneurs to create the companies that are going to help America grow its way out of the recession and create jobs to put the millions of unemployed back to work. As this report shows, im-migrant entrepreneurs are central to new-business cre-ation in this country, creating businesses at an increas-ing rate at a time when the rate of native-born business-generation is declining. Nearly three in every 10 businesses founded in the United States in 2011 was started by an immigrant, and millions of Americans— roughly one in every 10 workers at privately-owned companies — have their jobs today because of immi-grant business owners. In addition to creating jobs, the businesses that immigrants start also create revenue to boost our GDP, exports to alleviate our trade imbalance, taxes to fund our deficit, and new consumption that fu-els our economy.
So as policy makers consider measures to increase job growth, politicians may disagree on spending more or cutting taxes, protecting or opening markets, or the value of various regulations. But one thing should be beyond argument: any serious plan on job growth must recognize and welcome immigrant en-trepreneurs, who in the coming years will play an out-sized role across the country and across industries in starting new businesses, creating new jobs, and driv-ing economic growth.
OPEN FOR BUSINESS 27
Appendix A. Data and Methodology
28 PARTNERSHIP FOR A NEW AMERICAN ECONOMY
ACS: American Community Survey(2006–2010)
The primary sample used to examine immigrant business ownership and net business income is the 2006-2010 ACS. The ACS microdata include 11.6 million observations for adults. The sample is large enough to allow the exploration of differences in business income across states, indus-tries, skill-level, and country-of-origin amongst immigrant and native-born business owners.
Using the ACS data, business ownership is determined by the class-of-worker question that refers to the respondent’s main job or business activ-ity (i.e., activity with the most hours) at the time of the interview. Business owners are individuals who report that they are 1) “self-employed in own not incorporated business, professional practice, or farm,” or 2) “self-em-ployed in own incorporated business, professional practice, or farm.” This definition includes owners of all types of businesses—incorporated, unin-corporated, employer, and non-employer firms. The samples used in this analysis include all business owners age 18 and over who work 15 or more hours per week at their businesses. To rule out very small-scale busi-nesses, disguised unemployment, or casual sellers of goods and services, only business owners with 15 or more hours worked are included.60 Fif-teen hours per week is chosen as the cutoff because it represents a rea-sonable amount of work effort in the business, about two days per week. Note that self-employed business ownership is defined as the individual’s main job activity, thus removing the potential for counting side businesses owned by wage-and-salary workers.
This study uses all three of the nationally representative Census Bureau datasets with large enough sample sizes to study immigrant business owners in detail.
Two of the datasets are household surveys — the American Community Survey and the Current Population Survey — and provide information on business ownership, startup activity and business income.
The third dataset is a business-level survey — the Survey of Business Owners — and provides information on business sales, employment, payroll and exports. The datasets also provide detailed information on immigrant owners such as source country, skill level, state of residence, and industry of business.
CPS: Current Population Survey(2007–2011)
Although research on entrepreneurship is growing rapidly, very few na-tional datasets provide information on recent trends in business forma-tion. This report derives a measure to study immigrant business startup activity from matched data from the 2007-2011 Current Population Surveys (CPS). The measure captures the rate of business creation at the individual owner level. The underlying datasets used to create the entrepreneurship or business formation measure are the basic monthly files of the CPS. Although the CPS is commonly used as cross-section-al data, longitudinal data can be created by linking the CPS files over time. The surveys, conducted monthly by the U.S. Bureau of the Census and the U.S. Bureau of Labor Statistics, are representative of the entire U.S. population and contain observations for more than 130,000 peo-ple. Combining the 2007 to 2010 monthly data creates a sample size of 3.8 million adult observations.
Households in the CPS are interviewed each month over a four-month period. Eight months later they are re-interviewed in each month of a second four-month period. Thus, individuals who are interviewed in January, February, March, and April of one year are interviewed again in January, February, March, and April of the following year. The rotation pattern of the CPS thus allows for matching information on individuals monthly for 75 percent of all respondents to each survey. To match these data, the report uses the household and individual identifiers pro-vided by the CPS and removes false matches by comparing race, sex, and age codes from the two months. All non-unique matches are also removed from the dataset. Monthly match rates are generally between 94 and 96 percent, and false positive rates are very low.
The business-formation rate is estimated by first identifying all indi-viduals who do not own a business as their main job in the first survey month, then matching CPS files to determine whether they own a busi-ness as their main job (with 15 or more usual hours worked per week) in the following survey month. The business formation rate is thus de-fined as the percentage of the population of non-business owners who start a business each month. To identify whether they are business owners in each month, the survey uses information on their main job, defined as the one with the most hours worked. Thus, individuals who start side or casual businesses are not counted if they are working more hours on a wage-and-salary job.
SBO: Survey of Business Owners(2007)
Estimates of business ownership and formation rates and of the net busi-ness income of owners are available using Census and CPS microdata, but another source of information is provided by business-level data, where the business, rather than the owner, is the focus of the analysis. The main advan-tage of business-level data is that they typically provide more information on business performance than individual-level data, but the main disadvantage is that they do not include information on the demographic characteristics of the owner.61 The only large nationally representative business-level data set in which the immigrant status of the owner is identifiable is the 2007 SBO. For the first time since 1992 (then called the Characteristics of Business Owners), the U.S. Census Bureau in 2007 collected information on the im-migrant status of business owners in its main database of the ownership characteristics of U.S. businesses. The SBO is conducted by the U.S. Census Bureau every five years to collect statistics that describe the composition of U.S. businesses by gender, race, and ethnicity. The universe for the most re-cent survey is all firms operating during 2007 with receipts of $1,000 or more that filed tax forms as individual proprietorships, partnerships, employ-ers or any type of corporation.
The 2007 SBO includes information on whether the business owner is an immigrant which is determined by whether the owner is foreign-born vs. U.S.-born. Following the convention used by the Census Bureau in reporting business statistics by race, immigrant-owned businesses are defined as those with majority foreign-born ownership (51% or more). Similarly, non-immigrant businesses are defined as those with majority U.S.-born ownership (51% or more). Equally-owned firms are also re-ported in the tables presented below but are not included in calculating the immigrant shares.
The 2007 SBO also includes information on the sales, employment, payroll and exports of the business. Unfortunately, however, only business and employer firm counts by foreign-born status were reported in pub-lished reports by the Census Bureau. Instead, the author commissioned the U.S. Census Bureau to conduct special runs using the 2007 SBO that provide information on the sales, employment, payroll and exports of immi-grant-owned businesses and non-immigrant owned businesses.62
OPEN FOR BUSINESS 29
30 PARTNERSHIP FOR A NEW AMERICAN ECONOMY
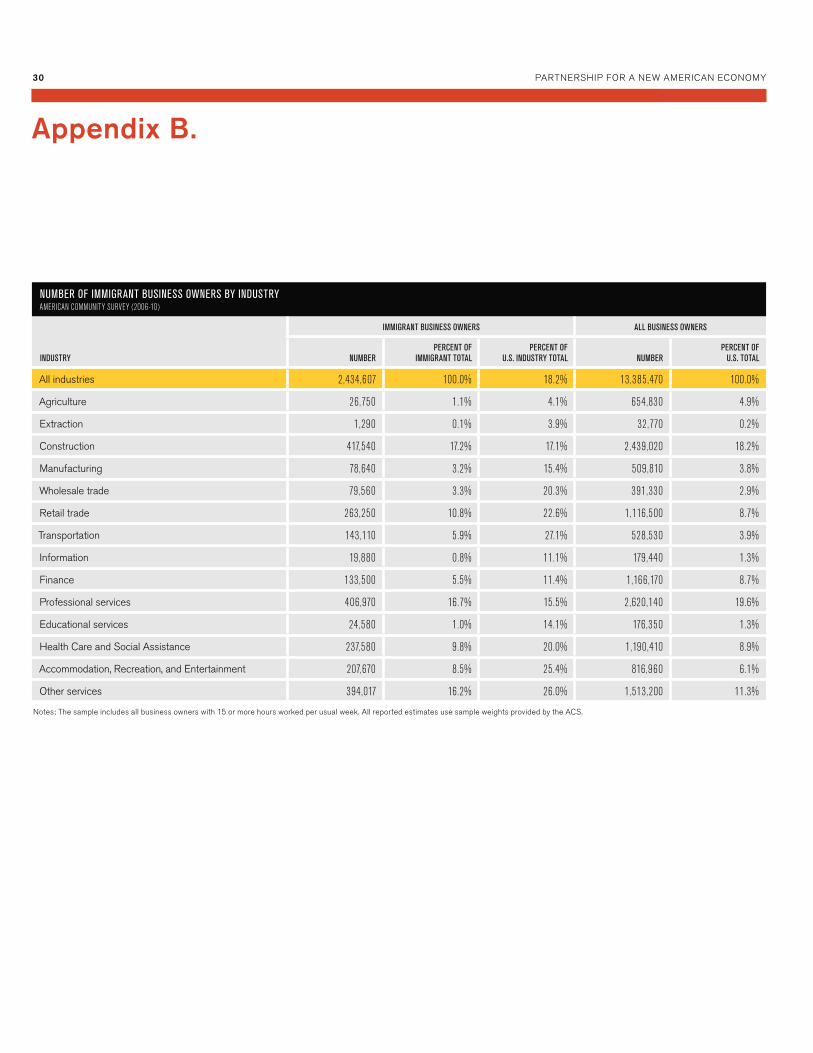
NUMBER OF IMMIGRANT BUSINESS OWNERS BY INDUSTRYAMERICAN COMMUNITY SURVEY (2006-10)
INDUSTRY
IMMIGRANT BUSINESS OWNERS ALL BUSINESS OWNERS
NUMBERPERCENT OF
IMMIGRANT TOTALPERCENT OF
U.S. INDUSTRY TOTAL NUMBERPERCENT OF
U.S. TOTAL
All industries 2,434,607 100.0% 18.2% 13,385,470 100.0%
Agriculture 26,750 1.1% 4.1% 654,830 4.9%
Extraction 1,290 0.1% 3.9% 32,770 0.2%
Construction 417,540 17.2% 17.1% 2,439,020 18.2%
Manufacturing 78,640 3.2% 15.4% 509,810 3.8%
Wholesale trade 79,560 3.3% 20.3% 391,330 2.9%
Retail trade 263,250 10.8% 22.6% 1,116,500 8.7%
Transportation 143,110 5.9% 27.1% 528,530 3.9%
Information 19,880 0.8% 11.1% 179,440 1.3%
Finance 133,500 5.5% 11.4% 1,166,170 8.7%
Professional services 406,970 16.7% 15.5% 2,620,140 19.6%
Educational services 24,580 1.0% 14.1% 176,350 1.3%
Health Care and Social Assistance 237,580 9.8% 20.0% 1,190,410 8.9%
Accommodation, Recreation, and Entertainment 207,670 8.5% 25.4% 816,960 6.1%
Other services 394,017 16.2% 26.0% 1,513,200 11.3%
Notes: The sample includes all business owners with 15 or more hours worked per usual week. All reported estimates use sample weights provided by the ACS.
Appendix B.
OPEN FOR BUSINESS 31
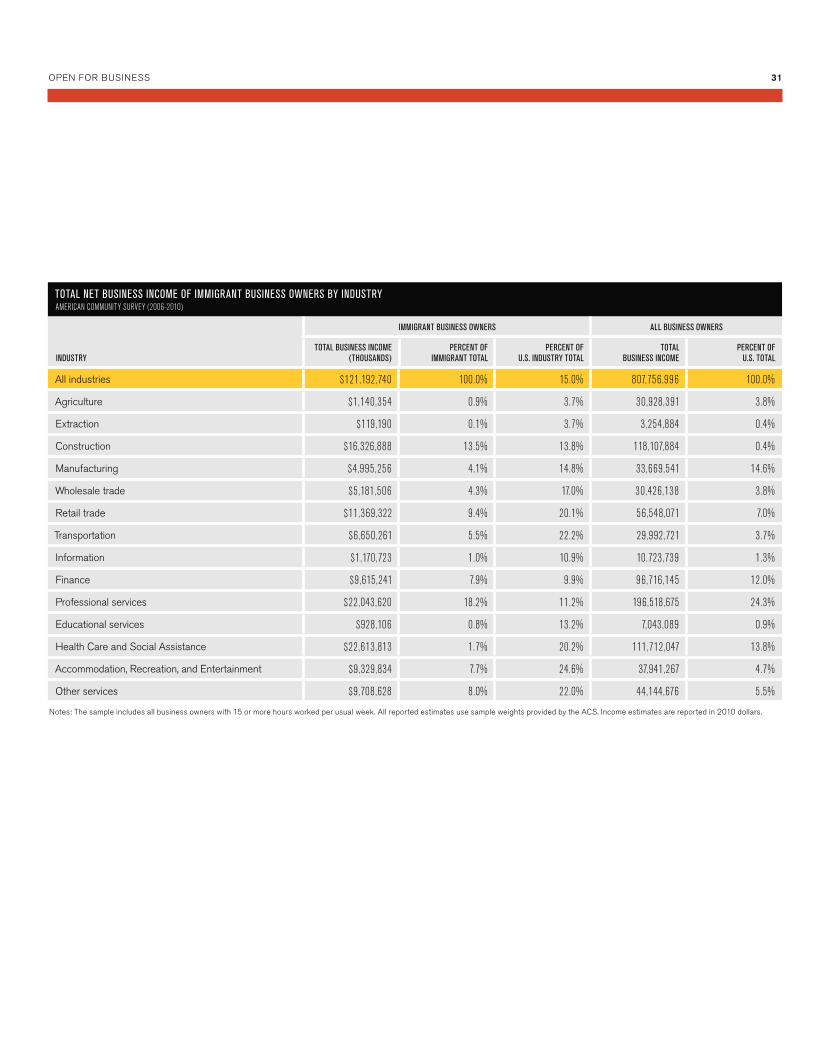
TOTAL NET BUSINESS INCOME OF IMMIGRANT BUSINESS OWNERS BY INDUSTRYAMERICAN COMMUNITY SURVEY (2006-2010)
INDUSTRY
IMMIGRANT BUSINESS OWNERS ALL BUSINESS OWNERS
TOTAL BUSINESS INCOME (THOUSANDS)
PERCENT OF IMMIGRANT TOTAL
PERCENT OF U.S. INDUSTRY TOTAL
TOTAL BUSINESS INCOME
PERCENT OF U.S. TOTAL
All industries $121,192,740 100.0% 15.0% 807,756,996 100.0%
Agriculture $1,140,354 0.9% 3.7% 30,928,391 3.8%
Extraction $119,190 0.1% 3.7% 3,254,884 0.4%
Construction $16,326,888 13.5% 13.8% 118,107,884 0.4%
Manufacturing $4,995,256 4.1% 14.8% 33,669,541 14.6%
Wholesale trade $5,181,506 4.3% 17.0% 30,426,138 3.8%
Retail trade $11,369,322 9.4% 20.1% 56,548,071 7.0%
Transportation $6,650,261 5.5% 22.2% 29,992,721 3.7%
Information $1,170,723 1.0% 10.9% 10.723,739 1.3%
Finance $9,615,241 7.9% 9.9% 96,716,145 12.0%
Professional services $22,043,620 18.2% 11.2% 196,518,675 24.3%
Educational services $928,106 0.8% 13.2% 7,043,089 0.9%
Health Care and Social Assistance $22,613,813 1.7% 20.2% 111,712,047 13.8%
Accommodation, Recreation, and Entertainment $9,329,834 7.7% 24.6% 37,941,267 4.7%
Other services $9,708,628 8.0% 22.0% 44,144,676 5.5%
Notes: The sample includes all business owners with 15 or more hours worked per usual week. All reported estimates use sample weights provided by the ACS. Income estimates are reported in 2010 dollars.
INDUSTRY
NEW IMMIGRANT BUSINESS OWNERS ALL BUSINESS OWNERS
NUMBER
PERCENT OF IMMIGRANT
TOTALPERCENT OF STATE TOTAL NUMBER
PERCENT OF U.S. TOTAL
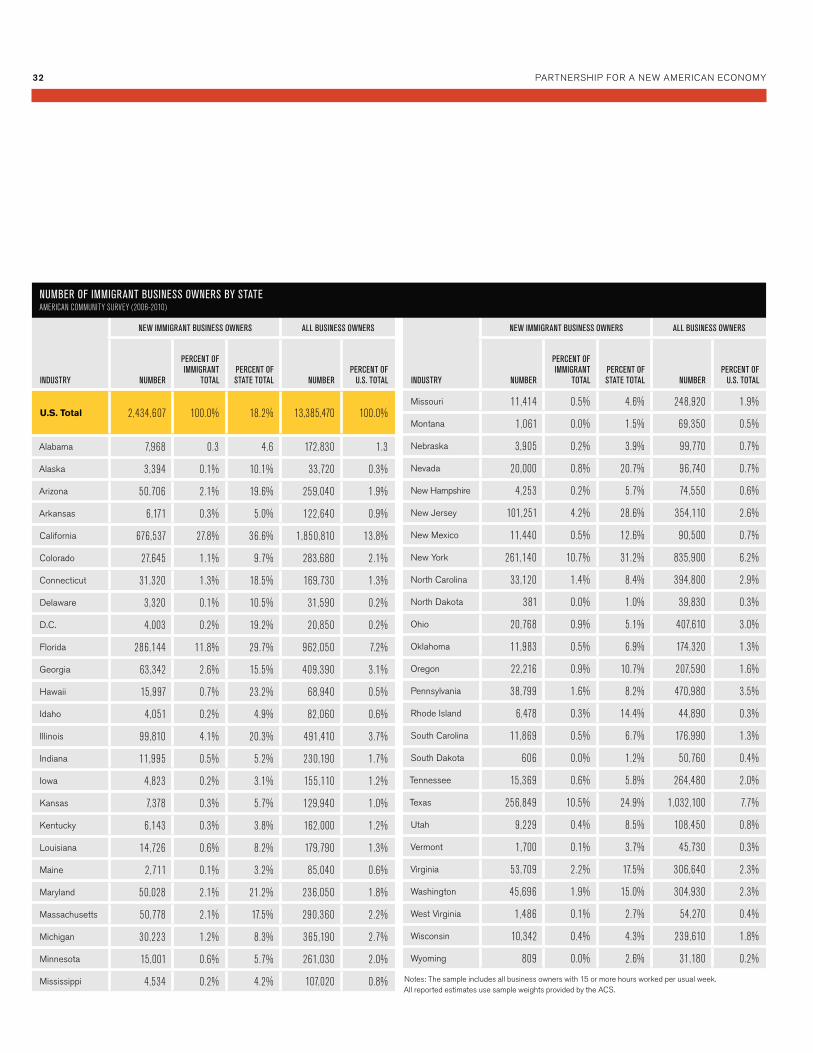
U.S. Total 2,434,607 100.0% 18.2% 13,385,470 100.0%
Alabama 7,968 0.3 4.6 172,830 1.3
Alaska 3,394 0.1% 10.1% 33,720 0.3%
Arizona 50,706 2.1% 19.6% 259,040 1.9%
Arkansas 6,171 0.3% 5.0% 122,640 0.9%
California 676,537 27.8% 36.6% 1,850,810 13.8%
Colorado 27,645 1.1% 9.7% 283,680 2.1%
Connecticut 31,320 1.3% 18.5% 169,730 1.3%
Delaware 3,320 0.1% 10.5% 31,590 0.2%
D.C. 4,003 0.2% 19.2% 20,850 0.2%
Florida 286,144 11.8% 29.7% 962,050 7.2%
Georgia 63,342 2.6% 15.5% 409,390 3.1%
Hawaii 15,997 0.7% 23.2% 68,940 0.5%
Idaho 4,051 0.2% 4.9% 82,060 0.6%
Illinois 99,810 4.1% 20.3% 491,410 3.7%
Indiana 11,995 0.5% 5.2% 230,190 1.7%
Iowa 4,823 0.2% 3.1% 155,110 1.2%
Kansas 7,378 0.3% 5.7% 129,940 1.0%
Kentucky 6,143 0.3% 3.8% 162,000 1.2%
Louisiana 14,726 0.6% 8.2% 179,790 1.3%
Maine 2,711 0.1% 3.2% 85,040 0.6%
Maryland 50,028 2.1% 21.2% 236,050 1.8%
Massachusetts 50,778 2.1% 17.5% 290,360 2.2%
Michigan 30,223 1.2% 8.3% 365,190 2.7%
Minnesota 15,001 0.6% 5.7% 261,030 2.0%
Mississippi 4,534 0.2% 4.2% 107,020 0.8%
INDUSTRY
NEW IMMIGRANT BUSINESS OWNERS ALL BUSINESS OWNERS
NUMBER
PERCENT OF IMMIGRANT
TOTALPERCENT OF STATE TOTAL NUMBER
PERCENT OF U.S. TOTAL
Missouri 11,414 0.5% 4.6% 248,920 1.9%
Montana 1,061 0.0% 1.5% 69,350 0.5%
Nebraska 3,905 0.2% 3.9% 99,770 0.7%
Nevada 20,000 0.8% 20.7% 96,740 0.7%
New Hampshire 4,253 0.2% 5.7% 74,550 0.6%
New Jersey 101,251 4.2% 28.6% 354,110 2.6%
New Mexico 11,440 0.5% 12.6% 90,500 0.7%
New York 261,140 10.7% 31.2% 835,900 6.2%
North Carolina 33,120 1.4% 8.4% 394,800 2.9%
North Dakota 381 0.0% 1.0% 39,830 0.3%
Ohio 20,768 0.9% 5.1% 407,610 3.0%
Oklahoma 11,983 0.5% 6.9% 174,320 1.3%
Oregon 22,216 0.9% 10.7% 207,590 1.6%
Pennsylvania 38,799 1.6% 8.2% 470,980 3.5%
Rhode Island 6,478 0.3% 14.4% 44,890 0.3%
South Carolina 11,869 0.5% 6.7% 176,990 1.3%
South Dakota 606 0.0% 1.2% 50,760 0.4%
Tennessee 15,369 0.6% 5.8% 264,480 2.0%
Texas 256,849 10.5% 24.9% 1,032,100 7.7%
Utah 9,229 0.4% 8.5% 108,450 0.8%
Vermont 1,700 0.1% 3.7% 45,730 0.3%
Virginia 53,709 2.2% 17.5% 306,640 2.3%
Washington 45,696 1.9% 15.0% 304,930 2.3%
West Virginia 1,486 0.1% 2.7% 54,270 0.4%
Wisconsin 10,342 0.4% 4.3% 239,610 1.8%
Wyoming 809 0.0% 2.6% 31,180 0.2%
Notes: The sample includes all business owners with 15 or more hours worked per usual week. All reported estimates use sample weights provided by the ACS.
NUMBER OF IMMIGRANT BUSINESS OWNERS BY STATEAMERICAN COMMUNITY SURVEY (2006-2010)
32 PARTNERSHIP FOR A NEW AMERICAN ECONOMY
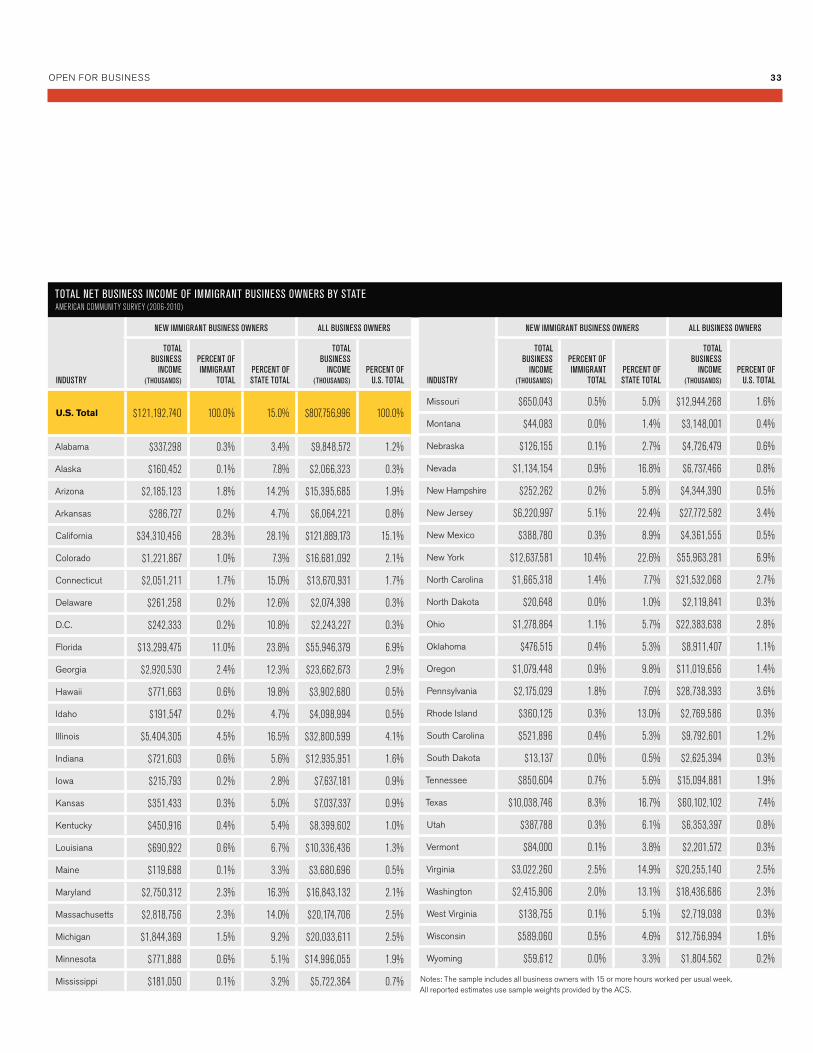
TOTAL NET BUSINESS INCOME OF IMMIGRANT BUSINESS OWNERS BY STATEAMERICAN COMMUNITY SURVEY (2006-2010)
INDUSTRY
NEW IMMIGRANT BUSINESS OWNERS ALL BUSINESS OWNERS
TOTAL BUSINESS
INCOME (THOUSANDS)
PERCENT OF IMMIGRANT
TOTALPERCENT OF STATE TOTAL
TOTAL BUSINESS
INCOME (THOUSANDS)
PERCENT OF U.S. TOTAL
U.S. Total $121,192,740 100.0% 15.0% $807,756,996 100.0%
Alabama $337,298 0.3% 3.4% $9,848,572 1.2%
Alaska $160,452 0.1% 7.8% $2,066,323 0.3%
Arizona $2,185,123 1.8% 14.2% $15,395,685 1.9%
Arkansas $286,727 0.2% 4.7% $6,064,221 0.8%
California $34,310,456 28.3% 28.1% $121,889,173 15.1%
Colorado $1,221,867 1.0% 7.3% $16,681,092 2.1%
Connecticut $2,051,211 1.7% 15.0% $13,670,931 1.7%
Delaware $261,258 0.2% 12.6% $2,074,398 0.3%
D.C. $242,333 0.2% 10.8% $2,243,227 0.3%
Florida $13,299,475 11.0% 23.8% $55,946,379 6.9%
Georgia $2,920,530 2.4% 12.3% $23,662,673 2.9%
Hawaii $771,663 0.6% 19.8% $3,902,680 0.5%
Idaho $191,547 0.2% 4.7% $4,098,994 0.5%
Illinois $5,404,305 4.5% 16.5% $32,800,599 4.1%
Indiana $721,603 0.6% 5.6% $12,935,951 1.6%
Iowa $215,793 0.2% 2.8% $7,637,181 0.9%
Kansas $351,433 0.3% 5.0% $7,037,337 0.9%
Kentucky $450,916 0.4% 5.4% $8,399,602 1.0%
Louisiana $690,922 0.6% 6.7% $10,336,436 1.3%
Maine $119,688 0.1% 3.3% $3,680,696 0.5%
Maryland $2,750,312 2.3% 16.3% $16,843,132 2.1%
Massachusetts $2,818,756 2.3% 14.0% $20,174,706 2.5%
Michigan $1,844,369 1.5% 9.2% $20,033,611 2.5%
Minnesota $771,888 0.6% 5.1% $14,996,055 1.9%
Mississippi $181,050 0.1% 3.2% $5,722,364 0.7%
INDUSTRY
NEW IMMIGRANT BUSINESS OWNERS ALL BUSINESS OWNERS
TOTAL BUSINESS
INCOME (THOUSANDS)
PERCENT OF IMMIGRANT
TOTALPERCENT OF STATE TOTAL
TOTAL BUSINESS
INCOME (THOUSANDS)
PERCENT OF U.S. TOTAL
Missouri $650,043 0.5% 5.0% $12,944,268 1.6%
Montana $44,083 0.0% 1.4% $3,148,001 0.4%
Nebraska $126,155 0.1% 2.7% $4,726,479 0.6%
Nevada $1,134,154 0.9% 16.8% $6,737,466 0.8%
New Hampshire $252,262 0.2% 5.8% $4,344,390 0.5%
New Jersey $6,220,997 5.1% 22.4% $27,772,582 3.4%
New Mexico $388,780 0.3% 8.9% $4,361,555 0.5%
New York $12,637,581 10.4% 22.6% $55,963,281 6.9%
North Carolina $1,665,318 1.4% 7.7% $21,532,068 2.7%
North Dakota $20,648 0.0% 1.0% $2,119,841 0.3%
Ohio $1,278,864 1.1% 5.7% $22,383,638 2.8%
Oklahoma $476,515 0.4% 5.3% $8,911,407 1.1%
Oregon $1,079,448 0.9% 9.8% $11,019,656 1.4%
Pennsylvania $2,175,029 1.8% 7.6% $28,738,393 3.6%
Rhode Island $360,125 0.3% 13.0% $2,769,586 0.3%
South Carolina $521,896 0.4% 5.3% $9,792,601 1.2%
South Dakota $13,137 0.0% 0.5% $2,625,394 0.3%
Tennessee $850,604 0.7% 5.6% $15,094,881 1.9%
Texas $10,038,746 8.3% 16.7% $60,102,102 7.4%
Utah $387,788 0.3% 6.1% $6,353,397 0.8%
Vermont $84,000 0.1% 3.8% $2,201,572 0.3%
Virginia $3,022,260 2.5% 14.9% $20,255,140 2.5%
Washington $2,415,906 2.0% 13.1% $18,436,686 2.3%
West Virginia $138,755 0.1% 5.1% $2,719,038 0.3%
Wisconsin $589,060 0.5% 4.6% $12,756,994 1.6%
Wyoming $59,612 0.0% 3.3% $1,804,562 0.2%
Notes: The sample includes all business owners with 15 or more hours worked per usual week. All reported estimates use sample weights provided by the ACS.
OPEN FOR BUSINESS 33
34 PARTNERSHIP FOR A NEW AMERICAN ECONOMY
References
Borjas, G. 1986. The self-employment experience of immigrants. Journal of Human Resources, 21, Fall: 487 506.
Bradford, William D. 2003. “The Wealth Dynamics of Entrepreneurship for Black and White Families in the U.S.,” Review of Income and Wealth, 49(1): 89-116.
Bucks, Brian K., Arthur B. Kennickell, and Kevin B.Moore. 2006. “Recent Changes in U.S. Family Finances: Evidence from the 2001 and 2004 Survey of Consumer Finances,” Federal Reserve Bulletin, Washington, D.C.: Board of Governors of the Federal Reserve System.
Clark, Kenneth and Stephen Drinkwater. 2000. “Pushed out or pulled in? Self-employment among ethnic minorities in England and Wales.” Labour Economics. 7, pp.603-628.
Clark, Kenneth and Stephen Drinkwater. 2006. “Changing Patterns of Ethnic Minority Self-Employment in Britain: Evidence from Census Microdata,” IZA Discussion Papers 2495, Bonn, Germany: Institute for the Study of Labor (IZA).
Fairlie, Robert W. 2006. “Entrepreneurship among Disadvantaged Groups: An Analysis of the Dynamics of Self-Employment by Gender, Race and Education,” Handbook of Entrepreneurship, Volume 2, eds. Simon C. Parker, Zoltan J. Acs, and David R. Audretsch, Kluwer Academic Publishers, 437-478.
Fairlie, Robert W. 2008. Estimating the Contribution of Immigrant Business Owners to the U.S. Economy, U.S. Small Business Administration, Office of Advocacy, Washington, D.C.
Fairlie, Robert W. and Alicia M. Robb. 2008. Race and entrepreneurial success: Black-, Asian-, and White-owned businesses in the United States. Cambridge, MA: MIT Press.
Fairlie Robert W., Julie Zissimopoulos, and Harry A. Krashinsky. 2010. The international Asian business success story: A comparison of Chinese, Indian, and other Asian businesses in the United States, Canada, and United Kingdom. International differences in entrepreneurship, in Josh Lerner and Antoinette Shoar, eds. University of Chicago Press and National Bureau of Economic Research, 179-208. Haltiwanger, John, Ron S Jarmin, and Javier Miranda. 2011. “Who Creates Jobs? Small vs. Large vs. Young,” University of Maryland Working Paper.
Headd, B., and R. Saade. 2008. Do business definition decisions distort small business results? Washington, D.C. : U.S. Small Business Administration, Office of Advocacy working paper.
Herander, Mark G., and Luz A. Saavedra. 2005. “Exports and the Structure of Immigrant-Based Networks: The Role of Geographic Proximity,” 87(2): 323-335.
34 PARTNERSHIP FOR A NEW AMERICAN ECONOMY
Hunt, Jennifer, and Marjolaine Gauthier-Loiselle. 2010. “How much doesimmigration boost innovation?” American Economic Journal: Macroeconomics, 2(2): 31–56.
Kerr, William R., and William F. Lincoln. 2010. “The Supply Side of Innovation: H-1B Visa Reforms and U.S. Ethnic Invention”, Journal of Labor Economics, 28(3): 473-508.
Lofstrom, Magnus. 2002. “Labor market assimilation and the self-employment decision of immigrant entrepreneurs”, Journal of Population Economics, 15(1), January, 83-114.
OECD (2005). SME and Entrepreneurship Outlook — 2005 Edition, Organisation for Economic Co-operation and Development Press.
Partnership for a New American Economy and the Partnership for New York City. 2012. Not Coming to America: Why the U.S. is Falling Behind in the Global Race for Talent.
Reynolds, Paul. 2005. Entrepreneurship in the US: The Future is Now. Springer.
Saxenian, A. 1999. Silicon Valley’s new immigrant entrepreneurs, San Francisco: Public Policy Institute of California.
Saxenian, A. 2000. Networks of immigrant entrepreneurs. In The Silicon Valley edge: A habitat for innovation and entrepreneurship. C. Lee, W. F. Miller, and H. S. Rowen, eds. Stanford: Stanford University Press.
Schuetze, H. J., and H. Antecol. 2007. Immigration, entrepreneurship and the venture start-up process. The life cycle of entrepreneurial ventures: International handbook series on entrepreneurship, vol. 3, S. Parker, ed. Springer: New York.
Singer, Audrey. 2012. Immigrant Workers in the U.S. Labor Force, Brookings Institute and Partnership for a New American Economy Report.
U.S. Department of Homeland Security. 2011. 2010 yearbook of immigration statistics, Washington, D.C.: Office of Immigration Statistics, http://www.dhs.gov/xlibrary/assets/statistics/yearbook/2010/ois_yb_2010.pdf.
U.S. Department of Homeland Security. 2012. EB-5 Immigrant Investor, http://www.uscis.gov.
U.S. Small Business Administration, Office of Advocacy. 2011. Research and Statistics, http://www.sba.gov/advocacy/847.
Wadhwa, V. A. Saxenian, B. Rissing, and G. Gereff. 2007. America’s new immigrant entrepreneurs. Durham, NC: Duke University.
OPEN FOR BUSINESS 35
1 Tim Kane, Ewing Marion Kauffman Foundation, The Importance of Startups in Job Creation and Job Destruction (2010), http://www.kauffman.org/uploadedfiles/firm_formation_importance_of_startups.pdf.
2 Press Release, Ewing Marion Kaufman Foundation, Number of New Firms Continues to Slide, According to New Census Bureau Data (May 2, 2012), http://www.kauffman.org/newsroom/number-of-firms-continues-to-slide-according-to-new-census-bureau-data.aspx.
3 All individual stories in this report come from interviews conducted by Angela Marek Zeitlin and Hanna Siegel of the Partnership for a New American Economy, June-August, 2012.
4 See infra, section 6.
5 Fiscal Policy Institute, Immigrant Small Business Owners: A Significant and Growing Part of the American Economy (2012), http://fiscalpolicy.org/wp-content/uploads/2012/06/immigrant-small-business-owners-FPI-20120614.pdf. Research has shown that immigrants in many developed countries around the world, including the United States, United Kingdom, Canada, and Australia, have higher business ownership rates than their native-born counterparts. See: G.J. Borjas, The Self-Employment Experience of Immigrants, Journal of Human Resources, 21, Fall: 487-506 (1986); Magnus Lofstrom, Labor Market Assimilation and the Self-Employment Decision of Immigrant Entrepreneurs, Journal of Population Economics, 15(1), January: 83-114 (2002); Kenneth Clark and Stephen Drinkwater, Pushed Out or Pulled In? Self-Employment among Ethnic Minorities in England and Wales, Labour Economics, 7: 603-628 (2000); Clark and Drinkwater, Changing Patterns of Ethnic Minority Self-Employment in Britain: Evidence from Census Microdata, IZA Discussion Papers 2495, Institute for the Study of Labor (2006); H. J. Schuetze and H. Antecol, Immigration, Entrepreneurship and the Venture Start-Up Process, The Life Cycle of Entrepreneurial Ventures: International Handbook Series on Entrepreneurship, Vol. 3 (2007); Robert W. Fairlie, et al., The International Asian Business Success Story: A Comparison of Chinese, Indian, and Other Asian Businesses in the United States, Canada, and United Kingdom, International Differences in Entrepreneurship, University of Chicago Press and National Bureau of Economic Research: 179-208 (2010). Their impact has been especially well documented in certain sectors such as technology and engineering, where they play a disproportionately large role in founding companies and inventing the products that lead to companies. Immigrants found 50 percent of Silicon Valley companies and are behind more than three out of every four patents from the top U.S. universities. See: Vivek Wadhwa, et al., America’s New Immigrant Entrepreneurs (2007), http://people.ischool.berkeley.edu/~anno/Papers/Americas_new_immigrant_entrepreneurs_I.pdf; A. Saxenian, Silicon Valley’s New Immigrant Entrepreneurs, Public Policy Institute of California (1999); Saxenian, Networks of Immigrant Entrepreneurs, The Silicon Valley Edge: A Habitat for Innovation and Entrepreneurship, Stanford University Press (2000); Partnership for a New American Economy and the Partnership for New York City, Not Coming to America: Why the U.S. is Falling Behind in the Global Race for Talent (2012), http://www.renewoureconomy.org/sites/all/themes/pnae/not-coming-to-america.pdf. This impact of immigrants on innovation has even been found to have positive spillover effects in increasing the patenting rate of the native-born as well. See: Jennifer Hunt and Marjolaine Gauthier-Loiselle, How much Does Immigration Boost Innovation? American Economic Journal: Macroeconomics, 2(2): 31–56 (2010); William R. Kerr and William F. Lincoln, The Supply Side of Innovation: H-1B Visa Reforms and U.S. Ethnic Invention, Journal of Labor Economics, 28(3): 473-508 (2010). In recognition of the positive benefits of immigrant entrepreneurship, many developed countries have created special visas and entry requirements for immigrant entrepreneurs. See: Schuetze and Antecol (2006); Partnership for a New American Economy (2012).
6 The ACS is the only nationally representative dataset with a large enough sample size to examine business ownership among immigrant groups, and the SBO is the only business-level dataset with information on a large sample of immigrants. Matching consecutive months of CPS data creates the only longitudinal data source, which is needed to study business formation, with large enough immigrant samples. The full methodology is explained in greater detail in Appendix A. The results presented here build on an earlier related study using the 2000 Census 5 percent PUMS, 1996-2007 CPS and 1992 Characteristics of Business Owners. See: Robert W. Fairlie, U.S. Small Business Administration, Office of Advocacy, Estimating the Contribution of Immigrant Business Owners to the U.S. Economy (2008).
7 Tim Kane, Ewing Marion Kauffman Foundation, The Importance of Startups in Job Creation and Job Destruction (2010), http://www.kauffman.org/uploadedfiles/firm_formation_importance_of_startups.pdf.
8 Press Release, White House, President Obama To Sign Jumpstart Our Business Startups (JOBS) Act (April 5, 2012), http://www.whitehouse.gov/the-press-office/2012/04/05/president-obama-sign-jumpstart-our-business-startups-jobs-act. Another recent examples is the “STARTUP 2.0” bill introduced by Democratic Senators Mark Warner and Chris Coons and Republican Senators Jerry Moran and Marco Rubio in May of 2012 that would create a visa for foreign entrepreneurs, provide tax credits for research and development at young startups, and make permanent a capital gains exemption to help draw investment to new startups. See: Press Release, Senator Marco Rubio, Sens. Rubio, Coons, Moran, and Warner, Offer Bipartisan Job Creation Plan (May 22, 2012), http://www.rubio.senate.gov/public/index.cfm/press-releases?ID=d8319a4a-b008-4b7e-98f4-1c0339c78bd5.
9 John Haltiwanger, Ron Jarmin, and Javier Miranda, Ewing Marion Kauffman Foundation, Where Have All the Young Firms Gone? (May 2012), http://www.census.gov/ces/pdf/BDS_StatBrief6_Young_Firms.pdf.
10 The American Community Survey, which provides annual data on immigrant share of the population, was not fully implemented until 2005. For prior years, data was only available from the decennial censuses. According to the census, immigrants accounted for 7.9 percent of the population in 1990 and 11.1 percent in 2000.
11 Telephone Interview with Rohit Arora (Jul 12, 2012).
12 The World Bank, World Development Indicators, http://data.worldbank.org/country/united-states (last accessed Aug 8, 2012).
13 Id.
14 Made in America: Increasing Jobs through Exports and Trade, Testimony of Daniel J. Ikenson of the Cato Institute to the Subcommittee on Commerce, Manufacturing, and Trade (Mar 16, 2011), http://www.cato.org/publications/congressional-testimony/made-america-increasing-jobs-through-exports-trade.
15 Id.
16 U.S. Department of Commerce, International Trade Administration, Exports Play a Vital Role in Supporting U.S. Employment (May 2010), http://trade.gov/publications/ita-newsletter/0510/itu_0510.pdf.
17 Tyler Cowen, What Export-Oriented America Means, The American Interest (May/June 2012), http://www.the-american-interest.com/article.cfm?piece=1227.
18 United States Department of Labor, Bureau of Labor Statistics, U.S. Import and Export Price Indexes (June 2012), http://www.bls.gov/news.release/ximpim.nr0.htm (last accessed Aug 8, 2012).
19 Giovanni Peri and Francisco Requena-Silvente, Do Immigrants Create Exports? Evidence From Spain, Vox (Jan 26, 2010), http://www.voxeu.org/article/do-immigrants-create-exports-new-evidence-spain.
20 Mark G. Herander and Luz A. Saavedra, Exports and the Structure of Immigrant-Based Networks: The Role of Geographic Proximity, The Review of Economics and Statistics, 87(2): 323-335 (2005).
21 The data used to calculate exports come from the 2007 Survey of Business Owners which, for the first time, included information on both owner’s immigrant status and exports. Tabulations of export levels for immigrant and non-immigrant businesses from the 2007 SBO were commissioned specifically for the research in this report. Similar to sales, employment and payroll these data are not available for immigrant businesses in published reports by the Census Bureau. The reported percentages represent the share of total sales of goods and services represented by exports outside of the United States.
22 Tyler Cowen, What Export-Oriented America Means, The American Interest (May/June 2012), http://www.the-american-interest.com/article.cfm?piece=1227.
23 Telephone Interview with Metta Murdaya (Jul 24, 2012).
24 United States Department of Commerce, Bureau of Economic Analysis, National Data: Gross Domestic Product, http://www.bea.gov/national/index.htm#gdp (last accessed Aug 8, 2012).
25 Id.
26 Congressional Budget Office, Federal Budget Deficit for Fiscal Year 2011: $1.3 Trillion (Nov 8, 2011), http://www.cbo.gov/publication/42573; Congressional Budget Office, Recap of Fiscal Year 2010 Budget Results (Nov 5, 2010) http://www.cbo.gov/publication/25114; Congressional Budget Office, Federal Budget Deficit Totals $1.4 Trillion in Fiscal Year 2009 (Nov 6, 2009), http://www.cbo.gov/publication/24992.
27 Recession Cost Uncle Sam $4.2 Trillion, Wall Street Journal, April 21, 2011, http://articles.marketwatch.com/2011-04-21/commentary/30746730_1_stimulus-spending-tax-cuts-unemployment-benefits.
28 This number actually undersells the revenue generated by immigrant-owned firms because it does not include any revenue from the 12.5 million firms in American where the founder’s status—immigrant or otherwise—is indeterminate, a group of companies that generate more than $3 trillion in sales annually.
29 The income generated by immigrant-owned businesses is measured by using the American Community Survey to examine the contribution of immigrant business owners to total business income generated by all U.S. business owners. This measure captures the owner’s income from the business and does not capture what is paid to employees (which was examined later). The revenue generated by immigrant-owned businesses is measured by examining the total sales and receipts by immigrant-owned businesses. As noted above, however, published estimates from the SBO do not report sales for immigrant business owners. Instead, estimates from specially commissioned tabulations from the SBO are reported. The SBO is the only large nationally representative business-level dataset that provides information on immigrant status. Total sales information in the SBO is based on administrative data collected by the Census Bureau from tax reporting. Total sales data do not subtract out total expenses or payroll expenses, and thus do not represent profits of the business. Total sales represent a gross measure and not a net measure of the productivity of the firm. But, total sales do capture the total gross flow of revenues to the business, and thus represent a good measure of business contributions to the economy. As noted above, following the convention used by the Census Bureau in reporting business statistics by race, immigrant-owned businesses are defined as those with majority foreign-born ownership (51% or more) and non-immigrant businesses are defined as those with majority U.S.-born ownership (51% or more).
End Notes
36 PARTNERSHIP FOR A NEW AMERICAN ECONOMY
30 The data on revenue from immigrant-owned businesses is not available from 2000, so the analysis of changes in business revenue over time cannot be made.
31 U.S. Department of Labor, Bureau of Labor Statistics, Consumer Price Index, ftp://ftp.bls.gov/pub/special.requests/cpi/cpiai.txt (last accessed Aug 8, 2012).
32 As estimated in the 2000 Census 5 Percent PUMS data. See: Fairlie (2008).
33 Mortimer B. Zuckerman, The Great Jobs Recession Goes On, U.S. News and World Report, Feb 11, 2011, http://www.usnews.com/opinion/mzuckerman/articles/2011/02/11/the-great-jobs-recession-goes-on.
34 United States Department of Labor, Bureau of Labor Statistics, The Recession of 2007-2009 (Feb 2012), http://www.bls.gov/spotlight/2012/recession/
35 Id.
36 Press Release, U.S. Department of Labor, Bureau of Labor Statistics, The Employment Situdation—2012 (Aug 3, 2012), http://www.bls.gov/news.release/pdf/empsit.pdf.
37 Estimates of employment for immigrant-owned businesses are derived from specially-commissioned tabulations of the Survey of Business Owners, which is the only dataset with employment information for a large nationally representative sample of immigrant-owned businesses.
38 “Privately-owned companies” excludes the government, nonprofits, public companies, which have no one person or group of people that can be called the “owner,” and any other company where the owner is not identifiable.
39 Telephone Interview with Sergio Bermudez (Jul 24, 2012).
40 For example, research by Vivek Wadhwa has found that immigrants founded more than 25 percent of technology companies nationwide, and more than 50 percent of such companies in Silicon Valley. See: Wadhwa et al. (2007).
41 Press Release, U.S. Department of Labor, Bureau of Labor Statistics, Employment Projections—2010-20 (Feb 1, 2012), http://www.bls.gov/news.release/pdf/ecopro.pdf.
42 The CPS data from which the immigrant share of new companies is derived only exists for the category of “education and health services” and is not broken up precisely into “health care and social assistance” and “educational services,” which BLS lists as two separate categories.
43 The CPS data from which the immigrant share of new companies is derived gives data from “wholesale and retail trade,” and not specifically for “retail trade.”
44 The CPS data from which the immigrant share of new companies is derived only exists for the category of “education and health services” and is not broken up precisely into “health care and social assistance” and “educational services,” which BLS lists as two separate categories.
45 The Bureau of Labor Statistics uses the industry sector of “Other Services” to “comprise[] establishments engaged in providing services not specifically provided for elsewhere in the classification system. Establishments in this sector are primarily engaged in activities, such as equipment and machinery repairing, promoting or administering religious activities, grantmaking, advocacy, and providing drycleaning and laundry services, personal care services, death care services, pet care services, photofinishing services, temporary parking services, and dating services.” See: U.S. Department of Labor, Bureau of Labor Statistics, Description of Other Services (except Public Administration): NAICS 81, http://www.bls.gov/iag/tgs/iag81.htm (last accessed Aug 10, 2012).
46 The lack of available data has made it very difficult to conclusively analyze the failure rates of immigrant and native-owned businesses, and there are no conclusive studies on the subject. Some anecdotal evidence has suggested that immigrant startups fail at a slightly higher rate than those of the native-born. Conversely, a few studies have shown that some specific immigrant groups have lower failure rates than their native-born counterparts, such as Korean and Chinese retail storeowners, who were found to have failure rates more than 40 percent lower than both native-born white and African-American retail storeowners. See: Timothy Bates, Race, Self-Employment and Upward Mobility, Woodrow Wilson Center Press: 215 (1997). Evidence from other countries is equally inconclusive, but does seem to suggest that immigrants are in fact slightly less likely to have their startups succeed. In France, for example, researchers found that immigrant-owned startups failed at higher rates during growth periods (54 percent of native-owned startups were still in existence after three years, compared with 40 percent for immigrant-owned startups), but that in periods of slow economic growth the failure rates of the two groups were equivalent. See: Maria Vincenza Desiderio and John Salt, Main Findings of the Conference on Entrepreneurship and Employment Creation of Immigrants in OECD Countries, Organisation for Economic Co-operation and Development, Paris (June 9-10, 2010), http://www.google.com/url?sa=t&rct=j&q=&esrc=s&source=web&cd=3&ved=0CFsQFjAC&url=http%3A%2F%2Fwww.oecd.org%2Fmigration%2F46424942.doc&ei=JMsjUJqlN6X40gHJ24DgDw&usg=AFQjCNE5obqcJmU1TZosBNkRQFSGKLOqww.
47 Immigrants already own more than one-quarter of all businesses in the transportation and more than 20 percent of all businesses in retail trade, wholesale trade, and health care and social assistance.
48 Telephone Interview with Tashitaa Tufaa (Jul 16, 2012).
49 The immigrant population numbers come from an analysis of the 2010 census conducted by the Migration Policy Institute. See: Migration Policy Institute, 2010 American Community Survey and Census Data on the Foreign Born by State, http://www.migrationinformation.org/datahub/acscensus.cfm (last accessed Aug 10, 2012).
50 This is consistent with previous findings on the importance of immigrants in California and the Silicon Valley. See: Saxenian (1999 & 2000); and Wadhwa et al. (2006).
51 See discussion of failure rates in footnote 46.
52 Alex Goldmark, Terracycle to Turn Dirty Diapers Into Park Benches, Fast Company, August 27, 2011, http://www.fastcoexist.com/1679425/terracycle-to-turn-dirty-diapers-into-park-benches.
53 Telephone Interview with Tom Szaky (Mar 30, 2012).
54 Estimates of immigrant-owned business starts are reported only for the 10 largest immigrant groups because sample sizes are not large enough. Although the number of non-business owners is large for each source country, the number of new business owners per month recorded in the data is relatively small (0.28 percent).
55 According to past research by the Brookings Institution and the Partnership for a New American Economy, Roughly 29 percent of immigrants lack a high school diploma compared with just 7.4 percent of the native-born. See: Brookings Institution & Partnership for a New American Economy, Slideshow: Immigrant Workers in the U.S. Labor Force (Mar 2012), http://www.renewoureconomy.org/brook_slideshow#3.
56 Unemployment in the U.S. tends to track educational attainment. In 2011, high school dropouts had an unemployment rate of 14.1 percent. The unemployment rate dropped to 9.4 percent for those with a high school degree, 4.9 percent for those with a college degree, 3.6 percent for those with a masters, and 2.5 percent for those with a PhD. New businesses in communities where many or most residents lack a high school diploma should therefore be a key priority of our economic recovery. And, to the extent that people in the United States tend to live in communities with people of similar educational attainment, the data suggest that immigrants are disproportionately poised to start new businesses among communities with the highest unemployment. See: U.S. Department of Labor, Bureau of Labor Statistics, Employment Projections (Mar 23, 2012), http://www.bls.gov/emp/ep_chart_001.htm/ (last accessed Aug 8, 2012).
57 See: U.S. Chamber of Commerce, Immigrant Entrepreneurs: Creating Jobs and Strengthening the Economy, www.uschamber.com/sites/default/files/reports/Immigrant%20Entrepreneur%20final%201-22-2012.pdf; Wall Street Journal, Migrants Keep Small-Business Faith, (Jun 13, 2012), http://online.wsj.com/article/SB10001424052702303410404577464853249366254.html; and Immigrant Learning Center, Immigrant Entrepreneurs and Neighborhood Revitalization, http://www.ilctr.org/wp-content/uploads/2009/09/immigrant_entrepreneur.pdf.
58 Telephone Interview with Shukri Ali (Jul 15, 2012).
59 Telephone Interview with Ismail Ahmed (Jul 11, 2012).
60 Some unemployed individuals may report being self-employed if they sell a small quantity of goods or services while not working at their regular jobs.
61 For more discussion on the comparison between individual-level and business-level data on entrepreneurship, see: B. Headd and R. Saade, Do Business Definition Decisions Distort Small Business Results? U.S. Small Business Administration, Office of Advocacy working paper (2008); and Robert W. Fairlie and Alicia M. Robb, Race and Entrepreneurial Success: Black-, Asian-, and White-Owned Businesses in the United States, MIT Press, (2008).
62 Published data from the Census Bureau also only report foreign-born owners and not businesses (which is why no sales, employment, payroll and export information is reported). Nonetheless, research by Robert W. Fairlie finds that published estimates for the SBO report show a very similar ratio of foreign-born owners to foreign-born and U.S. born owners.
OPEN FOR BUSINESS

© 2012. ALL RIGHTS RESERVED
W W W.RENEWOURECONOMY.ORG