open optics msa design guide · open optics msa design guide ... estimating the link budget in a...
TRANSCRIPT
Document No.: MLNX-15-4727 Rev 1.0
Open Optics MSA
Design Guide
2 March 8, 2015
Contents
Contents .............................................................................................................................. 2
1 Overview ....................................................................................................................... 3
2 Data Center Cabling ...................................................................................................... 5
2.1 Data Center Optical Link ................................................................................... 5
3 Wavelength Division Multiplexing (WDM) ................................................................... 6
4 Why C-Band is the Best Choice ..................................................................................... 8
4.1 C-Band Channel Plan Examples......................................................................... 9
5 Link Cost Comparisons ................................................................................................ 10
6 Specifications .............................................................................................................. 13
7 Definitions of optical parameters and measurement and measurement methods .. 14
7.1 Test patterns for optical parameters .............................................................. 14
7.2 Optical modulation amplitude (OMA) ............................................................ 14
7.3 Transmitter and dispersion penalty (TDP) ...................................................... 15
7.4 Extinction ratio ................................................................................................ 15
7.5 Receiver sensitivity ......................................................................................... 15
8 Conclusions ................................................................................................................. 15
9 References .................................................................................................................. 15
10 Document Revision History......................................................................................... 16
Open Optics MSA Design Guide
http://opencompute.org 3
1 Overview
The Open Optics MSA1 specification provides a Wavelength Division Multiplexing
(WDM) roadmap to scale data center networks to greater than 1 Tb/s of traffic over a
standard Single Mode Fiber (SMF). It allows 100Gb/s networks to interface with
200Gb/s and 400GGb/s networks and build larger networks. Inspired by long haul
telecom WDM networks which routinely transmit terabits of data over a single fiber, this
architecture is designed to optimize cost and scalability for data center reaches, typically
less than 2km.
Historically, data centers have used VCSEL transceivers and Multi-Mode Fiber (MMF)
as the most cost effective interconnect solution. The first generation data centers were
built using 1Gb/s VCSEL transceivers and the OM2 version of MMF, optimized for
1Gb/s 850nm VCSEL transmission. This combination provided reaches of 500m, long
enough for most data center applications.
For the 10Gb/s generation, data centers replaced both the transceivers and the installed
fiber with new VCSEL based transceivers and OM3 fiber. The OM3 version of MMF,
optimized for 850nm 10Gb/s VCSEL transceivers supported reaches up to 300m.
The 40Gb/s generation did not scale so easily for the following reasons:
The VCSEL solutions were implemented using four parallel 10Gb/s channels, requiring 4x
more trunk cabling and patch panels
The reach for the VCSEL solutions was only 100m over OM3 fiber, not enough to cover
many data center reaches
Installing new OM4 fiber was expensive with a modest increase in reach of 150m
By contrast, the 40Gb/s single mode transceivers used WDM, combining four
wavelength channels onto one single mode fiber. These factors caused many hyper-scale
data centers to convert more of their data center fabric to single mode fiber.
The 100Gb/s generation is scaling even worse:
The 25Gb/s VCSEL solutions require OM4 fiber for 100m reach
More large data centers are converting to single mode fiber
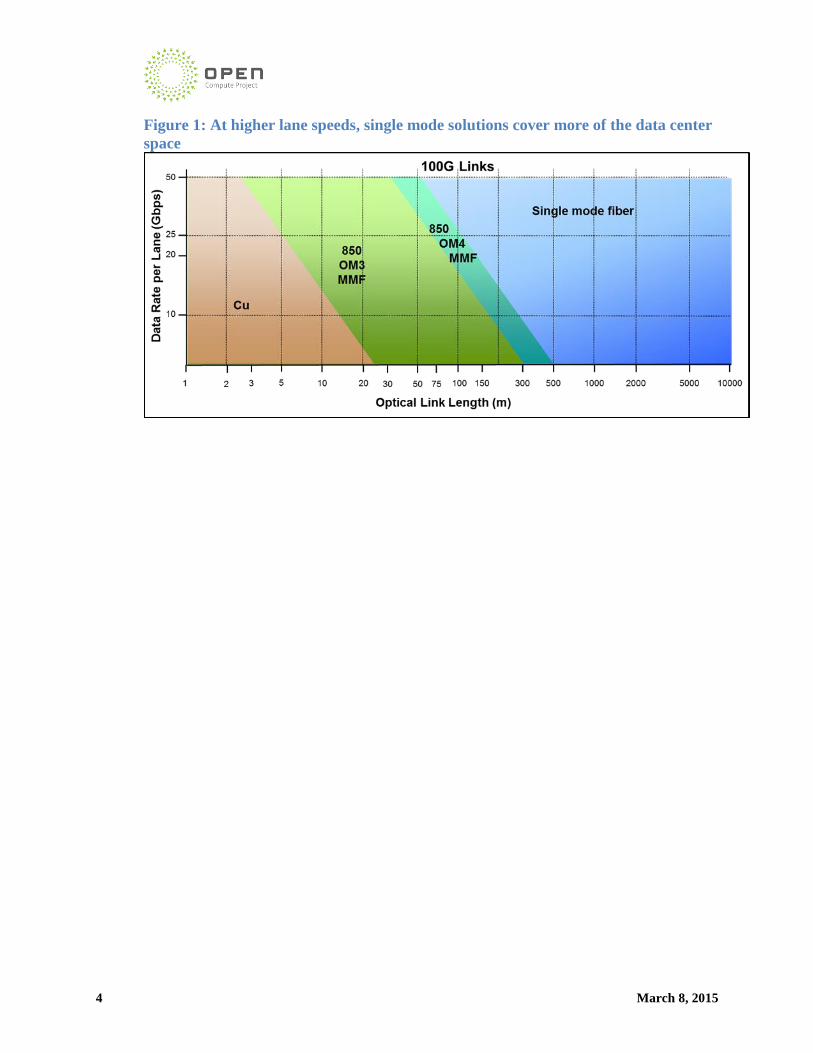
Figure 1 highlights the impact of channel speed and the reach of VCSEL based solutions.
It is also interesting to note that in spite of predictions of the “end of copper,” direct
attach copper (DACs) are widely used, even at 100G, for inside rack cabling where the
reaches are less than 3.5m.
1 http://OpenOpticsMSA.org
4 March 8, 2015
Figure 1: At higher lane speeds, single mode solutions cover more of the data center
space
Open Optics MSA Design Guide
http://opencompute.org 5
2 Data Center Cabling
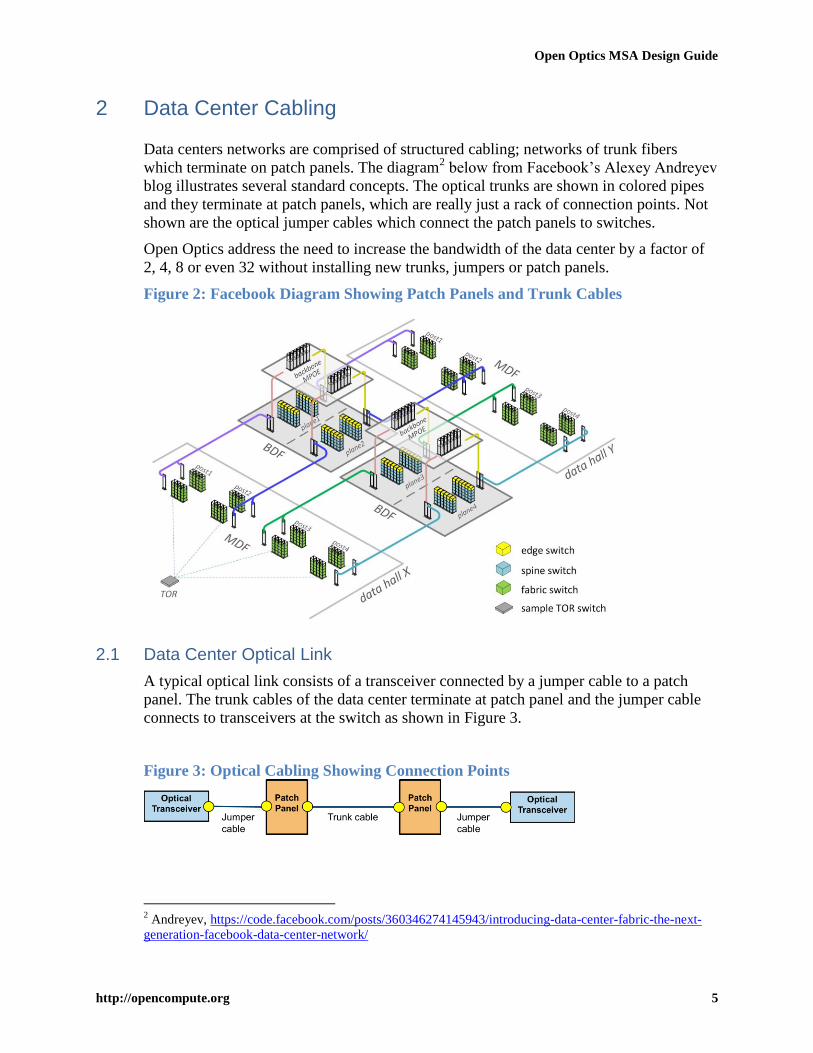
Data centers networks are comprised of structured cabling; networks of trunk fibers
which terminate on patch panels. The diagram2 below from Facebook’s Alexey Andreyev
blog illustrates several standard concepts. The optical trunks are shown in colored pipes
and they terminate at patch panels, which are really just a rack of connection points. Not
shown are the optical jumper cables which connect the patch panels to switches.
Open Optics address the need to increase the bandwidth of the data center by a factor of
2, 4, 8 or even 32 without installing new trunks, jumpers or patch panels.
Figure 2: Facebook Diagram Showing Patch Panels and Trunk Cables
2.1 Data Center Optical Link
A typical optical link consists of a transceiver connected by a jumper cable to a patch
panel. The trunk cables of the data center terminate at patch panel and the jumper cable
connects to transceivers at the switch as shown in Figure 3.
Figure 3: Optical Cabling Showing Connection Points
2 Andreyev, https://code.facebook.com/posts/360346274145943/introducing-data-center-fabric-the-next-
generation-facebook-data-center-network/
6 March 8, 2015
The optical link’s insertion loss is the sum of the worst case connector losses and fiber
attenuation. The IEEE P802.3bs 400G Task Force documented worst case values for
estimating the link budget in a submission by Kolesar3. Table 1 shows the Open Optics
estimate for the worst case link budget for a 2km intra-data center link.
Table 1 – Link Insertion Loss Estimation
Mean Loss Loss at 2.5s Units # items Mean Loss Loss at 2.5s Units
LC Connector 0.20 0.58 dB/LC 4 0.8 1.55 dB
MPO Connector 0.35 0.98 dB/MPO 2 0.7 1.58 dB
Loss (2km SMF) 0.20 0.30 dB/km 2 0.4 0.60 dB
Total Link Loss 1.9 3.2 dB
Insertion Loss Insertion Loss for LinkLink Items
Each connector has a mean loss and standard deviation. Kolesar assumes a 2.5s for the
worst case. Since the connector variability is assumed to be randomly distributed and
independent, the variances can be summed. The worst case SMF fiber loss is assumed to
be ≤ 0.30dB/km over the Open Optics 1550nm wavelength range4.
The Open Optics MSA specifies an optical link budget of 3.5dB which accommodates
worst case assumptions for the previously mentioned six connection points, as well as for
2km of fiber loss with extra margin.
The specification easily ensures operation of a 500m of SMF fiber which covers the vast
majority of data center applications.
3 Wavelength Division Multiplexing (WDM)
Wavelength division multiplexing combines multiple optical wavelengths (frequencies)
onto a single waveguide or single fiber. Like radio stations broadcasting in air, each
optical channel is independent from the others. In an optical network, the separate
channels are generated by lasers set at pre-defined frequencies. A multiplexer combines
the separate channels into one fiber. The data stream travels over fiber to a demultiplexer
where the channels are separated and converted back to electrical signals.
The WDM used in telecom applications, where 80 or more channels are transmitted over
a single fiber strand, is called DWDM (Dense WDM). The density of channels (spaced
very close to each other) increases the cost and complexity of the transmitters and
receivers, yet the benefit of sending more traffic over the same fiber is tremendous. Most
DWDM systems are in the 1550 (C-Band) range.
In Datacom applications, CWDM (Coarse WDM) has been popular for 40Gb/s Ethernet
applications. CWDM, at 20 nm channel spacing, would only fit 3 channels in the space
that DWDM fits 80. With traditional laser assembly technologies, CWDM was low-cost
enough to be widely deployed in data center applications.
3 Kolesar, http://www.ieee802.org/3/bs/public/14_05/kolesar_3bs_01_0514.pdf
4 Anslow, http://www.ieee802.org/3/hssg/public/nov07/anslow_03_1107.xls

Open Optics MSA Design Guide
http://opencompute.org 7
The main problem with CWDM is scalability; CWDM does not readily scale to more
channels. Lasers across such a broad spectrum are difficult to make into arrays;
assembling lasers separately is costly. As of now, none of the major vendors are
proposing expanded wavelength plans to the IEEE or Ethernet Alliance.

8 March 8, 2015
4 Why C-Band is the Best Choice
C-Band has been widely used for DWDM telecom applications because it has the lowest
attenuation loss, and because nearly all fiber amplifiers work in this range, as illustrated
in the chart below. It also shows why 1310 CWDM does not easily expand. Scaling to the
right hits the “water peak” between 1350 and 1420. Scaling to the left increases the loss,
creating other problems.
Figure 4: C-Band (1550 region) Provides Best Window for Optical Transmission
C-Band also provides the best region for any technology using germanium detectors. In
silicon photonics, detectors are made of germanium for the simple reason that many
silicon fabrics include germanium which can be easily incorporated into the chip design.
The chart below shows the high responsivity at 1550 from germanium photo diodes
integrated in silicon photonics chips5.
5Martin, http://www.ieee802.org/3/100GNGOPTX/public/jul12/martin_01_0712_optx.pdf

Open Optics MSA Design Guide
http://opencompute.org 9
Figure 5: C-band (1550) is the Region for the Highest Responsivity for Silicon
Photonics Detectors
4.1 C-Band Channel Plan Examples
The figure below shows examples of the flexibility of the Open Optics MSA
specifications. Many channel plans can be accommodated. The four channel plans may
be used for 4x25G for 100Gb/s transceivers or 4x50G for 200Gb/s transceivers. The eight
channel plans may be used for 400Gb/s transceivers. At 50G, the 32 wavelength plan
provides for 1.6Tb/s on a single link.
Newer generation of embedded transceivers will increase the need for density and low-
cost cabling.

10 March 8, 2015
Figure 6: C-band Channel Options for Scalability
5 Link Cost Comparisons
The relative link cost includes two transceivers, SM jumper cables, a portion of two 6-
port patch panels (LC/MPO), and a portion of a 24 SM fiber trunk cable as shown in
Figure 3. The number of fibers needed is dependent on the transceiver architecture
(CWDM, PSM, or Open Optics) and is also dependent on the transceiver’s aggregate data
rate (100G to 1600G). Figure 8 details our assumptions on how the fiber count scales
with data rate across the three architectures.
1504.23 199.30
1505.74 199.10
1507.25 198.90
1508.77 198.70
1510.29 198.50
1511.81 198.30
1513.34 198.10 32
1514.87 197.90 16 31
1516.40 197.70 30
1517.94 197.50 15 29
1519.48 197.30 28
1521.02 197.10 14 27
1522.56 196.90 26
1524.11 196.70 13 25
1525.66 196.50 24
1527.22 196.30 12 23
1528.77 196.10 22
1530.33 195.90 11 21
1531.90 195.70 20
1533.47 195.50 10 19
1535.04 195.30 18
1536.61 195.10 9 17
1538.19 194.90 16 16
1539.77 194.70 8 15 8 15
1541.35 194.50 14 14
1542.94 194.30 4 4 7 13 7 13
1544.53 194.10 12 12
1546.12 193.90 3 6 11 6 11
1547.72 193.70 10 10
1549.32 193.50 3 2 5 9 5 9
1550.92 193.30 8 8
1552.52 193.10 1 4 7 4 7
1554.13 192.90 6 6
1555.75 192.70 2 3 5 3 5
1557.36 192.50 4 4
1558.98 192.30 2 3 2 3
1560.61 192.10 2 2
1562.23 191.90 1 1 1 1 1
1563.86 191.70
1565.50 191.50
Open Optics MSA Channel SpecificationsFrequency
(THz)4 Ch 8 Ch 16 Ch 32 Ch16 Ch
Wavelength
(nm)4 Ch

Open Optics MSA Design Guide
http://opencompute.org 11
Figure 7 – Fiber Count for Various Architectures and Aggregate Data Rates
Lane rate for each wavelength starts at 25G for the 100G transceiver and is assumed to
progress to 50G for 200G transceivers and eventually reaching 100G for the 1600G
transceiver. The CWDM architecture assumes an optical channel spacing of 20nm
resulting in a maximum of four wavelengths per fiber being feasible. The PSM
architecture assumes one wavelength per fiber. Other proposals at standards
organizations assume architectures which lie somewhere in between the pure CWDM and
the pure PSM assumptions. Nevertheless, the CWDM and PSM estimates should
provide upper and lower boundaries for architectures competing with Open Optics.
Utilizing an inexpensive silicon photonic platform with innovative packaging concepts
enables transceiver costs to scale very cost effectively as the transceiver aggregate data
rate increases; much better than the traditional 10x the data rate for 4x the cost rule of
thumb.
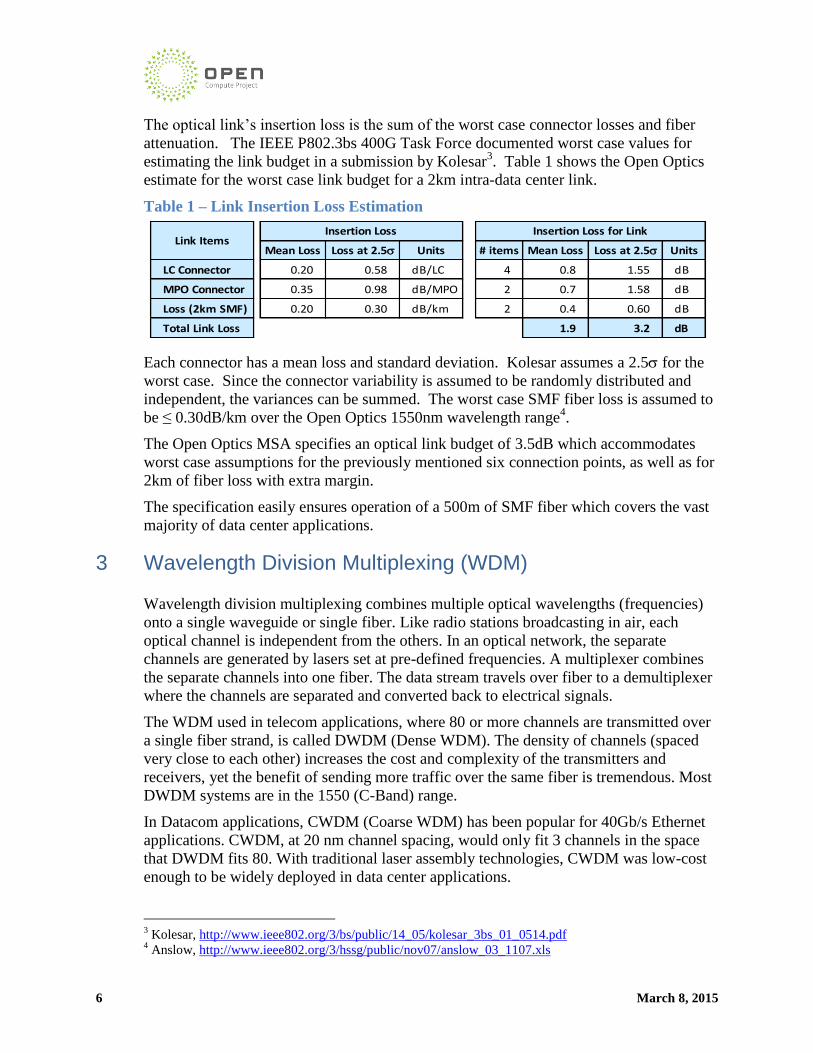
Figure 8 shows the relative cost per gigabit for a 500m link for each of the three
architectures as the transceiver aggregate data rate scales from 100G to 1.6T. The cost of
the fiber based infrastructure remains a significant portion of the link cost for the CWDM
and PSM architectures due to the number of fibers required to carry the optical signals.
However, the Open Optics WDM based architecture achieves the lowest link cost since it
only needs 1 fiber pair over all data rates.
0
5
10
15
20
25
30
35
100G 200G 400G 800G 1600G
Fib
er C
ou
nt
Transceiver Data Rate [G]
Fiber Count for Various Architectures
CWDM
PSM
OpenOptics
12 March 8, 2015
Figure 8: Dramatic Cost Reduction in Data Center Links
Open Optics MSA Design Guide
http://opencompute.org 13
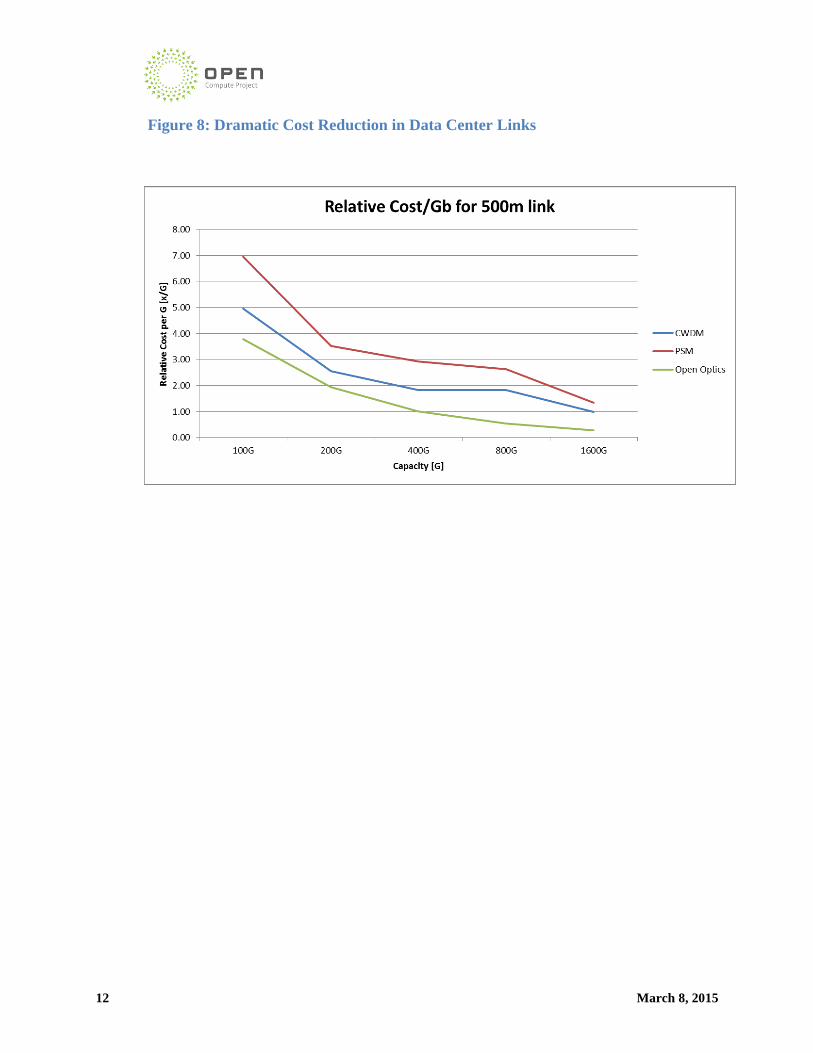
6 Specifications
The Open Optics optical specifications below are grouped into two categories.
Foundation optical specifications which are shared across all intra-data center
applications and data rates are shown first. The second section highlights key optical
specifications for the Open Optics 100G optical link.
Open Optics
Intra Data Center
Min Typical Max Unit Min Typical Max Unit
Open Optics Foundation Specifications
Operating link reach range 0.002 2.0 km 0.002 2.0 km
Channel wavelength range (nm) nm nm
Channel wavelength range (GHz) GHz GHz
Channel scalability 4 32 λ 4 32 λ
Channel spacing interval (Grid)1 200*n GHz 200*n GHz
Open Optics 100G QSFP28 Optical Link
Form Factor
Signaling rate, each lane Gb/s Gb/s
BER (optical link) 5.0E-5 1E-12
FEC Type
Channel Insertion Loss 3.5 dB 3.5 dB
TDP, each lane (for 100Gb/s) 1.5 dB 1.5 dB
Link Budget (including 1.5dB TDP) 5.0 dB 5.0 dB
Tx OMA, each lane (assuming 1.5dB TDP) -7.0 dBm -4.5 dBm
Rx Sensitivity (OMA), each lane -12.0 dBm -9.5 dBm
Extinction Ratio (ER) 2.5 dB 2.5 dB
1 n is an interger number
IEEE-StdTM 802.3bj, clause 91 None
Open Optics Specifications
(FEC)
Open Optics Specifications
(no FEC)
QSFP28 QSFP28
25.78125 ± 100ppm 25.78125 ± 100ppm
1504 to 1566 1504 to 1566
191500 to 199300 191500 to 199300
14 March 8, 2015
7 Definitions of optical parameters and measurement and measurement methods
All optical measurements shall be made through a short patch cable, between 2m and 5m
in length, unless otherwise specified.
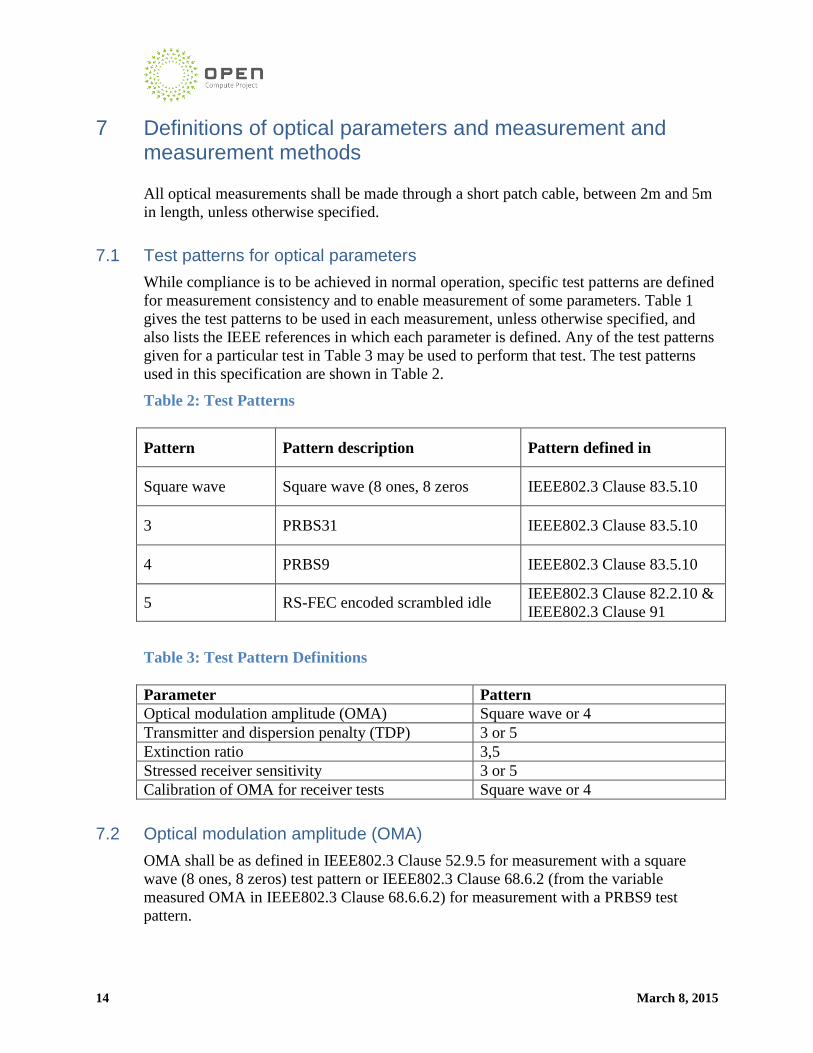
7.1 Test patterns for optical parameters
While compliance is to be achieved in normal operation, specific test patterns are defined
for measurement consistency and to enable measurement of some parameters. Table 1
gives the test patterns to be used in each measurement, unless otherwise specified, and
also lists the IEEE references in which each parameter is defined. Any of the test patterns
given for a particular test in Table 3 may be used to perform that test. The test patterns
used in this specification are shown in Table 2.
Table 2: Test Patterns
Pattern Pattern description Pattern defined in
Square wave Square wave (8 ones, 8 zeros IEEE802.3 Clause 83.5.10
3 PRBS31 IEEE802.3 Clause 83.5.10
4 PRBS9 IEEE802.3 Clause 83.5.10
5 RS-FEC encoded scrambled idle IEEE802.3 Clause 82.2.10 &
IEEE802.3 Clause 91
Table 3: Test Pattern Definitions
Parameter Pattern
Optical modulation amplitude (OMA) Square wave or 4
Transmitter and dispersion penalty (TDP) 3 or 5
Extinction ratio 3,5
Stressed receiver sensitivity 3 or 5
Calibration of OMA for receiver tests Square wave or 4
7.2 Optical modulation amplitude (OMA)
OMA shall be as defined in IEEE802.3 Clause 52.9.5 for measurement with a square
wave (8 ones, 8 zeros) test pattern or IEEE802.3 Clause 68.6.2 (from the variable
measured OMA in IEEE802.3 Clause 68.6.6.2) for measurement with a PRBS9 test
pattern.
Open Optics MSA Design Guide
http://opencompute.org 15
7.3 Transmitter and dispersion penalty (TDP)
Transmitter and dispersion penalty (TDP) shall be as defined in IEEE802.3 clause
52.9.10 with the exception that each optical lane is tested individually using an optical
filter to separate the lane under test from the others.
The optical filter pass band ripple shall be limited to 0.5 dB peak-to-peak and the
isolation is chosen such that the ratio of the power in the lane being measured to the sum
of the powers of all the other lanes is greater than 20 dB(see IITU-T G.959.1 Annex B).
The lanes not under test shall be operating with PRBS31 bit streams.
7.4 Extinction ratio
The extinction ratio of each lane shall be within the limits given in the Specifications if
measured using the methods specified in IEC 61280-2-2. The extinction ratio is measured
using the test pattern defined in Table 2.
7.5 Receiver sensitivity
Receiver sensitivity, which is defined for an ideal input signal, is informative and
compliance is not required. If measured, the test signal should have negligible
impairments such as intersymbol interference (ISI), rise/fall times, jitter and RIN. Instead
the normative requirement for receivers is stressed receiver sensitivity.
8 Conclusions
The Open Optics approach is the only architecture which provides the lowest link cost
even as data rates scale as seen in Figure 8. Other competing architectures which have
been proposed fall somewhere in between the pure CWDM and the pure PSM reference
architectures.
There are two primary factors which enable this attractive link cost structure:
1. The use of inexpensive WDM techniques so that only a pair of SM fibers are
needed 2. The use of inexpensive laser approaches which allows cost effective WDM
transceiver implementations
9 References
1. NANOG 48, Steenbergen: Everything You Always Wanted to Know About Optical
Networking – But Were Afraid to Ask
https://www.nanog.org/meetings/nanog48/presentations/Sunday/RAS_opticalnet_
N48.pdf
2. Corning, Corning Specialty Fiber Product Information Sheets
http://www.corning.com/WorkArea/downloadasset.aspx?id=30931&ei=hdD4VLq

16 March 8, 2015
zO8XdoASa6IHICg&usg=AFQjCNHjvx1yMWm98Rxagfd3ANNIcV_ioQ&sig2
=IVuSIoNzXZn3C2ojDlPNxg&bvm=bv.87611401,d.cGU
3. IEEE802.3, Kolesar, Loss Budgeting for 400GE Channels
http://www.ieee802.org/3/bs/public/14_05/kolesar_3bs_01_0514.pdf
10 Document Revision History
Table 4: Document Revision History
Revision Date Description
1.0 March 08, 2015 Initial Release