opengl insights - seas.upenn.edupcozzi/openglinsights/openglinsights... · windows, opengl drivers...
TRANSCRIPT

OpenGL Insights
Edited by
Patrick Cozzi and Christophe Riccio

Browser Graphics Analysis andOptimizations
Chris Dirks and Omar A. Rodriguez
36.1 Introduction
Understanding performance bottlenecks in games helps developers deliver the bestgameplay experience. In games, performance bottlenecks are usually grouped in oneof two categories: CPU or GPU. Focusing optimization efforts in the appropriatecategory saves development time and helps get our game running better faster. Opti-mizing CPU issues when the bottleneck is in the graphics pipeline will result in littleto no performance gain and a good amount of frustration. Deploying our game in aweb browser complicates the process of isolating bottlenecks. Using the techniquesdescribed here, we’ll be more successful in identifying the most profitable areas tooptimize.
Postprocessing effects have become a standard in AAA games and very often are aperformance bottleneck. In this article, we discuss an implementation of the bloomeffect in WebGL and its performance characteristics in the browser. Because WebGLruns in a web browser, this poses some special challenges when doing graphics analy-sis in comparison to a native 3D graphics application. Just as a native application maychoose a different code path when detecting a different operating system, the same istrue of the browser’s implementation of the Canvas or WebGL APIs. Add to this thefact that we’ll likely be supporting multiple browsers, and there is the potential formany permutations and a challenge in understanding what happens from “script topixel.” We’ll discuss the support for WebGL analysis in common 3D graphics toolsand the various implementations of the standard in modern web browsers.
513
36

514 VI Debugging and Profiling
36.2 The Stages of BloomThe familiarity of the bloom effect in games is one reason it was used for this article.The other major reason is that it is composed of several steps with parameters thatcan be tweaked to favor quality versus performance. As shown in Figure 36.1, thisimplementation starts with the original scene rendered to a texture and applies thebloom effect in four major steps:
1. Draw scene to a texture.
2. Identify fragments whose luminance exceeds a threshold.
3. Blur the results of the luminance test.
4. Combine the original rendered scene texture with the blurred highlights.
Each of these steps has parameters that can trade quality for performance. Inthe luminance step, we can set the luminance threshold to control the number offragments of the original scene texture that are written to the luminance render target.In the blur step, we can set the number of blur passes and resolution of the render
Original scene Final frame
Luminance Final frame
Is bloomon?
No
Yes
Blur
Figure 36.1. Visual representation of the results of each stage.

36. Browser Graphics Analysis and Optimizations 515
target to increase/decrease blur quality. In the final step, we can control the weightof the blurred highlights that get combined with the original scene.
Fragments of the original scene that have a luminance value above the luminancethreshold are written to the render target. Anything below the luminance thresholdis written as black. The number of blur passes determines the number of times thehighlights (luminance results) are blurred. The resolution determines the size of therender target used by the blur passes. The weight of the blurred highlights determineshow much of the blurred highlights end up in the final frame. We expose some ofthese parameters as part of the HUD and others are set in code.
The source code that accompanies this chapter is laid out in a simple format tomake it easy to follow and understand. The bloom implementation is composed ofthe following:
• MainLoop (in index.html) takes care of calling update/render loop with theappropriate request-animation frame method for each browser.
• Init (in bloom.js) defines all resources used in the sample, such as shaders,textures, scene objects geometry, and render targets.
• Update (in bloom.js) contains all nonrendering actions such as updating ro-tations.
• Render (in bloom.js) draws scene geometry, performs luminance test, blurshighlights, and combines results into the final frame.
• bloom-utils.js contains helper functions used to load shaders and textures,parse .obj files, and create geometry.
36.3 Overhead of BloomNow that we’ve described the general implementation of bloom as a postprocessingeffect, we’ll describe the specifics about our implementation in WebGL. The firstthing we measure is the actual overhead of applying bloom to the scene. With theJavascript code in Listing 36.1, we capture a good enough approximation of theframe time to measure overhead and update the scene.
var MainLoop = function () {nCurrentTime = ( newDate ).getTime ();fElapsedTime = nCurrentTime - nLastTime;nLastTime = nCurrentTime;
// call Update & Render// call requestAnimationFrame( MainLoop );
}
Listing 36.1. JavaScript code to approximate frame time.

516 VI Debugging and Profiling
35
30
25
20
Fra
me
tim
e (m
s)
15
10
5
0Bloom OFF Bloom ON
Bloom
Draw scene
Figure 36.2. Frame time with bloom ON = 1.8 * Frame time with Bloom OFF.
This will measure the time between requestAnimationFramecallbacks. Someweb browsers may expose performance data at runtime when enabled. For example,running Google Chrome with the --show-fps-counter flag displays a frames-per-second counter. With this measurement code in place, introducing bloom ap-proximately doubles our frame time (see Figure 36.2).
The measurements were taken on Google Chrome version 15.0.874.106 run-ning on a prerelease second generation Intel Core processor (Intel microarchitecturecode name Sandy Bridge, D1 stepping quad core 2.4 GHz CPU with 4GB DDR31333MHz RAM) with Intel HD Graphics 3000 running Windows 7 Ultimate withService Pack 1. The frame time is composed of the amount of time it takes API callsto set state on the CPU, and the time it takes the GPU to process the draw calls. TheJavaScript code above suffices to measure time spent on the CPU. To understandGPU frame time, we’ll refer to some offline tools discussed later in this article.
36.4 Analyzing WebGL ApplicationsAnalyzing WebGL applications poses a few interesting challenges because there aremany moving parts that have to work together: operating systems, graphics APIs,graphics drivers, browsers, and analysis tools.
36.4.1 Almost Native Graphics Layer (ANGLE)
One of the main challenges when doing analysis on a WebGL application is to un-derstand the difference between running on Windows, Mac OS X, or Linux. OnWindows, OpenGL drivers can usually be downloaded from the graphics hardwarevendor’s website when available. On Mac OS X, OpenGL drivers are part of the

36. Browser Graphics Analysis and Optimizations 517
system and are updated through the OS update mechanism. On Linux, OpenGLdrivers might not be installed by default, but are generally provided through thedistribution’s package management system or the hardware vendor’s website.
For the broadest compatibility on the Windows platform, Chrome and Firefoxmake use of the Almost Native Graphics Layer Engine [ANGLE 11]. This layertranslates OpenGL ES 2.0 calls to DirectX 9 API calls, and translates GLSL shadersto equivalent HLSL shaders. As a user, this translation is completely hidden, but asa developer, this layer is as important as the WebGL application we wrote. ANGLEhas a few quirks related to differences in the APIs specifically with buffers and texturefetches. For example, ANGLE does not create/update resources until a draw call isissued, as explained in Chapter 39.
36.4.2 JavaScript profiling
Most modern web browsers have a set of JavaScript developer tools that are prepack-aged or can be installed from an extension (see, for example, Figure 36.3). Chrome,Firefox, Internet Explorer, Opera, and Safari have their own JavaScript debuggers
Figure 36.3. Chrome developer tools and Firebug.

518 VI Debugging and Profiling
and profilers. These help with debugging HTML DOM and network latency issues.JavaScript profilers are helpful in understanding where CPU time is spent. However,these tools don’t show contextual information for WebGL beyond the JavaScript APIcalls.
36.4.3 WebGL Inspector
The other major issue with analyzing a WebGL application is the limited supportof tools. WebGL Inspector [Vanik 11] is currently the de facto tool for debuggingAPI calls and understanding bound resources. This tool can capture a frame andshow the API calls; state; and bound textures, buffers, and programs. It is availableas a Google Chrome extension and as a JavaScript library that can be dropped intoour WebGL application—useful when running on browsers other than Chrome.WebGL Inspector, shown in Figure 36.4, is free and available for download fromhttp://benvanik.github.com/WebGL-Inspector/.
WebGL Inspector captured frame
WebGL Inspectorextension and options
Figure 36.4. WebGL Inspector showing a frame capture of our sample.
36.4.4 Intel Graphics Performance Analyzers (GPA)
A positive side effect of Chrome and Firefox using ANGLE on Windows is thatDirectX analysis tools can be used to analyze WebGL applications. In this article,we use Intel GPA Frame Analyzer [Intel 11] to capture frames and analyze the post-translation DirectX draw calls and resources. This article shows frame captures fromIntel HD Graphics 3000, but Intel GPA is not restricted to Intel graphics hardware.
36. Browser Graphics Analysis and Optimizations 519
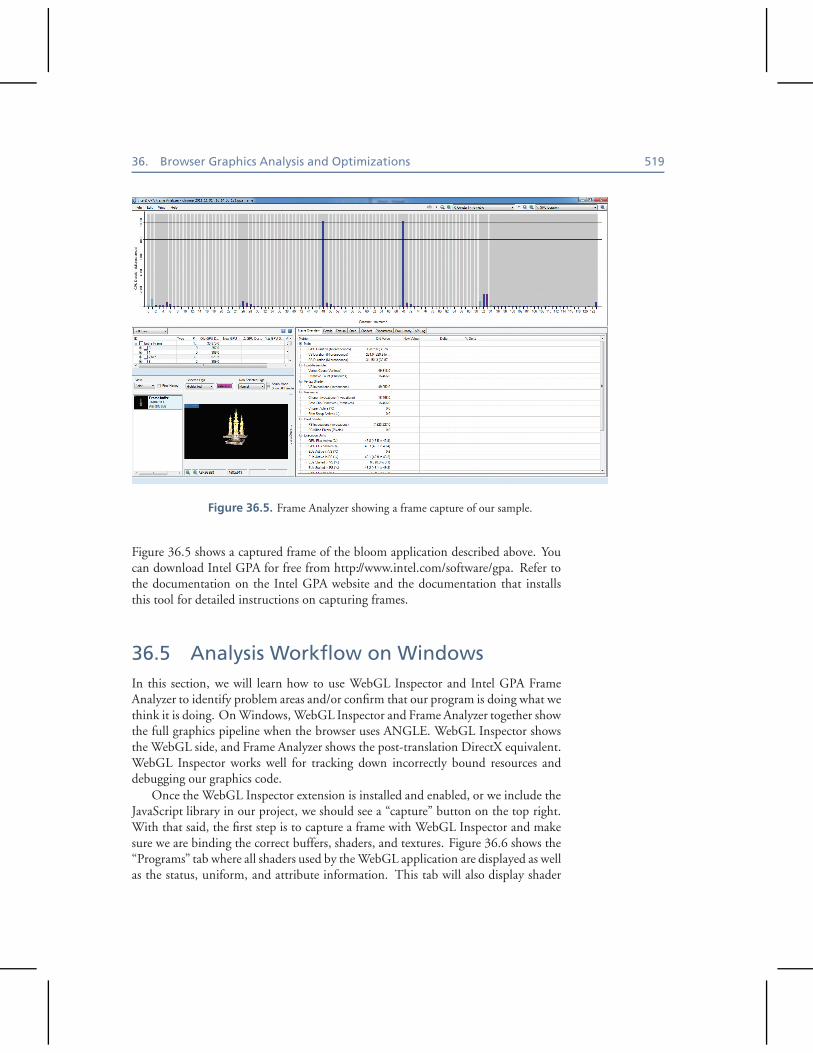
Figure 36.5. Frame Analyzer showing a frame capture of our sample.
Figure 36.5 shows a captured frame of the bloom application described above. Youcan download Intel GPA for free from http://www.intel.com/software/gpa. Refer tothe documentation on the Intel GPA website and the documentation that installsthis tool for detailed instructions on capturing frames.
36.5 Analysis Workflow on WindowsIn this section, we will learn how to use WebGL Inspector and Intel GPA FrameAnalyzer to identify problem areas and/or confirm that our program is doing what wethink it is doing. On Windows, WebGL Inspector and Frame Analyzer together showthe full graphics pipeline when the browser uses ANGLE. WebGL Inspector showsthe WebGL side, and Frame Analyzer shows the post-translation DirectX equivalent.WebGL Inspector works well for tracking down incorrectly bound resources anddebugging our graphics code.
Once the WebGL Inspector extension is installed and enabled, or we include theJavaScript library in our project, we should see a “capture” button on the top right.With that said, the first step is to capture a frame with WebGL Inspector and makesure we are binding the correct buffers, shaders, and textures. Figure 36.6 shows the“Programs” tab where all shaders used by the WebGL application are displayed as wellas the status, uniform, and attribute information. This tab will also display shader

520 VI Debugging and Profiling
Figure 36.6. Confirming correct shaders are bound with WebGL Inspector.
compilation and link errors. The other tabs in WebGL Inspector show detailedinformation about the other resources such as buffer contents for bound buffers andtexture resolution for all bound textures. WebGL Inspector also shows previews forresources such as vertex buffers and textures. The previews can help as a sanity checkto make sure the correct mesh or texture is bound when making a draw call.
Unlike WebGL Inspector, Intel GPA is not integrated into the web browserthrough an extension or JavaScript library. In addition, capturing a frame gets abit more interesting because of the multiprocess architecture of some browsers likeGoogle Chrome. Intel GPA can attach to the Chrome process on launch, but theprocess that handles the rendering calls is a child process of the main Chrome pro-cess. Fortunately, starting Chrome with a --no-sandbox flag allows GPA to at-tach to the correct rendering process and trigger frame captures. Note that runningChrome with a --no-sandbox flag will not change performance characteristics butwill change the security characteristics of the browser. For this reason, this flag shouldnever be used for general browsing.
36.5.1 Tracking Down API Calls
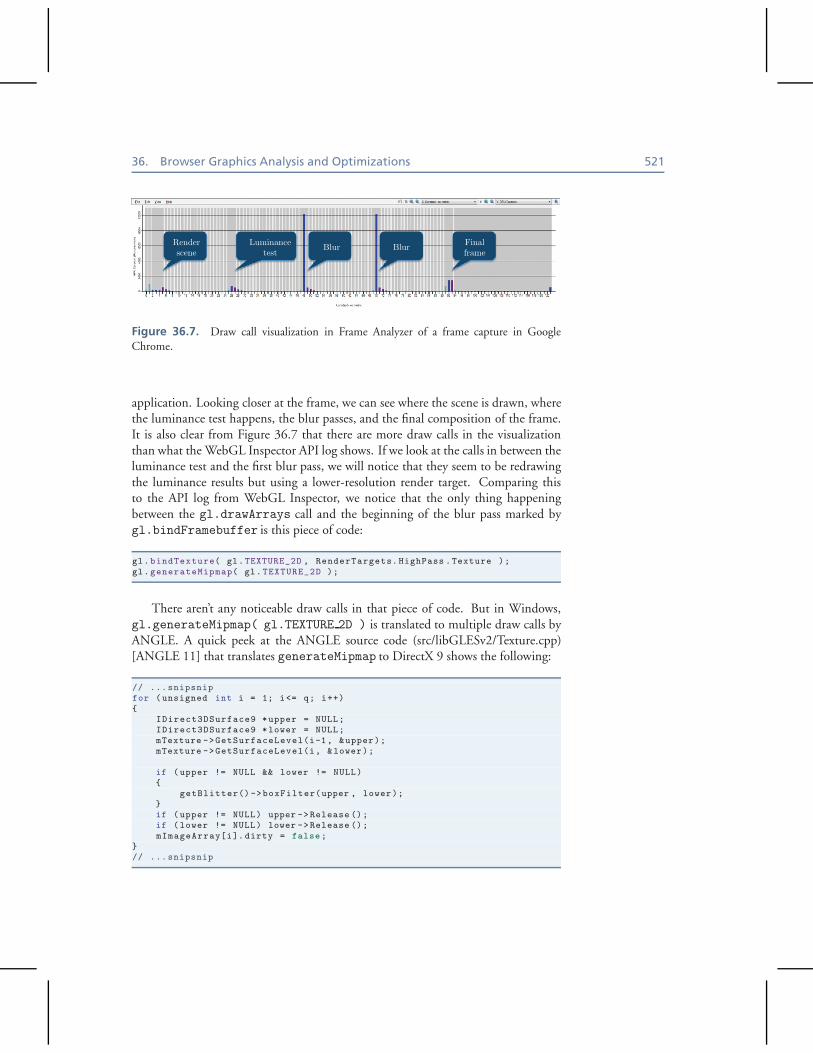
After capturing a frame and opening it with Frame Analyzer, we will see a visualiza-tion of all draw calls in the captured frame, as shown in Figure 36.5. Each Draw,Clear, and StretchRect call is shown as a bar whose height is by default set toGPU duration. At first glance, this visualization shows the order in which geometryis drawn as well as which calls are most expensive. Draw calls are blue bars, Clearcalls are light blue bars, and StretchRect calls are dark red/magenta bars. The lightgray bars are markers for render target changes. Draw/Clear/StretchRect calls inbetween two light gray bars affect the same render target. The labels in Figure 36.7are not a feature of Frame Analyzer but were added for clarity.
Looking at Figure 36.7, we can see that the tall bars correspond to the blurpasses, which is expected since that fragment shader is the bulk of the work in this
36. Browser Graphics Analysis and Optimizations 521
Renderscene
Luminancetest
Finalframe
Blur Blur
Figure 36.7. Draw call visualization in Frame Analyzer of a frame capture in GoogleChrome.
application. Looking closer at the frame, we can see where the scene is drawn, wherethe luminance test happens, the blur passes, and the final composition of the frame.It is also clear from Figure 36.7 that there are more draw calls in the visualizationthan what the WebGL Inspector API log shows. If we look at the calls in between theluminance test and the first blur pass, we will notice that they seem to be redrawingthe luminance results but using a lower-resolution render target. Comparing thisto the API log from WebGL Inspector, we notice that the only thing happeningbetween the gl.drawArrays call and the beginning of the blur pass marked bygl.bindFramebuffer is this piece of code:
gl.bindTexture( gl.TEXTURE_2D , RenderTargets.HighPass .Texture );gl.generateMipmap( gl.TEXTURE_2D );
There aren’t any noticeable draw calls in that piece of code. But in Windows,gl.generateMipmap( gl.TEXTURE 2D ) is translated to multiple draw calls byANGLE. A quick peek at the ANGLE source code (src/libGLESv2/Texture.cpp)[ANGLE 11] that translates generateMipmap to DirectX 9 shows the following:
// ...snipsnipfor (unsigned int i = 1; i<= q; i++){
IDirect3DSurface9 *upper = NULL;IDirect3DSurface9 *lower = NULL;mTexture ->GetSurfaceLevel(i-1, &upper);mTexture ->GetSurfaceLevel(i, &lower);
if (upper != NULL && lower != NULL){
getBlitter()->boxFilter(upper , lower);}if (upper != NULL) upper ->Release ();if (lower != NULL) lower ->Release ();mImageArray[i].dirty = false;
}// ...snipsnip

522 VI Debugging and Profiling
In short, getBlitter()->boxFilter( upper, lower ) results in a drawcall and because it’s in a loop, it’s called multiple times, creating all the extra drawcalls we see in Figure 36.7 between the different phases. Since it’s creating all themipmaps for the previous draw based on the resolution of the render target used,reducing the initial render target resolution will not only reduce the work that eachpass needs to do, but it will also reduce the number of mipmaps created.
Looking at Figure 36.7, we can see that each labeled region begins with a Clear(light blue), followed by one or more Draw (blue) calls, and ends with a StretchRect(dark red). Like the name suggests, StretchRect will stretch the results to thebound render target to fit the viewport. In some cases, it might be an undesirableeffect, but it mostly works well to fill the viewport with our scene. Unfortunately,this results in another hidden call that is unaccounted for compared to the API login WebGL Inspector.
36.6 Optimized BloomNow that we understand how to analyze the graphics side of our sample with WebGLInspector and Intel GPA, we can begin using that information to make changes toour code where it will have the most impact. As clearly shown in Figure 36.8, theblur passes are the bottleneck in our bloom implementation. Using Intel GPA FrameAnalyzer, we see that these two calls make up approximately 63% of the frame time.
Blur Blur
Figure 36.8. The tallest and thickest bars are the blur calls.
36.6.1 Lower Render Target Resolution
In our implementation, we have exposed two parameters we can tweak for the blur:number of passes and render-target resolution. From Figure 36.8, we can see thatthere are only two blur passes, which is fairly low and gives us good quality. Low-ering the resolution of the render target we use for the blur passes will have twoeffects: reducing the number of fragments processed and the number of extra draw

36. Browser Graphics Analysis and Optimizations 523
30
25
20
Fra
me
tim
e (m
s)
15
10
5
0Blur 1024×1024 Blur 256×256
Blur
Everything else
Figure 36.9. Performance impact of lowering resolution of blur render target (frame time inthis graph refers to GPU frame time as reported by Intel GPA Frame Analyzer).
calls caused by gl.generateMipmap, as discussed above. After lowering the reso-lution to one quarter of the original resolution, we notice that the two blur passesare now only approximately 11% of rendering. That is a significant performanceimprovement, as shown in Figure 36.9, with an easy code change.
Looking at Figure 36.10, it’s hard to tell the difference by just looking at the finalframes, even in WebGL Inspector, since the quality was not noticeably degraded.
1024×1024 256×256
Figure 36.10. Original final frame with 1024 × 1024 blur render target and after loweringthe resolution of the blur render target to 256 × 256.

524 VI Debugging and Profiling
Blur Blur
Figure 36.11. Blur calls are no longer the most expensive.
However, we can confirm the improvement in Intel GPA by capturing a newframe, as shown in Figure 36.11.
We could go with an even lower resolution, but there is a point where the qualitymight be affected. In this case, lowering the resolution works well and produces ac-ceptable results because we are working with a blur. For other applications, loweringthe resolution might not be the solution.
36.6.2 Unnecessary Mipmap Generation
As discussed in Section 36.5.1, there was a call to generateMipmap after everybloom stage. In Windows, this resulted in several more API calls than we couldaccount for in the WebGL Inspector log and the code. Originally, we were planningto map the render target textures to quads and display them all on screen to showthe bloom stages. We discarded that idea and instead we map each bloom stage toa fullscreen quad. The bloom stages’ results can be displayed one at a time. Thisallowed us to remove the call to generateMipmap and thus remove all the extraAPI calls. This can be confirmed by comparing Figures 36.7 and 36.12.
Blur
Blur
Luminance
Drawscene
Finalframe
Figure 36.12. Frame capture after removing generateMipmap.

36. Browser Graphics Analysis and Optimizations 525
36.6.3 Floating-Point Framebuffers
After removing the call to generateMipmap in between bloom stages, we lookedinto the OES texture float extension to enable floating-point buffers. Origi-nally, we used gl.UNSIGNED BYTE as the format for the framebuffer, which createdA8R8G8B8 framebuffers. With the OES texture float extension enabled, wecreate floating-point buffers by passing gl.FLOAT as the texture format. This cre-ates A32R32G32B32F framebuffers. After lowering the resolution and removingunnecessary mipmap generation, it allows us to create higher-quality blur for ap-proximately the same cost. The code change happened in our MakeRenderTargetfunction (see Listing 36.2).
var MakeRenderTarget = function ( gl, nWidth , nHeight ) {// create the new framebuffer
// use floating point framebuffers if OES_texture_float extension existsvar nTexFormat = ( gl.getExtension( "OES_texture_float" ) ) ? gl.FLOAT :
gl.UNSIGNED_BYTE;
// create the offscreen texturevar pTexture = gl.createTexture();gl.bindTexture( gl.TEXTURE_2D , pTexture );gl.texParameteri( gl.TEXTURE_2D , gl.TEXTURE_MAG_FILTER, gl.NEAREST );gl.texParameteri( gl.TEXTURE_2D , gl.TEXTURE_MIN_FILTER, gl.NEAREST );gl.texParameteri( gl.TEXTURE_2D , gl.TEXTURE_WRAP_S , gl.CLAMP_TO_EDGE );gl.texParameteri( gl.TEXTURE_2D , gl.TEXTURE_WRAP_T , gl.CLAMP_TO_EDGE );gl.texImage2D( gl.TEXTURE_2D , 0, gl.RGBA , pFrameBuffer.width ,
pFrameBuffer.height, 0, gl.RGBA , nTexFormat , null );
// create the offscreen depth buffer// attach texture and depth buffer to framebuffer// reset bindings to defaults
return { "FrameBuffer" : pFrameBuffer ,"Texture " : pTexture ,"Depth" : pDepthBuffer ,"Width" : nWidth ,"Height" : nHeight
};}
Listing 36.2. Creating floating-point frame buffers with OES texture float.
According to [Lipchak 05], it requires NEARESTmagnification filter and NEARESTand NEAREST MIPMAP NEARESTminification filters to be supported. For the bloomsample, we draw these textures in a way that does not need the minification filter, sowe set both to gl.NEAREST.

526 VI Debugging and Profiling
36.7 ConclusionSupport for WebGL is progressing at a steady pace and is helping the browser becomea viable development and distribution platform for games with higher-quality graph-ics. Like any other platform, getting the best performance allows our games to shineand improve the gameplay experience. Tools play an important role in helping gameand graphics developers deliver these experiences in the browser. In this article, wepresented several tools that work well with WebGL applications and explained someof the areas where potential bottlenecks might appear in the current implementationson Windows. In short, developers should understand the differences between hard-ware platforms and operating systems to get the best performance. The web browserhas always been a way to abstract away the hardware and OS, but with WebGL we’regetting closer to these layers and can now use that to our advantage.
Bibliography[ANGLE 11] ANGLE. “ANGLE: Almost Native Graphics Layer Engine.” http://code.google.
com/p/angleproject/, December 15, 2011.
[Intel 11] Intel. “Intel Graphics Performance Analyzers 4.3.” http://www.intel.com/software/gpa, December 15, 2011.
[Lipchak 05] BenjLipchak. “OES texture float”. http://www.khronos.org/registry/gles/extensions/OES/OES texture float.txt, November 9, 2011.
[Vanik 11] Ben Vanik. “WebGL Inspector: An advanced WebGL debugging toolkit.” http://benvanik.github.com/WebGL-Inspector/, July 29, 2011.