opening up new circular economy trade opportunities: options for collaboration between the uk and...
TRANSCRIPT

Household waste separation in NL
Innovations in Holland
More recovery of resources and energy
via municipal waste management
by local authorities
and their waste management companies
Erik de BaedtsManaging Director, Royal Dutch Waste Management Association (NVRD)
March 2015, London UK

Royal Dutch Solid Waste Association
• Founded in 1907• Members:
– Municipalities – Public waste collection & treatment companies – Private waste companies– Institutions, suppliers etc.
• Represents the public waste management sector
• Activities:– Serving of interests– Knowledge and support provider– Platform for networking

AGENDA
1.
2.
3.
4.
5.


2015


The Netherlands
Some statistics
16.5 million inhabitants
7.2 million households
12 provinces
403 municipalities
500 kg waste per person/year
60 million tonnes waste/year
+80% of all waste recycled, rest mainly W2E
8.5 million tonnes municipal waste/year
+50% of mun. waste recycled, rest mainly W2E

EU Scorecard European Commission

Dutch waste market today
Decrease of waste
Result of recoveryof resources
State of the artTreatment facilities

Landfilling
0
2
4
6
8
10
12
14
16
1991 1993 1995 1997 1999 2001 2003 2005 2007 2009
year
Mto
n p
er
ye
ar
0
10
20
30
40
50
60
70
80
nu
mb
er
of la
nd
fills
supply number of landfills
0
0,5
1
1,5
2
2,5
3
2000200220042006200820102012
Mton
Landfilling combustible waste

Incineration
0
1,000
2,000
3,000
4,000
5,000
6,000
7,000
8,000
2003 2004 2005 2006 2007 2008 2009 2010 2011 2012
OMRIN
E.ON Delfzijl
AZN
Sita ReEnergy
ZAVIN CV
AVR Afvalverwerking Rijnmond
AVR Afvalverwerking Rotterdam
AVR DTO
HVC afvalcentrale locatie Dordrecht
Afval Energie Bedrijf
HVCafvalcentrale locatie Alkmaar
AVR Afvalverwerking Duiven
ARN
Twence Afvalverwerking
NL aanbod voor verbranding
Totaal verbrand incl import

So… import?

Municipal Waste Management Policy
• One municipality = One policy
• Historically: driven by hygiene and public health
• Today: driven by resources management
• Diversity and unity in policies
• Approaches more and more regional

Public Private in collection

Actual situation 2013: Market shares
– 80% of Dutch households(70% of municipalities) is servicedby a public service provider
– Municipal services beingtransferred to public companies
– Number of municipalities opting foroutsourcing remains stable
Of the 20% of Dutch households servicedby a private company, 70% is serviced byjust 2 national players, serving 14%
So 6% of Dutch households is serviced byprivate local/regional players

Financial instruments
• Municipal Waste Tax, av. €250,-per household
• Variable pricing
(pay as you throw)– Per kg of waste offered
– By size of the bin
– By frequency of collection
– Or combinations of the above
• National instruments:– Landfill tax
– Incineration tax

Common collection scheme
Curb side Bring facility
Bio waste Every other week Recycling Centre
Paper / Cardboard Monthly Street container
Glass Street container
Textile Quarterly Street container
Plastics Monthly Street container
WEEE Recycling Centre / shop
Hazardous Waste Recycling Centre
Bulky waste Differs Recycling Centre (> 20 streams)
Residual waste Every other week Recycling Centre

Results
Separate collectionKg / cap
Residual wasteKg / cap
Diversion%
Biowaste 76 84 48
Paper / cardboard 64 28 70
Glass 21 10 68
Textile 4 8 33
Plastic packaging 5 20 20
WEEE 5
Hazardous waste 1 0,07 95
Other separated 73
Over-all recycling rate: 51%


Who pays the bill?!

Extended Producer Responsibility
Environment Ministry
EPR
Batteries WEEE Packaging Car tyres ELVWindow
Panes
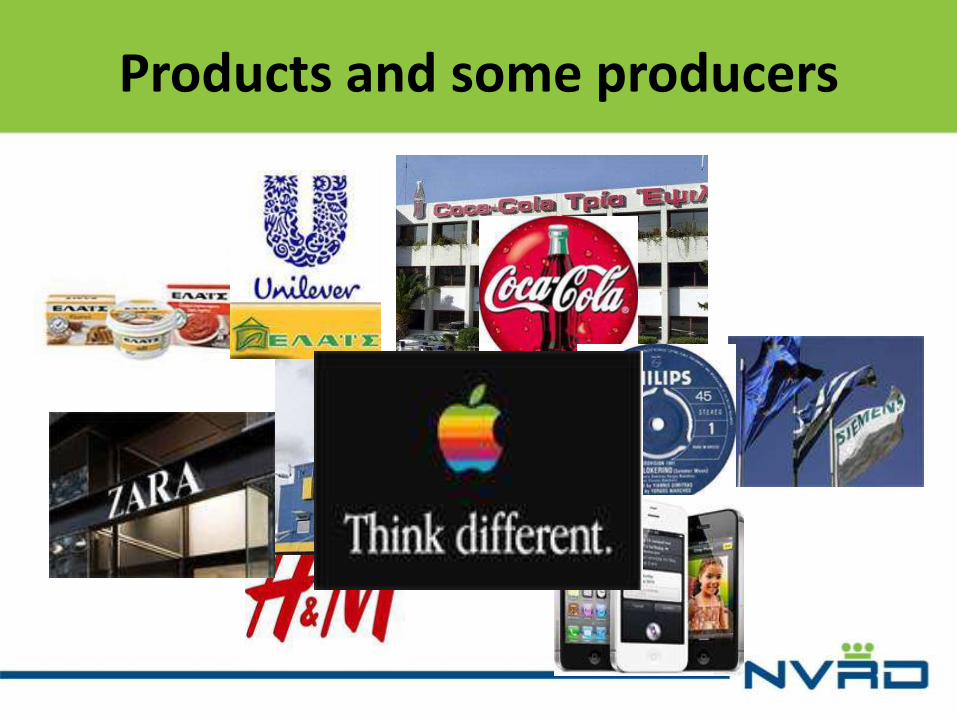
Products and some producers

Result Producers Responsibility
€408/ton plastics
€80/ton electronics
€65/ton furniturein France
€60/ton textiles (France)

Structural income
• Compensations producers for collecting their streams
– Electronics
– Packaging paper, glass, metal, plastics
– Textiles? Furniture?
• Gate fees for landfilling & incineration
• Local municipal tax
• Revenues recovered materials (compost, metals, plastics, etc.)
• Revenues recovered energy // MWh
• Revenues district heating / cooling

As dumping of waste is cheapest:1. Ban landfilling & introduce gate fees2. Tax landfilling
(So waste 2 energy becomes a market)3. Organise incineration & energy recovery
(EU RE’20: only for non-recyclable waste)4. Minimum standards per waste stream /
material for recycling5. Producers Responsibility
for recyclable products & materials6. Ambitious targets for recycling7. Monitoring of waste figures
(Weighing, reporting)8. Inspection on regulation, enforcement

New Ambitions
Target
49,8%47,8%46,5%
31,7%
0,0
49,8
65,0 %
1993 1999 2005 2010 2012 2015
Other separated Separated bulk waste
Textile WEEE
Plastic packaging Glass packaging
Paper Biowaste
Source-separated household waste (source: Dutch Central Bureau for Statistics (CBS)).2012 data is extrapolated from 2010 data.In practise, the separate collection of plastic packaging has increased substantially since 2010
Towards 65% recycling of household waste

Municipal ambitionsfor residual waste?
-
50
100
150
200
250
300
350
400
450
500
0 10 20 30 40 50 60 70 80 90 100
Aandeel hoogbouw (%)
Ho
eveelh
eid
resta
fval (k
g/in
w)
Stedelijkheidsklasse 1
Stedelijkheidsklasse 2
Stedelijkheidsklasse 3
Stedelijkheidsklasse 4
Stedelijkheidsklasse 5

From Waste to Resources
Coalition agreement 2012: Works towards a circular economy
Parliament Green Growth March 2013: From Waste To Resources (Catch): Opportunity for Green Growth
Parliament From Waste to resources, June 2013 Operationalised January 2014
Catch stimulates the transition towards a circular economy
2

Dutch policy
• Green growth (crisis <> sustainable solutions)
• Strengthen earning capacity & competitive edge
• Reduce environmental pressure and dependency on fossil energy
• Greening the economy passes frontiers
• See today’s issues as tomorrow’s markets
• 8 areas: food, energy, construction, mobility, climate, water, bio-based economy, and... waste as resource (Note: supply <> demand)

4 pillars to achieve the ambitions:
1. Clever market incentives
2. Stimulating framework of legislation, focusing on dynamic and flexibility
3. Innovative Top business sectors
4. Government as network partner
(e.g. National Energy Agreement (Resources Agreement?)
(Government as regulator?)
Dutch policy

Program From Waste to Resources
From linear economy, via chain management & recycling to circular economy
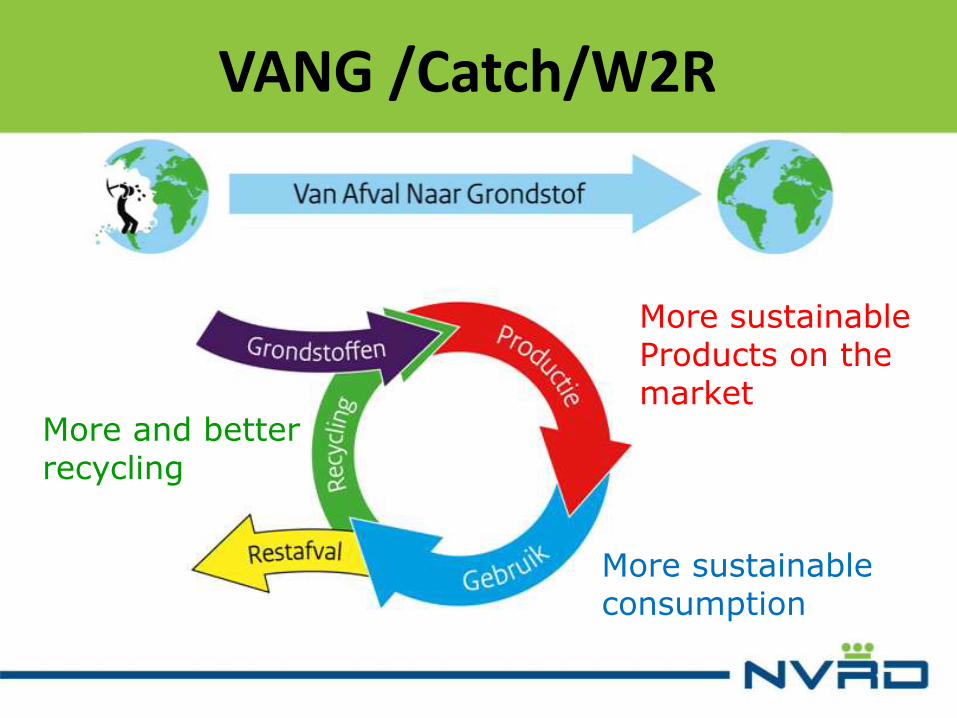
VANG /Catch/W2R
More sustainableProducts on the market
More sustainableconsumption
More and betterrecycling

Concrete ambitions
Ambitious program
• The Netherlands example in circular economy for other countries
• Remove impediments wherever possible
• Half (!) the amount of materials going to incineration and landfill in 10 years
• Goal for 2015: 60-65% household waste separated,
• 75% separated in 2020; eventually 100% separated
• Targets residual waste per person: 100 kg by 2020, 30 kg by 2025...
• Cooperate with and within chains of production & consumption

Design
Carpet /Fashion Production
Retail
Consumption
2009 © NVRD
Design
Resources
Production
Marketing
Consumption
Resources
Sector Design
Industry
Consumption
Textile Aluminium Electronics
- Knowledge
- Sorting (treatment)
- Logistics
X/Y/Z Instruments
Ecodesign
Producers Responsibility?
Reimbursement schemes?
Positive triggers?
Waste ManagementIn a unique position!
Resource efficiency in Europe: towards a green economy

Motor of the green economy, with cross-cutting impact
41
Relevance Waste Management & Recycling

Public Framework
Core of the vision:
Circular economy: close the loops
1. The polluter pays (finally)
2. Allow for dynamics enterprises and citizens
3. Correct market failure
Focus on the role of governments: at all levels.

Toolbox
Consumer
Municipality
Producer
Pay as you throw
Service level degree
Deposit return systems
Communication
Knowledge sharing
Inter municipal cooperation
Clear and feasible targets
Treatment taxes
Optimization oflogistics
Producer responsibility
Use of secondaryraw material
Ecodesign
Raw material label

Demand sideDesired:• Quality of recyclable• Volume• Consistency, reliable delivery• Stable competitive prices• Partnerships
Stimulations?• CSR• Prices?• ... Regulation?
Packaging agreement, to be cherished?

Supply of recyclables: New Methods in waste collection & separation

2009 2010 2011 2012 2013
Deventer 1 7 8 9 19
Benchmark klasse C 3 6 8 8 9
0
2
4
6
8
10
12
14
16
18
20
Ho
ev
ee
lhe
id
(kg
/in
w)
DeventerPlastic verpakkingen (in kg/ inw)
- Deventer is BP plastic in class C (20 tot 29% highrise)- 2012: minicontainer for plastics (1 x 4 wk)- 2013: PAYT, volume-frequence, biowaste free
Good practices plastics
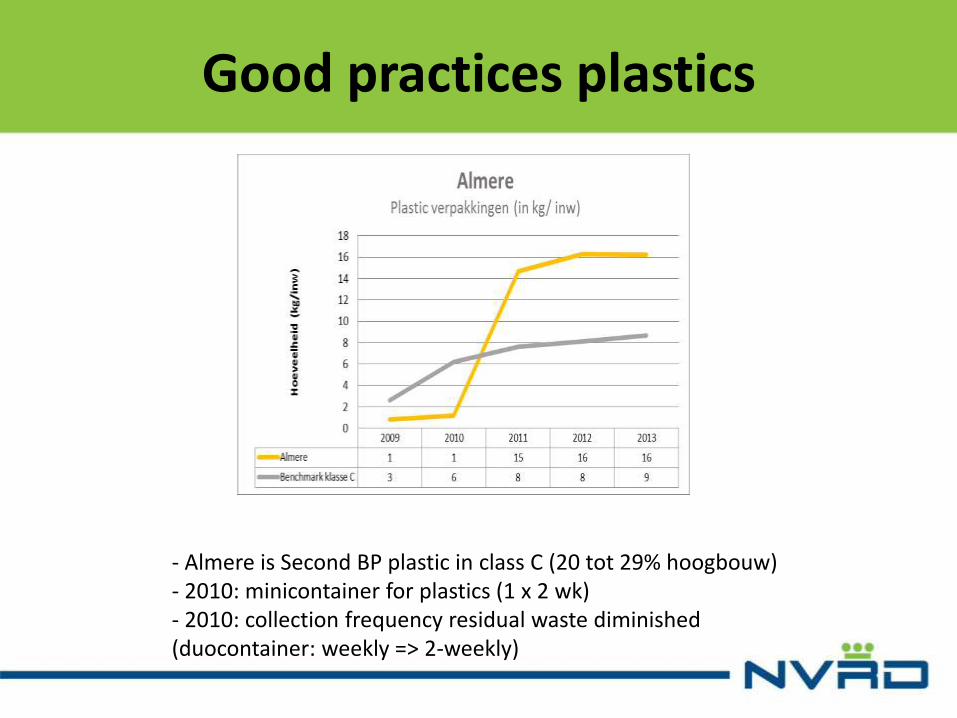
- Almere is Second BP plastic in class C (20 tot 29% hoogbouw)- 2010: minicontainer for plastics (1 x 2 wk)- 2010: collection frequency residual waste diminished(duocontainer: weekly => 2-weekly)
Good practices plastics

- Druten is BP plastic in class E (0 tot 9% hoogbouw)- 2009: start with plastic collection in bags (1 x 2 wk)- Prior to 2009 PAYT in place (costly bag residuals, biowaste free)
Good practices plastics

Technical separation
Promising results!
Quantities recycled compare to the best(Omrin will be tired of discussions aboutquality <> separation at source)

Collection innovations: Cash for Trash
• Financial reward for separated waste
• Centralized collection points

Cash for trash in practice

How much Cash for Trash?
Waste type Revenue per kg
Textile € 0,05
Plastic packaging € 0,25
Paper & Cardboard € 0,25
Small WEEE € 0,05
Possible saving up to € 75 / household / year

Results of Cash for Trash
Development of participation
4
28
42
16
7 2Twice per week ormore
Between once or twiceper week
Once per two weeks
Once per month
Less than once permont
Visitor frequency
70
15
105
Paper & cardboard
Plastic packaging
Textile
Small WEEE
Collection Result

Extra or shift?
Shift: 37% ; Extra: 24%

Conclusions on Cash for Trash
• Paying for recyclables leads to an increase in separate collection results but also to a shift from the ‘free’ collection to the paid collection system
• System is probably less suitable in rural areas where reversed collection can have stronger effects at a lower cost
• System could be interesting in high urbanized areas where it’s hard to implement adequate infrastructure for separate collection
• System ties in with social municipal targets (work)

Collection innovations: Reversed collection
• Currently:
– High service level for residual waste
– Relative low service level for recyclables
• Desirable:
– High service level for recyclables
– Relative low service level for residual waste

Reversed Collection
Before After
Hoonhorst (pilot area) - 1900
inhabitants - small village
- PAYT-system (volume / frequency) on organic waste and residual waste
- Kerbside collection of residual waste ( 140 L or 240 L) in both the heart of the village as in the more rural part.
- Kerbside collection of organic waste (140L or 240 L) only in the heart of the village
- PAYT-system (volume / frequency) on residual waste
- Underground collection system for residual waste (in the heart of the village)
- Change of collection frequency for residual waste in the more rural part of the village
- Organic waste (240L) collection in the whole village
- Extra container for plastic, metals and beverage cartons (240 L)
- Extra container for paper and cardboard (240 L)

Results Reversed Collection

New Methods: Reversed collection
11 bins of residual waste p/household/yr
Bio-waste
Paper / cardboard
Plastic and other dry recyclables
Waste prevention
Bring to street container

Conclusions Reversed Collection
• An extensive kerbside collection system for recyclables combined with drop off point for residual waste can have strong effects
• Many variations in the system are possible• Effects appear to be stronger when the residual
waste container is at greater distance• In urban environments great distances may
sooner lead to negative effects (littering), though this has not yet been tested
• Many Dutch municipalities are now implementing a form of reversed collection

Collection innovations: 100-100-100Background information
• ROVA is a non-profit public waste collection company.
Their stakeholders are 21 municipalities (800.0000. inhabitants) in the middle & east of the Netherlands.
• “From waste to resource” and “waste-free society” are keywords in ROVA’s strategy since October 2009.
• ROVA introduced in 2011 the system of reversed collection:resources are collected on the kerbside and residual waste has to be taken to drop-off facilities nearby
• This system leads to good results (recycling rate up to 80-90%). But a waste-free society requires more.

100-100-100Dutch social experiment in waste management
What? ROVA challenged 100 households (including alderman) to live 100 days a 100% circularly live for waste and raw materials:0 kg of residual waste and a decrease in the total amount of household waste
Why? Municipal waste management is at the end of the product lifecycle. Choices of producers and consumers (before products become waste), to a large extent determine the possibilities for product and material reuse. Although good results have been made in municipal waste management (with the system of reversed collection, ROVA municipalities reach 80% of recycling of household waste), a waste-free society requires more. Therefore ROVA started in 2015 a social experiment in which waste prevention is the central theme.

100-100-100Dutch social experiment in waste management
How? • Recruiting households was no problem (great enthusiasm among citizens, local and national press)
• Among 500 household participate in the experiment• Start 1-1-2015• In cooperation with University of Groningen (RUG), department Psychology
and University of Utrecht (Sustainability)• 50 households are intensively followed and are given a concrete action
perspective appropriate to their specific situation, others receive support through communication
• Halfway (50 days) the participants have reduced their residual waste up to 30 kg per capita per year (average ROVA 166 kg and Netherlands 220 kg)
Goals? This social experiment contributes to raising awareness. It also clarifies the (im)possibilities on the road towards a waste-free society, for example:• willingness and leverage to further behavioral change among citizens • gives insight on the remaining products in the household waste• the possibilities in acting of producers, pressure on producers for recyclables• the political discussion at national level

The real tonnes: bulky waste
• Higher service level (more collection points)
• More sorting, through – Service (at source)– Technology (afterwards)
• Chain deficit. More EPR? – Mattresses– Furniture– Leather
• Technical separation obligatory <> service level

Adequate service level
Dutch waste streams to be sorted:
a. WEEE;b. Asbestos;c. A-wood & B-wood;d. C-wood;e. Soil, separated following legal classifications;f. Gas tanks, fire extinguishers, pressure equipment;g. Car tires;h. Roof waste;i. Expanded polystyrene foam;j. Mixed stone material, not being asphalt or gypsum;k. Gypsum;l. Gross garden waste;m. Hard plastics;n. Mattresses;o. Metals;p. Paper and cardboard;q. Textiles, not being carpet; r. Flat glasss/z. …..?

Flexible solutions for more innovations

Conclusions innovations
• The Dutch recycling rate has more or less stabilized in the past decade
• A number of initiatives is emerging to set new steps in collection, separation and recycling
• It seems feasible to significantly decrease the amount of residual waste and to further increase the recycling rate
• Reversed collection seems to be setting the new standard in rural areas
• Cash for Trash seems promising in urban areas
• Technical separation seems to offer additional potential
• Bulky waste still has scope for improvements (EPR?)

In conclusion
• Municipalities decisive role in local waste management• Ambitious but feasible targets are inspiring• Effective waste management needs an effective scale:
– For policy making– For operations
• Inter municipal cooperation is key for success• Financial instruments and service are key drivers• EPR can have strong effects, when well implemented• Innovations lead us to the circular economy• But how do we deal with final treatment capacity?• Can we take up this service of general interest together?
Thanks for your attention.Wishing you inspiration
and succesful cooperation!
Erik de BaedtsRoyal NVRD The Netherlands, Managing Director
Past-president, Municipal Waste EuropePast board ISWA, International Solid Waste Association
[email protected]/english
Twitter: @erikafval (Erik Waste)

EXTRA, IN CASE WE HAVE SOME TIME….

Planetary Boundaries
71

Global situation
Production, consumption and…

Global situation
Production, consumption and… waste!

Consumer/ Citizen
Municipalities/
Waste sector
Producer
The ideal for our current production process

The real end of our current production process…90% landfilling in Brasil, no better in Asia & Africa
75
Health, HygieneEnvironment, ClimateSocial Responsibility=> Sustainable?


Urbanisation and the trend in use of resources
More urbanisation: (mega-)cities
More use of material resources
Yet collection and recycling is more difficult in (mega-)citieswith highrise
Sustainability is not just about energy, but surely also about recovering materials!

Scarce resources

Exporting resources still

Geo-strategy

EU Approach: The Waste Hierarchy
Instead of landfilling shift to sorting and recycling, organise waste to energy (sufficient but not too much), then focus on prevention and reuse

Design
Carpet /Fashion Production
Retail
Consumption
2009 © NVRD
Design
Resources
Production
Marketing
Consumption
Resources
Sector Design
Industry
Consumption
Textile Aluminium Electronics
- Knowledge
- Sorting (treatment)
- Logistics
X/Y/Z Instruments
Ecodesign
Producers Responsibility?
Reimbursement schemes?
Positive triggers?
Waste Management
Resource efficiency in Europe: towards a green economy

Motor of the green economy, with cross-cutting impact
83
Relevance Waste management & Recycling

Meanwhile
Outside the waste industry

Prices for commodities

Current,
linear
system
tekst- Extraction of natural material resources
- Value chain of processes for production and consumption
- Production of waste
Stress
factors
- Reduction of availability natural material resources
- Reducing margins and reducing of value in the chains
- Depletion of the living environment
•
System
challenge
- Conservation of a stable and prosperous society
- Prevention of further environmental damage and degradation (loss)
- Economically unsustainable future
Urgency
- Incredibly fast growing global population
- Average level of prosperity doubled globally
- Ecological ‘tipping points’ nearby
System challenge

Solutions?

Opportunities Netherlands with
Circular Economy (TNO):
• Annual savings at least €7,3 billion
on material costs
• 54.000 extra employment
• very strong reduction of
environmental pressure
Opportunities

Solutions?


Solutions?

Sustainable entrepreneurship

Scaling up innovation
• Which connections are needed for further innovation?• How do we scale up innovations better and faster?• What is needed to incentivise the late majority?• What is needed to incentivise the laggards?• Is the playing field national, European or global? So...?

So, this circular economy
Impossible, but doable