operability in process design: achieving safe, profitable, and...
TRANSCRIPT

Operability in Process Design Chapter 9. Troubleshooting
9-1
Operability in Process Design: Achieving Safe, Profitable, and Robust
Process Operations
Chapter 9: Troubleshooting
Thomas Marlin Flare picture by Hartnup (2005)

Operability in Process Design Chapter 9. Troubleshooting
9-2
Troubleshooting release 2.2 on August 2014
Copyright © 2014 by Thomas Marlin
This document is copyrighted by Thomas Marlin. Content is not to be reproduced or redistributed without the expressed consent of the author.
License for university use
A cost-free license is granted for use at not-for-profit universities. The material may be used for classroom display, and students may store one copy in electronic or hard copy for their personal use. No fee may be charged for distribution of copies beyond the cost of copying. Any use of the material in part or in whole must include a citation of the source.
License for non-university use
For other use of the materials, including any commercial use, please contact T. Marlin at: [email protected]
This material is provided to promote education in the general field of “process operability” via the Internet site www.pc-education.mcmaster.ca . It is one of the chapters of an integrated presentation of selected operability topics. The author would like to hear from readers on how they are using this material. In addition, he would appreciate suggestions for improvements and extensions. He can be contacted at [email protected] .
Acknowledgements
Don Woods for developing and promoting problem solving and troubleshooting methods
in engineering education
Trevor Kletz and others in engineering practice who have promoted troubleshooting and provided vivid examples that bring the topic to life
Thanks to Scott Fogler and Kevin Dunn for reviewing sections of this chapter. Naturally, responsibility for all remaining mistakes and lack of clarity remains with the author, who is sometimes too stubborn to listen to good advice.
Everyone who posts materials with the Creative Commons license
Disclaimer
While care has been taken in the preparation of the information contained in this chapter, the author cannot guarantee its accuracy or applicability for a specific application. Persons accessing and using this information do so at their own risk and indemnify the author from any and all injury or damage arising from such use.
Operability in Process Design Chapter 9. Troubleshooting
9-3
Table of Contents
Section Page
Symbols 4 Nomenclature 6 9.0 To the Student 7 9.1 Quick Introduction to a Problem Solving Method 10 9.2 Time-critical Issues in Troubleshooting 17 9.3 The Troubleshooting Method with a Worked Example 21 9.3.1 Introduction 21 9.3.2 Troubleshooting example problem, Drooping Temperature 23 9.3.3 Engage: Stage 1 in the Problem Solving Method 26 9.3.4 Define: Stage 2 in the Problem Solving Method 28 9.3.5 Explore: Stage 3 in the Problem Solving Method 32 9.3.6 Plan: Stage 4 in the Problem Solving Method 44 9.3.7 Do It: Stage 5 in the Problem Solving Method 57 9.3.8 Look back and Evaluate: Stage 6 in the Problem Solving
Method 60
9.4 Apply the Troubleshooting Method to Examples 65 9.4.1 The Persistently High Distillation Pressure 65 9.4.2 Startup without Quality 72 9.4.3 The Frenetic Flow Rate 78 9.5 Refining Troubleshooting Skills 85 9.5.1 The cause-effect chain 85 9.5.2 Range of root-cause investigation 88 9.5.3 Multiple root causes 90 9.5.4 Decision making 95 9.6 Designing processes for Troubleshooting 103 9.6.1 Measurement guidelines for common sensors 103 9.6.2 Introduction to extraordinary measurements for
troubleshooting 104
9.6.3 Distillation 106 9.7 Conclusions 108 References 110 Additional Learning Resources 113 Test Your Learning 116-
118

Operability in Process Design Chapter 9. Troubleshooting
9-4
Symbols

Operability in Process Design Chapter 9. Troubleshooting
9-5
HEADER (STEAM ORCONDENSATE)
STEAM TRAP
MOTOR
TURBINE FLOWMETER
ORIFICE PLATE
CENTRIFUGALFAN
M
T
POSITIVEDISPLACEMENTPUMP
CONDENSER
DRAIN TO SEWER
IMPELLER
VAPORIZERORREBOILER
FILTER AND DRAIN
CYCLONE
DAMPERORBUTTERFLY VALVE
STEAMEJECTOR
FLARE STACK
SHELL AND TUBEHEAT EXCHANGER
FANORBLOWER
FAN
TURBINE USED TOPROVIDE WORKTO DRIVECOMPRESSOR

Operability in Process Design Chapter 9. Troubleshooting
9-6
Nomenclature AIChE American Institute of Chemical Engineers AND Logic where output is true if all inputs are true API American Petroleum Institute BP International company previously known as “British Petroleum” CCPS Center for Chemical Process Safety
American Institute of Chemical Engineers CSB US Chemical Safety Board CSTR Continuous flow Stirred Tank Reactor DCFRR Discounted Cash Flow Rate of Return, a method for evaluating the
profitability of a number of cash flows at different times DOE US Department of Energy EPA US Environmental Protection Agency Four W’s What, Where, When, Who HAZOP Hazards and Operability; see Chapter 5 on safety. KPI Key Performance Index (or Indices) MARR Minimum acceptable rate of return NPV Net Present Value, a method for evaluating the profitability of a
number of cash flows at different times OR Inclusive OR so that output is true is any one or more of the inputs is
true PHA Process Hazard Analysis SMART-$ Specific, Measureable, Attainable, Reliable, Timely, Safely and Cost-
effective SWOT Strengths, Weaknesses, Opportunities, and Threats TMI Three Mile Island nuclear power plant, Pennsylvania, USA TS Troubleshooting Significance level for hypothesis test 2 Chi-squared statistic

Operability in Process Design Chapter 9. Troubleshooting
9-7
Chapter 9. Troubleshooting
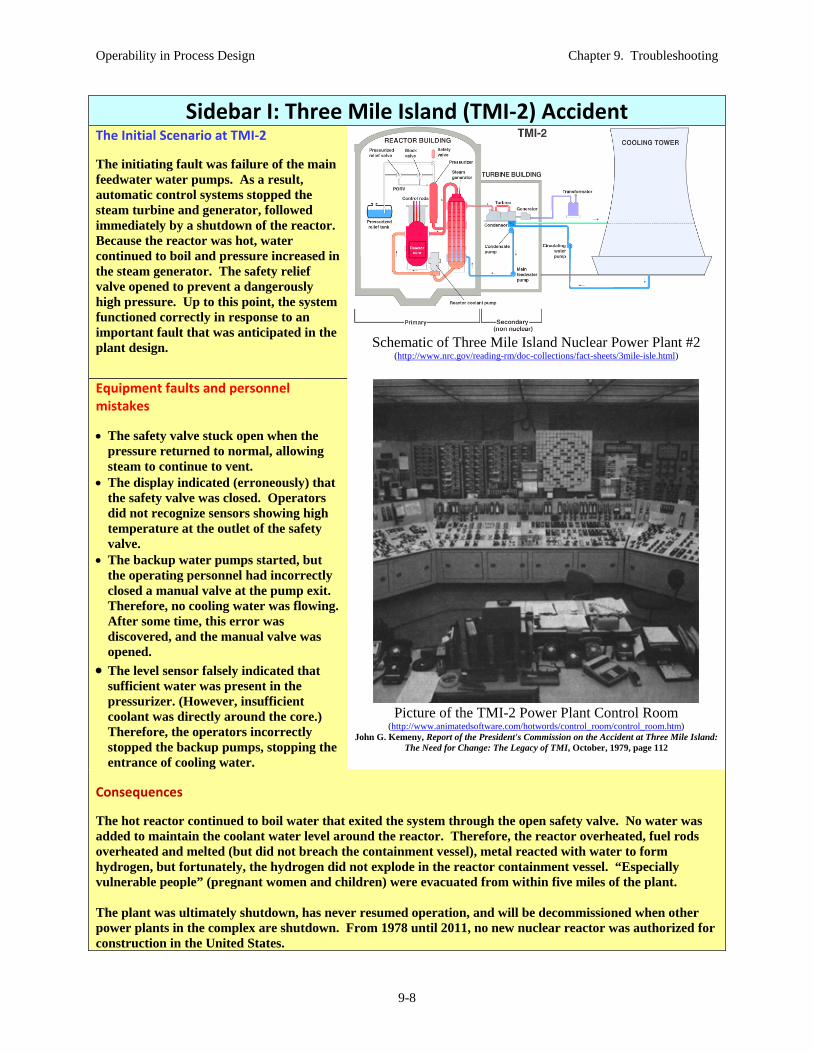
9.0 To the Student You have been troubleshooting your entire life. When you try to print your report fifteen minutes before it is due for submission and the printer does not function, you begin troubleshooting! Since everyone has so much experience, why have a chapter on troubleshooting? First, without training we each apply a highly personalized troubleshooting approach that lacks a systematic structure, leading to wasted time and perhaps, failure to solve the problem. Second, engineers need to learn how to make the best use of their extensive knowledge to facilitate troubleshooting technological systems. Finally, design engineers provide the facilities (sensors, sample points, databases, etc.) needed by operations personnel when troubleshooting. Therefore, this material introduces the troubleshooting method and gives guidance on designing systems to facilitate monitoring and diagnosis. The Three Mile Island nuclear power plant accident provides one (of many) examples where experienced and knowledgeable operations personnel failed to troubleshoot an incident in time to prevent serve damage and enormous financial loss. This accident is summarized in Sidebar I. The incident provides examples of poor plant design, faulty equipment, human error and people under stress failing to use information available to diagnose the situation and take corrective action in a timely manner. As a result, the multibillion-dollar plant was never returned to operation, and no orders were placed for nuclear plants in the United States for over 30 years. Controversy remains concerning the harm to humans from the releases of radioactive material.
Chemical engineers share the need for troubleshooting education with many people, for example, medical professionals (doctors, nurses, and EMS personnel), transportation engineers and operators (e.g., pilots), and manufacturing plant operators (power plants, chemical plants, refineries, food processing, pharmaceuticals, etc.). Therefore, substantial resources have been invested in determining troubleshooting approaches for complex technical systems and in teaching these methods.
The material in this chapter provides a systematic troubleshooting method that can be used in diagnosing manufacturing facilities and determining corrective actions. It is tailored to assist engineers and operators in diagnosing problems in process plants and is applied to numerous examples. It deals with many challenges we encounter, including emotional responses, data collection, quickly obtaining a broad understanding of the situation, generating likely hypotheses, gathering new information to isolate the true cause, and implementing (short-term and long-term) solutions.
Extensive experience demonstrates that everyone improves from studying and practicing a problem-solving and troubleshooting method. This is especially true for professionals in fields that are required to solve problems under stress and to design complex systems for others to operate.
Operability in Process Design Chapter 9. Troubleshooting
9-8
Sidebar I: Three Mile Island (TMI‐2) Accident The Initial Scenario at TMI‐2 The initiating fault was failure of the main feedwater water pumps. As a result, automatic control systems stopped the steam turbine and generator, followed immediately by a shutdown of the reactor. Because the reactor was hot, water continued to boil and pressure increased in the steam generator. The safety relief valve opened to prevent a dangerously high pressure. Up to this point, the system functioned correctly in response to an important fault that was anticipated in the plant design.
Schematic of Three Mile Island Nuclear Power Plant #2
(http://www.nrc.gov/reading-rm/doc-collections/fact-sheets/3mile-isle.html)
Equipment faults and personnel mistakes
The safety valve stuck open when the pressure returned to normal, allowing steam to continue to vent.
The display indicated (erroneously) that the safety valve was closed. Operators did not recognize sensors showing high temperature at the outlet of the safety valve.
The backup water pumps started, but the operating personnel had incorrectly closed a manual valve at the pump exit. Therefore, no cooling water was flowing. After some time, this error was discovered, and the manual valve was opened.
The level sensor falsely indicated that sufficient water was present in the pressurizer. (However, insufficient coolant was directly around the core.) Therefore, the operators incorrectly stopped the backup pumps, stopping the entrance of cooling water.
Picture of the TMI-2 Power Plant Control Room
(http://www.animatedsoftware.com/hotwords/control_room/control_room.htm) John G. Kemeny, Report of the President's Commission on the Accident at Three Mile Island:
The Need for Change: The Legacy of TMI, October, 1979, page 112
Consequences
The hot reactor continued to boil water that exited the system through the open safety valve. No water was added to maintain the coolant water level around the reactor. Therefore, the reactor overheated, fuel rods overheated and melted (but did not breach the containment vessel), metal reacted with water to form hydrogen, but fortunately, the hydrogen did not explode in the reactor containment vessel. “Especially vulnerable people” (pregnant women and children) were evacuated from within five miles of the plant. The plant was ultimately shutdown, has never resumed operation, and will be decommissioned when other power plants in the complex are shutdown. From 1978 until 2011, no new nuclear reactor was authorized for construction in the United States.

Operability in Process Design Chapter 9. Troubleshooting
9-9
Troubleshooting methods are not strict prescriptions of thoughts and actions. They do not provide a “straightjacket” that limits peoples’ freedom. Rather, they provide a systematic manner of thinking about the diagnosis and solution of problems. At each stage, the troubleshooter is required to apply prior process knowledge, problem-specific information, and professional skills. This is shown schematically in Figure 9.1. The behaviors of expert and novice problem solvers have been investigated intensively and compared to understand the development of “expertise”. Larkin et. al. (1980) summarizes his research in the following statement.
“Although a sizable body of knowledge is a prerequisite to expert skill, that knowledge must be indexed by large numbers of patterns that, on recognition, guide the expert in a fraction of a second to relevant parts of the knowledge store.”
Naturally, experts have a larger store of problem-specific knowledge than novices. However, Larkin points out that an additional important distinction is the manner in which the expert, in contrast with the novice, organizes, recalls and applies knowledge.
Figure 9.1. Schematic depicting skills and knowledge used in plant troubleshooting.
Readers are encouraged to seek understanding of principles and examples that enable rapid recall for application to appropriate problems. No simple prescription exists, but learning should extend beyond specific examples to see generic characteristic issues with instrumentation faults, human mistakes, process chemistry, equipment failures, process structure (e.g., recycle) behaviors, and so forth.

Operability in Process Design Chapter 9. Troubleshooting
9-10
Many published resources are available that address troubleshooting in the process industries. The vast majority provides equipment principles and examples of faults in specific equipment, such as distillation, heat exchangers, and so forth. They do not provide a method for monitoring and diagnosing equipment or more complex process systems. Therefore, they complement this chapter on troubleshooting methodology by providing the requisite process-specific knowledge. A number of these resources are given at the end of this chapter. Some references address troubleshooting methods, with most tailored to a specific application, medical diagnosis, software engineering, automotive mechanics, etc. The best resource for the process industries is Woods’ book titled Successful Trouble shooting in the Process Industries (Woods, 2006). One might consider this chapter as an appetizer to Woods’ book as the full meal. This chapter introduces a general problem-solving method, tailors it for troubleshooting, and provides numerous examples. It is organized in the following manner.
In the next section, we begin with a short introduction to the problem-solving method that provides the foundation for the troubleshooting method.
The following section describes the time constraints for troubleshooting and how the constraints are accommodated in the method.
Then, the troubleshooting method is described in detail along with guidance on performing each stage; one plant trouble-shooting example is solved as each stage of the method is described.
Subsequently, several troubleshooting scenarios are presented; these demonstrate good and poor applications of the troubleshooting method.
Then, a few key aspects of troubleshooting are discussed in more depth. The aspects include defining a root cause, dealing with multiple faults, and systematic decision making.
Finally, good process design practices are presented for process plants that can be easily operated, monitored and diagnosed.
9.1 Quick Introduction to a Problem Solving Method The troubleshooting method is founded on a general problem solving method. There are many problem-solving methods proposed in the literature; the following characteristics, summarized from Woods (2000), seem essential for a successful problem solving method.
Systematic – containing an organized set of stages and guidance on the action of the problem solver at each stage
Generic – can be applied to a wide range of problems in technology, business, and general life
Not sequential – a number of stages give an order in the method, but freedom exists to modify the sequence, especially to iterate by checking back on previous stages to ensure that new results are included in these previous stages
Operability in Process Design Chapter 9. Troubleshooting
9-11
Easily remembered – the number of stages is low and the guidance at each stage can be summarized on a short reference document
Flexible – the method can be adapted to novel circumstances and unique abilities of the individual or group problem solver
The method introduced here was developed by Professor Don Woods at McMaster
University (Woods, 2000). It has been widely adopted in university education, has been applied in numerous disciplines, and is easily tailored for troubleshooting. Should the reader be interested in other problem solving methods, Woods (2000) provides an extensive survey and references for further investigation.
The Woods’ (or McMaster) six-stage problem solving method is shown in Figure 9.2. The schematic does not present a linear set of stages to emphasize the need for iterations, and the elevator depicts the need for continual overview and “look back”, especially to the define stage. These six stages lead the engineer through the common problem solving tasks in a sensible manner, emphasizing definition and understanding in the earlier tasks and testing hypotheses and implementing solutions in the later tasks. (Other problem solving methods have from four to ten stages, and many are narrowly focused on a specific technology, such as software engineering.)
In the author’s opinion, the Explore stage is critical for good problem solving,
since exploring the situation thoroughly is a key feature of expert problem solving. It bridges the definition stages to the hypothesis and solution stages. The troubleshooter explores to gather additional information that is readily available, makes numerous rapid decisions about the likelihood of potential causes (prunes an initially overwhelming tree of possibilities), and applies knowledge and experience to build understanding and identify gaps in information. Here is where the engineer applies extensive understanding and experience through qualitative (order-of-magnitude, limiting assumptions, etc.) analysis. As Larkin explains, the expert sifts rapidly through a vast array of principles, data, similar scenarios, and working hypotheses, while the novice must generate understanding and ideas much more slowly. However, as the novice applies the method and acquires more knowledge, he/she moves one step further down the path to expertise. There appears no shortcut to excellence, but undisciplined problem solving can delay building expertise and limit the ultimate ability of the engineer. Let’s apply the problem solving method to a troubleshooting scenario. Example 9.1. Stubbornly High Distillation Pressure. Allison is a recent graduate from an excellent chemical engineering department. She has been working at her first job for six months and has been recently transferred to a production facility. Her supervisor suggested that she frequently visit the control room and equipment to learn more about the operation and to build relationships with the operating personnel. (By the way, this is very good advice.) She stopped by the control room to gather information about pressure drops along a series of heat exchangers.

Operability in Process Design Chapter 9. Troubleshooting
9-12
Figure 9.2. Schematic of the Woods’ (McMaster) Problem Solving Method, from Woods (1994), with permission.
Sales of the plant’s products have been increasing nicely, so the plant is increasing production rate – slowly to prevent disturbances. The operator is in a bad mood, shouting that the distillation pressure control does not seem to be working and the control engineer should be fired.

Operability in Process Design Chapter 9. Troubleshooting
9-13
1
2
3
13
14
15LC-1
LC-3
dP-2
To flare
T5
T6
T-7
AC-1
LAHLAL
PC-1
P3
FC-4
FC-7
FC-8
F9
PV-3
TAL
T10
LI-5
CW
PAH
LAHLAL
L-7
F10 T15
NO
fo
fc
fc
fc
fo
To flare
PV-5
fc
dP-1
P-100
P-101
P 200
P 201
v110
v120
v130
v140
v150
v100
P8
P9
P7
Figure 9.3. Distillation tower for Example 9.1 Stubbornly High Distillation Pressure.
The distillation tower is shown in Figure 9.3. The pressure sensor PC-1 indicates a pressure above its set point. Increased sales will make the company a lot of money. If the production rate cannot be increased, it will be a black eye for the operator, the unit supervisor, and maybe her too! Therefore, she had better solve this problem.
The typical solution will be summarized in the following, with comments on good and
poor features.

Operability in Process Design Chapter 9. Troubleshooting
9-14
Engage Allison did not get a good grade in her mass transfer course, so she is hesitant to become involved in solving the problem.
We must be confident, without overestimating our capabilities. Prior difficulty in learning or a poor course grade should not set the standard for the rest of Allison’s life. When we engage, we must believe that we can succeed! Allison should think about engaging more people with diverse skills in solving this problem.
The operator does not allow Allison to sneak out. He asks for her assistance.
This boosts her confidence, so Allison thinks that she will apply the problem solving method learned in university. She recalls that some stress is natural and resolves to manage it.
Define The operator asks her to correct the pressure controller, which he feels is causing the problem.
Allison acknowledges this input and does not dispute the operator’s suggestion. However, she explains that she thinks it best to define the problem. (The operator is skipping steps and jumping to a conclusion; this is a common miss-step in problem solving.)
Allison states the problem as being the high pressure in the distillation tower.
She fails to be sufficiently specific. For example, the problem is the reported sensor indication of high pressure. In addition, she should define who, what, where, when and why. Has a major change like a plant startup occurred recently? When did the problem begin? Is the solution time-critical?
Explore Allison moves on to the explore stage. She tries to recall distillation principles and why staged operations would have a high pressure. She refers to her textbook, which is fortunately available as an ebook on her laptop. She feels comfortable with distillation principles.
Allison should think more broadly. She needs to understand the entire process. In this problem, heat transfer and fluid mechanics will play a big role in pressure. In addition, instrumentation and control will provide valuable information and could be a source of faults in the system.
She talks to the operator who after prodding, explains how the flooded condenser functions, i.e., by covering some heat transfer area to modulate the rate of condensation. He acknowledges that high pressure could be the result of low condensation or high reboil of vapor. Each of these could have multiple causes, for example, high reboil could result from higher temperature heating medium, higher source pressure of heating medium, etc. In addition, he has referred to only sensor PC-1, which might have a fault.
Some good progress is being made here in understanding the scenario and equipment. We see that the “plot thickens” as they follow the causal chain down various paths. While good, more exploring should be pursued. The target process conditions (state) after successful problem solving should be defined. While exploring, time-critical issues like safety should be continually addressed. A high pressure in a closed vessel could be dangerous, but they have not considered this important issue.

Operability in Process Design Chapter 9. Troubleshooting
9-15
Plan Allison decides to move on to the plan stage where she will develop working hypotheses. She and the operator develop the following list. 1. The steam valve v140 has failed open. 2. The inlet cooling water temperature to the condenser
is too warm. 3. The valve at the condenser outlet, v110, is closed too
much. 4. The PC-1 pressure sensor is in error, displaying a
value higher than the true pressure.
This is a good list, but far too short. The likely causes of the short list are the limited explore activity, the limited experience of the engineer, and the “tunnel vision” of both Allison and the operator. They will be very lucky to successfully troubleshoot this scenario with so few candidate causes!
Allison decides to proceed to evaluating hypotheses. She can gather additional data to test hypotheses that cannot be eliminated using the original information from the Define and Explore stages. Allison first decides to have the PC-1 pressure sensor calibration checked by a qualified instrumentation technician. The result of this check is that the pressure sensor appears to function correctly.
This first action will likely take hours to locate a technician, convince him/her to rearrange the work schedule, and perform the calibration. Is there a faster way to achieve the same result? We note in Figure 9.3 that the pressure sensor P3 measures essentially the same pressure. In addition, she could check if the high-pressure alarm is active. The pressure P3 value can be determined using the sensor display locally at the equipment.
Next, Allison determines the position of the steam valve. She asks an outside operator to check if the valve is “OK”. The operator replies that the valve is OK.
This request for information is vague. The operator could judge that the valve is OK because it is not leaking. She must be very specific when asking for information; she should ask the reading of the valve stem position on the local display.
Then, Allison wants to know if the cooling water is too warm. However, there are no sensors on the cooling water.
Here, we encounter a design problem with the equipment; apparently, the design engineer saved capital investment by eliminating sensors that were not required for normal operation but are invaluable for troubleshooting. Bad practice!
The operator points out that the “capacity” of the condenser can be determined from the level of condensate in the heat exchanger. If nearly full, the condenser has much spare capacity for increasing heat transfer by lowering the level to uncover more area for condensation. If nearly empty, the condenser has nearly no additional capacity. Allison is pleased with this suggestion and thanks the operator.
The operator is displaying good understanding of the process equipment and good teamwork skills. Allison is providing positive feedback to encourage him. A good explanation of distillation condensers is provided by Sloley (2001).
An operator is sent to the distillation tower to read the value of LI-5 and to determine the position of the control valve below the heat exchanger. The operator radios the information that the heat exchanger condensate level is zero and the control valve v110 is fully opened.
The information asked for is specific.
Allison sees the light! The condenser is not able to condense all of the vapor at the design pressure. The pressure rises, which causes the temperature of the boiling vapor to rise. At some point, the temperature driving force is large enough for all vapor to be condensed. She concludes that the equipment is limiting the production rate.
They are on the right track here and have diagnosed the cause of the problem.

Operability in Process Design Chapter 9. Troubleshooting
9-16
Do It Allison and the operator confer, and they decide to reduce the reboiler duty to decease the required condensation. They decrease the reboiler is steps of 2% until the pressure returns to its set point (desired value) and the pressure controller is adjusting the valve with a value around 90% open to give some freedom to respond to small variations in condensing duty.
They have not considered a number of alternative solutions, systematically evaluated, and selected the best. They have devised a response that serves three purposes. First, it moves the operating conditions to a safe region. Second, it enables the process to continue operation, and third, it provides information that verifies (or could disprove) their analysis. The process responds as predicted, which verifies their diagnosis.
Look back and Evaluate Allison and the operator celebrate, and Allison returns to her office. It is Friday, and during the weekend, she will off canoeing with friends. The operator will be leaving for his long-awaited vacation in Australia at the end of his shift.
Not so fast! Much of the Look Back stage remains. The production rate remains high but the required separation is not possible with the distillation tower operating at low reboiler duty. Most importantly, the problem and solution must be
documented and communicated to operating personnel. Otherwise, this valuable experience will be lost, and the problem will recur.
The cooling water operation should be investigated. Perhaps, the flow could be increased by placing a larger pump (or a booster pump) in operation. In addition, perhaps the temperature could be lowered by placing an additional cooling tower in operation.
An economic analysis should be performed to determine the most profitable operation with the current equipment. Perhaps, the production can be maintained high with one of the distillation products being less than the desired purity. Or, perhaps the production rate has to be decreased to maintain both top and bottom purities at their original values. This requires analysis.
Finally, Allison needs to reflect on her experience. What has she learned about troubleshooting and plant operations? How can she build her knowledge to perform better next time?
This short scenario demonstrated that Allison was able to apply the problem solving
method, which helped her to organize the investigation and to ultimately solve the immediate problem. However, she missed many important issues, could have solved the problem much faster, and did not follow through to the best long-term solution.
Don’t worry! After this chapter, you will be able to apply the troubleshooting method to
successfully solve problems like the one Allison just worked on.
This would not have been judged a success in the plant.

Operability in Process Design Chapter 9. Troubleshooting
9-17
We conclude that for maximum effectiveness, the generic problem solving method needs to be tailored to the troubleshooting activity. Many guidelines are needed for each stage, and several examples are needed to demonstrate the applicability of the enhanced method. This tailoring will be the main thrust of the remainder of this chapter. Engineers can be called upon to troubleshoot in many circumstances. As required in Example 9.1, we can seek to solve a problem while it is occurring. In contrast, we can investigate an incident after it has occurred and any undesirable consequences have occurred; this would be a “post mortem”, such as determining the cause of a plane crash. In this chapter, we will focus on solving a problem while it is occurring. Since the process is not functioning well and the situation could be degrading rapidly, time is of the essence. Since plant operation continues, we have to consider safety, equipment protection, and product quality. It might be necessary to take actions based on these overriding considerations before the problem has been solved. Therefore, we will discuss time-critical issues before moving on to the troubleshooting method.
9.2 Time-critical Issues in Troubleshooting Mal-operation of a large, complex production plant can lead to dangerous and/or costly situations that should be avoided by immediate actions by operating personnel. We must continually monitor plants for such situations and take appropriate actions, which can vary from minor changes to extreme interventions. However, extreme actions like shutting down a plant can be very costly, so we must take actions that are proportionate to risks. In this section, guidance is provided for matching the troubleshooting actions with the risks. We will use the term “time-critical” for situations that require an aggressive response quickly to avoid a high-risk condition and prevent a hazard or accident. We will separate time criticality into three categories that are shown in Figure 9.4 and discussed in the following.
Highly time-critical – One of the following is imminent; (i) a serious hazard with the potential for loss of life or serious injury, (ii) major environmental damage or (iii) serious damage to process equipment. A very aggressive action is required. Normally, this action will stop production and result in a much safer process condition. The aggressive action will result is significant economic loss and might damage process equipment. Production will not be continued. The problem must be solved before the equipment is started again.
Moderately time-critical – The process operation is undesirable and will lead to large economic loss; this operation must not continue. However, no major hazard is imminent. Through moderate changes to operating conditions, the plant can be placed in a safe condition, perhaps with production continuing, while troubleshooting proceeds. Typical moderate changes include (i) returning to the last good operating point, (ii) reducing production rate, (iii) lowering reactor temperature or conversion, (iv) increasing the cooling rate, (v) and so forth.

Operability in Process Design Chapter 9. Troubleshooting
9-18
Figure 9.4. Flowchart of the Troubleshooting method showing the effect of time-critical
decisions. “Safe park” and “Shutdown” could be referred to as Interim Containment actions.

Operability in Process Design Chapter 9. Troubleshooting
9-19
We will term this temporary operating condition “safe park”, and after troubleshooting has been completed, we anticipate correcting the problem and returning the process to normal operation.
Not time-critical – The process can be maintained in the current condition, which might not be the most profitable operation. However, the process is safe, equipment will not be damaged and acceptable product quality can be achieved. Troubleshooting can continue without changes to the current operation. After successful troubleshooting, the process will continue operation in an improved operating point. Naturally, the process cannot be maintained in the initial, poor operating condition indefinitely, and delays in trouble shooting analysis or solution implementation may require that the process operation be altered to a safe park condition.
Highly and moderately time-critical conditions involve a significant likelihood of process
conditions quickly proceeding to one or more of the following situations.
Extreme pressure – Pressures above the maximum for which the vessels and pipes were fabricated can lead to explosions. Pressures much below normal, usually below atmospheric, can lead to implosions. High and low pressures both represent the potential for equipment damage and harm to personnel.
Loss of containment – Process materials should be contained in process equipment, whether closed vessels and pipes or open conduits and vessels. Containment can be lost through overflow of open equipment, bursting closed equipment, or damage to rotating equipment, such as pumps and compressors.
Combustion and explosion – A fuel source, an oxidizing agent and energy are the three contributions for combustion and explosion. All three should not be available in a location at quantities that support combustion. However, faults can lead to unsafe conditions.
Exothermic reactions – When some chemical reactions occur, chemical energy is transformed to raise the temperature of the materials. These can be operated safely, but faults can lead to “run-away” conditions that are hazardous. (Similar situations could occur for autocatalytic reactions.)
Toxic and hygiene – Some materials can harm people and contact should be prevented by proper design and operating policies.
Product quality – In some cases, purity of the product is paramount, and impurities can harm customers. Examples include food and pharmaceutical manufacturing.
Equipment damage – Mal-operation of equipment can lead to damage that can harm personnel and cost millions of dollars to repair, not considering the cost of shutting down the process. The most sensitive equipment is high-speed rotating equipment like pumps, compressors, centrifuges, and so forth. Other equipment can be sensitive, such as glass-lined vessels.
The list above gives some more common examples and is not meant to be comprehensive. Naturally, the reader can see that one of the items could lead to one or more of the others.

Operability in Process Design Chapter 9. Troubleshooting
9-20
Whether a situation is highly or moderately time-critical depends on the severity of the possible bad condition, the likelihood of it occurring, and time for the bad condition to evolve. There are no hard and fast rules. These decisions should be the results of the HAZOP (Hazard and Operability) studies, be documented in operating policies, and be clearly communicated in operator training. Readers familiar with design for safety are aware a process contains many automated systems to prevent hazardous conditions with a high reliability. If this is so, why does troubleshooting need to be concerned with highly time-critical issues? Aren’t these covered by safety systems? The answer is yes – but only partly. Faults can occur that are outside of the design considerations of the safety systems. For example, a pipe failure and subsequent loss of containment is not addressed by any automated system. Operating personnel must respond. In addition, the automated safety system can fail, even if carefully designed to industrial best practices. People must diagnose these faults and respond accordingly. Recall the Three-Mile Island experience in Sidebar I in Section 9.0.
The reader should recognize that the question of whether or not a time-critical situation exists occurs many times during troubleshooting; the evaluation continues whenever the process is in operation. When a time-critical situation is identified, the proper action is required immediately. The choice of time-critical action should have been a key component of training for operating personnel. The shutdown procedures must be well understood and frequently practiced. In addition, many shutdowns are automated, so that the operator need only push the “red button” to initiate a shutdown. Also, “safe park” conditions should be identified during training. Some become apparent during troubleshooting; for example, if equipment capacity limitations have been reached or violated, reducing production rate often returns the process to an acceptable safe park operation. The intermediate state involves as full a solution to the problem as possible with the plant in operation. This state might involve returning to the desired operation, with no residual economic loss during future operation. However, the intermediate state might have to be adjusted to accommodate the effects of a fault that cannot be corrected immediately without stopping plant operation. For example, the reduced condenser capacity in Example 9.1 resulted in an intermediate state achieving the desired production rate but a higher than desired impurity in the bottoms product. When a fault involves equipment performance corrected during a shutdown, we usually wait for the next scheduled shutdown, which could be many months in the future. Only when the fault causes extreme economic losses would we immediately shutdown the plant for many days, and then only when the skilled personnel and spare parts are available. Another reason for remaining at an intermediate state is a delay in completing the troubleshooting procedure. In some cases, special equipment and skilled personnel from outside the company are required, such as radiological evaluation of closed vessels. This test is expensive and requires considerable time to arrange. We would seek an intermediate state to continue operation until the further testing or solution implementation is possible.

Operability in Process Design Chapter 9. Troubleshooting
9-21
To this point, we have had an introduction to the generic problem solving method and seen a typical flowchart giving a timeline for troubleshooting. Now, we are ready to determine the creative activities performed in the “troubleshooting boxes” in Figure 9.4.
9.3 The Trouble Shooting Method with a Worked Example The basic approach for troubleshooting is contained in the Problem Solving method introduced in Section 9.1. However, it must be mastered and tailored to the troubleshooting application, as demonstrated in Example 9.1, where less than success was achieved. We adopt the problem solving method as the skeleton and enhance it – add muscle and sinew –to complete the systematic troubleshooting method. 9.3.1 Introduction Before building the troubleshooting method, we will consider a few issues that apply to all stages. The first is the troubleshooter’s attitude. Rugarcia et. al. (2000) emphasized three key characteristics in education; knowledge, skills, and attitude, and these characteristics are critically important in engineering practice as well. Engineering knowledge is provided in many courses and is the main emphasis of the engineering curriculum. The professional skill addressed here is troubleshooting, which is supported by other skills like teamwork, time management and stress management. Attitude is also essential for success. Some good and poor attitudes are summarized in Table 9.1. It is the wise engineer who monitors his/her problem-solving methods when encountering problems, sticks to successful methods, and reflects on the good and poor experiences when a task has been completed. The second general issue is accessing and using resources for troubleshooting. A wide array of resources are (or should be) available. These resources are summarized below in several categories characterized by the time required to access the information. Available in the control room immediately - Current values of measured variables (those transmitted to digital control system) - Trend plots showing recent dynamic behavior of measured variables
- Historical values of measured variables giving values over previous days, weeks and months
- Alarm history giving when alarms have been activated over the last few days - SIS history giving when SIS has been activated over the last few days - Operations log book with entries explaining goals, actions taken, and special conditions
in the plant - Process drawings (P&ID, PFD, vessel details, etc.) - Quality control data transmitted from the plant laboratory

Operability in Process Design Chapter 9. Troubleshooting
9-22
Table 9.1 Some Good and Poor Attitudes for Troubleshooters Good attitudes Poor attitudes
Use a systematic TS method. Under stress, revert to an undisciplined approach. You tend to act before analysis has been completed.
Be confident, but not arrogant. Feel pressure because you do not immediately recognize the cause. These are difficult problems, not true-false questions.
Expect some “deadends” before a solution becomes apparent. Expect that the method will lead you to good hypotheses, which you can evaluate using data and engineering knowledge to identify the true cause.
Jump to conclusions before the analysis is complete. Worse yet, guess. Become disillusioned if success is not immediate.
Work with other people, utilizing their relevant information and special knowledge.
Act alone or exclude “difficult” people. Blame others for the problem or lack of solution.
Review the easily available information first; then, access more time-consuming resources as needed.
Do not use all resources described in this chapter
Consider time-critical issues (safety, environmental protection and equipment protection) throughout the procedure. Be prepared to take decisive action if the incident threatens to proceed to a hazardous situation.
Concentrate only on product quality, production rate or efficiency, to the exclusion of other issues. Assume no hazard can occur.
Apply engineering knowledge, both first principles and equipment-specific.
Rely on superficial analysis or “gut feel”.
Monitor the progress of the investigation and if deviating from good troubleshooting methods or effective teamwork, corrects immediately.
Concentrates on the “task at hand” and ignores the “touchy-feely” stuff.
Available with a delay of typically 10-60 minutes
- Measured values from locally-displayed sensors - Observations about equipment (optical pyrometer temperature, noise, vibrations, leaks,
etc.) - Maintenance log recording work orders and completion of tasks on equipment and
instruments Available with significant delay (many hours)
- Additional laboratory analyses performed as part of troubleshooting - Detailed design information for process equipment (compressor map, pump head curve,
etc.) - Calculations to estimate process conditions not measured directly (flows in a distillation
tower, pressure drop in piping and heat exchangers, etc.) Available with significant delay (many days or weeks)
- Special investigation of process equipment (e.g., radiological scanning of equipment to diagnose condition of internal components like distillation trays without stopping operation)
Operability in Process Design Chapter 9. Troubleshooting
9-23
- Isolating some equipment, stopping its operation, and opening for inspection, e.g., heat exchangers for leak or packed bed for catalyst mal-distribution. This could also detect foreign materials in the process equipment.
Troubleshooters employ all of these information resources. Naturally, we will begin with the easiest and fastest first and proceed to more expensive and time-consuming when the earlier actions do not support adequate diagnosis. The third general issue involves when to conclude the troubleshooting task, which is not as obvious as might be expected. Our goal is to return the process to safe, reliable and profitable operation. This requires that we understand the problem well enough to attain this goal with the flexibility available in the plant. Where possible, the “Do It” stage will conclude with the plant returned to the best operation under the circumstances. In Example 9.1 Stubbornly High Distillation Pressure, the best possible operation was less profitable than the intended design conditions because of the lower maximum duty in the distillation condenser.
Is this the conclusion of Troubleshooting? Definitely not! The “Look back” stage requires the engineer to dig deeper, ascertain the “root cause”, and devise a long-term solution. This long-term solution might require substantial investment and only be possible during a full plant shutdown that occur infrequently, perhaps only once in one to two years.
Finally, we recognize that the problem solving method involves many stages. As we
tailor it to troubleshooting, many additional guidelines will be introduced. How can you memorize all of this? Don’t try! The purpose of the method is to aid you, not to introduce more stress by requiring memorization. The information in Figure 9.5 provides a memory aid for engineers performing troubleshooting. Readers are encouraged to use this table – and add to it as they gain experience in troubleshooting.
Now we are ready to proceed with the troubleshooting method. Let’s learn about the
process example that we will investigate during the remainder of this section. 9.3.2 Trouble Shooting Example Problem The example titled “The Drooping Temperature” is described here. As each stage of the troubleshooting method is introduced in subsequent sections, the stage will be performed on this example problem. Example 9.2a The Drooping Temperature. You are working at your first job, in which you are responsible for the chemical plant in Figure 9.6. Good news, the market for your product has been increasing. During the morning meeting, you have asked the operator to increase the feed flow rate slowly. In addition, the maintenance group will be calibrating all flow meters this week.

Operability in Process Design Chapter 9. Troubleshooting
9-24
Figure 9.5. Synopsis of the Troubleshooting Method
Copyright © D. Woods and T. Marlin 2010

Operability in Process Design Chapter 9. Troubleshooting
9-25
Fig
ure
9.6
. S
chem
atic
of
the
proc
ess
for
Exa
mpl
e 9.
2 T
he D
roop
ing
Tem
pera
ture

Operability in Process Design Chapter 9. Troubleshooting
9-26
In the afternoon, you are visiting the control room to check on the instrumentation
maintenance. The technicians have completed two sensors and are on a break. The operator notes that the plant feed tanks were changed recently. One of the outside operators has reported an unusual smell around the feed pump.
The control room operator asks for your assistance. She shows you the trend of data in
Figure 9.7. This does not look usual to you, and she believes that it is caused by improper behavior of the stack damper.
Fortunately, you learned trouble-shooting skills in university. Now, you can combine your skills with the operator’s insights to solve the problem.
9.3.3 Engage: Stage 1 of the Problem Solving Method In this first stage, we manage our emotions and expectations. This sounds easy, but a misstep here can set us on the path to poor performance. Perhaps, the major issue is dealing with a stressful situation for which the solution is not immediately apparent. We see many television game shows that supposedly test a person’s intelligence, where the participant is expected to recall an answer without time for thought or investigation. Perhaps, some university examinations are similar. (If so, this is unfortunate.) If we can diagnose an obvious problem based on evidence and experience, that situation is great. However, most situations – especially the ones where we earn our salary – are not obvious. We have to investigate using the systematic troubleshooting method.
Figure 9.7. Trend plot of key variables in Example 9.2 The Drooping Temperature.
Operability in Process Design Chapter 9. Troubleshooting
9-27
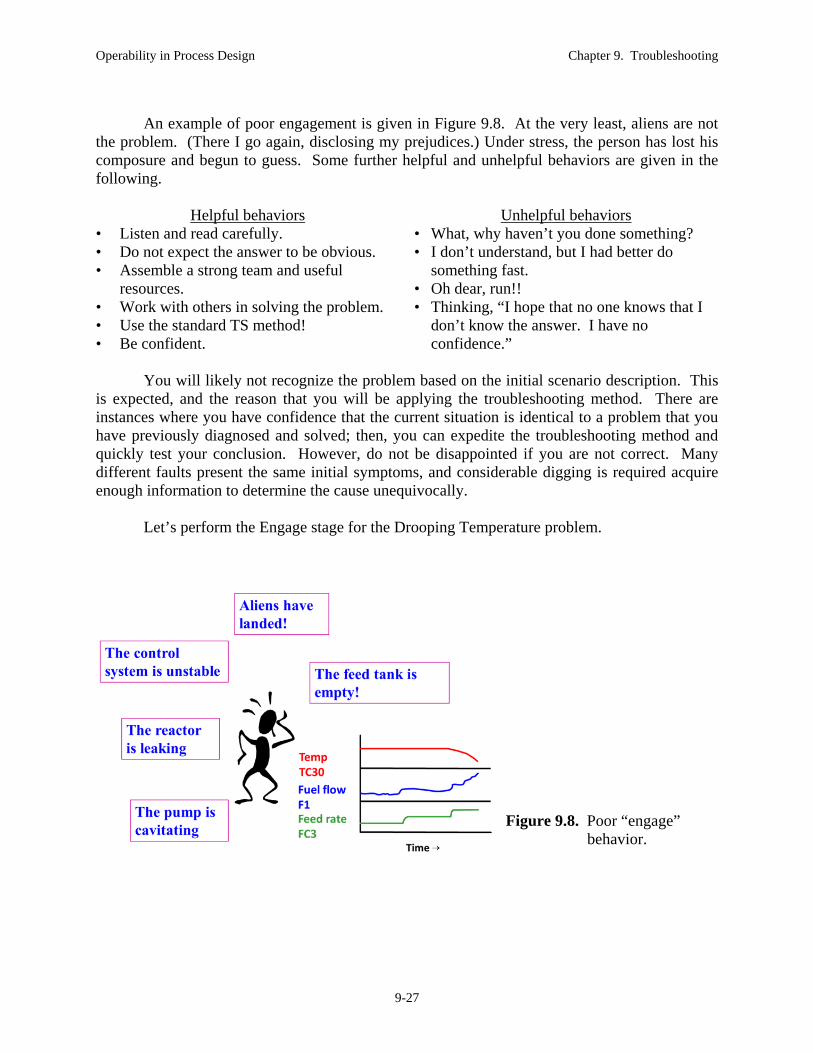
An example of poor engagement is given in Figure 9.8. At the very least, aliens are not the problem. (There I go again, disclosing my prejudices.) Under stress, the person has lost his composure and begun to guess. Some further helpful and unhelpful behaviors are given in the following.
Helpful behaviors • Listen and read carefully. • Do not expect the answer to be obvious. • Assemble a strong team and useful
resources. • Work with others in solving the problem. • Use the standard TS method! • Be confident.
Unhelpful behaviors • What, why haven’t you done something? • I don’t understand, but I had better do
something fast. • Oh dear, run!! • Thinking, “I hope that no one knows that I
don’t know the answer. I have no confidence.”
You will likely not recognize the problem based on the initial scenario description. This is expected, and the reason that you will be applying the troubleshooting method. There are instances where you have confidence that the current situation is identical to a problem that you have previously diagnosed and solved; then, you can expedite the troubleshooting method and quickly test your conclusion. However, do not be disappointed if you are not correct. Many different faults present the same initial symptoms, and considerable digging is required acquire enough information to determine the cause unequivocally. Let’s perform the Engage stage for the Drooping Temperature problem.
Figure 9.8. Poor “engage”
behavior.
Operability in Process Design Chapter 9. Troubleshooting
9-28
Example 9.2b. The Drooping Temperature. Complete the Engage stage for this example. Perhaps, the first question to ask is, “Is this a time-critical situation?” We will assume that no time-critical issue has been recognized and continue along the “not time-critical” path in Figure 9.4. You recognize that you are expert in neither the process nor the equipment in the plant. However, you have a solid engineering background and are a capable problem solver. So, you enter this task with confidence and proper respect for the complexity of the task. When possible, it is good practice to engage a number of people with different knowledge in a troubleshooting team. Typically, a good team will have people with knowledge of process operations, process chemistry, unique equipment, safety, and instrumentation and controls. Forming a team is not always possible, especially for time-critical situations, but every effort should be made to take advantage of the strengths of the organization. For this problem, you find that you can quickly gather the operator, an instrument technician, and an engineer who has designed similar plants; so, you have a good team. In addition, relevant resources should be made readily available. The lists in Section 9.3.1 can be used as a checklist. You don’t have a lot of success in this area. You have the P&I drawing in Figure 9.6, the operations logbook, and of course, information stored in the control system. You are not able to locate detailed equipment drawings. Other information will have to be acquired as needed, with associated delays. You note that several people have made observations. It is good for them to share their ideas, so you should recognize and thank them. Naturally, you will not accept these observations without confirming evidence. 9.3.4 Define: Stage 2 of the Problem Solving Method With a positive attitude and a thoughtful review of the situation during Engage, you are ready to proceed to the Define stage. Here, the situation is described fully without concern for diagnosis, which occurs later in the method. Let’s consider some guidelines for this stage. Sketch - A good initial task in this stage is to draw a sketch of the process or to acquire an existing P&I drawing and note key variables and other aspects of the scenario. Draw a boundary around the process sections that you believed to be involved in the problem. Visit the process – A solid understanding of the process is required for troubleshooting complex problems. If you do not have a good understanding of the process, you should observe the equipment. Note that process drawings (i) do not provide a three-dimensional layout of equipment, (ii) do not show details of equipment, e.g., an orifice meter located above or below the pipe, (iii) do not show distances between equipment, and (iv) occasionally, contain discrepancies between the original design intent and the equipment actually installed. Naturally, the visit will delay the troubleshooting procedure, which must be considered when deciding
Operability in Process Design Chapter 9. Troubleshooting
9-29
whether to visit. However, at least one person involved in the troubleshooting team must have a good understanding of the actual equipment; this is usually the operator. 5Ws 1H – Some basic information can be stated using the “Kipling” approach for important factors starting with 5Ws (Who, What, When, Where, and Why) and 1H (How) that is described in Wikipedia (2012). This approach to problem definition has been in use since the early part of the 20th century in journalism and problem solving for a long time. The definition can include a specific characteristic (“is”) and a boundary for the characteristic (“is not”); see Woods (1994). Process equipment changes – Recent equipment policies have a dramatic effect on the range of likely (or possible) faults that should be considered. A few of the dominant categories are briefly discussed in the following.
Initial process startup - Naturally, if the equipment is being started up for the first time, it has never functioned properly, so that nearly everything should be questioned. Major faults are possible because the equipment has never operated as an integrated plant. While not expected, faults could include incorrect piping connections, instrumentation wiring errors, and foreign materials left in process equipment.
Maintenance shutdown (turnaround) - A reduced range of causes would be considered after maintenance has been performed on an operating process. Since maintenance is a common occurrence, we have to consider faults introduced by incorrect actions. For example, starting up after a maintenance shutdown requires us to consider a very wide range of problems that could have been introduced during the maintenance. For example, temporary blinds that block flow could have been improperly left in place, manual valves could be improperly opened or closed, and instrumentation that previous functioned well could be faulty.
Batch operations – Equipment is often used for processing different materials at different conditions in batch operations. As a result, equipment is often disconnected for changing raw materials or product locations, the cleaning, decontaminating, and other batch steps. These frequent structural changes introduce the possibility of errors that must be considered.
Continuous operation - A more limited range of potential causes is likely for a process that has been operating for an extended time. Pipes cannot be rearranged; and instrumentation cannot be removed. However, continual calibrations and less intrusive maintenance are performed. In addition, we must ensure that some unreported actions have not occurred.
Naturally, checkout tests are performed to prevent faults from being introduced as equipment changes are made. However, experience shows that faults occur occasionally and must be considered when troubleshooting. Time criticality – This has been addressed in the Engage Stage, but we certainly need to address this issue again during the definition stage. SMARTS-$ - We should define the current condition (Should Be and Is), shutdown or safe park states as needed, intermediate state, and the final state. (Refer to Figure 9.4.) We should define
Operability in Process Design Chapter 9. Troubleshooting
9-30
the future states using the acronym “SMARTS-$”for Specific, Measurable, Attainable, Reliable, Timely, Safely, and $=Cost Effective. Missing information – When defining the problem, you are likely to encounter missing information. It is usually best to note this for future investigation. If the information influences your decision on time-criticality, you might decide to determine this information immediately. Example 9.2c. The Drooping Temperature. Complete the Define stage for this example. Sketch – We will use the sketch in Figure 9.6. The initial symptoms appear in the fired heater. Variables upstream could influence the heater, and some variables downstream could influence them also, for example, a flow blockage in the reactor would affect the flow through the heater. Therefore, we look at integrated units. This process has energy exchange with other processes, and it consumes fuel gas from the plant fuel system; therefore, we must include the heat integrated processes and the fuel gas system in the troubleshooting problem. Visit process – Naturally, this action is not possible in a text-based presentation. You can rely on the operator in the team, who ensures you that the sketch is accurate. 5Ws1H – The summary of this analysis is given in Table 9.2. Process operating condition – This situation appears to have occurred during “normal operation” of a continuous process. You check and determine that the last turnaround was over six months ago. You will have to look into the actions of the technicians who were calibrating instruments. Time criticality – The unit involves potentially hazardous combustion. Also, the equipment is expensive, so that damage would be costly to repair. However, you have not identified a risk associated with safety or equipment damage. Therefore, you will judge this as not time-critical. SMARTS-$ - We will begin by describing the initial state. Should be: Furnace outlet temperature should be controlled at the controller set point value, with normal fluctuation of a couple of degrees around the set point. The fuel flow should stabilize after a change in feed flow rate. Actually: The furnace outlet temperature is decreasing monotonically, while the fuel flow rate is increasing. Deviation: The feed flow is behaving as expected. Clearly, the temperature and fuel flow are not behaving as expected. We do not know which is causing the deviation or if some other factor is causing them both to deviate. We define the future state using the acronym “SMARTS-$”.

Operability in Process Design Chapter 9. Troubleshooting
9-31
Table 9.2. Contribution to the Define stage Who is involved in the incident?
The control-room operator was involved in actions. We do not yet know if a local operator influenced the equipment or observed useful information.
What is affected in this incident?
The temperature of process fluid leaving the heater (low) and the fuel flow to the burner (high) are affected. The production rate was changed by the operator. Product quality has not been affected (as far as we know at this point).
Where did the symptoms occur?
The initial symptoms are limited to the fired heater. We need to check other units.
When did the symptoms occur?
Symptoms began after the second feed rate increase by operator. Operation appeared normal before the last feed rate change.
Why did the symptoms occur? Why is this perceived to be a problem?
We are not able to answer this question yet. The unusual trend of temperature and fuel are “concerning”. The fuel is increasing while the temperature is decreasing. This is counter intuitive, so we had better investigate.
How was this problem detected?
The operator detected the symptoms.
Specific The set points of the controllers define specific values. Other measured variables
have acceptable ranges; for example, the tank levels are expected to change, but should not exceed high and low alarm limits.
Measurable We want to achieve a stable steady state, with no variables increasing or decreasing “without limit”, as some are in our initial situation. We will look at all measured variables to ensure that a steady state has been achieved.
Attainable We must remain within the operating window. Currently, we believe that the equipment has the capacity to achieve the desired operation, although the fuel appears to be approaching its maximum value. If we find that the desired process conditions – after the last feed increase – are not attainable, we will have to define a “good” operating state within the limitations of the equipment. This will likely be the condition just before the last feed increase.
Reliable We will not accept unreliable temporary “fixes”, such as using a low-pressure hose in place of a pipe with the appropriate pressure rating.
Timely We see no time-critical situation at this point. Safely Naturally, we will not compromise safety. All independent protective layers must
remain in operation, and we will not introduce any new hazards. $=Cost
Effective There can be economic tradeoffs when establishing a future operating condition. For example, if the furnace outlet temperature (also the reactor inlet temperature) is not attainable at the higher feed flow rate, you have to determine whether to reduce the feed rate or maintain the high feed rate and accept a lower reactor temperature.
Missing information – You note that there is little initial information about the potential problem. You have only a trend plot of a few variables. You conclude that much investigation will be required in the Explore stage.

Operability in Process Design Chapter 9. Troubleshooting
9-32
The team has made good progress. They quickly consider their attitude built during the Engage stage. It looks good; so, they proceed to the next stage. 9.3.5 Explore: Stage 3 of the Problem Solving Method In this writer’s opinion, good performance in the Explore stage distinguishes the expert from the novice troubleshooter. Here, you investigate the situation, creatively collecting information on a myriad of potential causes and probing areas where information is missing, so that the cause will not elude you. Some guidelines for Explore tasks are given here, but they should not be interpreted as limitations to many others possible. Visit the process – Although this was covered under define, it is worthwhile to reiterate the importance of knowing the equipment in the process. Fundamentals – Engineers can apply fundamental principles quantitatively and qualitatively. We are convinced that all physical systems obey principles such as material balances, energy balances, the second law of thermodynamics, stoichiometry, and equilibrium. We can use these principles to predict future behavior, validate past behavior, and to check measurements. For example, if flows into a process deviate significantly from the sum of flows out, you would look for accumulation (or depletion) of material; if no inventory change has occurred, then you would suspect either a measurement fault or a leak. Check measurements – Engineering students are often presented data that contains no errors. This leads to the false impression that measurements can be made without error and that serious sensor faults are rare, if they ever occur. This unfortunate misunderstanding can plague engineers throughout their careers, especially if they do not work in manufacturing facilities. The reality is that all measurements are corrupted by measurement errors, systematic and random. Engineers need to have a rough idea of the likely errors associated with commonly used sensors when in good repair. A summary of typical measurement errors for common process sensors is given in Appendix A. Other approaches are useful in checking measurements.
First, duplicate sensors are sometimes provided for key variables; in many instances, one of the sensors is displayed locally to reduce cost. Naturally, checking consistency between the duplicate sensors is straightforward, although you must remember that they will essentially never agree exactly, because of measurement errors. Consider two people. One has one watch, and the other has two watches. Question: Which person is sure of the time? Of course, the answer is the person with one watch. The person with two watches obtains two (slightly?) different values of the time. As engineers, we know the uncertainty or error bands for typical sensors and consider this information when analyzing empirical data. We recognize the value of redundant measurements and accept the small discrepancies that occur when the sensors are functioning normally.
Operability in Process Design Chapter 9. Troubleshooting
9-33
Second, several sensors measure can provide checks through fundamental material and energy balances. For example, redundant flow rates sensors can measure flows into and out of any unit. At steady state, the sum of flows in should equal the sum of the flows out.
Third, measurements can be checked using other indications of process behavior. In Arthur Conan Doyle’s short story “Silver Blaze”, the detective Sherlock Holmes notices evidence that everyone else misses. In the story, a horse was stolen from a barn. Holmes remarks on, “The curious incident in the night-time.” When someone notes that the dog did nothing in the nighttime, Holmes elaborates, “That was the curious incident.” Holmes concludes (correctly) that the dog did not bark because it recognized the thief, which exonerated the current suspect and lead to resolution of the mystery (Doyle, 1892). As an example in a process plant, the Three Mile Island indicator showed that the safety relief valve was closed. However, a “curious incident” occurred, specifically, the temperature sensor downstream from the valve showed a persistently high temperature, which suggested that steam continued to flow through the safety valve. Because no one questioned the “curious incident”, significant coolant was lost, and a manageable incident became a major accident.
Fourth, process principles indicate a relationship among some sensors. For example, the exit temperature of a hot stream in a countercurrent heat exchanger should be higher than the entering cold stream temperature. In addition, a sequence of pressure measurements should decrease in the direction of flow (when the velocity does not change significantly). Valuable shortcut information for a troubleshooter is the pressure drops across typical equipment in the plant.
Fifth, process principles indicate a relationship among associated variables. For example in a distillation tower under pressure control, the light key in the bottoms product and the tray temperatures in the lower section of the tower are related.
Sixth, process variables are related in equilibrium processes. For example, the temperature and pressure of a boiling refrigerant are related and can be checked using data for the refrigerant.
Example 9.3. Redundancy opens questions – I. Measuring the same variable twice – Suppose that a process is measuring the pressure in one location with two independent sensors. The operator is faced with the following information.
Sensor Physical principle Sensor span Measured value P130 Piezoelectric 0 – 1.0 MPa 0.73 MPa P132 Piezoelectric 0 – 1.0 MPa 0.79 MPa
What should she conclude? Do the sensors agree or disagree? First, we recognize that we must understand the measurement uncertainty. For example, if the sensors were measured without error (let’s get real, it never happens), it is clear that the measurements do not agree. So, what is the expected accuracy of the sensors? Liptak (2003) provides an estimate for this type of pressure sensor, which is 1% of sensor span. We will take this to be two standard deviations or the 95% bounds.
Operability in Process Design Chapter 9. Troubleshooting
9-34
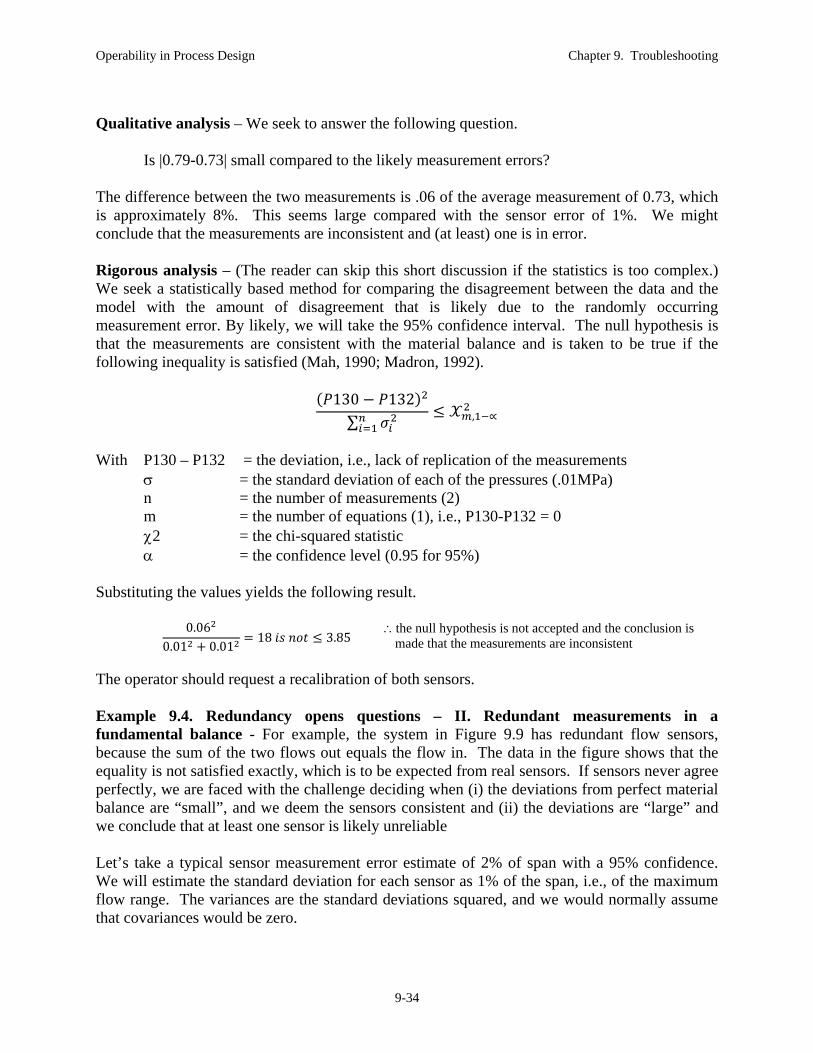
Qualitative analysis – We seek to answer the following question. Is |0.79-0.73| small compared to the likely measurement errors? The difference between the two measurements is .06 of the average measurement of 0.73, which is approximately 8%. This seems large compared with the sensor error of 1%. We might conclude that the measurements are inconsistent and (at least) one is in error. Rigorous analysis – (The reader can skip this short discussion if the statistics is too complex.) We seek a statistically based method for comparing the disagreement between the data and the model with the amount of disagreement that is likely due to the randomly occurring measurement error. By likely, we will take the 95% confidence interval. The null hypothesis is that the measurements are consistent with the material balance and is taken to be true if the following inequality is satisfied (Mah, 1990; Madron, 1992).
130 132∑ , ∝
With P130 – P132 = the deviation, i.e., lack of replication of the measurements = the standard deviation of each of the pressures (.01MPa) n = the number of measurements (2) m = the number of equations (1), i.e., P130-P132 = 0 2 = the chi-squared statistic = the confidence level (0.95 for 95%) Substituting the values yields the following result.
0.060.01 0.01
18 3.85 the null hypothesis is not accepted and the conclusion is
made that the measurements are inconsistent The operator should request a recalibration of both sensors. Example 9.4. Redundancy opens questions – II. Redundant measurements in a fundamental balance - For example, the system in Figure 9.9 has redundant flow sensors, because the sum of the two flows out equals the flow in. The data in the figure shows that the equality is not satisfied exactly, which is to be expected from real sensors. If sensors never agree perfectly, we are faced with the challenge deciding when (i) the deviations from perfect material balance are “small”, and we deem the sensors consistent and (ii) the deviations are “large” and we conclude that at least one sensor is likely unreliable Let’s take a typical sensor measurement error estimate of 2% of span with a 95% confidence. We will estimate the standard deviation for each sensor as 1% of the span, i.e., of the maximum flow range. The variances are the standard deviations squared, and we would normally assume that covariances would be zero.

Operability in Process Design Chapter 9. Troubleshooting
9-35
Figure 9.9 An example of redundant sensors that can be used to evaluate the correctness of measurements.
Qualitative analysis – The absolute value of the deviation between the flows in and out is 3.2 m3/h. The standard deviations for the flow sensors range from .5 to 1.5 m3/h. We might consider a simple case in which both output sensors were perfect. The 95% confidence interval of just the input sensor would include a range of 2*(1.5) m3/h, which is smaller than the deviation in the measurements. Based on this simple analysis, we could not conclude that the sensors are consistent or inconsistent. We should then move to a more rigorous analysis. Rigorous analysis – (The reader can skip this short discussion if the statistics is too complex.) Methods exist for evaluating empirical measurements that appear in equations that we believe to be rigorously correct, e.g., material and energy balances. These methods are termed “data reconciliation”. An example of the rigorous relationship is given in the flow splitting without density change in the following material balance.
In this simple case of three measurements and one equation, the test for consistency will be termed a “gross error” test. We seek a statistically based method for comparing the disagreement between the data and the model with the amount of disagreement that is likely due to the randomly occurring measurement error. Is |110.7-113.9| small compared to the likely measurement errors? By likely, we will take the 95% confidence interval. The null hypothesis is that the measurements are consistent with the material balance and is taken to be true if the following inequality is satisfied (Mah, 1990; Madron, 1992).
2 3 5∑ , ∝
F2 = F3 + F5
110.7 m3/h = 43.2 m
3/h + 70.7 m
3/h = 113.9 m
3/h
?
Operability in Process Design Chapter 9. Troubleshooting
9-36
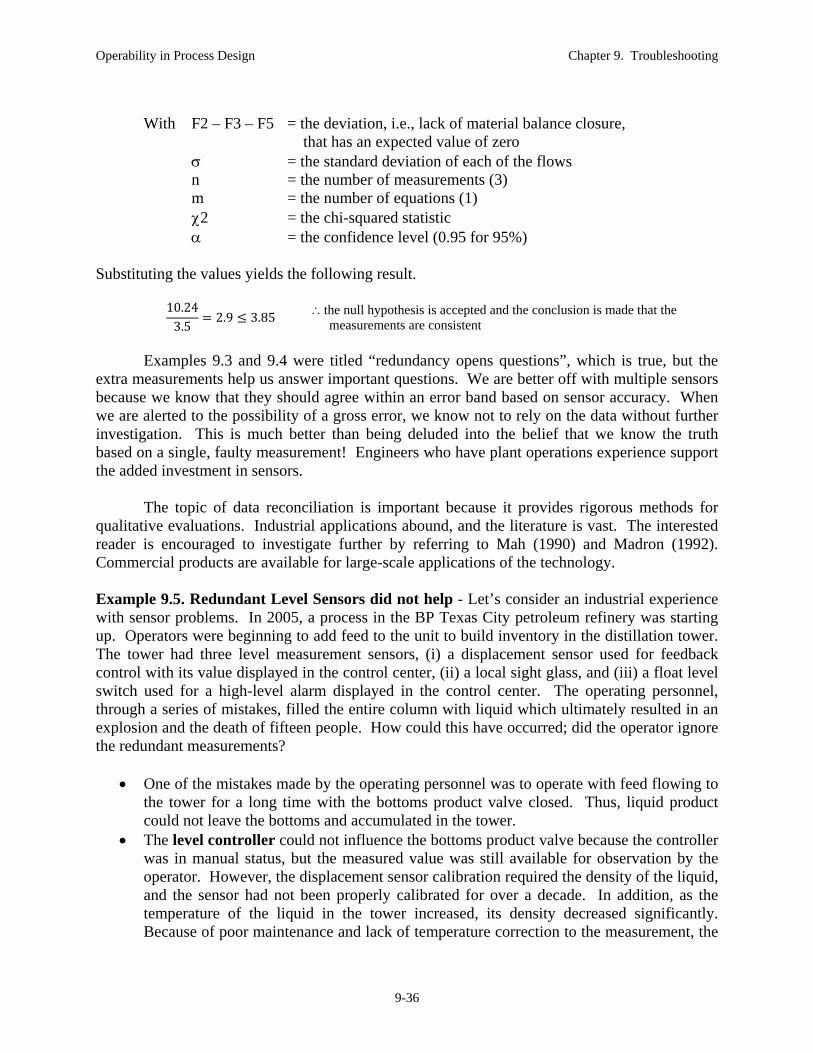
With F2 – F3 – F5 = the deviation, i.e., lack of material balance closure, that has an expected value of zero = the standard deviation of each of the flows n = the number of measurements (3) m = the number of equations (1) 2 = the chi-squared statistic = the confidence level (0.95 for 95%)
Substituting the values yields the following result.
10.243.5
2.9 3.85 the null hypothesis is accepted and the conclusion is made that the measurements are consistent
Examples 9.3 and 9.4 were titled “redundancy opens questions”, which is true, but the extra measurements help us answer important questions. We are better off with multiple sensors because we know that they should agree within an error band based on sensor accuracy. When we are alerted to the possibility of a gross error, we know not to rely on the data without further investigation. This is much better than being deluded into the belief that we know the truth based on a single, faulty measurement! Engineers who have plant operations experience support the added investment in sensors. The topic of data reconciliation is important because it provides rigorous methods for qualitative evaluations. Industrial applications abound, and the literature is vast. The interested reader is encouraged to investigate further by referring to Mah (1990) and Madron (1992). Commercial products are available for large-scale applications of the technology. Example 9.5. Redundant Level Sensors did not help - Let’s consider an industrial experience with sensor problems. In 2005, a process in the BP Texas City petroleum refinery was starting up. Operators were beginning to add feed to the unit to build inventory in the distillation tower. The tower had three level measurement sensors, (i) a displacement sensor used for feedback control with its value displayed in the control center, (ii) a local sight glass, and (iii) a float level switch used for a high-level alarm displayed in the control center. The operating personnel, through a series of mistakes, filled the entire column with liquid which ultimately resulted in an explosion and the death of fifteen people. How could this have occurred; did the operator ignore the redundant measurements?
One of the mistakes made by the operating personnel was to operate with feed flowing to the tower for a long time with the bottoms product valve closed. Thus, liquid product could not leave the bottoms and accumulated in the tower.
The level controller could not influence the bottoms product valve because the controller was in manual status, but the measured value was still available for observation by the operator. However, the displacement sensor calibration required the density of the liquid, and the sensor had not been properly calibrated for over a decade. In addition, as the temperature of the liquid in the tower increased, its density decreased significantly. Because of poor maintenance and lack of temperature correction to the measurement, the
Operability in Process Design Chapter 9. Troubleshooting
9-37
(faulty) measured value indicated a level within acceptable range in the bottom of the tower, while the tower was filling completely with liquid!
The local level sight glass could have provided redundancy. However, the interface level was not visible because the glass was dirty and had been so for years. Operating personnel could not use this sensor.
The level alarm relied on a float rising when the level was too high. The rising float would change the position of a switch that would activate an alarm. However, the float was stuck and would not rise. Therefore, the alarm never activated, giving the operator a false sense of security.
The triple-redundant sensor design with diversity in sensor principles was a good design. However, the maintenance of the equipment was inadequate, resulting in no reliable level measurement. There was human error in the scenario, but the level sensors were faulty and provided false, reassuring information that undoubtedly lead to confusion and slowed proper diagnosis. The result was a tragedy. A full description of this accident is available from the U.S. Chemical Safety Board (CSB, 2007). Example 9.6 Associated variables aid diagnosis: An operator is monitoring the behavior of ten distillation towers. One is a benzene-toluene-xylene tower with most benzene and toluene overhead and most xylene in the bottoms product. The tower had been functioning well with about 1% xylene in the overhead product. Then, the on-stream analyzer measuring the xylene concentration began to record a persistent increase in the overhead xylene concentration. It has reached nearly 4%. What should the operator do? The operator has long experience with distillation. She recognizes that the temperatures in on the trays are related to the compositions, because the material is at its bubble point at constant pressure. Often, a specific tray temperature has a high correlation with the product composition. From experience, the operator knows that tray 10 temperature (between the top tray and the feed) is strongly correlated with the xylene composition in the overhead. She observes that the tray temperature has been constant at about 27 C. She knows that the tray temperature should have increased 3-4 C for this change in xylene concentration reported by the analyzer. She is faced with inconsistent information. She immediately requests a calibration of the on-stream analyzer. In some designs, a calibration sample is located near the on-stream analyzer, and the operator can perform a calibration check by simply “pushing a button” to begin a sequence that stops the process material and introduces the sample material to the analyzer. This special, expensive equipment is installed because of the lower reliability of on-stream analyzers, when compared with conventional T, F, L and P sensors. Finally, was the operator just lucky that the sensitive tray temperature was measured? No! The design engineer anticipated the importance of measuring tray temperature(s) that provide good diagnosis. For an introduction to the concept of inferential variables, see Chapter 17 in Marlin (2000).

Operability in Process Design Chapter 9. Troubleshooting
9-38
Causality – In troubleshooting, we are able to observe “effects” or symptoms from previous “causes”, such as equipment faults, changes to materials being processed, errors by people, and so forth.
People have difficulty jumping from an observed “effect” to the true cause. Fortunately, this is not a problem, because we can follow the chain of causal relationships. Each individual relationship is much easier to determine. With the chain established, the troubleshooter can establish the possible causes and gather process information about each possible cause. Cause-effect relationships are often represented in diagrams, and many approaches exist for these diagrams. A few references are provided in Additional Learning Topics at the end of the chapter. The method used here graphically relates causes to effects, so the graph has a direction, and multiple causes can be related through either “AND” or “OR” operators. The output of an AND is true is all inputs are true. The output of an (inclusive) OR is true if any one of the inputs is true. Before seeing some examples, it is important to note that these diagrams are not typically prepared during plant troubleshooting. The diagrams are introduced here to clearly display the complex cause-effect relationships that the engineer must visualize to engage in troubleshooting. The reader might find it helpful to prepare cause-effect diagrams while working on problems as he/she masters the troubleshooting method. Let’s see how cause-effect diagrams work in an example. Example 9.7. Drowning in Distillate Let’s consider the distillation overhead process in Figure 9.10. Suppose that during normal operation, the operator observes that the measured level in the overhead reflux drum is too high, at nearly 75% of the sensor range. We need to determine what has caused this high level by troubleshooting the situation. We will do this in a stepwise manner and display the results in a cause-effect diagram. Remember that we are working backwards, so our thinking is from effect to cause; thus, we start with the high level.
Let’s start by thinking in general terms about what could cause a high sensor measurement signal. There are three categories, (i) a faulty sensor, (ii) too much liquid entering, or (iii) too little liquid leaving. (Naturally, more than one of these can occur simultaneously.) These possibilities establish the first steps backward to the possible causes in the cause-effect diagram in Figure 9.11.
We have applied reasonable process principles, but we have not gone far enough to determine the causes. So, let’s follow each branch backward one more step. For example, too little liquid leaving could be caused by (i) level controller in manual, (ii) very loose level controller tuning (very small gain), (iii) pump cavitation, (iv) pump loss of suction due to entrained vapor, (v) flow controller in manual, (vi) manual isolation valves around pump or control valve closed. Wow, there are many possible causes! Once we have completed this cause-effect diagram, we can begin to eliminate possibilities and isolate the cause.
Troubleshooting works “backward” from one or more effects to possible causes.
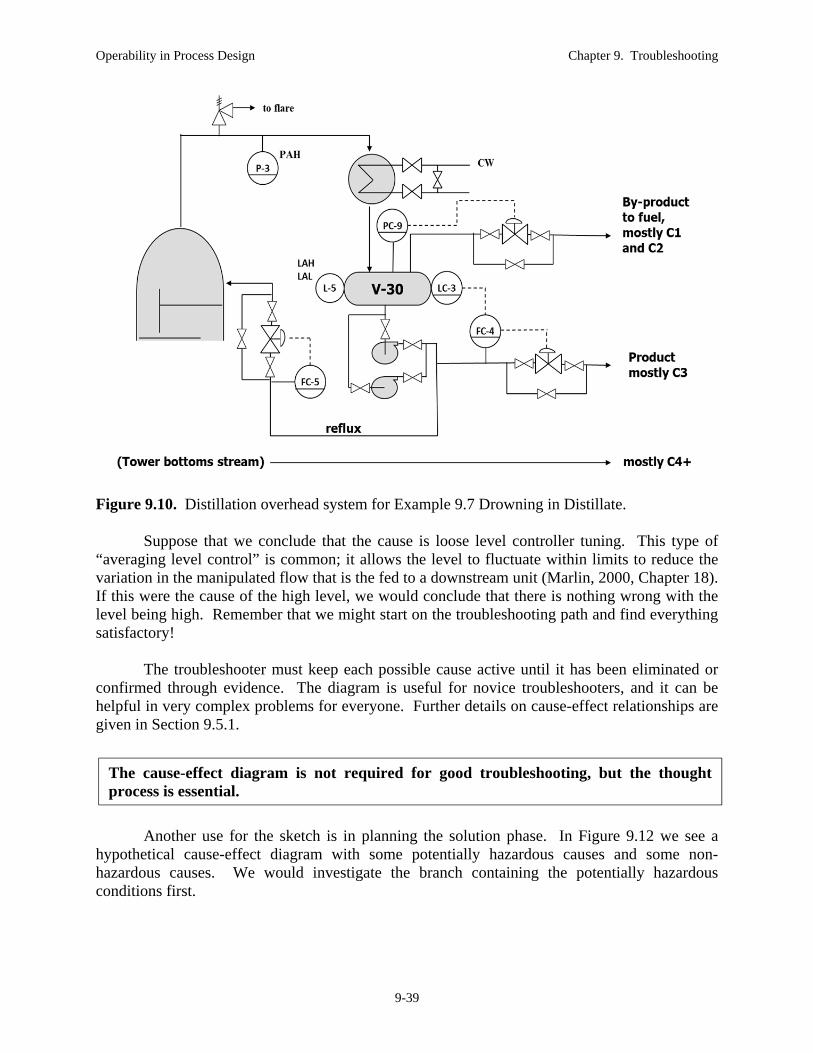
Operability in Process Design Chapter 9. Troubleshooting
9-39
Figure 9.10. Distillation overhead system for Example 9.7 Drowning in Distillate. Suppose that we conclude that the cause is loose level controller tuning. This type of “averaging level control” is common; it allows the level to fluctuate within limits to reduce the variation in the manipulated flow that is the fed to a downstream unit (Marlin, 2000, Chapter 18). If this were the cause of the high level, we would conclude that there is nothing wrong with the level being high. Remember that we might start on the troubleshooting path and find everything satisfactory! The troubleshooter must keep each possible cause active until it has been eliminated or confirmed through evidence. The diagram is useful for novice troubleshooters, and it can be helpful in very complex problems for everyone. Further details on cause-effect relationships are given in Section 9.5.1.
Another use for the sketch is in planning the solution phase. In Figure 9.12 we see a
hypothetical cause-effect diagram with some potentially hazardous causes and some non-hazardous causes. We would investigate the branch containing the potentially hazardous conditions first.
The cause-effect diagram is not required for good troubleshooting, but the thought process is essential.

Operability in Process Design Chapter 9. Troubleshooting
9-40
Figure 9.11. Cause-effect diagram for high reflux drum level in Exercise 9.7. The effect (symptom) is highlighted on the left, and the possible causes are highlighted in blue on the right.
Figure 9.12. Hypothetical cause-effect diagram showing where to begin solution to eliminate or verify potential hazardous causes.
Operability in Process Design Chapter 9. Troubleshooting
9-41
Distinguish opinion from verified information – When troubleshooting, you will encounter numerous opinions being expressed. A good opinion can direct the procedure towards a rapid solution. Therefore, you should always treat these with respect, but you should not accept an opinion as correct without verification. Relevant changes – Changes to process operations or equipment are required and occur continually. Usually, these changes introduce manageable disturbances to process operations. They also introduce the potential for errors and can be the cause of the perceived problem. Therefore, you should always understand recent changes, such as the following.
Changes to operating conditions, such as feed material from different storage facilities, production rate, reactor conversion, product quality, and so forth.
Major changes to operating conditions, such as switching between batches. Minor changes to equipment, such as calibration of instrumentation, testing alarms and
safety-instrumented systems (SIS), opening or closing manual valves and so forth. Major changes to equipment and operation, especially when the equipment is opened
during shutdown for modification or inspection, i.e., turnarounds. Time-sequence – Since causes occur before effects, the trend or time-sequence of events and data can provide useful clues in troubleshooting. However, we must recognize a time sequence does not prove causality. Many events occur before every problem, because many events are always occurring in complex plants. Historical data before and after the problem and a solid understanding of causality, i.e., cause-effect diagrams that link symptoms to causes, will assist you in distinguishing coincidences from potential causes of the problem. Trends also give information about the dynamic behavior of the process, which is important for diagnosing. The relationship among variables is especially important. For example, if flow is increasing into a product tank with no outflow but the rate of change in the level is essentially zero, an inconsistency exists and should be investigated.
The explore stage is where we are employing all of our knowledge and creativity. When troubleshooting, the engineer should always be asking,
“Is this information correct, is it incorrect and misleading me, or is it part of the problem?”
“Is the information consistent with fundamental principles?” “Have important changes been made to the system?” “Does the time sequence indicate potential causes?” “Do I really understand this process well enough to solve the problem?”
This healthy skepticism – that errors occur and must be identified - should not be confused with cynicism - that people and equipment are never to be trusted. In the vast majority of times, the information is correct, but in a crucial few times, information will be faulty.
Remember Silver Blaze, where the lack of an expected response raised suspicion and lead to a resolution of the mystery. Unexpected occurrences and unexpected lack of occurrences are equally important!
Operability in Process Design Chapter 9. Troubleshooting
9-42
Verifying correct information builds understanding of the situation, and uncovering faulty information is crucial in plant troubleshooting. Example 9.2d. The Drooping Temperature. Complete the Explore stage for this example. Visit the process – Naturally, we cannot do this in a text-based presentation. We will assume the all people in the troubleshooting team are familiar with the process equipment. Fundamentals – Some of the fundamentals we will keep in mind include (i) combustion chemistry, (2) heat transfer in the fired heater, (iii) fluid mechanics in the process piping and in the heater firebox and stack and in the packed bed reactor, and (iv) chemistry in the packed bed reactor. Check measurements – We will check a few that can be done rapidly. More time-consuming checks will follow in the Plan stage, if needed to evaluate a working hypothesis.
Temperature TC-30 – An additional measurement device, T40, is located in the same thermowell. We find that these two sensors agree within about 1 C. We also observe that the temperature at the outlet of the reactor, T47, increases; this increase is delayed by the dynamics of the packed bed. The T30 measurement has been validated. Flow FC-3 – The feed flow can be compared with the product flow rate, F10. These agree within 1.5%. More importantly, the trend plots agree, showing the same percentage increases at the same times. The F3 measurement has been validated. Feed and product tank levels, L100 and L200, respectively – We expect that L100 should be decreasing, and that the decreasing trend should be larger magnitude when the feed flow rate was increased. These trends in L100 are confirmed qualitatively. Similarly, L200 seems to be behaving as expected. The level sensors have been validated. Controller status – We determine that all feedback controllers are in the “automatic” status, and no controller has its output (signal to the valve) at an upper or lower bound.
Causality – We would like to determine the possible causes of the symptoms. Let’s consider one symptom, the increase in the fuel flow rate. A cause-effect diagram is given in Figure 9.13. Developing other cause effect diagrams is left to the reader as an exercise. Recall again that the diagrams are developed when helpful, but the understanding represented in the diagrams is essential for successful troubleshooting. Distinguish opinion from verified information – The problem description contained two opinions. The first opinion was an unusual smell around the feed pump. The second opinion

Operability in Process Design Chapter 9. Troubleshooting
9-43
Figure 9.13. Cause-effect diagram for the increasing fuel flow rate in Example 9.2 Drooping
Temperature. was a proposed cause for the “unusual trend data” as the stack damper. You will likely follow up on these in later stages. Relevant changes – As is typical, several changes have recently occurred. The feed tank was reported to have been switched, which would have changed the feed material being processed. Second, instrumentation technicians are calibrating instruments, although currently, you do not know which, if any, have been affected in this unit. Certainly, more information is needed about these changes, especially because they introduce the potential for human error. Time sequence – Causes occur before effects, so you will want to establish the dynamic behavior of measurements and actions by people. From the data that is currently available, we note that the temperature and fuel appeared to behave as expected during the first feed rate increase. In the first change, the temperature was controlled close to its set point, and the fuel flow was increased by TC-30. The problematic behavior appears to begin after the second feed rate increase. This suggests that the second feed rate change has initiated the problem. However, this is not conclusive evidence because another, yet undiscovered, event could have occurred near the same time and caused the problem.
Operability in Process Design Chapter 9. Troubleshooting
9-44
Check understanding – At the conclusion of the Explore stage, you should check to ensure that you understand the process sufficiently to troubleshoot the problem. Do you understand the unit operations and equipment, such as the pumps, heat exchangers and fired heater? Do you know the chemistry in the process, the combustion process and the reaction in the packed bed? Remember that troubleshooting is a team activity, and you can ask for assistance from your colleagues. Reconsider previous stages - As you reach the completion of the Explore stage, you consider the previous stages. You might feel comfortable with the Engage, but you should definitely return to the Define stage. You have acquired considerable new knowledge. Can you improve the definition? In addition, you reconsider the issue of time-critical issues; since you have recognized no new imminent hazard, you continue on to the Plan step. 9.3.6 Plan: Stage 4 in the Problem Solving Method In the Plan stage, you will generate possible causes for the problem and gather any additional information necessary to enable you to decide on the actual cause. There are three basic tasks in this stage, (i) brainstorm possible causes, which we will refer to as working hypotheses, (ii) compare the hypotheses with initial evidence to eliminate some hypotheses, and (iii) devise and execute additional diagnostic actions that eliminate all but one of the remaining working hypotheses. Figure 9.14 provides a pictorial summary of the analysis that is performed in the Plan stage; more detailed tables will be presented to facilitate documentation. Brainstorming - The initial task is to develop a comprehensive list of potential causes for the problem. Often, organizations use a version of “brainstorming” for this task. There is a multitude of approaches to brainstorming and complete coverage could involve an entire chapter. Here, some guidelines for brainstorming are based on materials from Fogler and LeBlanc (1995), Woods (1994), and Mindtools (2012). When brainstorming, the participants propose potential causes based on the Define and Explore stages of the troubleshooting method. The strength of brainstorming is in generating creative possibilities that will be subsequently evaluated. Some guidelines for brainstorming are given in Table 9.4. Note the final brainstorming activity is to clarify and critically evaluate the initial ideas to yield a candidate list of working hypotheses. Initial evidence - After a comprehensive list of working hypotheses have be developed through brainstorming, the next task is to compare these with initial evidence. The goal is to eliminate hypotheses that are inconsistent with the initial evidence. Naturally, we must be aware of

Operability in Process Design Chapter 9. Troubleshooting
9-45
Figure 9.14. Hypothesis Table for the Troubleshooting Plan stage potential faults in the initial evidence, which is why we have made an effort to verify information during the Explore stage. In Figure 9.14, each of the initial information items is given a lower-case letter, and a table is completed documenting each information element. In the column for each initial information element (evidence), an entry is made to document whether the troubleshooting team deems the information to Support, Disprove, or be Neutral for the relevant evidence. Working hypotheses that are disproved by one (or more) initial evidence will not be considered further. Working hypotheses that have all “Support” or “Neutral” entries will be considered active for the next task. Diagnostic actions for additional evidence - Now, a reduced list contains working hypotheses that are under active consideration. We will seek new information through diagnostic actions that can disprove all hypotheses, with the one hypothesis that is not disproved considered the true cause of the problem. We rely heavily on the understanding built in the Explore stage using cause-effect analysis when devising diagnostic actions. The order in which these actions are performed should be determined using the guidelines in Table 9.5.
The guidelines in Table 9.5 might be in conflict for a specific troubleshooting problem. Naturally, the order of execution for the guidelines must be adapted for the priorities of the problem. In addition, there can be cases where an action might require considerable time, but be important; for example, a laboratory analysis might provide excellent information but require hours until the result is available. In such a case, we can begin the analysis procedure and then, proceed with other actions until the laboratory result is available. Perhaps, we will have solved

Operability in Process Design Chapter 9. Troubleshooting
9-46
Table 9.4. Guidelines for successful Brainstorming
Prior to idea generation
All team members should have some training in brainstorming Enlist team members with a broad range of relevant expertise (operations, process
technology, equipment operation, instrumentation and control, etc.) Enlist team members who are highly motivated to solve the problem If time permits, allow members to individually consider the problem and develop ideas
During idea generation
Brainstorming will be enhanced by a competent chairperson/facilitator Ideas are shared with group and recorded for all to see (using flipchart, whiteboard, etc.) Ideas are not criticized during idea generation; evaluation begins after generation Ideas should be concise, without undue details and analysis, which will come later Build on the ideas of others Avoid “tunnel vision”; propose ideas different from those already presented Overcome knowledge shortfalls; seek resources with potential faults for the process
system being considered Ensure that everyone participates; perhaps, have a “round robin” in which everyone
suggests one idea Feel free to propose ideas that conform to most, but not all, initial information. Some of
the initial information might later be found to be faulty Propose ideas that are unlikely, but ones that are not impossible. The probability of a
pipe leak is quite low, but it is possible. The likelihood that aliens have invaded the process and eaten the catalyst is zero. (Why would they find catalyst appetizing?)
Challenge conventional wisdom. Consider the potential for multiple faults having occurred simultaneously in the process
Post idea generation
Discuss each proposed working hypothesis, clarify and critique as needed Where appropriate, combine proposals Where appropriate, eliminate proposals Allow new proposals to be added
the problem before the analysis is available, in which case the added cost will be a loss. However, we will have the information as soon as possible, if needed, and even if it is not absolutely essential, it will likely serve to confirm an earlier conclusion. It is emphasized that the engineer should be familiar with the physical equipment, not just the drawings and simulations. As stated in one article (Laird, et al, 2002),
“The solution to a process problem isn’t found by sitting behind your desk, but by going into the plant and carrying out tests and evaluating data.”
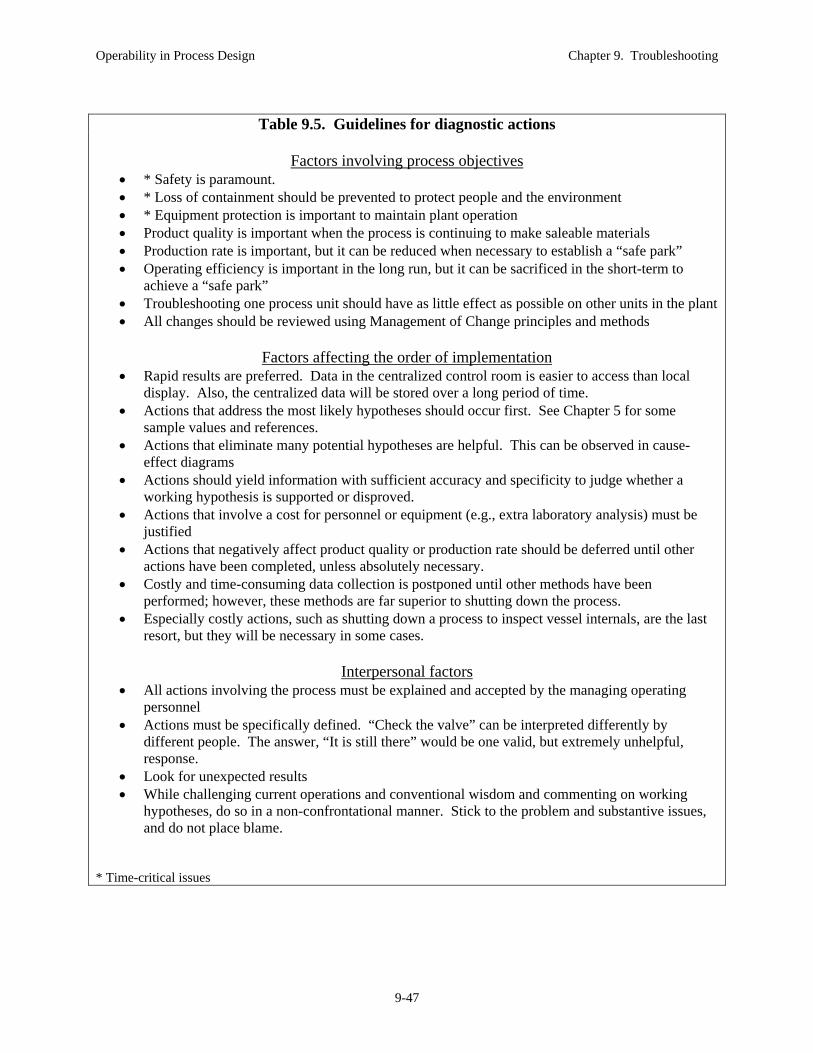
Operability in Process Design Chapter 9. Troubleshooting
9-47
Table 9.5. Guidelines for diagnostic actions
Factors involving process objectives
* Safety is paramount. * Loss of containment should be prevented to protect people and the environment * Equipment protection is important to maintain plant operation Product quality is important when the process is continuing to make saleable materials Production rate is important, but it can be reduced when necessary to establish a “safe park” Operating efficiency is important in the long run, but it can be sacrificed in the short-term to
achieve a “safe park” Troubleshooting one process unit should have as little effect as possible on other units in the plant All changes should be reviewed using Management of Change principles and methods
Factors affecting the order of implementation
Rapid results are preferred. Data in the centralized control room is easier to access than local display. Also, the centralized data will be stored over a long period of time.
Actions that address the most likely hypotheses should occur first. See Chapter 5 for some sample values and references.
Actions that eliminate many potential hypotheses are helpful. This can be observed in cause-effect diagrams
Actions should yield information with sufficient accuracy and specificity to judge whether a working hypothesis is supported or disproved.
Actions that involve a cost for personnel or equipment (e.g., extra laboratory analysis) must be justified
Actions that negatively affect product quality or production rate should be deferred until other actions have been completed, unless absolutely necessary.
Costly and time-consuming data collection is postponed until other methods have been performed; however, these methods are far superior to shutting down the process.
Especially costly actions, such as shutting down a process to inspect vessel internals, are the last resort, but they will be necessary in some cases.
Interpersonal factors
All actions involving the process must be explained and accepted by the managing operating personnel
Actions must be specifically defined. “Check the valve” can be interpreted differently by different people. The answer, “It is still there” would be one valid, but extremely unhelpful, response.
Look for unexpected results While challenging current operations and conventional wisdom and commenting on working
hypotheses, do so in a non-confrontational manner. Stick to the problem and substantive issues, and do not place blame.
* Time-critical issues

Operability in Process Design Chapter 9. Troubleshooting
9-48
Table 9.6 Summary of possible diagnostic actions.
Ask many questions of the plant operator, and listen carefully to the responses Gather information from new measurements not originally available (local sensors, laboratory
data, etc.) Determine the measurement accuracy for all data used Check the calibration or recalibrate/replace a sensor Observe the equipment (manual valve position, machine vibration, control valve stem position,
pump cavitation, etc.) Retrieve historical data from databases in the control system, laboratory system, inventory
management system, etc. Search for unreported changes (process materials, spare equipment in use, new operating
conditions, maintenance actions, integrated units, etc.) Compare the actual process equipment with drawings and documentation being used When a recent change in operating condition is suspected, a reasonable action is to reverse the
change to the conditions before the problem appeared Perform experiments to ascertain the process response (e.g., does the control valve stick, does the
problem disappear/get worse, does a measurement respond as expected, etc.) “Experience factors” and “Rules of Thumb” have likely been employed in the Explore stage. If
not, use them when designing diagnostic actions Simulations of process operation can be useful
- for estimating variables not directly measureable - for designing experiments, giving predictions of effects of the experiments - for comparing predictions with measurements; is the equipment working as expected? - for determining the effects of proposed faults
Troubleshooting guidelines and checklists for specific unit operations should be consulted, if available
Contact experts on the process (in company, vendors of equipment, consultants) Perform extraordinary experiments that are very costly and time-consuming (gamma scan for
internals in vessels, flow tracer for leak detection or mal-distribution, etc.) As a last resort, shutdown the process and inspect the equipment , usually after opening, purging,
and isolating in preparation for entry by personnel
Some additional guidance for diagnostic actions Actions must not involve hazardous conditions with risks higher than company standards used for
normal operation. A quick safety analysis might be required. Unexpected results should not be ignored. If necessary, repeat the action to determine if the
result is repeatable. Many variables and parameters cannot be measured, e.g., the heat transfer coefficient or the
reaction rate cannot be measured directly, although they can be estimated Troubleshooters should visit the equipment, look for unusual behavior, listen for unexpected sounds, feel pipes for temperature (with care), and otherwise inspect the equipment thoroughly. This investigation can uncover pump cavitation (through sound), an open by-pass (pipe temperature), a valve stem that is not moving (visual observation), and a myriad of other problems not easily observed through the limited numbers of sensors. A summary of some diagnostic actions is given in Table 9.6.

Operability in Process Design Chapter 9. Troubleshooting
9-49
Diagnostic actions can include small experiments on the operating plant. In general, we avoid experiments in process plants because they disturb the consistent product quality and production rate. However, carefully designed and executed experiments can be performed and are essential for some troubleshooting cases. Naturally, the experiments should introduce small magnitude changes in key operating variables for a short duration, but these guidelines have to be tempered by the need to convincingly evaluate one or more working hypotheses. In addition, comparison of past with current process operation can be very useful in troubleshooting. In some cases, one or two variables will deviate from good past operation, and these deviations will provide evidence for isolating the cause. In more challenging situations, the distinction between good and faulty operation is not easily apparent from visually observing the data; in such cases, multivariate statistical methods exist to distinguish small but meaningful changes in many correlated variables (e.g., Kresta, 1991). The actions continue until one hypothesis remains that explains all of the observations, calculations and data from prior operation. Based on this conclusion, the engineer devises a plan to re-establish safe and profitable process operation, as shown schematically in Figure 9.4. The first step is to consider time-critical issues. If one has been uncovered, even at this late time in the troubleshooting process, the plant should be shut down, placed in “safepark” or otherwise operated to eliminate the time-critical factor. After time-critical issues (if any exist) have been addressed, the process should be brought to an intermediate state. We recognize that the intermediate state might represent a full recovery from the problem, or it might represent a partial recovery. In the case of a partial recovery, a longer-term plan is required to repair or modify the equipment to achieve a full recovery at some later time. Again, we conclude by considering the previous stages of the troubleshooting method. In particular, we review the Define stage and ask, “With our improved understanding of the situation, is the definition correct and complete, and does our conclusion satisfy the problem definition?” We could review the Explore stage, but usually, the exploration continues tacitly and improves during the Plan stage. Now, let’s perform the Plan stage on our example. Example 9.2e. The Drooping Temperature. Complete the Plan stage for this example.
You would start by generating working hypotheses using a brainstorming method in conjunction with the shift operator, shift supervisor, and people with other expertise, such as fired heater and instrumentation and control. The result of this brainstorming activity is summarized in Table 9.7. Some comments are provided to give insight into why some of the hypotheses would be appropriate and to indicate where one hypothesis spawned another hypothesis. After idea generation, a discussion of the hypotheses would be appropriate to ensure everyone understands each candidate. Candidates can be deleted, modified and combined as needed, and new ideas can be added. You will continue with these candidate hypotheses, but the team will always be willing to add new hypotheses as they spring into someone’s mind.
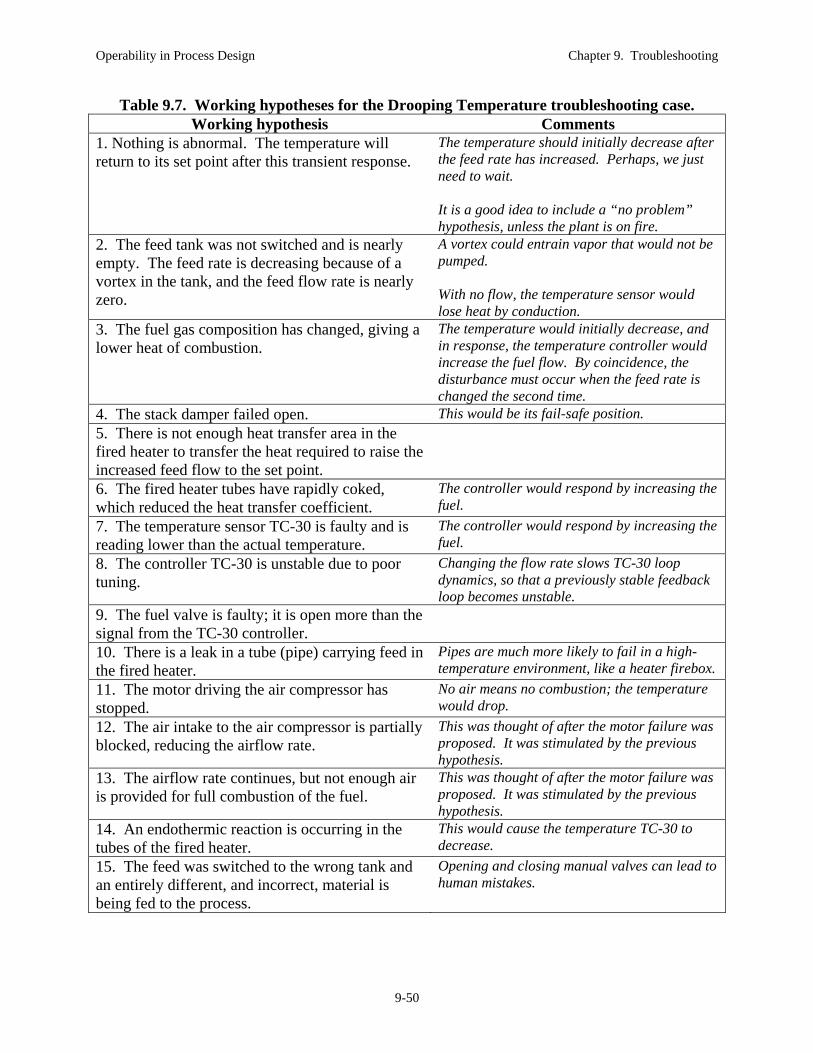
Operability in Process Design Chapter 9. Troubleshooting
9-50
Table 9.7. Working hypotheses for the Drooping Temperature troubleshooting case. Working hypothesis Comments
1. Nothing is abnormal. The temperature will return to its set point after this transient response.
The temperature should initially decrease after the feed rate has increased. Perhaps, we just need to wait. It is a good idea to include a “no problem” hypothesis, unless the plant is on fire.
2. The feed tank was not switched and is nearly empty. The feed rate is decreasing because of a vortex in the tank, and the feed flow rate is nearly zero.
A vortex could entrain vapor that would not be pumped. With no flow, the temperature sensor would lose heat by conduction.
3. The fuel gas composition has changed, giving a lower heat of combustion.
The temperature would initially decrease, and in response, the temperature controller would increase the fuel flow. By coincidence, the disturbance must occur when the feed rate is changed the second time.
4. The stack damper failed open. This would be its fail-safe position. 5. There is not enough heat transfer area in the fired heater to transfer the heat required to raise the increased feed flow to the set point.
6. The fired heater tubes have rapidly coked, which reduced the heat transfer coefficient.
The controller would respond by increasing the fuel.
7. The temperature sensor TC-30 is faulty and is reading lower than the actual temperature.
The controller would respond by increasing the fuel.
8. The controller TC-30 is unstable due to poor tuning.
Changing the flow rate slows TC-30 loop dynamics, so that a previously stable feedback loop becomes unstable.
9. The fuel valve is faulty; it is open more than the signal from the TC-30 controller.
10. There is a leak in a tube (pipe) carrying feed in the fired heater.
Pipes are much more likely to fail in a high-temperature environment, like a heater firebox.
11. The motor driving the air compressor has stopped.
No air means no combustion; the temperature would drop.
12. The air intake to the air compressor is partially blocked, reducing the airflow rate.
This was thought of after the motor failure was proposed. It was stimulated by the previous hypothesis.
13. The airflow rate continues, but not enough air is provided for full combustion of the fuel.
This was thought of after the motor failure was proposed. It was stimulated by the previous hypothesis.
14. An endothermic reaction is occurring in the tubes of the fired heater.
This would cause the temperature TC-30 to decrease.
15. The feed was switched to the wrong tank and an entirely different, and incorrect, material is being fed to the process.
Opening and closing manual valves can lead to human mistakes.

Operability in Process Design Chapter 9. Troubleshooting
9-51
Next, you would list all of the initial evidence, including information uncovered in the Explore stage. The list and the support/neutral/disprove evaluation are presented in Table 9.8. As shown in the table, four working hypotheses have been eliminated using the initial evidence, numbers 2, 7, 9, and 15. Perhaps, you might conclude that these were poor brainstorming choices, since they violate evidence already known. However, reasonable proposals spawn new and valuable proposals, so we should not restrict our generation of working hypotheses. Finally, we recognize that some of the initial evidence could be proved faulty in future actions. Therefore, we will retain the list and might reconsider the deletions of active hypotheses later in the Plan stage. Many of the remaining candidates are supported by some of the initial evidence, and a few are neither supported nor disproved. Therefore, we must take diagnostic actions. The team will first develop a set of possible actions; then, it will decide the order of execution. The understanding built during cause-effect analysis is essential for designing the diagnostic actions. The team develops the diagnostic actions in Table 9.9, which associates each action with one or more working hypotheses; all active working hypotheses are addressed by at least one action. In addition, the table contains a rough estimate of the time to perform the action, likelihood of hypotheses whose likelihood is affected by the action, cost and risk for each action. The additional information is used to decide the order of execution of the actions, which is given in the right-hand column. We note that the table contains the actions in the order in which they are proposed, which will likely not be the order of execution. We develop the action list first and decide on the order later. The order of execution is selected to get to a resolution quickly by performing actions with low time, low cost, high likelihood hypotheses, and low risk. Naturally, some tradeoffs must be made. The order used in this example is given in Table 9.9. We have noticed that the actions can be arranged into five groups based on the selection criteria. Therefore, the order is defined for each of the groups, with the order within a group inconsequential. Next, the results of the actions are presented. 0. What you decide not to do You decide not to implement action C, “Do nothing and observe”. The process has deviated significantly from normal operation already. The fired heater is potentially hazardous if operated improperly because of the combustion occurring. In addition, the equipment is operating near material limitations, near the maximum temperature for tubes and structural supports, so deviations could lead to costly damage.
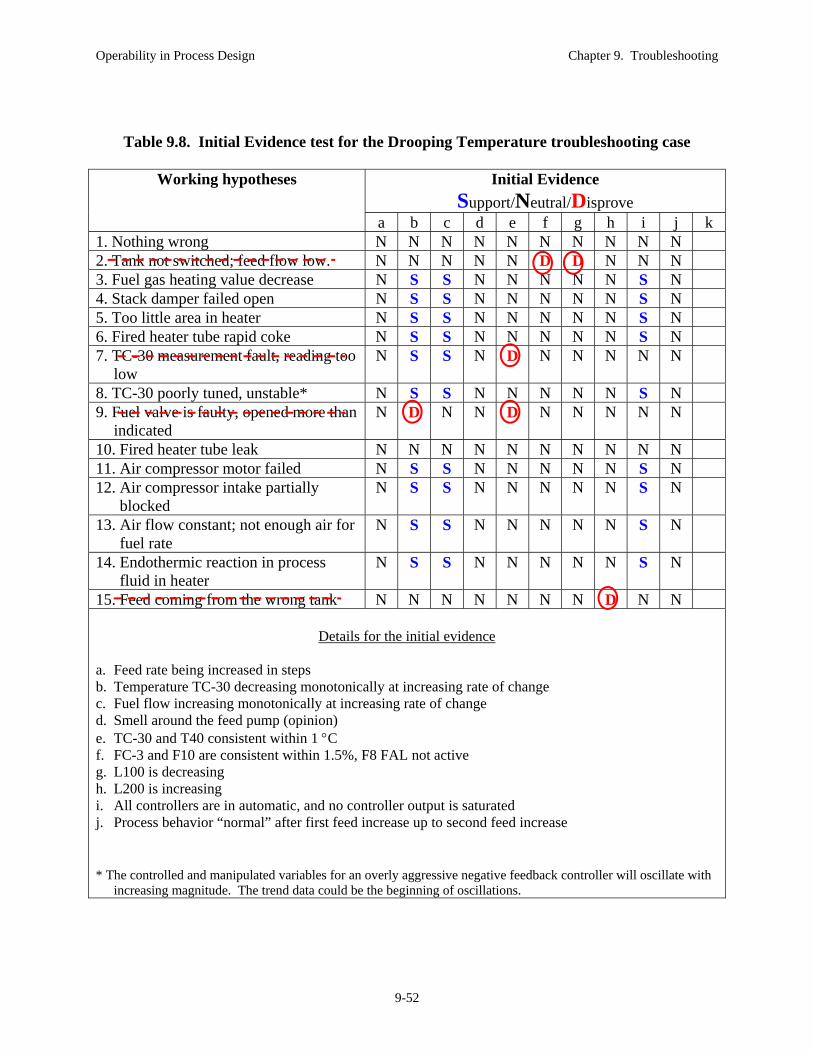
Operability in Process Design Chapter 9. Troubleshooting
9-52
Table 9.8. Initial Evidence test for the Drooping Temperature troubleshooting case
Working hypotheses Initial Evidence
Support/Neutral/Disprove a b c d e f g h i j k
1. Nothing wrong N N N N N N N N N N 2. Tank not switched; feed flow low. N N N N N D D N N N 3. Fuel gas heating value decrease N S S N N N N N S N 4. Stack damper failed open N S S N N N N N S N 5. Too little area in heater N S S N N N N N S N 6. Fired heater tube rapid coke N S S N N N N N S N 7. TC-30 measurement fault, reading too
low N S S N D N N N N N
8. TC-30 poorly tuned, unstable* N S S N N N N N S N 9. Fuel valve is faulty, opened more than
indicated N D N N D N N N N N
10. Fired heater tube leak N N N N N N N N N N 11. Air compressor motor failed N S S N N N N N S N 12. Air compressor intake partially
blocked N S S N N N N N S N
13. Air flow constant; not enough air for fuel rate
N S S N N N N N S N
14. Endothermic reaction in process fluid in heater
N S S N N N N N S N
15. Feed coming from the wrong tank N N N N N N N D N N
Details for the initial evidence a. Feed rate being increased in steps b. Temperature TC-30 decreasing monotonically at increasing rate of change c. Fuel flow increasing monotonically at increasing rate of change d. Smell around the feed pump (opinion) e. TC-30 and T40 consistent within 1 C f. FC-3 and F10 are consistent within 1.5%, F8 FAL not active g. L100 is decreasing h. L200 is increasing i. All controllers are in automatic, and no controller output is saturated j. Process behavior “normal” after first feed increase up to second feed increase * The controlled and manipulated variables for an overly aggressive negative feedback controller will oscillate with
increasing magnitude. The trend data could be the beginning of oscillations.

Operability in Process Design Chapter 9. Troubleshooting
9-53
Table 9.9. Diagnostic actions for the Drooping Temperature example
Diagnostic Action
Wor
kin
g h
ypot
hes
es
affe
cted
T
ime
(min
)
Lik
elih
ood
of
hyp
oth
eses
(H
/M/L
)
Cos
t (
H/M
/L/N
one)
Ris
k o
f ac
tion
(H
/M/L
/Non
e)
Ord
er o
f ex
ecu
tion
A. Observe the status of the fired heater SIS (safety instrumented system that automates emergency shutdown) (1)
11 0.5 H N N 1a
B. Observe the status of all plant alarms (1) many 5-20 H N N 1b C. Wait and watch if temperature returns to its set point
1, 3 20-30 M N M-H (2)
Not done
D. Observe the air flow rate measurement and trend 11, 12, 13 1 H N N 1c E. Observe the air pressure to the burner 11, 12, 13 1 H N N 1d F. Place TC30 in manual and control the temperature manually by adjusting the controller output
1, 8, 13 5-20 H N N 2a
G. Take stack gas and analyze for oxygen and carbon monoxide (to evaluate combustion products)
10, 11, 12, 13
60-360 H L L (3) 2b
H. Observe fire box visually for leaks of process fluid and observe the flue gas from stack for smoke
10 5 L N L (3) 3a
I. Contact utility plant operator regarding fuel gas composition, what is it and has it changed recently?
3 10-360 M L N 2c
J. Observe fire box pressure, P3 4 0.5 LL (4) N L (3) 3b K. Observe the stack damper position indicator (requires binoculars)
4 20 LL (4) N L (3) 3c
L. Retrieve historical operating data for process. Has the process operated successfully at this high feed rate in the past?
5, 8, 13 30-180 (5)
L L N 4
M. Observe pressures at inlet and outlet of the fired heater (high pressure drop suggests coking)
6 20 LL N L (3) 3d
N. Measure tube (pipe) temperatures using optical pyrometer, high temperatures suggest coking
6 20 LL N L (3) 3e
O. Contact process chemist. Determine if the process fluid can react in the fired heater pipes.
14 days L N N 5
Comments: (1) Should have been done in Explore stage. Alarms would take a few minutes to analyze. (2) Allows the problem to continue, which might involve risk (3) Low risk is associated with having local operator approach the process during troubleshooting (4) Not clear how this cause could generate the observed symptoms (5) Time required to search through the data
Operability in Process Design Chapter 9. Troubleshooting
9-54
1. Initial set of quick actions This first group of actions quickly access information that is easily available in the control room. 1.a. You observe the status of the fired heater SIS, which is not shown in Figure 9.6. This would shut down the fired heater if any of the following occurred, (i) feed flow below minimum, (ii) low fuel pressure, (iii) low air pressure after the compressor, and/or (iv) loss of flame. The SIS would stop the fuel flow, maximize the air flow, open the stack damper fully, and activate an alarm.
We observe that the SIS has not activated. This indicates that the flame remains and disproves hypothesis 11.
1.b. You observe all active alarms in the process.
We see that the low-level alarm L110 is active. However, the feed is currently coming from T100, so the low level in T110 is not a concern. (We expect a delivery will fill the tank before the feed tanks will be switched.) The low lubricating oil pressure alarm for feed pump P-100 is active. However, we also note that this parallel pump is not being used; pump P-101 is in operation. We note that these “standing alarms” that do not indicate problems are a distraction to the operator. This is a general problem in process plants with spare equipment.
1.c. You observe that airflow measurement and trend.
You note that the airflow rate has been essentially constant for a long time, certainly from before the first feed flow rate change. This disproves hypotheses 11 and 12.
1.d. You observe the air pressure after the compressor.
You observe that the pressure is normal, high enough to supply the needed air for combustion. This confirms your conclusions in 1.c above.
2. Take action intended to stop the rapid change in heater conditions 2.a. The operator places TC30 in manual. (Engineers should not “take over” operation of a process unless qualified and given permission by the operator.)

Operability in Process Design Chapter 9. Troubleshooting
9-55
Figure 9.15. Trend plot after TC-30 was placed in manual for diagnostic action F The behavior of key variables immediately after placing TC30 on manual is shown in Figure 9.15. We note that the “accelerating deviations” have stopped but that the deviation from normal operation remains. This likely disproves the fuel gas composition change in hypothesis 3. However, the fuel gas heating value could have stabilized at roughly the same time. Initiate actions to have others collect information 3.a. You initiate the evaluation of the flue gas properties, oxygen and carbon monoxide. You recognize that the results from this action will take time, but they are worth initiating now. You continue with additional actions without waiting for the results from the flue gas analysis. 3.b. You contact the utility plant operator by telephone to determine if the fuel gas composition has changed.
He observes the on-stream heating value analyzed and reports, “The heating value of the fuel gas has not changed by more than 3% from its average for over four hours.” This time period covers the time of both feed rate changes in your process. This information disproves hypothesis 3.
3.d to 3.g You arrange for a local operator to perform the evaluations in these actions. You are careful to ensure that the actions are clearly explained to and understood by the local operator and the shift supervisor. The shift supervisor is designated to communicate with the local operator as he radios back information. While these actions are in progress, you proceed to group 4 actions.

Operability in Process Design Chapter 9. Troubleshooting
9-56
4. Plant experiments to build understanding 4. The next step is to return to action F, which involves the operator controlling the temperature T-30 manually by adjusting the fuel valve opening, which is influenced by the TC-30 controller output.
The control room operator changes the controller output to increase the valve opening. He waits a couple of minutes and is surprised to observe the temperature decrease. This is puzzling; more fuel should increase the temperature. The operator returns the valve to its original position, and the temperature increases. The responses are shown in Figure 9.16. These two experiments are consistent, but they confuse the troubleshooting team. While you are discussing the situation, the outside operator calls in with an analysis of the fired heater flue gas, based on diagnostic action G. The result is available relatively rapidly because the plant has a hand-held analyzer that can be used for spot analysis is any boiler or fired heater (Cleanboiler, 2012; TSI 2012). She states that there is essentially zero percent oxygen and a very high concentration of carbon monoxide, higher than the 5000-ppm maximum scale of the analyzer.
Figure 9.16. Diagnostic action F experiments involving changing the fuel valve opening
All of a sudden, the light bulb goes on! The results from action G support the working hypothesis 13 (as well as 11 and 12, which have already been disproved). The flow of air to the burner is too low for the fuel rate. Insufficient air exists for complete combustion to water vapor and carbon dioxide. Therefore, all oxygen is consumed, and the hydrocarbon fuel is partially combusted, resulting in a large concentration of carbon monoxide in the flue gas.

Operability in Process Design Chapter 9. Troubleshooting
9-57
You finally recognize this time-critical issue. You decide that the situation is serious, because the danger of explosion exists. You stop the Plan stage immediately and proceed to implementing a solution. 9.3.7 Do It: Stage 5 of the Problem Solving Method Engineers manage solutions on an operating plant, much the way surgeons make corrections on a living human body. The actions have to be well designed and carefully executed. It is no good to solve the problem but kill the patient, or in the industrial example, damage the plant! The following steps are important for the Do It stage. Select a Solution – Solution for time-critical issues should have been designed and practiced during training. Recall that the solution might have to be implemented within minutes, so that extensive analysis is not possible. In non-time-critical situations, a typical decision analysis might be possible. This involves brainstorming alternative solutions, evaluating the candidates against a number of criteria for success, and selecting the best to implement. This topic for non-time-critical scenarios is addressed more thoroughly in Section 9.5.4. Communicate and document – The plan must be clearly communicated to everyone involved and documented as much as possible within time limitations for safety review. Compare with diagnosis and continue to troubleshoot – As the solution is implemented, new data will be generated in response to changes. This data can be compared with predicted behavior based on the diagnosis. If the new data confirms the diagnosis, all is well, and you can continue. If the data contradicts the initial diagnosis, you will have to return to the Plan stage and iterate on the hypothesis generation and evaluation, beginning with the new data. Immediate Training – New information has been learned about the process and how to diagnose an important fault. In addition, new operating policies and perhaps, equipment have been instituted. Therefore, every operator needs to be trained before starting his/her shift. This must not be left to “word of mouth”; it must be a formal procedure with signoff after training. Let’s implement the solution for the Drooping Temperature example. Example 9.2f. The Drooping Temperature Complete the Do It stage for this example. The process condition is hazardous! The heater fire box contains partially combusted fuel at a high temperature. The goal is to return to a safe condition. Manually activating the SIS would be a safe action. However, it has costly consequences. First, the process must be shut down; second, the rapid shut heater shut down would thermally shock the equipment and lead to a shorter life before replacement. Therefore, you decide to place the equipment in a “safe park” condition. The safe park condition should eliminate the hazard and place the process in a condition from which normal operation can be achieved.
Operability in Process Design Chapter 9. Troubleshooting
9-58
The basic error is in the ratio of air to fuel. The correct, higher ratio can be achieved by either increasing the air or decreasing the fuel. The shift supervisor recalls some training in fired heater operation and explains the situation to you. If air is increased, extra air will be introduced into an environment at high temperature with excess combustible gases, mostly carbon monoxide but perhaps methane as well. The danger of an explosion exists when increasing the air first.
You station the outside operator at the heater with the hand-held flue gas analyzer. He will monitor the flue gas composition while the fuel flow rate is reduced, with constant airflow rate. As the fuel is decreased, we observe that the carbon monoxide decreases from top of scale, ultimately reaching a value of 50-100 ppm where excess oxygen is present. The oxygen increases from essentially 0 to over 3 mole percent. In the fuel rich region, the temperature increases because cold fuel is being removed from the flame. In the air rich region, further decreases of fuel results in a decrease in temperature, as is expected for a properly operating fired heater. By the end of the action, the fired heater is in a “safe park”, a safe condition with a temperature lower than required to achieve the desired reaction rate in the packed bed. Have you completed the Do It stage? Absolutely not! First, you look back to the Define stage to ensure that the problem has been addressed.
You conclude that you have done a good job of diagnosis and safe parking the process at a temperature lower than desired. However, the plant is not achieving its production and product quality targets. Now that the excess air condition has been established, the temperature can be increased – but the air/fuel must be maintained to ensure excess air in the future. The temperature controller TC-30 can be placed in “automatic” status. Since the air/fuel ratio is not automated, the control room operator must frequently adjust the airflow to the burner to achieve desired operation. Now, the intermediate state has been successfully achieved.
Second, you look at all symptoms from all stages of the troubleshooting task. Does the hypothesis explain all of the symptoms?
You consider the time sequence from the beginning of the feed increase. The initial condition involved the heater with excess oxygen. The airflow
rate remains constant for the entire time; thus, the air/fuel ratio decreases. The feed is increased for the first time. The temperature T-30 decreased
slightly, and the controller TC-30 increased the fuel valve opening to return the temperature to its set point value. From the response, you conclude that sufficient air was available for complete combustion of the fuel; therefore, the temperature remained at its set point.
Therefore, the better (and only acceptable) corrective action is to decrease the fuel. The generation of combustibles will be reduced and then eliminated. After a short time, all combustible materials will be purged from the heater, and safe operation will be restored.

Operability in Process Design Chapter 9. Troubleshooting
9-59
The feed flow was increased for the second time. Again, TC-30 increased the fuel flow. During this second transient response, the combustion changes from excess air to insufficient air. The controller increases the flow rate of cold fuel, which cools the flame and reduces the temperature T-30. This trend of increasing fuel and decreasing temperature continues.
This is a serious deviation in the process. Normally, an increase in fuel causes an increase in the temperature T-30. In the fault condition with insufficient air, an increase in fuel causes a decrease in temperature. The process has changed, but the controller TC-30 has not. The control system becomes unstable and drives the temperature away from the set point. The two situations are summarized in Figure 9.17. When the controller TC-30 is placed in manual, the positive feedback stops, and the fuel flow changes stop. The temperature achieves a constant value.
Third, you review all of the working hypotheses. Are any of them still active?
It would be wise to have the outside operator complete the evaluation of the equipment and report the information back to the troubleshooting team. In this case, the local information indicates no further problems.
Fourth, you review the results of the corrective action. Did the process response confirm the proposed cause of the problem?
You conclude that the corrective action, reducing the fuel flow rate, confirmed the hypotheses that the combustion had been supplied insufficient air.
Excess air condition Process gain: T30/F1 > 0 TC-30 controller gain > 0 *
Negative feedback, stable with feedback control and proper
PID tuning OK!
Insufficient air condition Process gain: T30/F1 < 0 TC-30 controller gain > 0 *
Positive feedback, unstable with feedback controller in
automatic status Fault!
* assuming that the PID controller error (E) is calculated from the set point (SP) as E(t) = SP(t) – T30(t)
Figure 9.17. Schematic of the excess air and insufficient air conditions
Operability in Process Design Chapter 9. Troubleshooting
9-60
Fifth, you determine if the process can be operated safely and profitability. What else is required to prevent a reoccurrence of the problem?
You recognize that the troubleshooting team has learned a great deal, and operating personnel in later shifts and days will not have the benefit of the learning. Therefore, you require the following steps be taken immediately.
A correlation will be prepared to predict the airflow rate as a function of the fuel flow rate that ensures 5 mole% excess oxygen in the flue gas. This correlation will be available to all control room operators as a basis for adjusting the airflow rate.
An outside operator will measure the excess oxygen in the heater stack at least once per shift. He/she will report the value by radio to the control room operator, who will ensure that at least 5 mole% is achieved.
All control room operators must be trained on the symptoms and corrective action for the fault of insufficient air. Each will be trained before being allowed to operate the process.
This solidifies the intermediate state for operation. Recall that you will consider additional actions during the Look back stage to achieve the final state.
At the completion of the Do It stage, safe and reliable operation has been achieved; the profitability should be the best possible for the status of the process equipment. The process conditions satisfy the intermediate state criteria. The troubleshooting team then moves on to the final, Look-back stage. 9.3.8 Look back and Evaluate: Stage 6 of the Problem Solving Method In the Look-back stage, the troubleshooter ensures that the improvements will be sustained, benefits and costs of the changes are analyzed, professional standards are reviewed, and implications of the results on future activities in the company and profession are considered. Sustain and enhance results – Sustaining the results in the current process application was addressed in the Do It stage. Again, the importance of documentation, training, and updated plant operating policies are reinforced here. Most importantly, the process is in the Intermediate state at the completion of the Do It stage, while the Final state is desired. You first determine if there is a difference between the two states, and if there is, ensure that the Final state will be reached. The Final state could be delayed because limitations in time, process flexibility, or equipment availability during the Do It stage. The most common limitation is the requirement to stop process operation for major
Hypothesis 13 explains the data from the process, including initial data, from diagnostic actions, and during the solution.
Operability in Process Design Chapter 9. Troubleshooting
9-61
changes to process equipment, such as cleaning heat exchanger surfaces, repairing or replacing damaged distillation trays, or redistributing catalyst in a packed bed reactor. Often, it is best economically to continue process operation with faulty equipment at a somewhat lower profitability until the next scheduled process shutdown. These scheduled shutdowns are planned carefully so that new equipment and extra skilled personnel are available to perform many improvements in a short time, usually a few days or a week of around-the-clock work. If required, designs to more thoroughly solve a troubleshooting problem should be completed during the Look Back. This gives time for an economic analysis, equipment procurement, and project scheduling, not to mention a safety study. Evaluate the improvements – The effects of the results are reconsidered here, after the hectic stages of the troubleshooting activity have been completed. We look for both positive and negative implications. The analysis should be wide-ranging, considering operating difficulties (e.g., easier or more difficult day-to-day analyses by operating personnel), economics (product quality and production rate), plant equipment reliability, safety, environmental effluents, and sustainability. Professionalism – This topic enables the team to reconsider all results to ensure conformance with appropriate standards for safety, ethics, legal requirements, and best industrial practice. One expects that these standards would have been observed throughout the troubleshooting, but a thoughtful review is appropriate after the stressful troubleshooting activity has been successfully completed. Trevor Kletz is famous for relating instances where well-intentioned changes to plant operations or equipment resulted in accidents involving high cost, injury and loss of life (e.g., Kletz, 1990). Most organizations now have formal “management of change” procedures to ensure that proposed modifications are subject to thorough analysis (West, 1998). Management of change is important in troubleshooting, where actions might be taken without a prior thorough review, especially for time-critical situations.
An important issue for major faults is whether the information learned from
troubleshooting should be shared outside of the organization. Here, major faults are defined as those that could cause death and/or loss of containment of hazardous materials. Some industries have procedures for sharing, e.g., the nuclear power industry. However, most organizations must make this decision. The United States Chemical Safety Board (CSB, 2012) provides excellent reports for major accidents in the process industries, and these reports are available to the public. Regrettably, no such resource for “near misses” exists. Future engineering practice – Troubleshooting uncovers shortcomings in plant design and operating policies that must be avoided in future designs and retrofits (a retrofit involves modifications to an existing plant). Therefore, the new experience should be integrated into organization’s design standards. In addition, troubleshooting checklists and guidelines for the process should be updated to include new insights.

Operability in Process Design Chapter 9. Troubleshooting
9-62
Example 9.2g. The Drooping Temperature. Complete the Look-back stage for this example. Sustain and enhance results – At the completion of Do It, the intermediate state places considerable demands on the control room and outside operators. These tasks are added to their existing responsibilities, so that a risk exists of overloading the operating personnel. In addition, the air/fuel correlation prepared by engineers must place the operating conditions far from the stoichiometric oxygen limit to prevent entering the insufficient oxygen region. This large “safety margin” results in substantial excess air and low heater efficiency. (Excess air is heated and exhausted to the environment, resulting in higher fuel consumption in the heater.) Much better performance is possible with an improved design that includes
measurement of stack gas properties and automatic manipulation of the airflow rate.
The key stack gas properties are oxygen and carbon monoxide. Both measurements are required because (i) with insufficient air, oxygen is negligible (and cannot be controlled) and carbon monoxide is significant, while (ii) with excess air, oxygen is measureable and carbon monoxide is very low, roughly 50-100 ppm (and cannot be controlled).
A feedback control system from flue gas composition manipulates the air provided for combustion. The design uses a signal select to decide which of the controllers (O2 or CO) should adjust the airflow rate, selecting the signal giving the higher airflow command.
The adjustment of fuel and air is sequenced in accordance with the previous discussion, so that air is increased before fuel and fuel is decreased before air.
Cascade control is employed, so that the set points of air and fuel flow controllers are manipulated
A design is shown in Figure 9.18. This is complex, but it represents standard practice for boilers and fired heaters operating close to stoichiometric air in combustion processes. Further explanation of this control design with more detail for reliable implementation can be found in (Dukelow, 1986).
Evaluate the improvements – You have implemented steps to prevent insufficient airflow from causing unstable temperature control and severe damage to the fired heater. Let’s consider other effects of the decision.
Additional advantages Maintaining lower excess air, as achieved with the automatic control
design, improves the efficiency of a fired heater. The modified operation would save money and reduce the generation of carbon dioxide.
Automating the control of oxygen and carbon monoxide reduces the likelihood of insufficient air over manual monitoring.
Lowering the excess air results in a decrease in the generation of NOx. Reduced load on the operator for routine adjustments, leaving more time
for higher level monitoring and diagnosis.

Operability in Process Design Chapter 9. Troubleshooting
9-63
Figure 9.18. “Cross limiting” combustion control for the fired heater. The annotations “fuel” and “air” indicate the units of the signals.
Some disadvantages Naturally, the sensors and control require investment. In addition, the
sensors require weekly maintenance and spare parts. The automated control system introduces complexity and sources of faults.
Professionalism
Safety – A HAZOP is required for the new design of the fired heater control system. We will not complete this lengthy task here. However, one example will demonstrate the importance. Many flue gas analyzers are sources of high temperature. Therefore, the analyzer electrical power must be disconnected when the fired heater SIS activates. That a sensor is tied into an SIS might be surprising, but it is necessary in this design.
Ethics and legal - You see no ethical or legal requirements for this process. However, you should check, because some countries have legal requirements for boiler control designs, which might apply to fired heaters as well.
Best Practice – Operation of combustion processes is common, and much information is available. The best practice will be based on recent publications in the open literature and on industrial standards, for example, API (2011).
Future engineering practice – The instrumentation, design and troubleshooting available at the beginning of this exercise could use improvement.
Operability in Process Design Chapter 9. Troubleshooting
9-64
The troubleshooting team missed the time-critical issues with the combustion
process. This should be added to a checklist of potentially hazardous issues to investigate quickly.
The process design failed to provide a method for determining the proper ratio while the process was in operation, although the measurement and control of excess oxygen and carbon monoxide are well understood, explained in publications, and industrial-quality sensors are available from many suppliers. You upgrade your organization’s instrumentation standards to include combustion sensors and control designs.
You give guidance on the capacity of the fired heater (GJ/h) beyond which automated control is economically attractive.
You update the organizations standard operations handbook for fired heaters and boilers. You include symptoms associated with this problem, explain how to safe park the process and to recover while avoiding an explosion (cut fuel, do not increase air), and give diagnostic actions.
Following suggestions about life-long learning, you reflect on possible lessons learned from this example that might be applicable to troubleshooting other process problems.
In many processes, materials (or energy) are provided in ratios. In this
example, the air/fuel ratio was critical. You could provide an additional guideline based on identifying where ratios influence performance.
To improve performance for potentially hazardous situations, time-critical issues can be identified in a generic way, such as combustion processes, process with flows in but no flows out, exothermic chemical reactions, hazardous chemicals in an organization, etc.
The TC-30 response was unusual. Normally, a poorly responding control loop will oscillate (when too aggressive) or allow the controlled variable to “drift” far from the set point (when not aggressive enough). The temperature deviation from set point was accelerating while the change in manipulated variable rate of change was accelerating. This is a symptom of positive feedback, destabilizing control.
As you expect by now, you conclude this example with a final look back over all stages of troubleshooting for this exercise. You find that all goals have been achieved. You congratulate the troubleshooting team and buy them all a coffee.
In this section, the generic problem solving method has been tailored to the troubleshooting application with many guidelines to facilitate troubleshooting in the process industries. The
This example has been presented in extreme detail. Many sketches and tables have been provided, along with a cause-effect diagram. It is typical for troubleshooters to complete many of these tasks “in their heads”. The details here are complete for pedagogical reasons, to aid the reader in understanding and learning.

Operability in Process Design Chapter 9. Troubleshooting
9-65
worksheet in Figure 9.5 will serve as a memory aid for the major stages and some guidelines within each stage. In the next section, some more troubleshooting examples are presented.
9.4 Applying the Troubleshooting method to examples Generally, people can learn the troubleshooting stages quickly. However, building expertise in troubleshooting takes some further experience. Therefore, additional worked examples are presented in this section. Each example involves a realistic initial scenario, a typical troubleshooting response, the correct solution, and discussion on lessons learned. The presentations of the examples are shorter than the detailed presentation in the previous section; however, the reader should recognize that all of the steps have been performed, just not discussed. 9.4.1 The Persistently High Distillation Pressure Example 9.8 Persistently High Distillation Pressure. Allison, who was the engineer on Example 9.1, is back on the job after an excellent trouble-shooting course. She has transferred to a different unit in the same plant. Her supervisor still suggests that she frequently visit the control room and equipment to learn more about the operation and to build relationships with the operating personnel. She stopped by the control room to gather information about pressure drops along a series of heat exchangers. Sales of the plant’s products have been increasing nicely, so the plant is increasing production rate – slowly to prevent disturbances. The operator is in a bad mood, shouting that the pressure control does not seem to be working and the control engineer should be fired.
The distillation tower is shown in Figure 9.19. The pressure sensor indicates a pressure above its set point. Increased sales will make the company a lot of money. If the production rate cannot be increased, it will be a black eye for the operator, the unit supervisor, and maybe her too! So, she had better solve this problem.
Before moving on after this successful learning experience, we should acknowledge a serious failing in the troubleshooting performance in the drooping temperature exercise. The team missed the critical safety issue that should have triggered a time-critical decision early in the trouble shooting analysis, perhaps during Define and certainly during Explore. As a result, the fired heater operated for an extended period of time in an unsafe condition. Typically, the process operator would have diagnosed the problem and taken corrective actions quickly. The key insight was delayed in this textbook exercise to enable students to understand the process principles and to fully develop all stages of the troubleshooting method. Please see Sidebar II for further discussion.

Operability in Process Design Chapter 9. Troubleshooting
9-66
Sidebar II: Successful TS Lesson; Unacceptable TS PracticeReflection on the Trouble Shooting Exercise: Now that we have successfully diagnosed the cause of the Drooping Temperature problem, we need to consider how well our trouble shooting performance would be rated in industrial practice. Let’s return to the initial symptoms in the figure on the right. We did not initially recognize potential causes; therefore, we relied on our understanding of basic chemistry and physics, which required proceeding through the Trouble Shooting steps.
The initial data that raised a concern about the process operation
Importance of recognizing time‐critical scenario The sequence of process states is shown schematically in Figure 9.4, and the upper section of this important figure is repeated in this sidebar. During the Drooping Temperature exercise, we proceeded along the left-hand path. Because of our lack of experience, we did not immediately recognize the imminent hazard. The fuel-rich environment in the firebox could lead to an explosion if air entered, perhaps through a leak in the vessel. The consequences of an explosion are shown in the accompanying figure. Regrettably, we allowed a hazardous condition to exist in the heater for a prolonged time!
Is it time-critical? The first major decision in the process
states during Trouble Shooting
Requirements for engineering practice Engineers and operations personnel must be able to (1) understand causes and consequences, (2) be able to verify hypotheses with diagnostic actions, (3) implement the proper responses (and avoid improper actions), and (4) be able to verify the return to a safe state. And, they need to do this without undue delay. Therefore, we conclude that our TS performance was not acceptable for industrial practice. However, we also recognize that this is our first attempt at applying the TS method and perhaps, our first introduction to a fired heater. We will continue to sharpen our skills until we can perform at the high level required for operating complex and hazardous equipment.
Copyright © BP plc (Mbeychok, 2014)
Excellent TS performance results from personnel training and subsequent improvement of process design. Engineers will prepare training for all likely hazards, so that people will be well prepared in the event of a major fault, such as the Drooping Temperature. In addition, design engineers select equipment, process structure, operating conditions, and a safety hierarchy that vastly reduce the likelihood of a hazard occurring. Design enhancements that reduce the likelihood of a fuel-rich environment in the fire box of a fired heater include additional sensors and improved process control.

Operability in Process Design Chapter 9. Troubleshooting
9-67
Figure 9.19. Drawing for Example 9.8: Persistently high distillation pressure
Engage Allison is confident that the troubleshooting team will solve the problem.
This is much better than her previous attitude.
Allison assembles the control room operator, the shift supervisor, a plant design engineer and naturally, herself for the team. She reviews the troubleshooting procedure with them.
Getting the right people is important. Each brings unique knowledge and insights.
Define He operator asks her to tune the pressure controller, which he feels is causing the problem. Allison states the problem as being the high pressure in the distillation tower.
Allison acknowledges this input and does not dispute the operator’s suggestion. However, she explains that she thinks it best to define the problem. (The operator is skipping steps and jumping to a conclusion; this is a common miss-step in problem solving.)
Who: The operator has noticed the problem What: Measured Pressure Where: Top of the distillation tower When: At least since the shift change four hours ago. Why: At this time, we do not know the cause How: The operator observed the pressure sensor
Note that the problem is the measured pressure. The sensor could be in error, so we are not sure that the pressure is high.
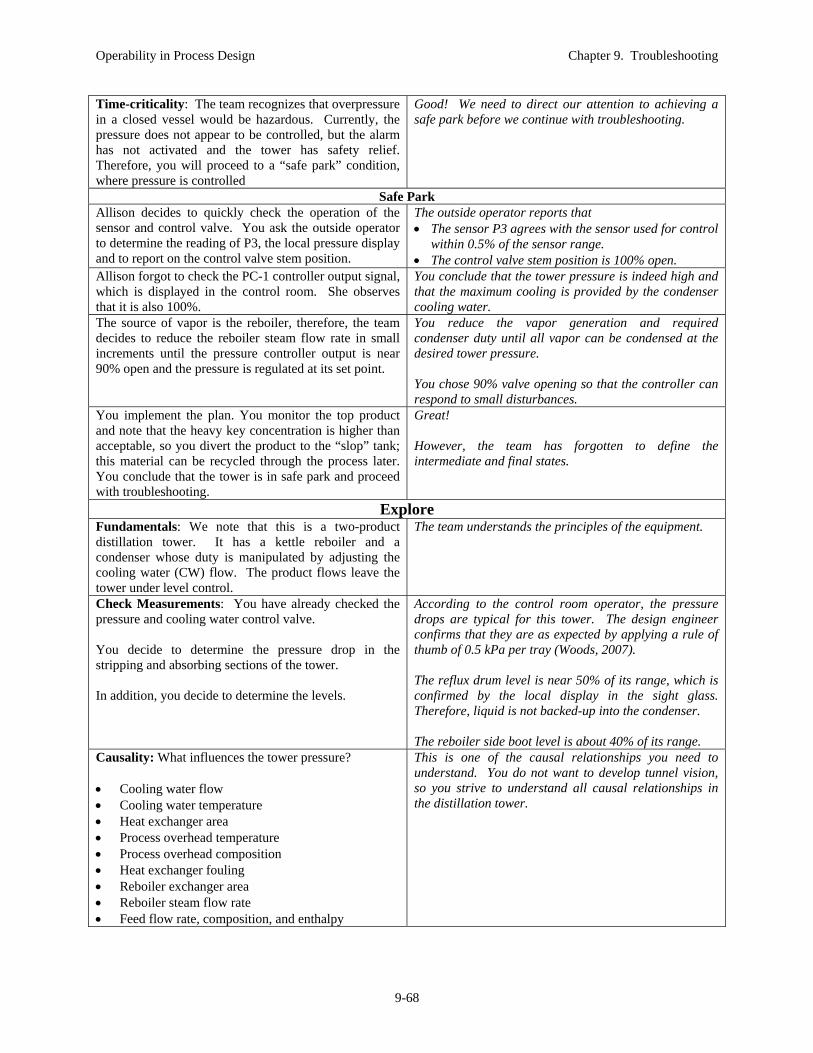
Operability in Process Design Chapter 9. Troubleshooting
9-68
Time-criticality: The team recognizes that overpressure in a closed vessel would be hazardous. Currently, the pressure does not appear to be controlled, but the alarm has not activated and the tower has safety relief. Therefore, you will proceed to a “safe park” condition, where pressure is controlled
Good! We need to direct our attention to achieving a safe park before we continue with troubleshooting.
Safe Park Allison decides to quickly check the operation of the sensor and control valve. You ask the outside operator to determine the reading of P3, the local pressure display and to report on the control valve stem position.
The outside operator reports that The sensor P3 agrees with the sensor used for control
within 0.5% of the sensor range. The control valve stem position is 100% open.
Allison forgot to check the PC-1 controller output signal, which is displayed in the control room. She observes that it is also 100%.
You conclude that the tower pressure is indeed high and that the maximum cooling is provided by the condenser cooling water.
The source of vapor is the reboiler, therefore, the team decides to reduce the reboiler steam flow rate in small increments until the pressure controller output is near 90% open and the pressure is regulated at its set point.
You reduce the vapor generation and required condenser duty until all vapor can be condensed at the desired tower pressure. You chose 90% valve opening so that the controller can respond to small disturbances.
You implement the plan. You monitor the top product and note that the heavy key concentration is higher than acceptable, so you divert the product to the “slop” tank; this material can be recycled through the process later. You conclude that the tower is in safe park and proceed with troubleshooting.
Great! However, the team has forgotten to define the intermediate and final states.
Explore Fundamentals: We note that this is a two-product distillation tower. It has a kettle reboiler and a condenser whose duty is manipulated by adjusting the cooling water (CW) flow. The product flows leave the tower under level control.
The team understands the principles of the equipment.
Check Measurements: You have already checked the pressure and cooling water control valve. You decide to determine the pressure drop in the stripping and absorbing sections of the tower. In addition, you decide to determine the levels.
According to the control room operator, the pressure drops are typical for this tower. The design engineer confirms that they are as expected by applying a rule of thumb of 0.5 kPa per tray (Woods, 2007). The reflux drum level is near 50% of its range, which is confirmed by the local display in the sight glass. Therefore, liquid is not backed-up into the condenser. The reboiler side boot level is about 40% of its range.
Causality: What influences the tower pressure? Cooling water flow Cooling water temperature Heat exchanger area Process overhead temperature Process overhead composition Heat exchanger fouling Reboiler exchanger area Reboiler steam flow rate Feed flow rate, composition, and enthalpy
This is one of the causal relationships you need to understand. You do not want to develop tunnel vision, so you strive to understand all causal relationships in the distillation tower.

Operability in Process Design Chapter 9. Troubleshooting
9-69
Opinion: Clearly, the operator’s early conclusion about the controller is opinion.
In fact, the early actions disproved the hypothesis, because the cooling water flow was at its maximum. No amount of controller tuning could have changed the process behavior; it does not have sufficient cooling capacity.
Relevant changes: Allison inquires and learns that no changes have been made to the equipment over the last three days.
Time sequence: Allison accesses the historical data for the pressure and observes that it began to deviate from the set point about seven hours ago. Since then, the feed to the tower has been increased by about three percent, according to the “slow increase” policy. The top product composition, AC-1, was within specifications until you moved to safe park.
Oops, the team did not look at historical data. If they had, they would have observed important data that showed the following. 1. The distillation tower had functioned well at high feed rates immediately after the last turnaround. 2. The distillation tower had been operated at about 75% of design feed rate for about six months.
Plan Hypothesis generation: The team decides to move on to the plan stage where they will develop working hypotheses. They develop the following list during a brainstorming session. 1. The cooling water pumps are not generating enough
head; the cooling water flow is too low. 2. The cooling water temperature is too warm. 3. The condenser has too little area. 4. The process overhead temperature is too low. 5. The condenser is fouled. 6. The overhead vapor flow was too high because of
incorrect setting of the steam flow. 7. The overhead vapor flow was too high because of a
high steam pressure. 8. The overhead vapor flow rate was too high because
of a high feed flow 9. The overhead vapor flow rate was too high because
of a high concentration of light key in the feed 10. The overhead vapor flow rate was too high because
of a high feed enthalpy, i.e., a high percent vapor in the feed.
This is a good list. Remember to keep your mind open for additional hypotheses as you collect information.
Initial information: No working hypothesis is disproved by the initial information.
Diagnostic actions: The following diagnostic actions are developed, with the affected hypotheses in parentheses. A. Check the cooling water pump outlet pressure (1). B. Ensure that all manual valves are fully open in the
cooling water pipe (2). C. Determine the cooling water temperature leaving the
cooling tower and leaving the condenser (3). D. Check the condenser design calculations for the basis
of the area calculation (5). E. Compare the overhead temperature with historical
data and the design assumption (6). F. Calculate an estimated fouling factor using plant data
(7).
The team has decided to work on this preliminary list, recognizing that further actions will be required if the intermediate cause is the high vapor flow rate. The order of execution of the actions is noted in the list. The results of the actions are summarized in the following. A. All cooling water pumps are operating and the cooling water supply pressure is a little higher than typical. This information comes from the utility plant operator. B. All manual valves in the cooling water pipes are confirmed to be fully open.
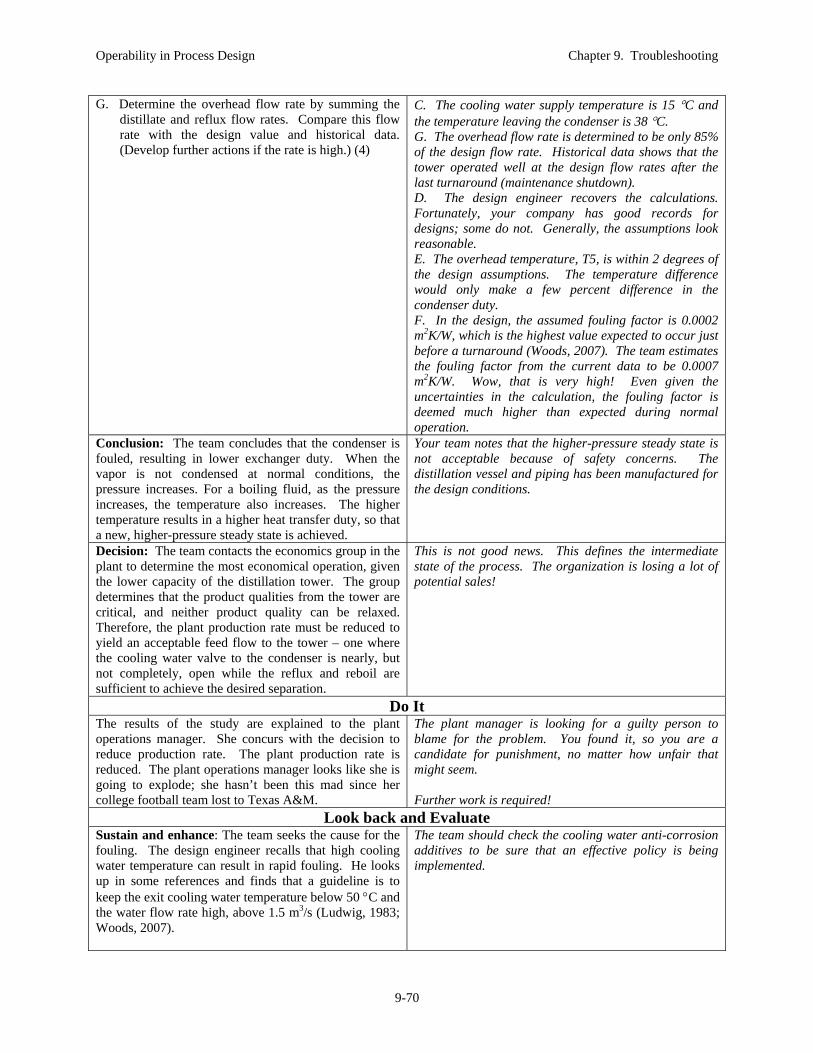
Operability in Process Design Chapter 9. Troubleshooting
9-70
G. Determine the overhead flow rate by summing the distillate and reflux flow rates. Compare this flow rate with the design value and historical data. (Develop further actions if the rate is high.) (4)
C. The cooling water supply temperature is 15 C and the temperature leaving the condenser is 38 C. G. The overhead flow rate is determined to be only 85% of the design flow rate. Historical data shows that the tower operated well at the design flow rates after the last turnaround (maintenance shutdown). D. The design engineer recovers the calculations. Fortunately, your company has good records for designs; some do not. Generally, the assumptions look reasonable. E. The overhead temperature, T5, is within 2 degrees of the design assumptions. The temperature difference would only make a few percent difference in the condenser duty. F. In the design, the assumed fouling factor is 0.0002 m2K/W, which is the highest value expected to occur just before a turnaround (Woods, 2007). The team estimates the fouling factor from the current data to be 0.0007 m2K/W. Wow, that is very high! Even given the uncertainties in the calculation, the fouling factor is deemed much higher than expected during normal operation.
Conclusion: The team concludes that the condenser is fouled, resulting in lower exchanger duty. When the vapor is not condensed at normal conditions, the pressure increases. For a boiling fluid, as the pressure increases, the temperature also increases. The higher temperature results in a higher heat transfer duty, so that a new, higher-pressure steady state is achieved.
Your team notes that the higher-pressure steady state is not acceptable because of safety concerns. The distillation vessel and piping has been manufactured for the design conditions.
Decision: The team contacts the economics group in the plant to determine the most economical operation, given the lower capacity of the distillation tower. The group determines that the product qualities from the tower are critical, and neither product quality can be relaxed. Therefore, the plant production rate must be reduced to yield an acceptable feed flow to the tower – one where the cooling water valve to the condenser is nearly, but not completely, open while the reflux and reboil are sufficient to achieve the desired separation.
This is not good news. This defines the intermediate state of the process. The organization is losing a lot of potential sales!
Do It The results of the study are explained to the plant operations manager. She concurs with the decision to reduce production rate. The plant production rate is reduced. The plant operations manager looks like she is going to explode; she hasn’t been this mad since her college football team lost to Texas A&M.
The plant manager is looking for a guilty person to blame for the problem. You found it, so you are a candidate for punishment, no matter how unfair that might seem. Further work is required!
Look back and Evaluate Sustain and enhance: The team seeks the cause for the fouling. The design engineer recalls that high cooling water temperature can result in rapid fouling. He looks up in some references and finds that a guideline is to keep the exit cooling water temperature below 50 C and the water flow rate high, above 1.5 m3/s (Ludwig, 1983; Woods, 2007).
The team should check the cooling water anti-corrosion additives to be sure that an effective policy is being implemented.

Operability in Process Design Chapter 9. Troubleshooting
9-71
You note that the current temperature is 38 C, so there should be no problem. However, the design engineer points out that the exit temperature changes. At low production, the cooling water flow can be very low, resulting in high cooling water temperature. The shift supervisor recalls a period of low production since the last turnaround. A check of the historical data confirms low production for six months during the past year. These were the worst circumstances, high cooling water outlet temperatures with low cooling water flow. These operating conditions were likely the cause of the high fouling factor; once is fouls, it stays fouled. Your team reports its results, and the plant design group prepares a modified design for the tower condenser, similar to the flooded condenser design in Figure 9.3. Evaluate improvements: The plant economics group must perform an analysis of when the plant should be shutdown to replace the condenser; naturally, the time cannot be before the equipment is designed and fabricated. Any early shutdown will be costly, but the production rate will be lower than maximum sales until the next scheduled shutdown. Therefore, this is an economics problem.
Professionalism: The plant manager learns your results and wants to fire the operations manager.
You point out that the operations personnel had no options once the plant was designed and built. The problem lies in the design. Adjusting the cooling water is just not a good idea. See Sloley (2001).
Future engineering practice: The design engineer modifies the organizations design manual for distillation pressure control.
The troubleshooting team has done a good job. They placed the process in a safe park,
determined the cause of the problem, and found the best intermediate state for continued operation that is safe and most economical for the equipment condition. They also determined when and how the equipment problem originated, prepared a design modification, and updated design manuals to prevent future occurrences of the problem.
We can learn the following lessons from this troubleshooting example.
Evaluating time-critical issues, and moving the process to a “safe park” location when necessary, is an essential aspect of troubleshooting.
Operating the process improperly (here, with high cooling water temperature) can have a negative impact many months after the improper operation.
A combination of real-time data, historical data, rules-of-thumb and calculations (simulations) can be necessary to find the cause of the problem
Fully recovering to the best “final state” can require a plant shut down for equipment maintenance or replacement.
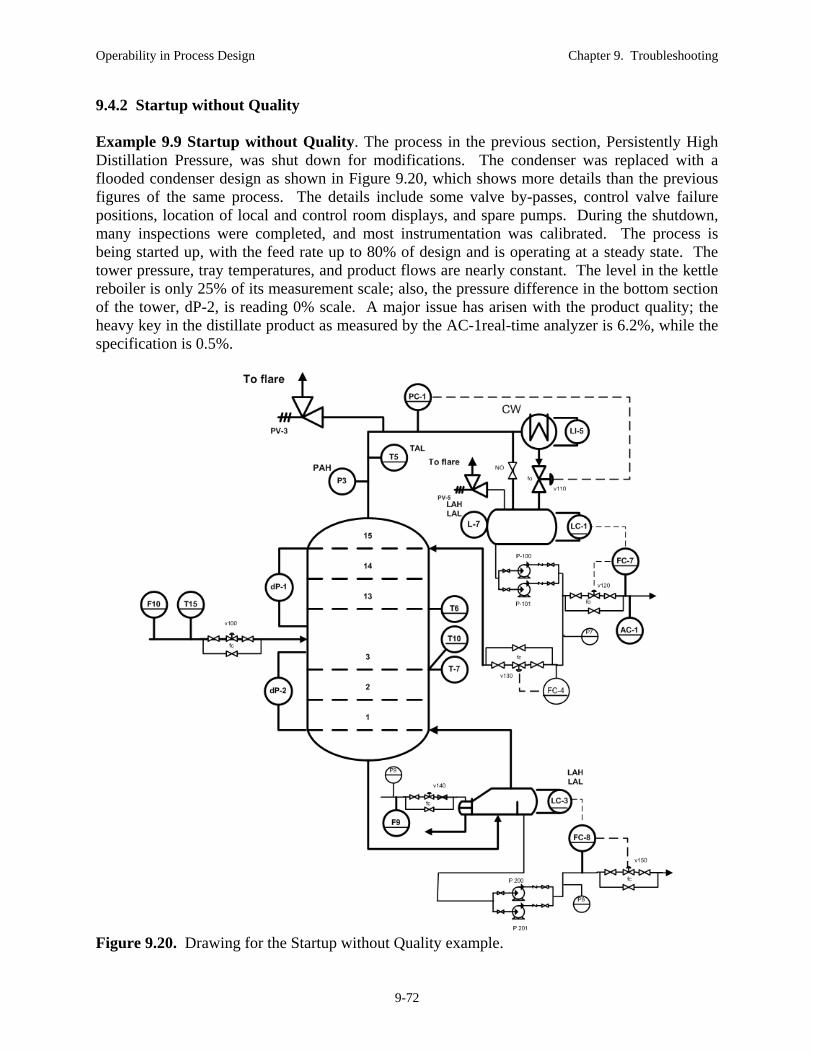
Operability in Process Design Chapter 9. Troubleshooting
9-72
9.4.2 Startup without Quality Example 9.9 Startup without Quality. The process in the previous section, Persistently High Distillation Pressure, was shut down for modifications. The condenser was replaced with a flooded condenser design as shown in Figure 9.20, which shows more details than the previous figures of the same process. The details include some valve by-passes, control valve failure positions, location of local and control room displays, and spare pumps. During the shutdown, many inspections were completed, and most instrumentation was calibrated. The process is being started up, with the feed rate up to 80% of design and is operating at a steady state. The tower pressure, tray temperatures, and product flows are nearly constant. The level in the kettle reboiler is only 25% of its measurement scale; also, the pressure difference in the bottom section of the tower, dP-2, is reading 0% scale. A major issue has arisen with the product quality; the heavy key in the distillate product as measured by the AC-1real-time analyzer is 6.2%, while the specification is 0.5%.
Figure 9.20. Drawing for the Startup without Quality example.

Operability in Process Design Chapter 9. Troubleshooting
9-73
Allison has been promoted, and a new engineer, Rafiq, is in charge of the unit. He has completed the organization’s troubleshooting course and has design experience, but this startup is his first experience in operations. Let’s see how he does with his first troubleshooting experience.
Engage Rafiq is concerned about attacking this new type of problem before. However, he decides to “take charge”.
Be careful here! He will be dealing with many experienced people with excellent knowledge and skills. We should not be intimidated and be confident, but we should be respectful of others, especially when we are a junior partner when it comes to contributions.
Rafiq reviews the current situation with the control room operator, who says that this type of behavior did not occur prior to the turnaround. They ask for the participation of the shift supervisor, the operations engineer from another unit, and an engineer from the plant control group. In addition, they assemble information, drawings and some old design calculations.
OK, the troubleshooting team has a good mix of skills and knowledge. Did any of these people participate in the shutdown and turnaround modifications?
Define Visit process: A drawing is available that has been updated during the shutdown. A visit to the process is not necessary at this stage, because everyone knows the unit.
The team knows the unit, but they might observe the source of a problem by visiting.
Process Operating condition: The process has been shut down and restarted. Many changes to equipment have been made. The team decides to widen the possible faults because of the possibility of human error, and early failure of new equipment just placed in service. They even have to consider vandalism from a disgruntled worker; although unlikely, it is not impossible.
Once equipment is opened, the range of likely faults increases greatly. Human error is possible when working under stress in close quarters, and the acts of dissatisfied workers must also be considered.
The 5Ws and 1H. Who: The control room operator first reported the
problem. What: The initial key symptom is the overhead product
quality, with high impurity concentration. Where: The distillation tower in the figure, but the
cause could be from upstream (feed) or utilities (cooling water and steam).
When: The problem appeared during the startup. We must check to ensure that the process could achieve acceptable operation before the shutdown.
Why: We do not know the cause How: The operator observed several discrepancies
from typical behavior using sensors
The other symptoms should be included in the “What”. They are the low pressure difference and the low reboiler level.
Time Criticality: No issue threatening safety or equipment damage appears to be occurring. (These might be high pressure, loss of containment, pump overheating, etc.) The team decides to continue current operation, not safe park.
This is a good decision. Remember to continually monitor for time-critical issues.
Operability in Process Design Chapter 9. Troubleshooting
9-74
Safe Park Not required(at this time)
Explore Fundamentals: The team asks for the tasks performed in this process during the turnaround. The fundamentals of distillation are too complex to repeat here. They ask an office assistant to obtain the distillation troubleshooting book by Kister (2006) and bring it to the control room.
We need to know if the tower vessel was opened and the trays inspected. (Trays can corrode, be displaced by flow surges, foul, and otherwise have their performance compromised.) They learn that the trays were inspected.
Check Measurements: The pressure is at the correct set point, and the
sensor P3 agrees with the value. The overhead drum level, LC-1, is near the
middle of the sensor range, which is confirmed by L7
T6 is a few degrees higher than normal T10 is a few degrees lower than normal; this
measurement is confirmed by T7 A quick view of the trend plots indicates that
the process is at steady state.
Nothing serious is noted. This might be a challenging problem!
Causality: The product quality is influenced by many factors, including
number of trays trays functioning (proper liquid-vapor contact) feed composition feed tray location pressure reflux flow rate and temperature (subcooling) reboiler duty (reboiled vapor rate)
The team seems to be ignoring the other symptoms. Do they have tunnel vision?
Opinion: No opinions have been expressed. Relevant changes: Turnaround!
Condenser piping modified to flooded heat exchanger with hot vapor by-pass pipe
Instruments calibrated Vessel trays inspected. Pumps refurbished in the plant machine shop Likely more actions; details requested by team
Time sequence: The startup of a distillation tower involves introducing feed, starting the reboiler (with total reflux), establishing adequate internal vapor and liquid flow rates, drawing top and bottom products (initially sent to storage for recycle), and adjusting the reflux and reboil to achieve desired product compositions. This procedure was followed by the operator, but the final phase of good product quality was not accomplished.

Operability in Process Design Chapter 9. Troubleshooting
9-75
Plan Hypothesis generation: The team decides to move on to the plan stage where they will develop working hypotheses. They develop the following list during a brainstorming session. 1. Feed composition has changed; acceptable separation
not possible with the tower (feed tray and number of trays)
2. The reflux pump is not functioning properly; its output pressure is low, so reflux is low
3. The reboiler duty is low because the steam pressure is low.
4. Tray damage has reduced the efficiency of the liquid-vapor contact
5. The internal liquid flow rate is above the tray capacity; flooding is occurring
6. The internal vapor flow rate is above the tray capacity; liquid entrainment is occurring
7. The analyzer sensor measurement is incorrect 8. The reboiler duty is too high because the valve v140
is open too much
This is a good list. Remember to keep your mind open for additional hypotheses as you collect information. “Pump not functioning properly” is vague. What about those other symptoms?
Initial information: The initial information does not disprove any other the working hypotheses.
Diagnostic actions: The following diagnostic actions are developed. A. Determine the reflux pump, P100/P101, outlet
pressure B. Determine the steam supply pressure, P9 C. Determine the opening of rebioler valve v140 D. Determine the delta pressures in both sections of the
tower. Read dP-1 and check/repair dP-2 E. Determine the feed composition through a laboratory
sample F. Estimate the internal liquid flow from the external
reflux flow rate, F4 G. Shutdown the tower and inspect the trays H. Obtain a laboratory analysis of the tower overhead
product to compare with the AC-1 measurement.
The team has decided to work on this preliminary list. Actions E and H will take hours, and action G will take days. Therefore, the team decides to perform the rapid actions and evaluate their progress before moving to the time-consuming actions. The order of execution of the actions is alphabetical in this example. The results of the actions are summarized in the following. A. The pump outlet pressure is high enough to provide
the reflux flow. The operator confirms that the value is “typical” based on data before the turnaround.
B. The steam supply pressure is about equal to its source, the low-pressure steam header. This is normal, with a small drop due to the fictional losses.
C. The signal to the reboiler steam valve is open about 54%, which the operator confirms is normal. The outside operator confirms that the valve stem position is “somewhere between 50-60%”.
D. dP-2 was found to be incorrectly calibrated, and it was re-calibrated. Both pressure drops are in their “normal range”, according to the control room operator and when applying a rule of thumb of 0.5 kPa per tray (Woods, 2007).
E. ---------------- F. The internal reflux at the top of the tower should be
approximately equal to the external reflux. When Rafiq reads the value of F4, he is surprised to find that it is only about 15% of sensor span. This is a

Operability in Process Design Chapter 9. Troubleshooting
9-76
very low value for the reflux rate, and it could account for the high level of impurity in the top product.
G. ---------------- Follow-up diagnostic actions: The team needs to determine the reason for the low F4 flow rate measurement. A1. Check the set point of FC-4 B1. Check the controller output of FC-4 C1. Have the outside operator check the valve stem
position for v130.
The reflux pump is providing sufficient head. They have to look elsewhere. Results of the actions are the following. A1. The set point of the controller is the correct value,
about 65% of the instrument range. In addition, we note that the controller is in automatic status.
B1. The output of the controller is 100% open. C1. The outside operator reports that the v130 valve
stem position is 100% open. More follow-up actions: What is going on? The pump exit pressure is high, and the control valve is open, but the flow is low? A2. The team goes out to look at the process, especially
the reflux drum, pumps, and reflux flow piping. B2. The pump is not making an unusual noise, as would
likely happen if it were cavitating. C2. You note that the reflux valve v130 is provided
with isolation and by-pass manual valves to enable maintenance without shutdown.
D2. Check the historical data for FC-4.
A2. You note that pump P-100 is in operation. It is driven by an electric motor. Pump P-101 is not in operation and is isolated by closing manual valves. This is OK; two pumps are not needed, especially at lower production rates.
B2. OK C2. Rafiq checks and finds that the upstream isolation
valve is nearly completely closed. Bingo! The extra resistance to flow from the mostly closed reflux drum resulted in a small reflux flow rate although the controller set point was correct.
The control room operator is embarrassed. He should have noted the discrepancy between the set point and measurement of FC-4. D4. The historical data verifies that the reflux flow has been low for the entire startup. The operator is mortified that he did not notice the low reflux flow. Correctly, Rafiq does not chastise the operator and offers words of encouragement.
Conclusion: The isolation valve upstream of v130 was improperly nearly completely closed. This almost certainly occurred during the turnaround, since adequate reflux flow was achieved before the turnaround. Low reflux caused poor separation in the distillation tower. The cause explains all symptoms.
The team misses the tray temperatures, whose behavior is also consistent with the cause.
Decision: Implement the following plan. 1. Place FC-4 in manual 2. Reduce the controller output to around 30% 3. Open the isolation valve 4. Set the FC-4 set point to its current measurement
value 5. Place FC-4 in automatic 6. Slowly increase the set point of FC-4 until the top
product impurity is below the maximum limit.
The shift supervisor emphasizes that the reflux should be increased “slowly”, which means over about 15-30 minutes. Introducing a large increase of reflux into the tower too quickly could lead to flooding the top trays.
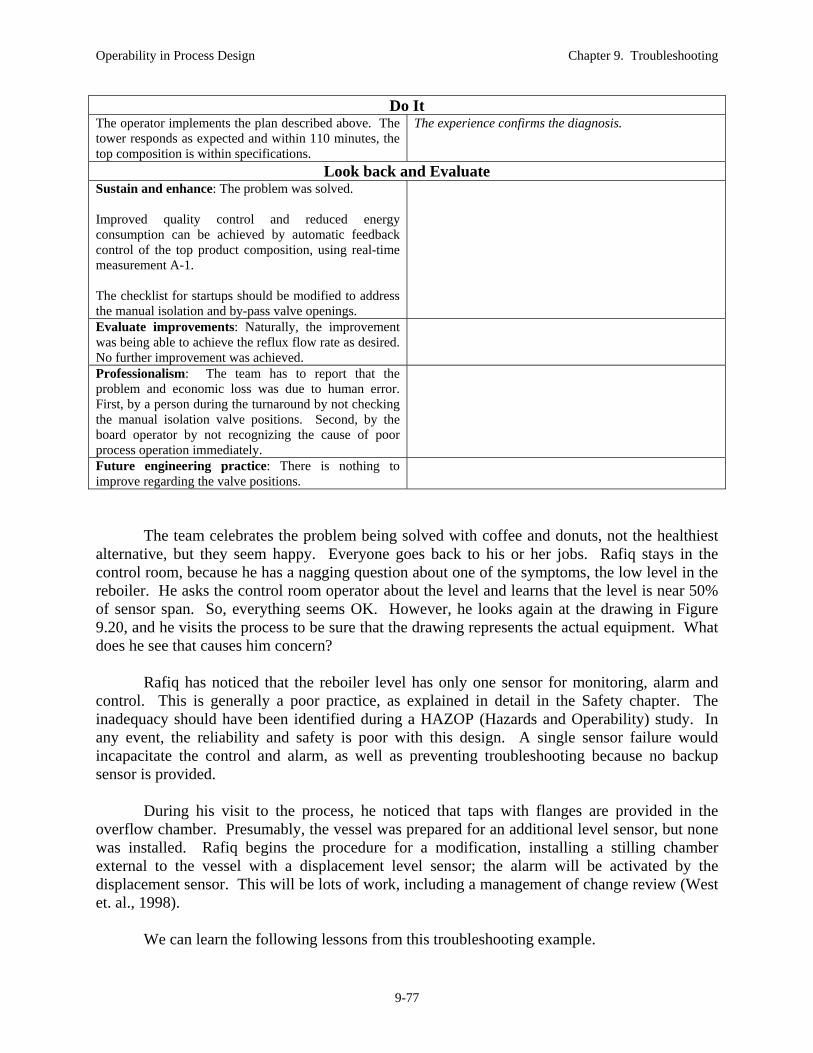
Operability in Process Design Chapter 9. Troubleshooting
9-77
Do It The operator implements the plan described above. The tower responds as expected and within 110 minutes, the top composition is within specifications.
The experience confirms the diagnosis.
Look back and Evaluate Sustain and enhance: The problem was solved. Improved quality control and reduced energy consumption can be achieved by automatic feedback control of the top product composition, using real-time measurement A-1. The checklist for startups should be modified to address the manual isolation and by-pass valve openings.
Evaluate improvements: Naturally, the improvement was being able to achieve the reflux flow rate as desired. No further improvement was achieved.
Professionalism: The team has to report that the problem and economic loss was due to human error. First, by a person during the turnaround by not checking the manual isolation valve positions. Second, by the board operator by not recognizing the cause of poor process operation immediately.
Future engineering practice: There is nothing to improve regarding the valve positions.
The team celebrates the problem being solved with coffee and donuts, not the healthiest alternative, but they seem happy. Everyone goes back to his or her jobs. Rafiq stays in the control room, because he has a nagging question about one of the symptoms, the low level in the reboiler. He asks the control room operator about the level and learns that the level is near 50% of sensor span. So, everything seems OK. However, he looks again at the drawing in Figure 9.20, and he visits the process to be sure that the drawing represents the actual equipment. What does he see that causes him concern? Rafiq has noticed that the reboiler level has only one sensor for monitoring, alarm and control. This is generally a poor practice, as explained in detail in the Safety chapter. The inadequacy should have been identified during a HAZOP (Hazards and Operability) study. In any event, the reliability and safety is poor with this design. A single sensor failure would incapacitate the control and alarm, as well as preventing troubleshooting because no backup sensor is provided. During his visit to the process, he noticed that taps with flanges are provided in the overflow chamber. Presumably, the vessel was prepared for an additional level sensor, but none was installed. Rafiq begins the procedure for a modification, installing a stilling chamber external to the vessel with a displacement level sensor; the alarm will be activated by the displacement sensor. This will be lots of work, including a management of change review (West et. al., 1998).
We can learn the following lessons from this troubleshooting example.

Operability in Process Design Chapter 9. Troubleshooting
9-78
9.4.3 The Frenetic Flow Rate Example 9.10 Frenetic Flow Rate. Simin is the new process engineer in charge of the heater and reactor process previously considered in Example 9.2, The Drooping Temperature. The process is shown in Figure 9.21. A flue gas sensor has been installed, and a feedback control system uses the measurements of flue gas oxygen and carbon monoxide as a basis for adjusting the airflow to the burner. The control strategy implements the cross-limiting strategy (shown in Figure 9. 13), which is not shown in detail in the drawing in Figure 9.21. The market for the plant’s product has been weak, with sales falling rapidly. However, the business remains profitable, so the plant continues in operation. The marketing group has seen sales fall another ten percent, and in response, the plant manager has ordered an immediate reduction of five percent in production, with another five percent planned for tomorrow. When the operator reduced the feed flow set point by five percent, “everything went crazy”. All flows, pressures and temperatures in the process began to “jump around”. The operator quickly returned the feed flow to its original value, and after a few minutes, the process stabilized and smooth operation was restored. Simin had just arrived at work and was in her office boiling water for her first cup of tea. The operator called her and asked that she to come to the control room. He sounded agitated when he related his recent experience. Simin realized that the product tank was nearly full. If the production rate could not be reduced soon, the plant would have to send some of its product to fuel, at a huge economic penalty. That is not the way to make a good initial impression on the plant manager, so she had better see that the problem is corrected quickly. She foregoes the tea and gets out to the control room. Let’s see how she does.
Engage Simin arrives at the control room that is in a state of mayhem, with the operator very upset. He is concerned about potential damage having been done to the fired heater.
Simin presents a calming demeanor, pointing out that the heater is protected by automatic controls that protect against damage. In addition, she points out that he apparently followed directives from the plant manager, so the operator cannot be blamed. (She plans to investigate whether the operating orders were followed correctly as part of troubleshooting.)
She and the operator review all of the actions taken and the initial data.
The range of possible faults is expanded when troubleshooting during and immediately after a startup.
Rules of thumb, like the typical pressure drop per tray, are useful when evaluating process data.
Monitoring the controller output signals is a valuable troubleshooting strategy. You might be looking for the cause of one problem (here, the composition) and find
other problems (here, the poor level control design).
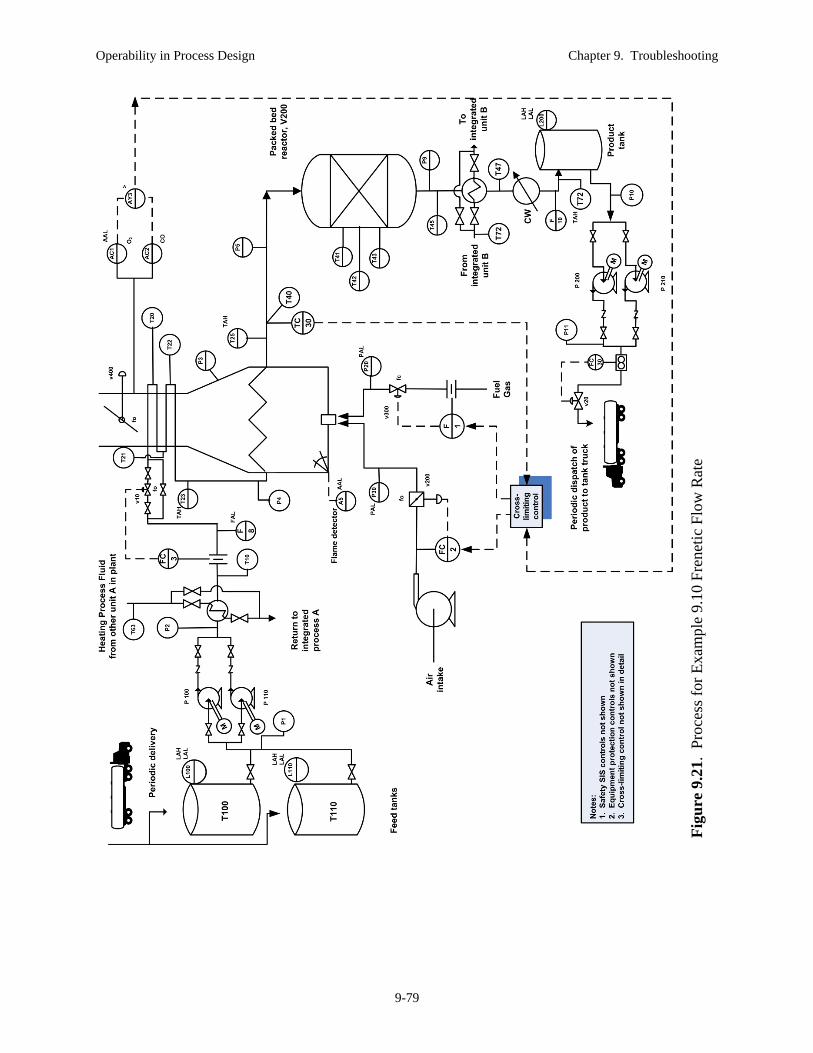
Operability in Process Design Chapter 9. Troubleshooting
9-79
Fig
ure
9.2
1. P
roce
ss f
or E
xam
ple
9.10
Fre
neti
c F
low
Rat
e

Operability in Process Design Chapter 9. Troubleshooting
9-80
Simin makes some calls, but no one else is available to participate in the team. Since the product tank is filling up, she decides to continue with a team of two members.
It is not unusual for whoever happens to be in the control room to do the troubleshooting, especially in an emergency.
Define Sketch: Figure 9.21 will be used for troubleshooting. Simin should ask the operator if this drawing is up to
date. Visit: Both know the unit. The control room operator is not allowed to leave the room during his shift unless a replacement operator takes his responsibilities.
Process conditions: It appears as though the disturbance occurred immediately after the feed flow was reduced five percent. It disappeared when the flow is returned to its original value.
This is a valuable observation, but something else might have caused the disturbance.
5Ws and 1H Who: The control room operator made the feed rate
change and observed the behavior. What: This is not clear yet. We only know that many
measured variables experienced high frequency oscillations.
Where: Apparently, all of the variables in the process. When: This occurred when the operator decreased the
feed rate by 5%. When he returned to the original feed rate, the symptoms disappeared.
Why: Not known yet. How: The operator observed many measured variables
oscillating simultaneously.
Time-criticality: The issue does not appear time-critical because the major disturbance has been prevented, at least for now. Simin contacts the utilities operator to determine how long the plant can run at this elevated feed rate before the product tank is full.
The utility operator gives them eight hours to balance the production with the sales. If the flows in and out of the tank are not equal by then, some of the production must be diverted to fuel. Piping and valves exist for this procedure, but the economic loss will be very high.
Safe Park Not required yet. If required later, the safe park condition involves the diversion of part of the product stream to fuel. No spare tank is available.
Explore Fundamentals: Some of the fundamentals we will keep in mind include (i) combustion chemistry, (ii) heat transfer in the fired heater, (iii) fluid mechanics in the process piping and in the heater firebox and stack and in the packed bed reactor, and (iv) chemistry in the packed bed reactor. Also, we recognize the combustion process, which requires sufficient oxygen supply.
Check Measurements: Temperature TC-30 – An additional measurement device, T40, is located in the same thermowell. We find that these two sensors agree within about 1 C. We also observe that the temperature at the outlet of the reactor, T7, increases; this increase is delayed by the dynamics of the packed bed. Flow FC-3 – The feed flow can be compared with the product flow rate, F10. These agree within 1.5%. More importantly, the trend plots agree, showing the same percentage changes at the same times.

Operability in Process Design Chapter 9. Troubleshooting
9-81
Feed and product tank levels, L100 and L200, respectively – We expect that L100 should be decreasing, and that the decreasing trend should be larger magnitude when the feed flow rate was increased. These trends in L100 are confirmed qualitatively. Similarly, L200 seems to be behaving as expected. Controller status – We determine that all feedback controllers are in the “automatic” status, and no controller has its output (signal to the valve) at an upper or lower bound. Alarms – No alarms are active when Simin arrives at the control room. This result is consistent with the measured values. Causality: The key symptom is oscillations by many variables. Which variables could cause such behavior? Heater combustion control – No, this would not
affect upstream variables or product flow rate. Feed flow – Yes, the flow affects the process stream
pressures and temperatures and the combustion system, through the TC-30 feedback.
Feed delivery or product dispatch – No, the tanks separate these effects from the process.
This type of qualitative analysis can be very effective.
Opinion: No opinions have been expressed. Relevant changes: To this point, no recent changes have been discovered other than the feed rate changes.
Time sequence: The operator could not distinguish which, if any, variables started to oscillate before other variables.
Plan Hypothesis generation: 1. Unstable controller, any of the feedback PID
controllers in the process. 2. Hysteresis in control valve used in a feedback control
loop. 3. An oscillating disturbance to feed flow rate from
pump outlet pressure 4. Feed tank vortex and vapor entrainment in the feed
pump 5. Feed pump cavitation 6. Undesired adjustments to the isolation valves for heat
exchangers. 7. Unstable flame causing TC-30 measurement
oscillations.
This seems like a very short list. Remember to keep your mind open for additional hypotheses as you collect information. Perhaps, the small team has resulted in so few ideas.
Initial information: The initial information is listed below. a. The oscillations occurred when the feed rate was
decreased 5% b. The oscillations ceased when the feed rate was
returned to its original value c. All measurements oscillated at the same time. All?
Can any working hypotheses be eliminated by the initial information? 5. The feed tanks are at low temperature and have
operated this way for many years. Cavitation is not possible. (Unless the feed isolation valve is nearly closed.)
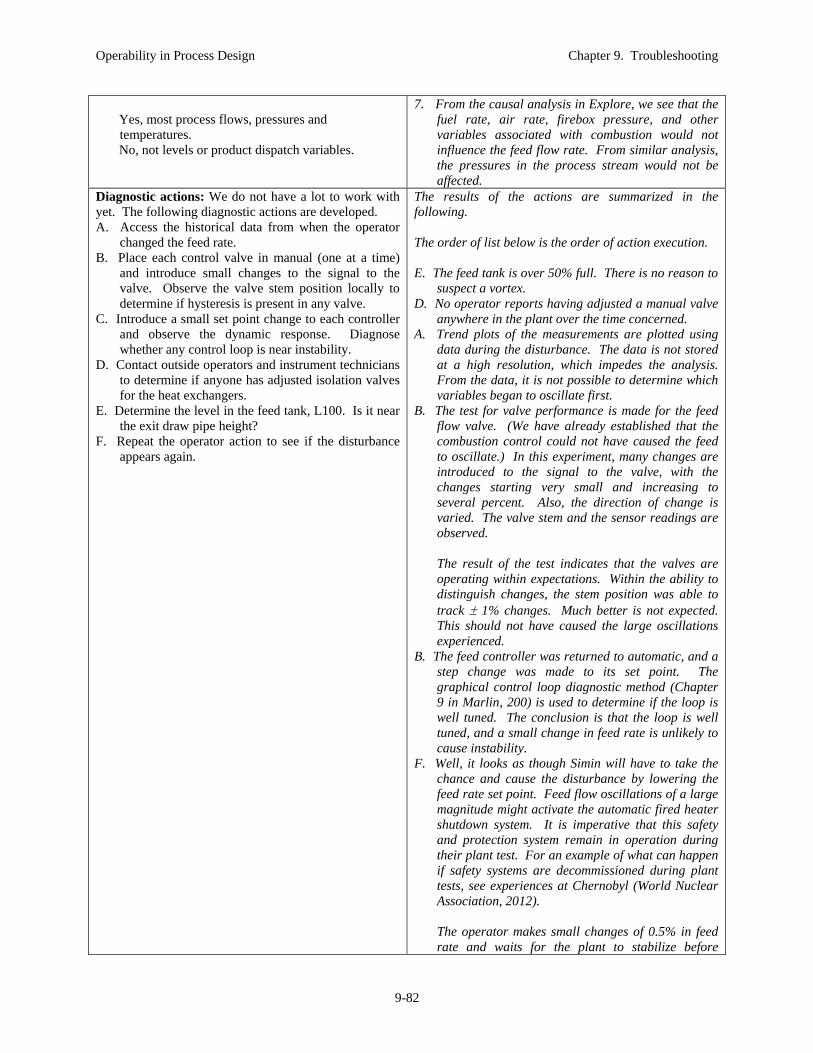
Operability in Process Design Chapter 9. Troubleshooting
9-82
Yes, most process flows, pressures and
temperatures. No, not levels or product dispatch variables.
7. From the causal analysis in Explore, we see that the fuel rate, air rate, firebox pressure, and other variables associated with combustion would not influence the feed flow rate. From similar analysis, the pressures in the process stream would not be affected.
Diagnostic actions: We do not have a lot to work with yet. The following diagnostic actions are developed. A. Access the historical data from when the operator
changed the feed rate. B. Place each control valve in manual (one at a time)
and introduce small changes to the signal to the valve. Observe the valve stem position locally to determine if hysteresis is present in any valve.
C. Introduce a small set point change to each controller and observe the dynamic response. Diagnose whether any control loop is near instability.
D. Contact outside operators and instrument technicians to determine if anyone has adjusted isolation valves for the heat exchangers.
E. Determine the level in the feed tank, L100. Is it near the exit draw pipe height?
F. Repeat the operator action to see if the disturbance appears again.
The results of the actions are summarized in the following. The order of list below is the order of action execution. E. The feed tank is over 50% full. There is no reason to
suspect a vortex. D. No operator reports having adjusted a manual valve
anywhere in the plant over the time concerned. A. Trend plots of the measurements are plotted using
data during the disturbance. The data is not stored at a high resolution, which impedes the analysis. From the data, it is not possible to determine which variables began to oscillate first.
B. The test for valve performance is made for the feed flow valve. (We have already established that the combustion control could not have caused the feed to oscillate.) In this experiment, many changes are introduced to the signal to the valve, with the changes starting very small and increasing to several percent. Also, the direction of change is varied. The valve stem and the sensor readings are observed.
The result of the test indicates that the valves are operating within expectations. Within the ability to distinguish changes, the stem position was able to track 1% changes. Much better is not expected. This should not have caused the large oscillations experienced.
B. The feed controller was returned to automatic, and a step change was made to its set point. The graphical control loop diagnostic method (Chapter 9 in Marlin, 200) is used to determine if the loop is well tuned. The conclusion is that the loop is well tuned, and a small change in feed rate is unlikely to cause instability.
F. Well, it looks as though Simin will have to take the chance and cause the disturbance by lowering the feed rate set point. Feed flow oscillations of a large magnitude might activate the automatic fired heater shutdown system. It is imperative that this safety and protection system remain in operation during their plant test. For an example of what can happen if safety systems are decommissioned during plant tests, see experiences at Chernobyl (World Nuclear Association, 2012).
The operator makes small changes of 0.5% in feed rate and waits for the plant to stabilize before

Operability in Process Design Chapter 9. Troubleshooting
9-83
making the next small change. Around 3% total change (the sixth step), the plant variables start to oscillate. From the high-resolution data (several samples per second), it is apparent that the feed flows and pressures are the first to begin oscillation. The disturbance is much smaller in magnitude than when a 5% change was made, but the operator does not want to risk equipment damage or shutdown, so he returns the feed flow set point to its original, higher value. Again, the disturbance disappeared.
These tests confirm the symptoms and their close association with the low feed rate. Apparently, none of the original hypotheses accounts for the information. So, the troubleshooters develop another set of hypotheses based on this information.
Second set of working hypotheses: 8. The flow controller cannot maintain stable flow at
lower rates because of sensor inaccuracy at low range of sensor span.
9. Either flashing or cavitation is occurring in the orifice plate, giving a rapidly fluctuating measurement.
Vaporization would influence the pressure difference being used by the orifice meter. Upon reflection, hypothesis 8 does not seem likely; the flow is well above 50% of sensor span.
Second set of diagnostic actions: G. Simin decides to calculate the bubble point for the
feed and compare with the pressure and temperature at the sensor location. (It is a good thing that she paid attention during her thermodynamics class.)
The bubble point is close to but higher than the current temperature, T10. From historical data, Simin determines that the bubble point was lower than T10 when the disturbances occurred. She also notes that T10 increases when the feed rate, F3, decreases.
Conclusion: As the feed rate decreases, the temperature T10 increases. Then, vaporization or cavitation is occurring in the orifice, which is creating high frequency fluctuations in the feed flow sensor. The feed flow controller responds by adjusting the feed flow rate, introducing higher frequency fluctuations in the flow, which propagates throughout the process.
The feed preheat exchanger is generally a good feature. It recovers energy from another process, thus reducing the fuel consumption in the fired heater. With the current design, no flexibility exists because the heat exchanger has no control; it recovers the most heat possible. The duty of the exchanger must be reduced.
Decision: The by-pass and isolation around the exchanger was provided for maintenance flexibility; therefore, it has manual valves. The duty can be reduced by partially opening the by-pass valve. The by-pass valve should be opened enough to prevent vaporization or cavitation in the orifice sensor. A feedback measurement is available through T10.
Do It Simin and the operator devise the following plan. i. Determine the bubble point as a function of
temperature and pressure. Prepare a graph showing the margin below the bubble point where the operator should maintain the temperature.
ii. Operating policy would be to have the outside operator periodically adjust the by-pass valve to maintain T10 near the value given in (i) above.
The operating policy is often termed “manual feedback control” of T10. The policy works! The operator is able to reduce the feed flow rate the required 5%.

Operability in Process Design Chapter 9. Troubleshooting
9-84
iii. If the symptoms appear again, open the by-pass valve further, until the symptoms disappear.
For the short term, Simin needs to document this
study. In addition, she must propose a change in the operating policies, gain acceptance through discussions with the operations manager and the management of change officer.
Look back and Evaluate Sustain and enhance: When cavitation or vaporization is a possibility, the flow sensor should be placed in the pipe where the pressure is the highest and temperature the lowest. Note the location of the flow sensor in Figure 9.22, which is before the preheater (lowest temperature) and upstream of the valve and exchanger (highest pressure).
This is a good long-term solution for the problem and should be implemented. If cavitation or vaporization is a problem in the feed valves, a further modification could be implemented to control T10. The design would provide automatic control of T10 by adjusting the ratio of flows through and bypassing the preheat exchanger.
Evaluate improvements: The operating window has been enlarged, allowing operation at lower production rates. There appears to be little downside for this modifications, other than the capital cost.
Professionalism: There appears to be no legal or ethical issues with this situation.
Future engineering practice: Simin should propose a change to the organization’s design guidelines. The possibility of vaporization or cavitation should be determined for liquid flow sensors using a flowsheeting program.
Figure 9.22. Improved feed flow design for Example 9.10 Frenetic Flow Rate.

Operability in Process Design Chapter 9. Troubleshooting
9-85
The troubleshooting team has done a good job. They recognized that a safe park was not required. They solved the problem quickly to avoid diverting some valuable product to a waste fuel stream. They determined the cause of the equipment problem, devised and tested an operating policy to achieve an intermediate state, designed modifications for the final state, and updated design manuals to prevent future occurrences of the problem.
We can learn the following lessons from this troubleshooting example.
In this section, three examples have demonstrated the power of the systematic troubleshooting method introduced in Section 9.3. All aspects of the method have been applied in the examples, and specific lessons have been emphasized. While examples are essential for learning troubleshooting skills, experience has shown that students often have difficulties with certain aspects of the method. Therefore, the next section delves deeper into these aspects.
9.5 Refining Troubleshooting Skills Now that the reader has the benefit of an overview of the entire troubleshooting method and its application to process industry problems, we can consider a few of the more challenging aspects in more detail. A few of the more difficult aspects to learn are addressed here, namely, cause-effect relationships, root cause definition, dealing with multiple faults, and decision making. 9.5.1 Cause-effect chains Normally, engineers think about a process behavior in a cause-effect manner. We consider a specific action or cause occurring in the process and apply process principles to predict the outcomes or effects of the action. As already discussed in this chapter, our troubleshooting thought process must work in reverse of the causal order. We are provided with symptoms from process data and are challenged to determine the cause(s). Engineers find it especially difficult to work from symptom to root cause in one step. This frustration is demonstrated in the cartoon in Figure 9.23, which is realistic, except that most professors are not this good looking. The professor is implementing one troubleshooting recommendation, the 5 Why’s. The recommendation is to ask, “Why” five times, so that the team works through the intermediate causes and ultimately determine the root cause. Naturally, “5” is an arbitrary number that serves to remind us that multiple “whys” are required.
Troubleshooters need to understand the operating window of every piece of equipment in the process, including instrumentation.
The process design that introduced heat integration lead to this problem. Better initial operability analysis would have avoided this poor design and plant operation.

Operability in Process Design Chapter 9. Troubleshooting
9-86
1 2
3 4
Figure 9.23. Cartoon depicting the advantages of identifying cause-effect relationships in a
stepwise manner and depicting them in a cause-effect diagram. The relationships between causes and the effects are often referred to as a causal chain, in which each intermediate effect acts as the cause for a subsequent effect. Let’s consider a continuous flow stirred tank chemical reactor (CSTR) that experiences a decrease in the yield of the valuable reaction product. When asked, “What is the cause?”, the engineer usually thinks through the situation in a stepwise manner, as shown in a causal chain in Figure 9.24. In the casual chain, the effect of a prior link becomes a cause in the following link. Naturally, the analysis in Figure 9.24 represents only one of many possible causal chains that the engineer must recognize and consider when solving the problem. Now, we will consider the concept of “cause” more thoroughly to distinguish the strength or certainty of the causal relationship. Three causal relationships are defined in the following (Wikipedia, 2012, Causality).

Operability in Process Design Chapter 9. Troubleshooting
9-87
Effect Cause
Low yield of valuable product High reactor temperature High reactor temperature Low coolant flow rate Low coolant flow rate Low cooling water pump head Low cooling water pump head Air entrained with liquid Air entrained with liquid at pump suction
Low level at base of cooling tower
Figure 9.24. A diagram of a typical causal chain showing how an effect can be considered a cause in the subsequent link of the chain.
For A C
Name Description Example
Necessary cause when ”C” occurs, “A” must have
preceded (with a 100% likelihood) When liquid overflows an open tank, a high liquid level must have preceded
Sufficient cause when “A” occurs, “C” follows (with a 100% likelihood)
When the vessel pressure is above the rated pressure, a failure will occur
Contributory
“A” makes possible the occurrence of “C”. The effect on likelihood is less than 100%.
When the tank overflowed, the operator was distracted by alarms in another section of the plant. The incident can occur when the operator is not distracted.
The category “contributory” is important; it refers to conditions that do not alone cause a
problem but contribute to the problem occurring when one or more additional conditions occur. Designating the additional condition as “B” which occurs (hopefully) infrequently with some probability distribution, we would say that when “B” occurs, the simultaneous occurrence of “A” increases the likelihood of the effect “C”. Another term often used is “probabilistic cause”. When a probabilistic cause occurs, the likelihood of the effect is increased. For example, the term “smoking causes cancer” can be interpreted as increasing the likelihood. Here, we will consider such causes to be contributory and seek to determine all contributory causes, so that we completely understand the causal chain. Actually, we will never completely eliminate the likelihood of the undesired event, but we can reduce the likelihood to an acceptable level. Some additional criteria apply to the cause-effect relationships. These are usually assumed, but we will state them explicitly here.
The way the world works
Troubleshooting thought process

Operability in Process Design Chapter 9. Troubleshooting
9-88
Temporal order – The cause occurs before the effect. Again, temporal order alone does
not prove causality. Underlying principle – Some underlying principle results in the causal relationship. In
the process industries, causal relationships can result for many principles, such as material and energy conservation, equilibrium, chemical kinetics, or a feedback controller.
Source – The source of the cause is not limited to actions by people or automation systems; for example, sources can be poor training or management, equipment failure, poor equipment design, unanticipated chemical interactions, and disturbances, including those outside of the influence of people.
9.5.2 Range of root cause investigation
When troubleshooting, we seek the root cause, but what is the meaning of root cause? The causal chain can be extended to very basic causes; should the troubleshooter continue until the most basic cause has been uncovered? To answer, let’s consider the troubleshooting task in a process plant.
Implicit in this statement is the assumption that the engineer can correct the cause and that the correction can return the process to its best operation. We have already acknowledged that the troubleshooting might have to stop at an intermediate state. This leads us to expect a limit in the causal chain to factors that can be influenced by the engineer at the plant. Therefore, troubleshooting has to stop at the last cause over which the team (including senior management) has authority. Thus, the root cause in the “Plan” stage and the corrective action in the “Do It” stage are related to the cause that can be directly and certainly affected by the troubleshooter. Let’s consider a quick example to clarify the limits of authority and how limits affect troubleshooting. Example 9.11. The broken valve stem – Suppose that a troubleshooter determines that a valve stem has broken. The valve could not be adjusted by the control computer or by the manual signal from the control room. In addition, the valve could go to the fail-unsafe position, depending on the design of the seat and plug. So, this is a serious fault. The immediate solution would be to place the controller in manual, isolate the control valve, temporarily achieve the desired flow using the manual by-pass valve, replace the stem, and place the control valve (and control loop) back in service. However, in the “Lookback and Evaluate” stage, the troubleshooter should take steps to (i) investigate whether the stem was properly selected to provide adequate strength, (ii) if yes, whether it was properly installed, (iii) if yes, determine whether alternative suppliers should be selected for future purchases, and (iii) inform the supplier of the faulty valve stem and ask for a response with an assurance that the quality will improve.
We seek to discover the cause whose correction will enable the process to return to its original, best operation.

Operability in Process Design Chapter 9. Troubleshooting
9-89
The manufacture of the valve is outside the authority of the troubleshooter at the process plant, but the acquisition of reliable equipment is within his/her authority. A responsible valve supplier would continue the troubleshooting investigation to determine the cause. Perhaps, the supplier determines that the steel used for manufacture was not within specifications. Then, the valve supplier could improve quality control procedures and perhaps, use a different source of steel. The steel company should be informed, so that it can continue the troubleshooting chain. Note that the process company can only influence limited aspects of the diagnosis and corrective actions. It works within its boundaries of authority to solve the problem and prevent recurrences in its facilities. Further steps in the causal chain have to be performed by other organizations. If they do not, they can lose business and risk legal penalties. Naturally, some causes can remain outside of the troubleshooters influence. Certainly, weather cannot be influenced. In addition, some very large companies or governments that supply raw materials could be immune from influence because of their economic might.
The schematic in Figure 9.25 shows
the three regions in which root causes can originate. The troubleshooter in a process plant must solve the problem within his/her range of authority. In addition, he/she must exert influence to improve conditions for the future. Finally, the troubleshooter must consider causes of problems completely outside of his/her influence, by providing barriers to achieve high safety and reliability and additional attenuating features to moderate the impact on plant operation.
Figure 9.25. Schematic of ranges of influence for
decision making. Causes over which we have no influence can lead to serious consequences, and responsible engineers must include barriers to protect the process and prevent the consequences. Examples of these causes include the weather (see the effects of a tsunami on Fukushima in INPO, 2011; Acton and Hibbs, 2102), an outage of electrical power (failsafe conditions are achieved with “zero power”) and in the previous example, poorly manufactured equipment (improve quality control and purchase from another supplier). In conclusion, we recognize that troubleshooting involves various depths of diagnosis and solutions. We have limited authority and may have to be satisfied with interim solutions that do not restore excellent performance and profitability. Even at the interim state, high reliability and excellent safety must be achieved. In some instances, a complete restoration of excellent profitability in the final state may require considerable creativity, time and investment.
Process troubleshooting should concentrate on solutions within the range of authority. After the problem has been resolved and plant operation restored, the troubleshooter can consider how to influence long-term future events.

Operability in Process Design Chapter 9. Troubleshooting
9-90
9.5.3 Multiple root causes Studies of severe industrial accidents have shown that some accidents have been caused by multiple root causes. When we use the term “multiple root causes”, we are not considering the intermediate causes in a causal chain, as in Figure 9.24. By “multiple root causes”, we mean more than one independent root cause that occur simultaneously and contribute to the accident. Since faults are thought to be unusual, having many simultaneous faults might seem highly unlikely. However, experience shows that many faults can occur. Perhaps, the faults are not truly independent; for example, a poorly managed company can design poorly, train people poorly, maintain equipment poorly, and allow poor operating policies. Let’s consider an example of a real accident with multiple faults. Example 9.12. BP Texas City Filled Distillation Tower – During a unit startup at the BP Texas City refinery in 2005, a series of faults lead to an explosion that killed 15 people. Here, we will consider one contributing factor to the accident, i.e., the over filling of a distillation tower with liquid hydrocarbons. A sketch of the process is given in Figure 9.26. The startup required that (1) feed be sent to the distillation tower, (2) when sufficient liquid was present in the bottom of the tower, the reboiler would be placed in operation, (3) when sufficient liquid was present in the overhead drum, reflux flow would be started, (4) when the compositions were achieved, the product flows would be directed to product tanks. Unfortunately, the bottoms flow rate was maintained (incorrectly) at zero while liquid feed continued for a substantial period of time. The hydrocarbon filled the entire tower, caused a high pressure, escaped from the tower via the pressure relief, was released to the environment and exploded. Further details are provided at the Chemical Safety Board Web site (CSB, 2007). An analysis of the scenario indicates that seventeen causes combined to result in the tower overfilling. These causes are summarized in Table 9.10. Of these causes, two causes are “normal conditions” during the early part of the startup, continuous feed and low reboiler duty. The remaining fourteen causes are faults. How could fourteen faults suddenly occur at the same time? The answer is that many did not spring into existence immediately. Eleven of the causes existed for a long time, i.e., they were latent in the process, some for months or years. Because not all causes required for an accident were present, an accident did not immediately occur as these eleven faults slowly accumulated. Why did they accumulate? They resulted from extremely poor plant management, design, maintenance, and operation. On 2005, operator errors introduced the four remaining causes during the startup, and the tower filled with liquid hydrocarbons. The occurrence of four simultaneous causes is not typical, but like four heads in a row when flipping a coin, it is not highly unlikely either.
Multiple faults can lead to serious accidents. Many latent faults can exist in poorly managed processes. The occurrence of one or a few additional independent faults can compound a dangerous situation and lead to an accident.

Operability in Process Design Chapter 9. Troubleshooting
9-91
Figure 9.26. Distillation tower that was filled with liquid during the BP Texas City accident.
(CSB, 2007) Table 9.10. Summary of causes for that lead to the tower overfilling in the BP Texas City
Accident Normal operation New faults Latent faults*
Continuous feed to tower Low reboiler duty
Level controller on bottoms inventory placed in manual (should have been in automatic)
Level controller output signal results in zero bottoms product flow
Operator seemed confused and did not use a systematic troubleshooting method
When problem recognized, the operator had to make a hasty decision. Unfortunately, the action made the situation worse.
Too few control room operators Supervisor not present Operator overloaded, startup one
unit while operating others Poor operator training Level sensor faulty – not
calibrated for correct fluid density Level sensor not compensated for
temperature Work order for level sensor
falsified Level alarm sensor not
functioning Level sight glass fouled No pressure difference sensors in
tower sections No pressure sensor at bottom of
tower * Latent faults had been present for a long time. These contributory causes had been recognized and had not been
corrected. See CSB report (CSB, 2007)

Operability in Process Design Chapter 9. Troubleshooting
9-92
Identifying one root cause can be very challenging. Identifying many root causes is extremely demanding and can be overwhelming. Naturally, competent and ethical engineers strive to eliminate latent faults through good design practices, HAZOP and other PHA studies, and thorough management of change analysis. However, multiple faults occur, so let’s consider troubleshooting them. In the Troubleshooting method, we brainstorm to identify all candidate causes, which are conditions that could lead to the symptoms observed. Then, we apply the current information and define additional diagnostic actions to eliminate candidates until the root cause is found. This procedure works well when the number of candidates is small, but it is unworkable when the number of candidates is very large.
Unfortunately, the number of candidates becomes very large when considering multiple faults. Let’s consider a case in which any one fault will cause the final outcome, and any combination of faults will also cause the same final outcome. This situation would appear in a cause-effect diagram as a set of multiple faults to an inclusive OR with the output being the outcome. The troubleshooter has to consider all possible causal combinations, such as all combinations of two causes, all combinations of three causes, etc. A plot of the number of all candidate working hypotheses versus the number of possible causes is given in Figure 9.26. As the number of root causes increases, the troubleshooting method needs to be modified. There is no single, accepted approach for multiple causes, but a workable approach is presented here. This approach takes advantage of the shape of the typical cause-effect diagram, which narrows significantly from the root causes (on the right) to the ultimate outcome or effect (on the left). Therefore, we begin by concentrating on intermediate causes. (Recall that intermediate
Figure 9.26. The number of combinations of working hypotheses to be investigated for the number of possible causes, where any one or more of the causes can result in the observed symptom.

Operability in Process Design Chapter 9. Troubleshooting
9-93
causes are also intermediate effects of prior causes in a cause-effect chain.) These intermediate causes can be selected as candidates for initial investigation using current information and diagnostic actions, as needed. Naturally, a few root causes could be added to the candidates if the troubleshooter judged them to highly likely and time-critical. This modification of the troubleshooting approach is designed to “pare the tree” quickly, thus reducing the number of root causes that need to be considered.
The modification is appropriate when a large number of multiple faults are possible. The modification relies on measureable symptoms for the intermediate causes (effects).
Therefore, the design engineers must understand the troubleshooting complexity and provide adequate sensors to provide information in critical branches of the cause-effect diagram.
The modification is effective when several of the branches of the cause-effect tree do not contain faults, i.e., active root causes.
The modification can be effective for time-critical situations when an action to remove the time-criticality (e.g., plant shutdown, production rate reduction, reactor temperature decrease) can be based on the intermediate cause (effect).
The second step of the modification is to seek symptoms that are different for different root causes. This entails “drilling down” into the sub-tree branches remaining after the first step to isolate the existing faults in the sub-tree. There is no guarantee that the second step will conclude with a definitive conclusion on all possible root causes. As in any process problem, a definitive diagnosis might not be possible using easily available data. Expensive and time-consuming actions might be required, including shutting down the process, purging and opening equipment for inspection, and replacing equipment before analyzing the failed part. We try to avoid the most expensive actions through alternatives, such as gamma scanning or tracer testing, where appropriate. These methods are discussed in Section 9.6.2. Example 9.13 – Diagnosing multiple faults. Let’s look at the application of the modified trouble shooting approach to the cause-effect diagram from the Drooping Temperature Example 9.2. The diagram is repeated in Figure 9.27 for convenience. We note the large number of “OR” logic gates in the diagram, which indicates that only one root cause or many simultaneous root causes could be present when the final effect (high fuel flow) is observed. Step one: We could begin with all of the inputs to the last “OR” gate on the left, nearest to the effect. Here, we will consider one of these intermediate causes, a high output from controller TC-30. Is this true or false? The controller output signal value can be read on the controller display. When this is determined, it is reading 84 percent open. According to the operator, who has been monitoring this unit for years, this is an abnormally high value. We conclude that this path could contain a root cause and continue to dig deeper. Step two: Now, we investigate all possible causes in this branch. We find the flowing

Operability in Process Design Chapter 9. Troubleshooting
9-94
Figure 9.27. Cause-effect diagram for one symptom in the Drooping Temperature Example 9.2.
TC-30 is in the “automatic”, not “manual”, status The temperature measurement is within its span; therefore, the wire is not broken Check with technicians confirms that the thermocouple is not being calibrated The temperature measurement is below its set point and continuing to decrease; the
temperature controller appears to be functioning properly The troubleshooting would continue with the other branches in steps one and two until the root cause(s) were identified.
Diagnosing multiple root causes is a challenging task. Processes and equipment should be designed with aids, such as sensors, to distinguish between possible multiple root causes.
Operability in Process Design Chapter 9. Troubleshooting
9-95
9.5.4 Decision making Perhaps, the most challenging tasks have been completed when the root causes have been determined. However, the choice of solution also requires skills and knowledge. The decision-making process must begin with a concise statement of the goals to be achieved.
Be as specific as possible, Give important limitations for investment, operating cost, personnel changes, etc., Define performance specifications, such as product quality variance, Define safety specifications, which would typically be the mitigated event likelihood
appropriate for the event (problem) consequence; see Chapter 5 on safety, and Describe the improved performance for the disturbance experienced.
Since numerous solutions exist for most root causes, the troubleshooter begins by developing a list of candidate solutions, which can be done using a brainstorming session or any other suitable technique. The decision-making method provides an approach to compare the candidates and select the best solution. Solutions to most problems have many attributes, and often, each solution will have advantages for some attributes and disadvantages for others. For example, a candidate solution might have a lower initial capital cost but require more maintenance and be less reliable. Therefore, a decision-making method has to resolve the advantages and disadvantages for all candidates to conclude with a best candidate. A commonly used approach for selecting from candidates with multiple attributes is some form of “matrix analysis”. Here, we will consider three categories of attributes, (i) Requirement, (ii) Profitability analysis, and (iii) Pugh analysis for Additional Criteria that could influence the decision (Pugh, 1991). The approach is shown in Table 9.11. The decision-making method begins by identifying all candidate solutions along with all relevant attributes. These attributes should include all measures of success (and failure) of the candidate solutions. Then, the attributes are divided into the three categories, Requirements, Economic, and Additional factors. When defining these categories, one should include in the Requirement only attributes that are absolutely necessary. For example, a Requirement is not likely to be “low investment”, because a higher investment alternative might yield a higher economic return on investment. However, a limit on capital investment can be required because any candidate involving capital costs over the maximum must be eliminated. Naturally, every successful candidate must satisfy the Requirement attributes, so that any candidate that does not is discarded. Before discarding the candidate, the troubleshooter can attempt to modify the candidate to satisfy all Requirement attributes. This might involve additional investment or a more substantial re-engineering of the candidate. The remaining attributes can have differing evaluations, from poor to excellent, and no individual attribute evaluation can cause a candidate to be eliminated or selected. Therefore, an easily compared evaluation is required for each candidate. Developing a scalar value for evaluation from a vector of attributes requires combining the attributes. The most natural scalar measure for engineering problems is economic return on investment, especially since the Requirement attributes have already been evaluated. The second category of this decision-making approach involves a number of “economic-based” attributes, as shown in Table 9.11.
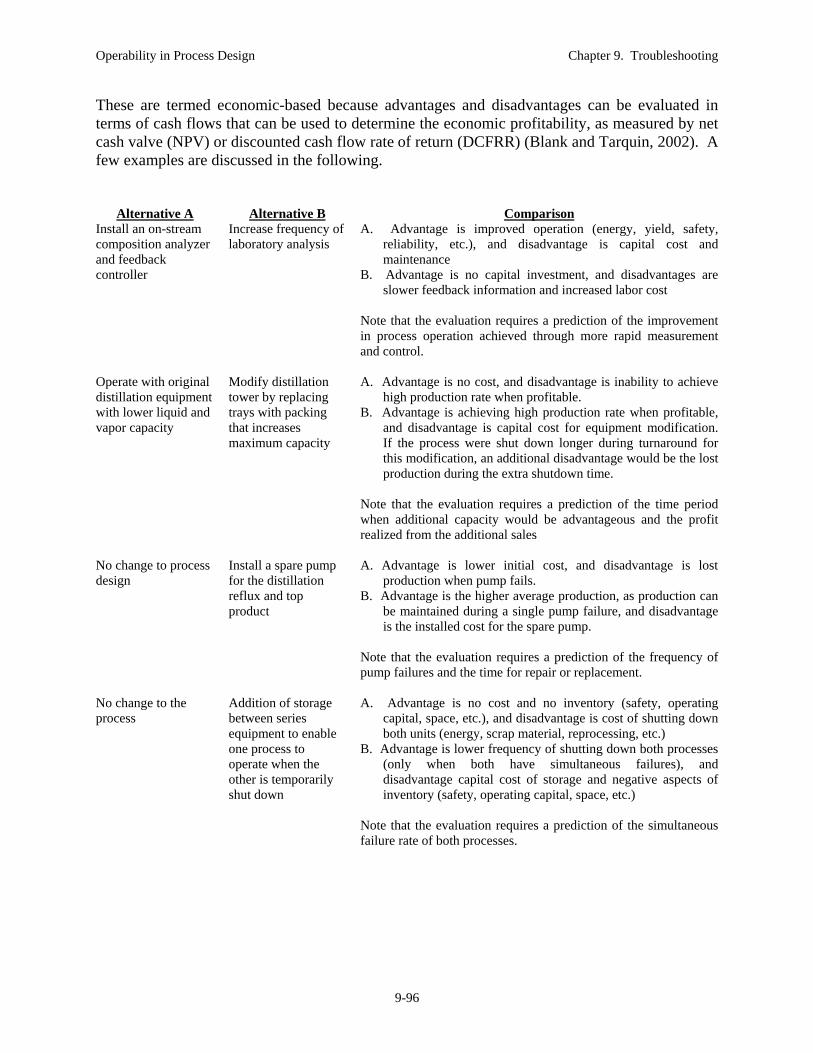
Operability in Process Design Chapter 9. Troubleshooting
9-96
These are termed economic-based because advantages and disadvantages can be evaluated in terms of cash flows that can be used to determine the economic profitability, as measured by net cash valve (NPV) or discounted cash flow rate of return (DCFRR) (Blank and Tarquin, 2002). A few examples are discussed in the following.
Alternative A Alternative B Comparison Install an on-stream composition analyzer and feedback controller
Increase frequency of laboratory analysis
A. Advantage is improved operation (energy, yield, safety, reliability, etc.), and disadvantage is capital cost and maintenance
B. Advantage is no capital investment, and disadvantages are slower feedback information and increased labor cost
Note that the evaluation requires a prediction of the improvement in process operation achieved through more rapid measurement and control.
Operate with original distillation equipment with lower liquid and vapor capacity
Modify distillation tower by replacing trays with packing that increases maximum capacity
A. Advantage is no cost, and disadvantage is inability to achieve high production rate when profitable.
B. Advantage is achieving high production rate when profitable, and disadvantage is capital cost for equipment modification. If the process were shut down longer during turnaround for this modification, an additional disadvantage would be the lost production during the extra shutdown time.
Note that the evaluation requires a prediction of the time period when additional capacity would be advantageous and the profit realized from the additional sales
No change to process design
Install a spare pump for the distillation reflux and top product
A. Advantage is lower initial cost, and disadvantage is lost production when pump fails.
B. Advantage is the higher average production, as production can be maintained during a single pump failure, and disadvantage is the installed cost for the spare pump.
Note that the evaluation requires a prediction of the frequency of pump failures and the time for repair or replacement.
No change to the process
Addition of storage between series equipment to enable one process to operate when the other is temporarily shut down
A. Advantage is no cost and no inventory (safety, operating capital, space, etc.), and disadvantage is cost of shutting down both units (energy, scrap material, reprocessing, etc.)
B. Advantage is lower frequency of shutting down both processes (only when both have simultaneous failures), and disadvantage capital cost of storage and negative aspects of inventory (safety, operating capital, space, etc.)
Note that the evaluation requires a prediction of the simultaneous failure rate of both processes.
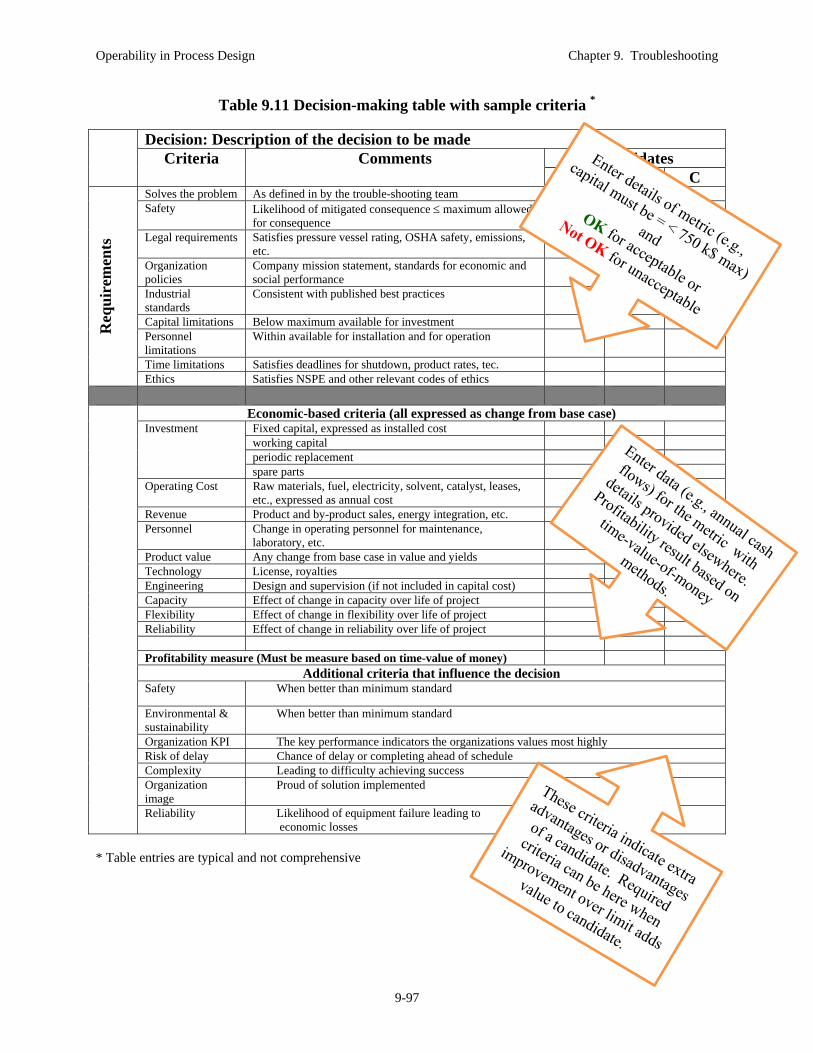
Operability in Process Design Chapter 9. Troubleshooting
9-97
Table 9.11 Decision-making table with sample criteria *
Decision: Description of the decision to be made Criteria Comments Candidates
A B C
Req
uir
emen
ts
Solves the problem As defined in by the trouble-shooting team Safety Likelihood of mitigated consequence maximum allowed
for consequence
Legal requirements Satisfies pressure vessel rating, OSHA safety, emissions, etc.
Organization policies
Company mission statement, standards for economic and social performance
Industrial standards
Consistent with published best practices
Capital limitations Below maximum available for investment Personnel limitations
Within available for installation and for operation
Time limitations Satisfies deadlines for shutdown, product rates, tec. Ethics Satisfies NSPE and other relevant codes of ethics
Economic-based criteria (all expressed as change from base case) Investment Fixed capital, expressed as installed cost
working capital periodic replacement spare parts
Operating Cost Raw materials, fuel, electricity, solvent, catalyst, leases, etc., expressed as annual cost
Revenue Product and by-product sales, energy integration, etc. Personnel Change in operating personnel for maintenance,
laboratory, etc.
Product value Any change from base case in value and yields Technology License, royalties Engineering Design and supervision (if not included in capital cost) Capacity Effect of change in capacity over life of project Flexibility Effect of change in flexibility over life of project Reliability Effect of change in reliability over life of project Profitability measure (Must be measure based on time-value of money)
Additional criteria that influence the decision Safety When better than minimum standard
Environmental & sustainability
When better than minimum standard
Organization KPI The key performance indicators the organizations values most highly Risk of delay Chance of delay or completing ahead of schedule Complexity Leading to difficulty achieving success Organization image
Proud of solution implemented
Reliability Likelihood of equipment failure leading to economic losses
* Table entries are typical and not comprehensive
Operability in Process Design Chapter 9. Troubleshooting
9-98
The final category of attributes, Additional criteria, are important but cannot be expressed in economic terms. Examples of these non-economic criteria are also given in Table 9.11. These criteria are explained thoroughly in the decision table. The importance of each on the final decision is not quantified, and the proper influence of each depends on the judgment of the person or team making the decision. In some versions of the Pugh method, a score is given to each of these “non-requirement” attributes and the sum of the scores for each candidate is used as a measure in this category. The interested reader can investigate matrix methods for multi-attribute decision making in Pugh (1991, Burge (2002), and National Research Council (2007). The completed analysis excludes candidates that violate one or more requirement attributes. It provides a profitability estimate for remaining candidates, as well as an evaluation of each additional criterion. If the economics and additional criteria all favor a consistent candidate, the decision is straightforward. If different candidates have advantages in the economics and additional criteria, the engineer must use judgment in evaluating the balance between economic return (in the base case estimate) and the risks associated with Additional criteria (which might lead to serious losses if low probability deficiencies occur). Example 9.14. Drooping Temperature – In the Drooping Temperature Example 9.2, many longer-term solutions are possible. Here, we will select a solution from several candidates using the decision-making method. First, we need to state the goal of the long-term solution.
The four alternative solutions are given in the following. A. No equipment modifications, change written operating policy B. No equipment modifications, increase manual sampling and laboratory analysis of the
fired heater flue gas and update operating policy presented in formal training sessions. Operate high percent oxygen at 5%.
C. Install an on-stream analyzer measuring flue gas oxygen for display to the operator and high oxygen alarm. Install an air/fuel ratio controller. Train operators. Operate moderate percent oxygen at 3.5%
D. Install an on-stream analyzer measuring flue gas oxygen and carbon monoxide analyzer and a cross-limiting control strategy as shown in Figure 9.18 that automates air/fuel ratio and feedback flue gas control. Alarms are included in the design for low oxygen and high carbon monoxide. Train operators. Operate at low oxygen, about 1.5-1.75% depending on air leakage.
A summary of the solution is presented Table 9.12. A discussion of the analysis and assumptions are given in the following.
The solution must reliably ensure excess oxygen in the fired heater flue gas, which includes transient operation when the airflow rate might decrease due to equipment faults. The solution must adhere to company-wide safety guidelines, not require more than 250 k$ capital investment, and not require additional operations staffing.

Operability in Process Design Chapter 9. Troubleshooting
9-99
Table 9.12 Decision-making table for Example 9.14. Decision: Long-term solution for the Drooping Temperature Example
Criteria Comments Candidates A B C D
Req
uir
emen
ts
Solves the problem As defined in by the trouble-shooting team
OK OK OK OK
Safety (entry is likelihood of incident)
(1) maximum allowed frequency of consequence for scenario <= 10-3
incident/y
10-1 Not OK
10-2 Not OK
5x10⁻⁴ OK
< 1x10⁻⁴ OK
Legal requirements No specific OK OK OK OK Organization policies
Company mission statement
OK OK OK OK
Industrial standards
Published best practices Not OK OK OK OK
Capital limitations Maximum available for investment = 250 k$
OK OK OK OK
Personnel limitations
Available for installation and for operation
OK OK OK OK
Time limitations Deadlines for shutdown, product rates, tec.
OK OK OK OK
Ethics Satisfies NSPE OK OK OK OK
Economic-based criteria (Base case values; see discussion for sensitivity analysis)
Capital Investment Installed analyzer and controls
x x $ -20,000 $ -35,000
Operating (2) Efficiency increase from 5% excess oxygen as base case
x x $ 35000/y $ 70000/y
Personnel Maintenance x x -2000/y $ -7000/y Product value Not applicable x x 0 0 Technology Licensing, etc. x x 0 0 Engineering Included in investment cost x x 0 0 Capacity Could process more feed if
operating at max. air flow x x 0 0
Flexibility The cross-limiting has improved dynamics
x x 0 0
Reliability (3) Cross limiting better, no credit taken here
x x 0 0
Profitability measure (Net Present Value) x x 107 k$ 225 k$
Additional criteria that influence the decision Safety Lower frequencies are
advantageous x x Acceptable Better
Environmental & sustainability
Lower air results in lower CO2
x x Better
Organization KPI Not applicable x x ------ ------
Risk of delay Cross limiting requires outside engineering
x x Better
Complexity Cross limiting is more complex
x x Better
Organization image
Lower emissions is desirable
x x Better
1. Relatively high maximum frequency used for purpose of the exercise; likely lower frequency used in practice. 2. Efficiency benefits are determined from the highest percentage oxygen of all cases, 5%. Reduced excess air increases
efficiency, as long as sufficient oxygen is available at the flame for complete combustion. Entry has units of $/y. 3. Cross-limiting air/fuel ratio is more reliable in preventing oxygen deficiency, but the economic benefit is difficult to estimate

Operability in Process Design Chapter 9. Troubleshooting
9-100
Economic-based Criteria
Data and assumptions for the economic analysis are - The heater has a nominal fuel fired rate of 100 GJ/h - There are 8760 h/y - The fuel value is taken as $ 4/GJ - The project life is 15 years - The installed analyzer costs $20,000. The analyzer life is eight years, and salvage value
is zero after 2 years. - An additional cost of $15,000 is required to design and install the cross-limiting air/fuel
controls and flue gas composition controls. - Analyzer for display requires $2,000/y maintenance; analyzer used for control requires
maintenance of $7,000/y - The change in thermal efficiency from base case candidate B (5% oxygen) is 1% for
Candidate C (3.5% oxygen) and 2% for candidate D (1.75% oxygen) - The company interest rate is taken as 15% (Interest rate is also known as the MARR, minimum acceptable rate of return) - The income tax rate is 35% - Depreciation is straight-line with the ½ rule on the first year in service - No inflation is included
Base Case results - Both Candidates C and D have positive net present values (NPV);
therefore, each is better than the “do nothing” default alternative. Is the additional investment in Candidate D justified by the increased NPV? Applying the method for comparing economic alternatives, the alternative among mutually exclusive options with the highest NPV is most attractive (Blank and Tarquin, 2002). Thus, Candidate D is preferred in the base case.
Sensitivity Analysis - Using 25% uncertainty for both capital costs and 15% uncertainty for benefits, the worst-case profitability can be determined using the higher cost and lower revenue values. The worst-case NPV are 88 k$ for Case C and 187 k$ for Case D. In addition, the worst-case NPV for Case D is over 73 k$ when the fuel price drops to 2 $/GJ. These excellent sensitivity analysis results demonstrate the strength of the economic attractiveness for Candidate D.
Conclusion: Candidate D is preferred on an economic basis. Additional criteria (Non-economic-based)
Candidate D has an advantage in safety and environmental, and Candidate C has an advantage in simplicity.
Here, we will judge that candidate D has a slight advantage for the non-economic criteria.

Operability in Process Design Chapter 9. Troubleshooting
9-101
The explanation and example in this sub-section has concisely presented a systematic decision-making method. It is general and can be tailored to many types of decisions. A few additional comments are provided in the following.
The method is not guaranteed to produce the best, or even a good, solution. The knowledge, creativity, and resourcefulness of the troubleshooting team have a lot to do with success. However, the team will generally produce better results using this method.
What if no solution is found? First, the Requirement criteria should be reevaluated. Perhaps, the requirements are too restrictive. For example, if the problem involves eliminating a hazardous situation, a Requirement criterion should not require a profitable solution, i.e., a solution with a positive NPV. If the criteria were sound, the second step would be to broaden the search for additional solution candidates. Perhaps, the initial candidates did not consider improvements involving changes in materials of construction, process structure, or process chemistry. No company desires making large investments to solve problems, but when the situation includes potential hazards, the process should not be operated until the money has been spent and the problems solved. An example of the terrible (deadly) consequences of not solving known process problems is given in the report of the BP Texas City accident (CSB, 2007).
The criteria in Table 9.12 are not comprehensive. The troubleshooting team will certainly need to tailor and enhance the criteria for individual problems.
A criterion can appear in several categories, as safety did in Example 9.14. The minimum requirement is given in the requirement category, and performance beyond the requirement threshold can be given credit in either (or both) of the categories, as appropriate.
Most decision-making methods conclude with a review. Recall that the Evaluate stage of the troubleshooting method included a review of sustaining improvements, evaluating improvements, professionalism, and engineering practice. In the economic analysis, sensitivity analysis is essential. One of the more widely applied reviews uses the acronym SWOT for strengths, weakness, opportunities, and threats (Mindtools, 2012a). Let’s apply SWOT to the Drooping Temperature Example.
Example 9.15 SWOT for Drooping Temperature Example.
Strengths – The solution provides excellent regulatory process control using the cross-limiting approach to ensure excess oxygen during transients. The flue gas composition control provides both oxygen and carbon monoxide control, because oxygen is zero when
Based on the analysis in Table 9.12, Candidate D is strongly recommended. Candidate D satisfies all Requirement criteria, is basically equivalent to Candidate C in non-economic Additional criteria, and has the largest positive NPV, indicating that it is the most financially attractive investment.

Operability in Process Design Chapter 9. Troubleshooting
9-102
air deficient and carbon monoxide is nearly zero when air is in excess. The alarm on these measurements adds additional protection.
Weaknesses – The control design is complex, which will be challenging for the operating personnel. In response, a good training program should emphasize the commissioning and decommissioning (turning on and off) of the controls, which operators will do frequently. It should be emphasized to operators that manual operation of the heater controls can be achieved by adjusting the temperature and flue gas controller outputs, thus retaining the advantages of the cross-limiting control.
Opportunities –Lowering the excess air will decrease the fuel consumption and thus, the generation of CO2. In addition, the generation of NOx will be reduced. An opportunity involves expanding the project to include NOx reduction using NOx-reducing burners and/or flue gas recycle. We may be able to turn this into a “sustainability” project and improve the company’s image!
Threats – The design is complex, especially the cross-limiting control. A threat is failure due to errors and unreliable implementation of the complex controls. In response to this threat, the project should ensure that an expert in combustion control designs and implements the control system and that it has been thoroughly tested before process startup. If the organization’s personnel do not have this expertise, a qualified consultant should be hired.
This sub-section addresses the important issue of decision making. A systematic method has been presented for decision making based on the diagnosis of troubleshooting in a process plant. As presented, the method requires some time, which might not be available in all situations.
Time-critical problems – The immediate actions for time-critical problems should be defined and practiced in training sessions. Operators need clear directions on diagnosing these problems and deciding on the appropriate, severe action, such as reducing production rate, changing to a “total recycle”, diverting off-specification-products to waste storage/destruction, or shutting down the process.
Moderately expeditious problems – Often, the Plan stage of troubleshooting is performed when a process is not operating as desired and a significant economic loss is being incurred. Pressure exists to solve the problem rapidly. Therefore, the thorough written decision-making method is not typically applied. However, the principles and thought patterns can be used to guide the team to a good, short-term solution.
Long-term solution – The decision-making method should be applied to all solutions when time is available, as it is when preparing long-term solutions in the Lookback and Evaluate stage.
To this point in the chapter, the emphasis has been on troubleshooting an existing process. The examples and discussion have demonstrated the need for information, both initial and from diagnostic actions, to enable the troubleshooter to understand the situation and determine the root cause. Will this information always be available? Not unless the process is properly designed; this is the topic of the next section.

Operability in Process Design Chapter 9. Troubleshooting
9-103
9.6 Designing Processes for Troubleshooting Designing a process to accommodate faults might seem like admitting defeat. Why not design to eliminate all faults, so that it will operate without major upsets? Well, we always design processes to reduce the likelihood of faults, but complex industrial systems and human operators are not one hundred percent reliable. In addition, some major causes are outside of our authority. Therefore, we have to anticipate problems and design for them. 9.6.1 Measurement guidelines for common sensors Measurements are required for safety, process control and product quality. These sensors will also aid troubleshooting, but alone they will provide an incomplete picture of process conditions. Therefore, the process design should include measurements that are explicitly provided to assist the plant operators in monitoring and diagnosing the equipment. Some general goals for these additional measurements are given in the following.
Enable the operators to identify incipient problems, thus providing time to cure a manageable problem before it develops to a major accident. An example measurement of flows and temperatures in a single or multiple heat exchangers. The data can be used to estimate the heat transfer coefficients. By monitoring these estimates, fouling can be determined and an economical cleaning program implemented.
Provide redundant and diverse sensors that enable operating personnel to diagnose faults in the sensing equipment. This is a common design practice for forward-thinking companies. In many cases, the redundant sensor is displayed locally to reduce its cost, although digital and wireless signal transmission may change this approach.
Measure variables that under normal situations are not needed to be measured but allow process diagnosis when deviations from normal conditions occur. An example is pressures in piping and equipment that are used to diagnose the location of an unexpected restriction to normal flow.
Monitor process controller outputs, i.e., signals to actuators, which provide useful
information for diagnosis. These outputs can be observed on standard control system displays, although the values are not routinely stored in a history database for recall. They should be! Remember that the signal from the controller to a valve might not be the valve stem position, because of calibration errors, stiction, and more serious transmission and valve faults.
An example is in the Drooping Temperature example, in which the fuel flow was
increasing. The observation was confirmed by the data on the TC-30 controller output, which was also increasing.

Operability in Process Design Chapter 9. Troubleshooting
9-104
9.6.2 Introduction to extraordinary measurements for troubleshooting Standard real-time sensor methods and instruments provide a basis for plant operation and in many cases, sufficient information for monitoring and diagnosis. However, process equipment is complex, and situations occur where standard sensors are not adequate. Here, we will introduce just a couple of extraordinary measurement methods used in process plants. Radiological scanning – Process equipment is constructed of opaque materials and covered in insulation; as a result, we cannot see inside most plant equipment. One method for learning about equipment internals is to shut down the equipment, so that it can be opened and observed. Gamma scanning provides an option between continuous sensors and shutting down the process for inspection, because it enables us to “look inside” of the tower and diagnose mechanical condition of internals and flow conditions (Robbins, 2005). A source of radioactive material on one side of a tower provides a source of gamma radiation that penetrate the tower, and the intensity of the rays measured at receiver located at the opposite side of the tower provides an indication of the density of materials between the source and receiver. The intensity at the received radiation depends upon the amount and density of material in the path.
Fixed source – In fixed source (sealed) applications, the source is located outside the equipment and the detector is located outside near the opposite surface. The source provides gamma radiation, and the method is typically called “Gamma Scanning”. This non-intrusive measurement can be performed while the equipment is in normal operation and can provide information on the location of liquid, vapor, foam, and on the status of tower internals, i.e., trays, packing, and flow distributors. An example of the diagnostic results possible with this method is shown in Figure 9.28 with further details available in Abdullah (2005). This is an expensive and time-consuming measurement performed by consulting companies. The equipment must be installed for the test measurements and operated by skilled personnel. However, it is a valuable analysis tool that can pinpoint some faults and enable the engineer to prepare spare parts or design modifications without a shutdown for diagnosis. An interim solution might be achieved by changes to operating conditions. However, the solution might require a shutdown to, for example, repair damaged trays, but the shutdown would be of much shorter duration because of the prior diagnosis and thorough preparation.
Unsealed source- Unsealed sources are injected into process streams and the disposition of the material is determined by measuring the radiation as the fluid proceeds through the process. The location and concentration of the tracer provides information on flow patterns in the equipment, which can be used in troubleshooting. Common examples include determining fluid velocity (where flow sensors are not installed), distribution where a flow splits to many paths, residence time distributions in vessels (especially reactors), and leak detection (including heat exchangers). For details, refer to IAEA (2009).

Operability in Process Design Chapter 9. Troubleshooting
9-105
Figure 9.28. Gamma scanning diagnostics possible for a distillation tower. (from Abdullah (2005))
Operability in Process Design Chapter 9. Troubleshooting
9-106
Thermal scanning – Typical contact temperature sensors like thermocouples and RTD devices cannot be used at very high temperatures, such as tube walls in boilers and fired heaters. Excessive temperatures can damage these pipes, even though they are fabricated to operate at high temperatures. Typically, these pipe walls are monitored periodically using an optical pyrometer (Omega, 2012). The operator scans the entire pipe looking for the maximum temperature. Plant operating conditions are adjusted to maintain the maximum below a limit that provides acceptable equipment life. Adjustments can be made to the fuel fired and if multiple burners are present in the firebox, to the proportion of fuel consumed in each burner. Leak testing – A common method for determining small leaks is to coat the potential leak source with a soapy liquid. Bubbles form if vapor is escaping from the closed equipment. Laboratory analysis – Let’s not forget the onsite laboratory that performs many crucial analyses, some at a very low frequency. The troubleshooter can call upon the laboratory to perform key analyses quickly on materials sampled from the process. These examples of extraordinary measurements are far from exhaustive. They are provided to demonstrate the immense scientific creativity possible when the demand exists. The readers are encouraged to seek relevant troubleshooting measurements useful for the processes and equipment encountered during their careers. These general guidelines and knowledge of typical faults in Section 9.6.1 and the extraordinary measurements in this section provide the basis for diagnostic measurements for standard unit operations. Distillation is discussed in the next sub-section. 9.6.3 Distillation tower Let’s look at a typical, two-product distillation tower to develop a basic set of sensors for monitoring and troubleshooting. To operate the tower, the following sensors are required to regulate production rate and inventories.
Pressure (vapor inventory) – pressure sensor Liquid inventory – Level sensors for the overhead reflux drum and the bottoms product
accumulator. (At least two per vessel, one for control and one for alarm) Flow rates – two product rates, the reflux flow rate, and the reboiler heating medium flow
The purpose of distillation is to achieve specified separation, so that measures of product compositions are usually employed. Since analyzers are expensive, many designs include only tray temperatures as inferential variables. (See the chapter on control for a discussion of inferential measurements with applications to distillation.) Product composition analyzers are selected based on economics.
Product composition – up to two analyzers (expensive) or inferential tray temperatures

Operability in Process Design Chapter 9. Troubleshooting
9-107
However, a well-designed tower has many more sensors for safety, reliability and troubleshooting. The basis for the additional sensors is experience in operations problems and equipment faults that need to be diagnosed. Kister (2003) has prepared a valuable summary of reported distillation tower malfunctions over the previous fifty years. The publication is a rich source of information on malfunctions and their causes. Here, we will consider a brief summary of some major malfunctions summarized in Table 9.13. Typical additional sensors for monitoring a distillation tower are given in the following.
Tray temperatures at the feed tray, top and bottom of tower, two different trays above the feed, and two trays below the feed.
Table 9.13. Some major causes of distillation malfunctions based on Kister (2003) Malfunction Causes of malfunction Measurement for
monitoring and diagnosis Tray and packing coking and plugging
Mal-operation during startup Errors in installation (poor distribution) Insufficient reflux, trays run dry Feed solids polymerization
Pressure differential across multiple trays
Tray temperatures
Tower base and reboiler Level calibration* Plugged taps* Sensors faults * Pump cavitation Froth giving process level different from
sensor indication
Multiple level sensors using diverse technologies
Compensation for liquid density changes
Damage to internals Pressure surges (light material rapid vaporization)
High liquid level Weak construction of trays and supports Mal-operation during startup
Pressure differential across multiple trays
Tray temperatures Feed composition (usually not in
real-time)
Flows when not intended Usually during shutdowns Against good practice, valves were used for
isolation. Blinds should be used for sure isolation to protect people and reduce damage.
Temporary sensors to ensure no hazardous materials and sufficient oxygen
Inadequate pressure relief
Undersized for anticipated conditions Unanticipated high demand from light
components Discharge to atmosphere
Assume that pressure sensor and control were designed properly but not able to handle capacity of vapor
Overheating or over chilling
Tray temperatures
These common sensors cannot always pinpoint the root cause, but they can be invaluable in reducing the number of working hypotheses.
* In many instances of reported faults, adequate and redundant sensors were present, but they did not function properly. This experience again reinforces the importance of proper location, installation and maintenance.

Operability in Process Design Chapter 9. Troubleshooting
9-108
A tray temperature used for control should have a second sensor in the same location, i.e., the same thermowell.
At least two sensors for the top pressure, one for control and another for alarm. Pressure difference across the trays above the feed and pressure difference across the
trays below the feed. Additional connections for tray sub-sections with switching between connections provide additional flexibility and better diagnostic resolution.
Pressures at the outlets of every pump Temperature at outlet from safety valve(s) (in pipe connection to flare system). This will
indicate leaking when the tower top temperature is significantly different from ambient temperature
Reboiler heating medium temperature and pressure. If not steam, heating medium exit temperature.
Condenser cooling water exit (return) temperature Condenser process fluid temperature (measure sub-cooling) If flooded condenser, level of condensate in the exchanger Feed flow rate and temperature
The result is a typical design shown in Figure 9.29. Note that this design is not a “blue print” for all towers, but it gives a sense of the number and location of measurements included in the design of a distillation tower. 9.7 Conclusions In this chapter, a generic method for process troubleshooting has been presented and applied to several examples. The method integrates many professional skills, such as teamwork, time management, creative idea generation, systematic decision making and economics. The multi-stage method provides considerable flexibility for adaptation to personal strengths and special problem characteristics. It emphasizes a “lookback” after each stage to provide the opportunity to integrate new knowledge into the study goals. The chapter presentation and examples stress troubleshooting where the process remains in operation, so that time for troubleshooting is limited. In fact, the team must always be aware of the potential of time-critical issues; if one is encountered, the team must quickly adjust process conditions to ensure safety, no equipment damage, and a limit to the production of waste products. The reader will be able to apply troubleshooting immediately when managing plant operations, operating experiments (graduate studies!), and even solving problems with their home utilities. In addition, the knowledge built here will be invaluable when designing new processes or plant modifications. The profitability of the project will be increased by better design practices. Although the initial investment and maintenance cost will be slightly higher, the fewer major incidents, higher service factor, and consistently high product quality will yield large benefits.
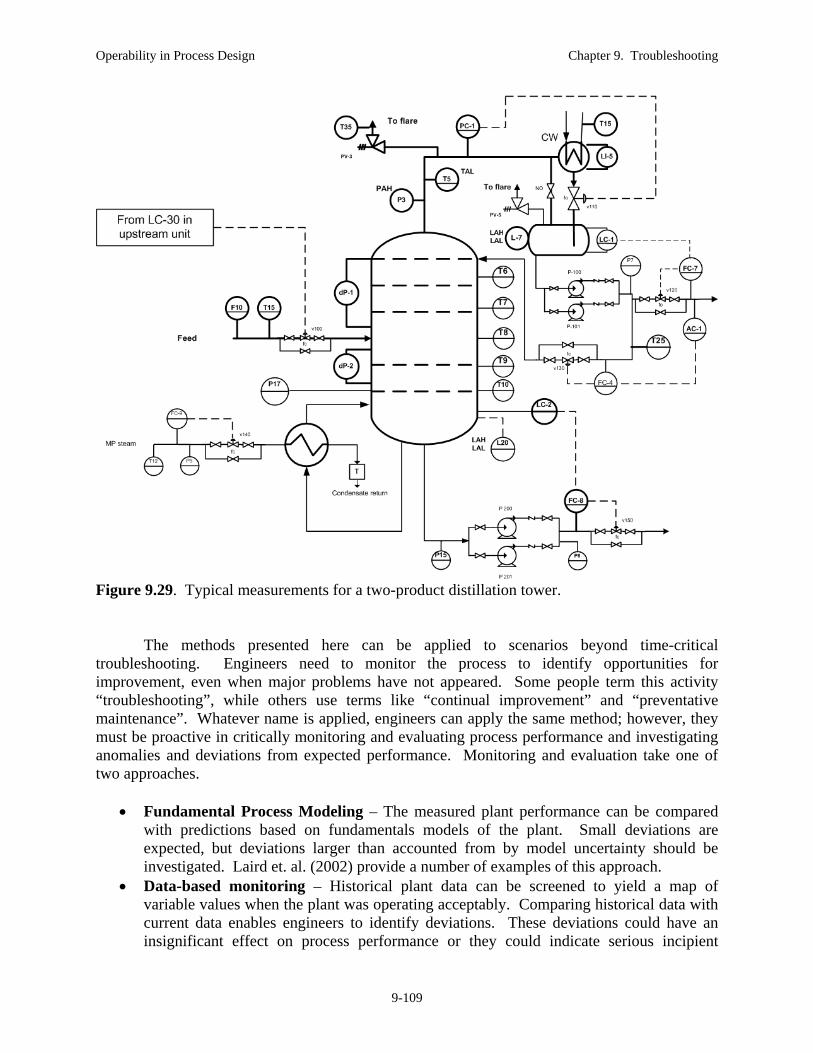
Operability in Process Design Chapter 9. Troubleshooting
9-109
Figure 9.29. Typical measurements for a two-product distillation tower. The methods presented here can be applied to scenarios beyond time-critical troubleshooting. Engineers need to monitor the process to identify opportunities for improvement, even when major problems have not appeared. Some people term this activity “troubleshooting”, while others use terms like “continual improvement” and “preventative maintenance”. Whatever name is applied, engineers can apply the same method; however, they must be proactive in critically monitoring and evaluating process performance and investigating anomalies and deviations from expected performance. Monitoring and evaluation take one of two approaches.
Fundamental Process Modeling – The measured plant performance can be compared with predictions based on fundamentals models of the plant. Small deviations are expected, but deviations larger than accounted from by model uncertainty should be investigated. Laird et. al. (2002) provide a number of examples of this approach.
Data-based monitoring – Historical plant data can be screened to yield a map of variable values when the plant was operating acceptably. Comparing historical data with current data enables engineers to identify deviations. These deviations could have an insignificant effect on process performance or they could indicate serious incipient

Operability in Process Design Chapter 9. Troubleshooting
9-110
problems, and therefore, they should be investigated. The engineer could look at a large number of variables one-at-a-time, as is common in many quality control and statistical process control methods. In contrast, the engineer could evaluate the “composite” behavior of all variables simultaneously. Many process variables tend to change in correlated ways; for example, all of the tray temperatures at the bottom of a distillation tower tend to change together. Because of this strong correlation, the “composite” behavior of all variables provides much better information on plant performance. Kresta et. al. (1991) and MacGregor and Kourti (1995) introduce these ideas based on multivariate statistics.
We note that the use of fundamental models requires time; therefore, it is not used during time-critical troubleshooting. Statistical methods would also require time for data collection and analysis. However, the calculations can be implemented using real-time data and made available through graphical displays. When this is done, statistical methods have proven to be extremely valuable for rapid process diagnostics; for example, see Champagne et. al. (2004).
The troubleshooting method relies upon diagnostic actions to isolate the actual causes from among many working hypotheses. Some of these actions might be straightforward, such as determining the value from a local sensor or increasing the controller signal to a valve and observing the process response. However, more detailed experiments might need to be performed in the plant, and these should be performed to provide the required information with small deviations to operation. Well-established experimental design methods are available to guide the engineer in experimental programs (e.g., Box, Hunter and Hunter, 2005). Most engineers like a puzzle to solve, and those working in process plants will never be disappointed with the number and complexity of daily problems. The material in this chapter provides guidance for the engineer in solving these problems. It is not a straightjacket, to be followed strictly. Rather, the troubleshooting method provides a structure to enable a group of people to work efficiently through the major stages of problem solving. The team can exercise their creativity at all stages. The method is only as good as the bright engineers using it.
References Abdullah, Jaafar (2005) Gamma-ray scanning for troubleshooting, optimization and predictive
maintenance of distillation columns, Hydrocarbon Asia, Jan/Feb 2005 with kind permission of Dr. Jaafar Abdullah
http://www.scanningtech.com/Articles/Gamma%20Ray%20Scanning%20for%20troubleshooting.pdf
This chapter has provided techniques to unleash your creativity. Best wishes as you begin your troubleshooting careers!

Operability in Process Design Chapter 9. Troubleshooting
9-111
Acton J. and M. Hibbs (2102) Why Fukushima Was Preventable, The Carnegie Paper, The Carnegie Endowment for International Peace, Washington, DC
http://carnegieendowment.org/2012/03/06/why-fukushima-was-preventable API (2011) American Petroleum Institute, Instrumentation, Control and Protective Systems for
Gas Fired Heaters, API 556 2nd Edition, April 2011 Blank, L. and A. Tarquin (2002) Engineering Economy, Fifth Edition, McGraw-Hill, New York Box, G., W. Hunter, and J. S. Hunter (2005) Statistics for Experimenters, 2nd Edition, Wiley,
2005 British Petroleum (© BP p.l.c.), CC 2.0 License, Downloaded August 23, 2014 from
http://en.wikipedia.org/wiki/File:Catalytic_Reformer_Unit.jpg Burge S E (2006) The Systems Thinking Tool Box,
http://www.burgehugheswalsh.co.uk/uploaded/documents/Pugh-Matrix-v1.1.pdf Champagne, M., M. Dudzic, I. Miletic, S. Quinn, and V. Vaciluk (2004) An Industrial
Perspective on Implementing On-line Applications of Multivariate Statistics, Journal of Process Control, 14, 821-836
Cleanboiler (2012) Flue Gas Analysis, Cleanboiler. Org http://www.cleanboiler.org/Eff_Improve/Efficiency/Flue_Gas_Analysis.asp
CSB (2007) U.S. Chemical Safety and Hazard Investigation Board Investigation Report, Refinery Explosion and Fire; BP Texas City Refinery Explosion, March 23, 2005, Report No. 2005-04-I-TX, March 2007, http://www.csb.gov/assets/document/CSBFinalReportBP.pdf
CSB (2007) USA Chemical Safety Board, Home page www.csb.org Diamond, D. (2007) Temporal Dynamics of Emotional Memory Processing, Neural plasticity, 33
Figure available through a Creative Commons license, http://en.wikipedia.org/wiki/File:HebbianYerkesDodson.JPG
Doyle, Arthur Conan (1892), “Silver Blaze” in The Memoirs of Sherlock Holmes, published in The Celebrated Cases of Sherlock Holmes, Octopus Books, New York (1981)
Dukelow,S. (1986) The Control of Boilers, Instrument Society of America, Research Triangle Park
Fogler, S. and B. LeBlanc (1995) Strategies for Creative Problem Solving, Prentice-Hall, Upper Saddle River, New Jersey
Hartnup, J. (2005) The flare picture is provided under the Creative Commons license, Attribution-Non-commercial-Share alike, http://en.citizendium.org/wiki/File:Chicago_refinery_flare.jpg#Licensing
INPO (2011) Special Report on the Nuclear Accident at the Fukushima Daiichi Nuclear Power Station, Institute of Nuclear Power Operations, November 2011
http://pbadupws.nrc.gov/docs/ML1134/ML11347A454.pdf Kister, Henry (2003) What Caused Tower Malfunctions in the Last 50 Years?, Trans IChemE,
81, Part A, January 2003 Kister, Henry (2006) Distillation Troubleshooting, Wiley-Interscience, Hoboken Kletz, T. (1990) Critical Aspects of Safety and Loss Prevention, Butterworths, London Kresta, J., J. MacGregor, and T. Marlin, Multivariate Statistical Monitoring of Process Operating
Performance, Can. J. Chem. Eng, C9, pp. 35-47 (1991) Laird, D., B. Albert, C. Steiner, and D. Little, (2002) Take a Hands-0n Approach to Refinery
Troubleshooting, CEP, 98, 6, 68-73 Larkin, Jill, John McDermott, Dorothea P. Simon and Herbert A. Simon (1980) Expert and Novice
Performance in Solving Physics Problems, Science, New Series, Vol. 208, No. 4450 (Jun. 20, 1980), pp. 1335-1342.

Operability in Process Design Chapter 9. Troubleshooting
9-112
Liptak, Bela (2003) Process Measurement and Analysis, Volume I, CRC Press, Boca Raton. Ludwig, Ernst (1983) Applied Process Design for Chemical and Petrochemical Plants, Vol. 3,
Gulf Publishing, Houston. MacGregor, J. and T. Kourti (1995) Statistical Process Control of Multivariate Processes,
Control Engineering Practice, 3, 401-414 Madron, Frantisek (1992) Process Plant Performance, Measurement and Data Processing for
Optimization and Retrofits, Ellis Horwood, New York Mah, Richard (1990) Chemical Process Structures and Information Flows, Butterworths, Boston Marlin, T. (2000) Process Control, Designing Processes and Control Systems for Dynamic
Performance, McGraw-Hill, New York Mindtools (2012) Internet site on Creativity,
http://www.mindtools.com/pages/main/newMN_CT.htm#brainstm Mindtools, (2012a) Internet site on SWOT analysis http://www.mindtools.com/pages/article/newTMC_05.htm Omega (2012) IR Thermometers and Pyrometers, http://www.omega.com/literature/transactions/volume1/thermometers2.html National Research Council (2007) Theoretical Foundations for Decision Making in Engineering
Design, Committee on Theoretical Foundations for Decision Making in Engineering Design, National Research Council, US National Academy of Sciences
http://www.nap.edu/catalog.php?record_id=10566 Pugh, S. (1991). Total Design: Integrated Methods for Successful Product Engineering.
Addison-Wesley Robbins, L. (2005) On-Line Diagnostics Techniques in the Oil, Gas, and Chemical Industry,
Middle East Nondestructive Testing Conference & Exhibition - 27-30 Nov 2005 Bahrain http://212.8.206.21/article/mendt2005/pdf/p06.pdf Rugarcia, A., R. Felder, D. Woods, and J. Stice (2000). The Future of Engineering Education,
Chem. Engr. Ed., 34, 16. Sloley, A. (2001) Effectively Control Distillation Pressure, Chem. Eng.Progress, 39-48, January
2001 TSI (2012) TSI Corporation, Combustion Analysis Basics, An Overview of Measurements,
Methods and Calculations Used in Combustion Analysis http://www.raeco.com/products/emissions/tsi-cacalc-6200/man_combustionanalysisbasics.pdf
West, H., Manna, R. Danna, and E. Stafford (1998) Make Plants Safer with a Proper Management of Change Program, Chem. Eng. Prog., 25-36 (June 1998)
Wikipedia (2012) Five W’s, http://en.wikipedia.org/wiki/Five_Ws World Nuclear Association (2012) Chernobyl Accident, Updated April 2012, http://www.world-
nuclear.org/info/chernobyl/inf07.html Woods, D. (1994) Problem-based Learning: Getting the Most from PBL, Donald Woods,
Waterdown, Ontario Woods, Donald (2000) An Evidence-based Strategy for Problem Solving, J. Engineering
Education, 443-459 Woods, Donald (2006) Successful Trouble Shooting for Process Engineers, Wiley-VCH,
Weinheim. Woods, Donald (2007) Rules of Thumb in Engineering Practice, Wiley-VCH, Weinhein

Operability in Process Design Chapter 9. Troubleshooting
9-113
Additional Learning Resources The following resources provide excellent approaches and useful references for general approaches to problem solving. In addition, they provide many references for more in-depth study.
Fogler, H. Scott and Steve LeBlanc, Strategies for Creative Problem Solving, Prentice Hall PTR, Upper Saddle River, 1995.
Woods, Donald, Problem Based Learning: How to Gain the Most from Problem Based Learning, Griffin Printing, Hamilton, Ontario, Canada 1994.
The following references address trouble shooting specifically.
Kletz, T.A. What Went Wrong? Case Histories of Process Plant Disasters, Gulf Publishing Co., Houston, TX., (1985)
Laird, D., B. Albert, C. Steiner, and D. Little, Take a Hands-On Approach to Refinery Troubleshooting, CEP, 98, 6, 68-73 (June 2002)
Turton, R., R. Bailie, W. Whiting, and J. Shaewitz, Analysis, Synthesis, and Design of Chemical Processes (2nd Ed.), Chapter 20, Prentice Hall, Upper Saddle River, 2003.
Woods, Donald, Successful Trouble Shooting for Process Engineers, Wiley VCH, Weinheim, 2006.
It is generally accepted that a moderate amount of stress can improve performance, but that too much stress degrades performance, from which recovery becomes difficult. A simplified version of the relationship is shown in Figure 9.30. An introductory discussion is provided by Wikipedia, and a review of the evolving theory and data is given by Hardy and Parfitt, with emphasis on the asymmetric natural of the performance peak.
Hardy, L. and G. Parfitt (1991) A Catastrophe Model of Anxiety and Performance, British Journal of Psychology, 82, 163-178
Wikipedia (2012) Yerkes-Dodson Law, http://en.wikipedia.org/wiki/Yerkes%E2%80%93Dodson_law
Figure 9.30 Simplified relationship between stress (arousal) and performance, the “inverted U”. (Diamond, 2007)

Operability in Process Design Chapter 9. Troubleshooting
9-114
The 5Ws 1H (also 5Ws 2H) is documented in many management systems. The approach is integral to the eight disciplines (8D) troubleshooting method developed by the US Military and Ford Motor Company.
Wikipedia (2012) Eight Disciplines Problem Solving, http://en.wikipedia.org/wiki/Eight_Disciplines_Problem_Solving
People play a central role in troubleshooting. These references give insight into human performance in industrial scenarios.
Human Performance Handbook, Volume I: Concepts and Principles, US Department of Energy, DOE-HDBK-1028-2009, 2009
http://www.hss.doe.gov/nuclearsafety/techstds/docs/handbook/doe-hdbk-1028-2009_volume1.pdf
Wincek, J. and J. Haight (2007) Realistic Human Error Rates for Process Hazard Analyses, Process Safety Progress, 26, No.2, 95-100
A solid understanding of engineering principles and the behavior of process equipment is critical for process troubleshooting. A few references for process equipment are given below. Building HVAC
US EPA training materials: http://www.epa.gov/iaq/largebldgs/i-beam/text/diagnosing.html EPA-sponsored workshop proceedings: http://poet.lbl.gov/diagworkshop/proceedings/
Distillation Kister, Henry, Distillation Troubleshooting, Wiley-VCH, Weinhiem, 2006
General Process Equipment Lieberman, N. and E. Lieberman, A Working Guide to Process Equipment, McGraw-Hill,
New York, 1997. Lieberman, N., Trouble Shooting Process Operations, PennWell Books, Tulsa, OK, 1985
A database of industrial failures, http://www.sozogaku.com/fkd/en/index.html Heat exchangers
Bott, T., Heat Exchanger Operation and Trouble Shooting, in Encyclopedia of Chemical Processing, Taylor and Francis, (http://www.informaworld.com/smpp/content~content=a738146332~db=all~jumptype=rss)
Gulley, D. (1996) Troubleshooting Shell-and-tube Heat Exchangers, Hydrocarbon Processing, Sept. 1996, 91-98
Leak Detection IAEA (2009) International Atomic Energy Agency, Leak Detection in Heat Exchangers and
Underground Pipelines Using Radiotracers, Training Course Series 38, Vienna Pulp and Paper Contribution from Martin Hubbe from North Carolina State:
http://www4.ncsu.edu/~hubbe/TShoot/Problem_solving_strategies.htm Pumps
Block, Heinz (1983) Machinery Analysis and Troubleshooting, Gulf Publishing, Houston (TS 191 .B56 1983)

Operability in Process Design Chapter 9. Troubleshooting
9-115
Karassik, Igor (1981) Centrifugal Pump Clinic, Marcel Dekker, New York. Sofronas, Anthony (2006) Analytical Trouble Shooting of Process Machinery and Pressure
Vessels, Including Real-world Case Studies, Wiley, Hoboken (TJ 153 .S6375 2006) Refrigeration Davis Instruments Internet site: http://www.davis.com/TechLibraryArticle/1209#anchor1 J. Braun from Purdue University for good list of references:
http://poet.lbl.gov/diagworkshop/proceedings/ Waste water treatment
Tillman, G. (1996) Water Treatment: Troubleshooting and Problem Solving, CRC Press, When troubleshooting process problems, engineers often rely on qualitative analysis guided by experience. Many of these experiences are encapsulated in “rules of thumb”. The following references provide many useful rules.
Brannan, C., Rules of Thumb for Chemical Engineers, 2 ed. Gulf Publishing, 1988. Woods, D., Rules of Thumb in Engineering Practice, Wiley, 2007.
You may be called upon to investigate an incident after the completion of all effects; this might be called a “post-mortem” investigation. The following resource by the U.S. Department of Energy contains valuable guidance and methods. The site has additional links to useful reports.
DOE Handbook: Accident Investigation and Prevention Volume I: Accident Analysis Techniques, DOE‐HDBK‐1208‐2012, July 2012 available at http://www.hss.doe.gov/sesa/corporatesafety/AIP/index.html
AIChE (1992) Guidelines for Investigating Chemical Process Incidents, American Institute of Chemical Engineers, Center for Chemical Process Safety, 1992.
Many methods have been proposed for diagramming causes and effects during troubleshooting and root cause analysis. Some are introduced in the following references.
Review of several methods: http://www.qa.au.edu/page2/research/BSCCausalMappingMethodology.pdf
Fishbone diagrams: http://www.ibm.com/developerworks/lotus/library/fishbone/ Cause-effect diagrams similar to the manner used in this chapter, download from “Improving
the Fishbone Diagram: http://www.thinkreliability.com/Root-Cause-Analysis-Articles.aspx
Some details on statistical methods referred to in the chapter can be found at the following eBook. (NIST stands for the US National Institute for Science and Technology, formerly the Bureau of Standards.)
NIST/SEMATECH e-Handbook of Statistical Methods, http://www.itl.nist.gov/div898/handbook/ , 2012 Design of Experiments is Chapter 5; statistical Process Control is Chapter 6

Operability in Process Design Chapter 9. Troubleshooting
9-116
Section 9.0 contained a brief discussion of the incident of March 28, 1979, at Three Mile Island nuclear power plant in Pennsylvania, USA. A couple of easily accessible references are given below; they provide many additional citations.
A brief summary from the US Nuclear Regulatory Commission: http://www.nrc.gov/reading-rm/doc-collections/fact-sheets/3mile-isle.html
Wikipedia entry: http://en.wikipedia.org/wiki/Three_Mile_Island_accident An example of “safe park” for an industrial process is given in the following paper.
McVicker, Bryan (2010) Safe Park DCS Tool: Furnace Overview Status Display, Paper 105d, AIChE National Meeting, San Antonio, TX. , March 22 - 26, 2010
Test Your Learning
9.1 Generally, we base the causal relationships on fundamental principles. Let’s consider causal relationships in the Drooping Temperature example. A sketch in Figure Q9.1 Shows causal relationships. a. For the top two relationships,
determine the direction in the “cause” variable that would result in a decrease in the heater outlet temperature.
b. Select another cause variable and determine the sign of its change that would result in a decrease in heater outlet temperature.
Figure Q9.1.
9.2 When walking through the unit, the operator looks at the local display for a bimetallic
temperature sensor. The operator radios the information to an engineer in the control room. What is the best statement – the most representative of the situation? a. The temperature is 55 °C. b. The sensor measures 55 °C. c. The sensor display shows 55 °C. d. We do not have any idea what is going on – I’m out of here!
9.3 The engineer is looking at the process drawing in Figure Q9.3. He decides to determine
the value of temperature T7. How should this value be interpreted?

Operability in Process Design Chapter 9. Troubleshooting
9-117
a. Sensor T7 uses a thermocouple to measure temperature. b. SensorT7 measures the temperature after the flash valve. c. Sensor T7 is shown to be located after the flash valve on the drawing. d. I do not trust T7-I’m going to feel the pipe!
9.4 The cause effect diagram in Figure 9.11 for the Drowning in Distillate example has many
root causes. Add at least one additional root cause to each of the major branches, i.e., sensor error, too much liquid in, and too little liquid out.
Figure Q9.3. Drawing shows T7 sensor. 9.5 Data for the decision is given for the Drooping Temperature example in Section 9.5.4.
Using the data, calculate the net present value (NPV) for Alternatives C and D, and compare your answers with the values in Table 9.12.
9.6 Many working hypotheses are proposed for the examples in the chapter. Propose at least
two additional likely working hypotheses for the following examples. Also, propose at least two additional diagnostic actions.
a. The Drooping Temperature in Table 9.7. b. Persistently High Distillation Pressure in Section 9.4.1 c. Startup without Quality in Section 9.4.2 d. The Frenetic Flow Rate in Section 9.4.3 e. The Stubbornly High Distillation Pressure in Section 9.1. 9.7 Review the publication sited below that discusses accident analysis methods to be
followed after the plant has been brought to a safe condition. Discuss the similarities with and differences between troubleshooting as described in this chapter and the proposed method for accident investigation in the publication.

Operability in Process Design Chapter 9. Troubleshooting
9-118
Publication: DOE Handbook: Accident Investigation and Prevention Volume I: Accident Analysis Techniques, DOE‐HDBK‐1208‐2012, July 2012 available at
http://www.hss.doe.gov/sesa/corporatesafety/AIP/index.html 9.8 Quickly recognizing time-critical situations is important! You are the engineer
responsible for training control room operators in a plant with a range of equipment. Develop training guidelines for
(i) recognizing when time-critical issues have arisen, (ii) whether the equipment should be shut down or moved to a safe park, and (iii) if safe park, describe the safe park condition.
a. Distillation b. Fired heater c. Vapor recovery refrigeration d. Several heat exchangers in series e. Boiler and steam distribution system with condensate recovery and return
9.9 Expand the entries in Table 9.1 for both “good” and “poor” attitudes. Then, discuss your
personal strengths and weaknesses and how you perform well by (i) building on your strengths and (ii) correcting/compensation for your weaknesses.
9.10 A synopsis of the troubleshooting method is given in Figure 9.5. Add at least one item
under each of the six stages and explain why the addition will improve the method. 9.11 A simplified piping and instrumentation drawing in given in Figure 9.6. Answer the
following questions about this process.
a. Why are three two feed pumps, P100and P110 in parallel? Explain the valves around the pumps.
b. What type of a valve is v200? Describe any special concerns about its range of operation. Why is it a fail open valve?
c. Describe the physical principle for the sensor F1. Discuss whether this is a good choice for the application.
d. Why isn’t temperature T47 controlled by adjusting the by-pass around the upstream heat exchanger?
e. Why is there a PAL in the fuel gas pipe before the burner? If this is a critical variable, is there a method for ensuring that the low pressure is not violated without shutting down the heater?
9.12 The fired heater in Figure 9.6 presents potential hazards. Describe the logic required for
an SIS. In your solution, define the sensors used, the logic for each sensor, and the actions taken automatically by the SIS.
9.13 Multiple root causes provides challenges to the troubleshooting team. Figure 9.26 shows
the explosion in possible root-cause combinations. Derive the equations used and confirm the values for this figure.