operando raman / uv-vis-nir set-up for monitoring ... · supported chromium oxide catalysts during...
TRANSCRIPT

21
The development of an operando Raman / UV-Vis-NIR set-up for monitoring
supported chromium oxide catalysts during propane dehydrogenation.
Abstract
The implementation of operando Raman and UV-Vis-NIR spectroscopy into a novel
reactor system is described. This set-up is capable of monitoring heterogeneous
catalysts under reaction conditions. The potential of the set-up is demonstrated for
the catalytic dehydrogenation of propane. It is shown that these spectroscopic
techniques provide qualitative information on the changing oxidation state of the
catalyst and the coke formed during reaction. This information can be linked to
catalytic data as measured with on-line micro GC and mass spectrometry.

Chapter 2
22
Introduction
Propene is an important building block in chemical industries. Products are for
instance polypropene, propene oxide, oxo alcohols, acrylonitrile and cumene.
The demand for propene in the period 1990 – 2010 is continuously increasing.1 This is
illustrated in Figure 2.1.
1990 1992 1994 1996 1998 2000 2002 2004 2006 2008 20100
30
60
90
Mill
ion
Met
ric
Tons
Others Cumene Acrylonitrile Oxo Alcohols Propylene oxide Polypropylene
Figure 2.1 Global propene consumption in the period 1990-2010.1
From Figure 2.1 it is clear that the demand for propene has increased significantly
over the last decade and the expectations are that this trend will continue in the years
to come. The Figure also illustrates that the expected increase in demand for propene
from ca 60 · 106 ton in 2005 to about 80 · 106 ton in 2010 can be mainly contributed to
the increasing demand for polypropene. This increasing demand for polypropene
originates from the increasing need of plastics in Asia and more specifically in
China.2,3
Conventional sources to produce propene are ethane steam crackers (67%) and
fluidized catalytic crackers (FCC, 30%). However, the requested amounts of propene
is outgrowing the production capacity and this makes new production facilities
vital.4-6
Large expansions for propene production are currently being constructed in the
Middle East and north-east Asia.2,4,7 However this does not completely satisfy the
demands. Current technology is producing a lot of (low value) side-products,
making new technology required. Via the application of a new (improved) catalyst in
FCC, the propene yield can be increased from about 6 to 25 wt%.6,7 Also the
application of less common technologies such as the direct dehydrogenation of
propane can reduce the propene shortage.
The development of an operando Raman / UV-Vis-NIR set-up
23
Propane dehydrogenation offers some specific advantages to propene derivative
producers. First, the only product is propene. Companies specifically interested in
producing propene are not interested in producing ethene or higher olefins (C4+ co-
products) that are made from naphtha crackers, or gasoline and fuels from refineries.
Second, some of the best locations for propene derivative plants do not have good
access to propene. These sites represent a high demand for propene (derivatives), i.e.
near China. Given the high cost of shipping and storing propene, dehydrogenation of
propane is generally more cost-effective than buying propene for these locations.6,8
Until now the direct dehydrogenation has found limited use because the economics
are heavily dependent on the price of the feedstock, i.e. the price of propane.
However, the economics have changed and the price difference between propane
and propene is now making the dehydrogenation more attractive. As a result the
amount of propene produced via dehydrogenation is expected to double during the
next five years from 1.2 to 2.4 · 106 metric tons per year when new plants come in
production in Saudi Arabia (Al-Jubail).6,9
Currently there are five industrial dehydrogenation processes available. These are
the Catofin process, the Oleflex process, Steam active reforming (STAR), fluidized
bed dehydrogenation (FBD) and the Linde process. To the best of our knowledge
only the Catofin and Oleflex processes are currently commercially applied for the
dehydrogenation of propane. The different methods will be briefly described in the
next paragraphs.
The first process available for the dehydrogenation of propane is the Catofin or
Houdry process (ABB Lummus).5,6,10-13 The process is widely used in the
dehydrogenation of iso-butane to iso-butene, an important primary product in the
production of methyl tertiary butyl ether (MTBE). With the pressure on this market
due to the banning of MTBE from fuels for environmental reasons, new applications
for the Catofin process are developed. An example is the dehydrogenation of
propane. A Catofin plant usually contains five cyclically shallow bed operated
reactors containing a chromium oxide on alumina catalyst. The process is typically
run at a temperature around 575 °C and at a subatmospheric pressure of 0.2-0.5 bar.
Each reactor undergoes a cycle of typically 12 minutes of propane dehydrogenation,
3 minutes purge/evacuation, 12 minutes of catalyst regeneration using air and 3
minutes of purge/evacuation optionally followed by a catalyst reduction. The five
reactors are switched in such a manner that the overall plant operates in a continuous

Chapter 2
24
manner, with always 2 reactors dehydrogenating, 2 regenerating and 1 under purge.
This is illustrated in Figure 2.2.
5
4
3
2
1
0 5 10 15 20 25 30
Time on stream (min)
Cyc
le
Dehydrogenation Purge Regeneration Evacuation
Figure 2.2 Typical cycle timing for a five reactor system.
Operating a 5 reactor plant in accordance with Figure 2.2 has the advantage that the
product stream is relatively constant. This is beneficial for the propene processing
plants downstream, since then a constant stream of reactant is provided.
During the dehydrogenation cycle the catalyst activity changes. This is mainly
caused by two effects: 1) the formation of coke on the catalyst and 2) the reduction of
Cr6+ to Cr3+. In the regeneration cycle the coke is combusted and the chromium is
partially re-oxidized. The heat is used to reheat the catalyst to the desired
temperature. Currently the cycle times for the Catofin process are fixed and based on
the heat exchange in the process. During the lifetime of the catalyst (typically 2
years), the reaction temperature is gradually increased to maintain the desired
conversion level.
A competitive process for the direct dehydrogenation is UOP’s Oleflex process.5,6,8,10-
12,14,15 The process can be separated into three different sections: the reactor section,
the catalyst regeneration section and the product recovery section. The reactor
section consists of three or four radial flow reactors, connected in series, containing a
supported platinum catalyst. The last reactor is coupled to both a continuous catalyst
regeneration unit (CCR) and the product regeneration unit. In the last reactor, the
catalyst is separated from the product stream. Subsequently it is regenerated with air
to burn off carbonaceous products. Afterwards, it is deployed again in reactor 1. The
product stream is separated into products and the not reacted propane is

The development of an operando Raman / UV-Vis-NIR set-up
25
reintroduced into the feed. The catalyst is typically a Pt / Sn on alumina catalyst.
Typical reaction temperatures of the Oleflex process are 525 - 705 °C at pressures of
1-3 bar.
The third process makes use of STeam Active Reforming (STAR).6,12,16-18 This process
was developed by Phillips Petroleum Co, and is now licensed by Uhde (Germany).
By adding oxygen to the feed, the equilibrium is shifted towards the product side,
since the oxygen reacts with part of the hydrogen formed during dehydrogenation.
The catalyst contains Pt as active phase promoted with tin on a support of zinc
aluminate or magnesium aluminate with calcium aluminate as binder. The reaction
is operated at 6 – 9 bar and 500 – 600 °C. There are two major requirements for this
catalyst. First it has to be stable in the presence of steam and oxygen second it should
maintain its activity for dehydrogenation and does not convert hydrocarbons in
carbon oxides and hydrogen. Since small amounts of coke are formed on the catalyst
it is necessary to regenerate the catalyst after 7 hours for a period of 1 hour in oxygen
/ air. By using multiple reactors similar to Figure 2.2 the product stream is kept as
constant as possible. The process has commercially been proven by the
dehydrogenation of 1-butene to butadiene and the dehydrogenation of butane. A
pilot-plant study for the dehydrogenation of propane has been performed.
The fluidized bed dehydrogenation (FBD) is licenced by Snamprogetti and
Yarsintez.5,11,15,18 In this process the pure alkane feed bubbles through the staged
fluidized bed reactor at 1.1 - 1.5 bar. Since coke is formed on the alumina supported
chromium catalyst a regeneration of the catalyst is required. Therefore part of the
catalyst is continuously moved to a regenerator and back. Typical operating
temperatures are 550 – 600 °C. This process is commercially used for the
dehydrogenation of isobutane and isopentane.
The last process described in this context is the Linde process (Linde, BASF).5,15,18 This
process is performed in three fixed bed reactors. Two operate under
dehydrogenation conditions while the third is regenerated by combusting the coke
on the catalyst with a steam / air mixture. The catalyst in this process is a CrOx /
Al2O3. The process is operated at a temperature of 590 °C and is kept at nearly
isothermal conditions, to minimize thermal cracking and coke formation. A pilot
plant study for the dehydrogenation of propane has been performed.
An overview of important parameters for all five described processes is provided in
Table 2.1.
Chapter 2
26
Table 2.1
Comparison of current industrial technologies for the dehydrogenation of propane. 5,11,15
Process Catofin Oleflex STAR FBD Linde
License holder ABB Lumus/
United
Catalysts
UOP Uhde Snamprogetti
Yarsintez
Linde
(BASF)
Catalyst CrOx / Al2O3 Pt / Sn /
Al2O3
Pt / Sn on
Zn or Mg
Al2O3 / Ca
Al2O3
CrOx / Al2O3 CrOx /
Al2O3
Operating
mode
Cyclic Moving
bed
Cyclic Fluidized bed Cyclic
Reactor type Adiabatic Adiabatic Isothermal Adiabatic Isothermal
Number of
reactors
5 4 8 1 3
Typical cycle
time
0.5 h Continuous 8 h Continuous 9 h
T (°C) 525 – 677 525 – 705 482 – 621 520 – 600 590
P (bar) 0.1 – 0.7 1 – 3 3 – 8 1.1 – 1.5 >1
Propane
conversion (%)
65 40 30 – 40 40 50
Selectivity
towards
propene (%)
85 90 80 – 90 89 91
Capacity
Mtons/yr
0.7 1.25
The applied catalysts provide an opportunity for a spectroscopic investigation of
catalysts under reaction conditions. Spectroscopy is an excellent manner to track the
state of a CrOx / Al2O3 catalyst during the catalytic dehydrogenation process.
Especially a combination of UV-Vis-NIR and Raman spectroscopy, performed
simultaneously is capable of providing a much better insight in the catalyst health.
With UV-Vis-NIR spectroscopy the oxidation state of the chromium oxide catalyst
can be determined while Raman spectroscopy is excellent in tracking the different
types of coke on an active catalyst.19

The development of an operando Raman / UV-Vis-NIR set-up
27
Therefore, the aim of this work was to develop an operando Raman / UV-Vis-NIR set-
up in which the Catofin process could be investigated under typical operating
conditions, i.e. at elevated temperatures.
Construction of an operando Raman / UV-Vis-NIR set-up
Two set-ups combining the advantages of both Raman and UV-Vis-NIR spectroscopy
have been developed, while on-line product analysis was integrated in these systems
via connection of a mass spectrometer and a micro GC.20 A schematic representation
of the first newly developed system is presented in Figure 2.3.
AGas feed Thermocouple
Quartz reactor with optical grade windows
To on-lineMS / Micro-GC
Raman objective
High temperature UV-Vis probe
Oven
Figure 2.3 Schematic presentation (A) and picture (B) of the reactor set-up with combined
UV-Vis-NIR and Raman spectroscopy.
B

Chapter 2
28
The set-up consists of a 6 mm diameter quartz reactor tube with a special square
section in which the tube wall is made of optical grade quartz windows. These
quartz windows are necessary for focusing the UV-Vis-NIR and Raman light sources
and obtain better spectroscopic data. Typically, 300 mg of catalyst is placed in the
reactor as a packed bed supported on quartz wool just below the optical windows.
Catalyst extrudates were milled to a typical particle size of 50 µm. The bed height is
ca. 15 mm. The reactor is placed vertically in the center of a 10 cm long tubular oven
block; a coated thermocouple can be inserted in the catalyst bed to directly monitor
the catalyst temperature. The metal oven block has on opposite sides two horizontal
8 mm holes directed at the catalyst bed. One of the holes is used to aim an Avantes
FCDUV400-G-01CHT UV-Vis-NIR reflection probe at the catalyst bed. This high-
temperature probe contains three 400 µm optical fibers closely packed in a triangle.
One fiber is connected to an Avantes Avaspec 2048 spectrometer and another fiber is
connected to an Avantes halogen-deuterium light source (DH-2000). The third fiber
is a spare one, to be used if one of the other two breaks. The measuring range of the
spectrophotometer is 175-1120 nm. However, effectively the system only provides a
usable signal to noise ratio above 220 nm, partly caused by the low transmittance of
the optical fibers below this wavelength. The second hole in the oven is used for
focusing a Raman laser at the catalyst. Raman spectra were measured with a Kaiser
RXN spectrometer equipped with a 532 nm laser (frequency doubled Nd-YAG). A
5.5” non-contact objective was used for beam focusing and collection of scattered
radiation, which was detected by a CCD. The laser output power at the focusing spot
is typically 60 mW.
The gas leaving the reactor is analyzed using a Pfeiffer Omnistar quadrupole mass-
spectrometer (MS). All m/z components in the gas from 14 to 44 amu were analyzed.
The scanning time per mass was 50 ms, making the effective time resolution of the
mass spectrometer 7.5 s. By performing a deconvolution procedure using the known
fragmentation patterns of the reactants and all possible products, it is possible to
convert the mass signals quantitatively to concentrations. A more facile
quantification of the product gas is possible with the on-line Varian CP-4900 micro-
gas chromatograph (GC) system equipped with a Poraplot-Q and Molsieve 5A
column. This GC system is capable of performing analyses at less than 90 s intervals.
After the development of this first combined Raman / UV-Vis-NIR set-up, a different
set-up was constructed which has the additional advantage that UV-Vis-NIR spectra
can be gathered as function of the catalyst bed height. A schematic picture of this set-
up is presented in Figure 2.4.21

The development of an operando Raman / UV-Vis-NIR set-up
29
Gas feed Thermocouple
Quartz reactor with optical grade windows
To on-lineMS / Micro-GC
Raman objective
High temperature UV-Vis probes
Oven
A
Figure 2.4 Schematic presentation (A) and picture (B) of the reactor set-up with combined
UV-Vis-NIR and Raman spectroscopy. Four UV-Vis-NIR probes are present for
measuring at different heights in the catalyst bed.
A reactor is typically loaded with 1 gram of catalyst (total bed height of 45 mm) and
placed in the center of a 15-cm long tubular oven block. A thermocouple can be
inserted in the catalyst to monitor on-line the temperature. A hole on one side is used
to measure Raman spectra, while on the opposite side a vertical slit (5 * 50 mm) is
present for UV-Vis-NIR analysis. The slit is used to focus 4 Ocean Optics Bi-FL600
optical fiber probes (each containing two 600 µm fibers, usable up to 700 °C) at the
catalyst bed at a vertical spacing of 10 mm. This makes it possible to determine
spatial profiles over the catalyst bed. Of each probe, one fiber is connected to one of
B

Chapter 2
30
the four channels of an Avaspec-2048-4 spectrometer (Avantes) and another fiber is
connected to a DH-2000 BAL halogen-deuterium light source (Ocean optics). The
Raman system is the same system as described earlier for the first set-up. In this set-
up on-line gas analysis is performed via a Compact GC (Interscience) equipped with
a Porabond-Q and a Molsieve-5A column. The GC is capable of performing analyses
within 60 s.
Application of the set-up
After construction of the set-ups, their strength in combining multiple spectroscopic
techniques, under reaction conditions, were tested for the dehydrogenation of
propane over an industrial-like 13 wt% Cr / Al2O3 catalyst for a series of
dehydrogenation-regeneration cycles. The reactor was heated at 10 °C min-1 from
room temperature to a catalyst temperature of 550 °C in a gas stream of 3 ml min-1 of
O2 (Hoek Loos, 99.995%) in 12 ml min-1 of He (Hoek Loos, 99,996%). After heating,
the reactor was operated isothermally at a pressure of 1.5 bar in cycles of alternating
dehydrogenation for ca. 50 min with 2 ml propane (Hoek Loos, 99.92%) in 20 ml min-
1 of He and regenerating for ca. 50 min with 3 ml min-1 of O2 in 12 ml min-1 of He.
During the first 120 s of each cycle UV-Vis-NIR measurements were performed with
a 1 s interval to track the rapid changes on the catalyst, after this time measurements
were carried out at a 1 min interval. The UV-Vis-NIR spectrometer was used with an
integration time of 28 ms and typically 40 spectra were averaged to improve the
signal to noise ratio and a Halon white disk was used as a white reference. The
resulting time resolution was, therefore, ≈ 1 s. Raman spectra were recorded with an
exposure time of 3 s, while 10 spectra were accumulated. This resulted in a spectral
recording time of 180 s. Measurements were performed at 5 min intervals. During
the entire experiment the product gas composition was monitored using the MS. The
temperature of the catalyst was monitored using a small thermocouple in the middle
of the bed.
In the second set-up the catalyst was heated to 550 °C (10°C min-1) in a gas stream of
10 ml min-1 of O2 and 40 ml min-1 of He. After heating, dehydrogenation cycles of 50
minutes (10 ml min-1 of C3H8 and 40 ml min-1 of He) were alternated with
regeneration cycles (10 ml min-1 of O2 and 40 ml min-1 of He). During the first 120 s of
each cycle UV-Vis-NIR spectra were measured with a 1 s interval. After this time,
measurements were performed with a 60 s interval. Raman spectra were taken every

The development of an operando Raman / UV-Vis-NIR set-up
31
300 s. During the entire experiment the product gas composition was monitored via
GC.
Results and Discussion
Monitoring a catalyst during the dehydrogenation of propane
The catalytic results of the experiment are shown in Figure 2.5 for a 13 wt% Cr /
Al2O3 catalyst. The simultaneously measured spectroscopic data are presented in
Figure 2.6.
0 50 100 150 200 250 300 3500
20
40
60
80
100
CO2
O2
C3H
6
C3H
8
Cycle 3Cycle 2Cycle 1
Gas
Com
posi
tion
(%, e
xcep
t He)
Time (min)
Figure 2.5 Catalytic activity measurements for three dehydrogenation-regeneration cycles
during propane dehydrogenation over a 13 wt% Cr on alumina catalyst (1 bar,
550 °C).
The catalytic activity data in Figure 2.5 are displayed for three consecutive
dehydrogenation-regeneration cycles. It can be seen that the catalytic performance is
only subject to changes within one dehydrogenation cycle. Within one cycle the
conversion to propene increases gradually with increasing time-on-stream and
reaches a maximum of 55% after 28 min. Longer reaction times result in a gradual
decrease in propene formation. The comparison of different cycles does not reveal
changes in activity. The stable performance of the catalyst over the different cycles is
in agreement with expectations, since a commercial catalyst is used in industry for
ca. two years before it is replaced. In that case a catalyst will have undergone well
over 30000 cycles.

Chapter 2
32
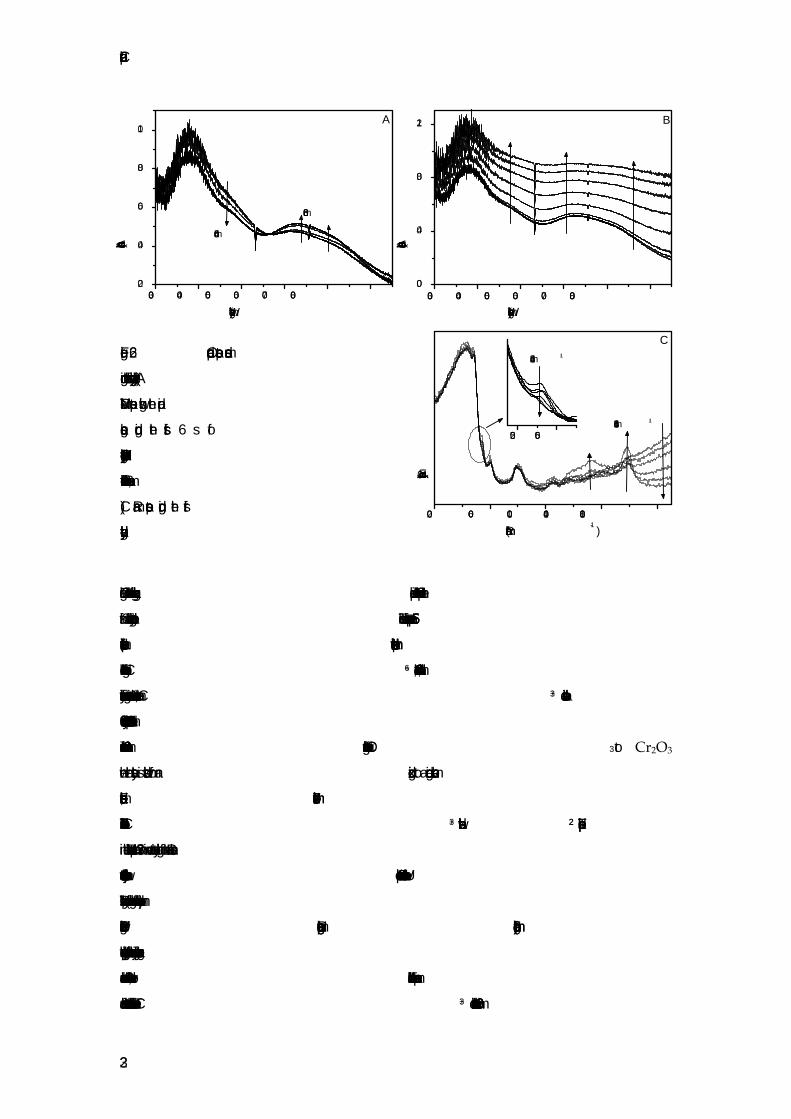
Figure 2.6 Operando spectra measured
during the first dehydrogenation cycle; (A)
UV-Vis-NIR spectra showing the rapid
changes during the firsts 6 s of
dehydrogenation, (B) UV-Vis-NIR spectra as
function of time after the first 6 s on-stream,
(C) Raman spectra during the first
dehydrogenation cycle.
Figure 2.6 A shows the fast changes taking place in the UV-Vis-NIR spectra in the
first 6 s of the dehydrogenation reaction. There is an isobestic point present at 565
nm, indicative for the presence of at least two distinct chromium oxide species. It can
be seen that the charge transfer bands of Cr6+, located at 380 and 450 nm, decrease in
intensity with increasing reaction time. At the same time, the Cr3+ d-d transition at
630 nm increases in intensity. This decrease in absorption at 380 and 450 nm and the
increase of the band at 630 nm are in agreement with the reduction of CrO3 to Cr2O3
when the catalyst is switched from an oxidizing to a reducing environment.
Furthermore, a shoulder at about 700-750 nm becomes visible.
This band can be attributed to the interaction of Cr3+ with adsorbates.22 The sharp dip
in the UV-Vis-NIR spectrum at 532 nm is due to stray light of the Raman laser
scattered at the catalyst particles, while the spike at 656 nm is an artefact of the UV-
Vis-NIR photometer system (most intense light emitted from the deuterium lamp).
Figure 2.6 B shows the UV-Vis-NIR spectrum changing over a longer time (50 min) in
the propane dehydrogenation cycle. It is clear that no major peak intensity changes
can be observed. On the other hand, the overall absorbance of the sample increases
and this is related to the formation of coke. The Cr3+ d-d transition band at 630 nm
300 400 500 600 700 8000.0
0.4
0.8
1.2 B
Abs
orba
nce
(a.u
.)
Wavelength (nm)300 400 500 600 700 800
0.2
0.4
0.6
0.8
1.0
450 nm
630 nm
Abs
orba
nce
(a.u
.)
Wavelength (nm)
A
200 600 1000 1400 1800
520 560
C
1584 cm-1Ra
man
Inte
nsity
(a.u
.)
Raman shift (cm-1)
542 cm-1

The development of an operando Raman / UV-Vis-NIR set-up
33
becomes less pronounced over time. This can also be explained by the coverage of
the chromium oxide by coke. Coke formation is evident from the Raman spectra in
Figure 2.6 C. The bands that appear in the region 1200-1650 cm-1 are attributed to
(poly)aromatic ring stretching C-C vibrations.19,23-31 Fluorescence of the catalyst,
causing the increasing baseline at high wavenumbers, decreases during the
dehydrogenation cycle. It is likely that this phenomenon is also due to the coke
formation on the catalyst. The bands at 200, 605, 810 and 1060 cm-1, which can be
observed in the Raman spectra, are originating from the quartz windows of the
reactor. Another interesting Raman band could be observed at 542 cm-1. This Raman
band is assigned to the presence of Cr2O332,33 and gradually decreases with increasing
reaction time. Since Cr3+ is unlikely to be reduced further at the applied reaction
conditions, this disappearance is most probably associated with the formation of
coke covering the Cr2O3 surface as it limits Raman scattering of the underlying layer.
In combining the spectroscopic information of Figure 2.6 with the catalytic
information of Figure 2.5, coke formation, as observed by both Raman and UV-Vis-
NIR, is the most likely cause of the decrease in catalyst activity over time. In the
oxidation cycles this coke is combusted from the catalyst as can be concluded from
the formation of CO2 in the beginning of the regeneration cycle and from the increase
in the catalyst bed temperature of about 10 - 15 °C (Figure 2.7). During the catalyst
regeneration the UV-Vis-NIR spectra return completely to the initial state of Figure
2.6 A in less than 15 s. Both coke combustion and (partial) chromium oxide
reoxidation take place simultaneously. This rapid change in the observed state of the
catalyst is in agreement with the fact that the mass spectrometer detects a short
carbon dioxide production immediately after the start of the oxidation cycle. Also,
the increased catalyst temperature resulting from the heat released by the coke
combustion is observed only for a short time. The smaller CO2 production peak
observed by the mass spectrometer at the beginning of the propane dehydrogenation
cycle is caused by the reduction of the Cr6+ to Cr3+ by propane. In industry, this loss of
propane is often circumvented by a short catalyst reduction using hydrogen
immediately before switching to propane.
Both the UV-Vis-NIR and Raman spectra after dehydrogenation and regeneration
show a reversible behavior of the catalyst. This is in good agreement with the activity
data, which shows an identical performance of the catalyst in subsequent cycles.

Chapter 2
34
The strength of the set-up is the application of two spectroscopic techniques together
with on-line product analysis. Therefore an overview of the most important
information is presented in Figure 2.7 for one dehydrogenation-regeneration cycle.
100 120 140 160 180 200 220
0.4
0.8
1.2
1.6
E
Time (min)
Ram
an 5
42 c
m-1
0.8
1.2
1.6
2.0
D
Ram
an 1
584
cm-1
0.0
0.2
0.4
0.6
0.8
C
UV
-Vis
850
nm
545
550
555
560
B
Tem
pera
ture
(o C)
0.0
0.2
0.4
0.6
0.8
1.0
Gas
com
posi
tion
(*10
0%)
CO2
Propene
A
Figure 2.7 Overview of the most relevant observed changes in measured signals during a
complete dehydrogenation-regeneration cycle of propane over a 13 wt% Cr-on-
alumina catalyst. (A) Observed propene (solid) and CO2 (dots) fraction in the gas
phase; (B) catalyst bed temperature; (C) UV-Vis-NIR absorbance at 850 nm,
corresponding to the overall increase in absorbance due to coke formation on the
catalyst; (D) Raman signal at 1584 cm-1 Raman shift corresponding to the major
coke component formed; (E) Raman signal at 542 cm-1 corresponding to
crystalline Cr2O3.

The development of an operando Raman / UV-Vis-NIR set-up
35
From Figure 2.7 the consistence of the applied spectroscopic techniques can be
concluded. The UV-Vis-NIR signal at 850 nm (indicative of the increasing overall
absorbance of the sample due to coke formation) increases similarly fast as the
Raman signal at 1584 cm-1 and at a similar rate as the Raman band at 542 cm-1
disappears due to coke coverage of Cr2O3. Furthermore, it can be seen that the
decreasing catalyst activity observed using on-line mass spectrometry activity data
agrees well with the spectroscopically observed coke build-up on the catalyst. For the
combustion of coke in the catalyst regeneration steps, the information obtained using
MS, UV-Vis-NIR, Raman and reactor temperature is also in excellent agreement.
Differences in coke formation over the catalyst bed measured during the dehydrogenation of
propane.
The second operando Raman / UV-Vis-NIR set-up is capable of measuring UV-Vis-
NIR spectra, not only as a function of time, but also as a function of the catalyst bed
height. Therefore a dehydrogenation experiment was performed with a 13 wt% Cr /
Al2O3 catalyst and during this experiment the catalyst was monitored via 4 UV-Vis-
NIR probes according to Figure 2.4. Simultaneously the activity was measured via
GC measurements and Raman spectra were collected. The activity data measured via
GC is presented in Figure 2.8.
0 50 100 150 200 2500
20
40
60
80
100
Conversion (%)
Time (min)
Selectivity
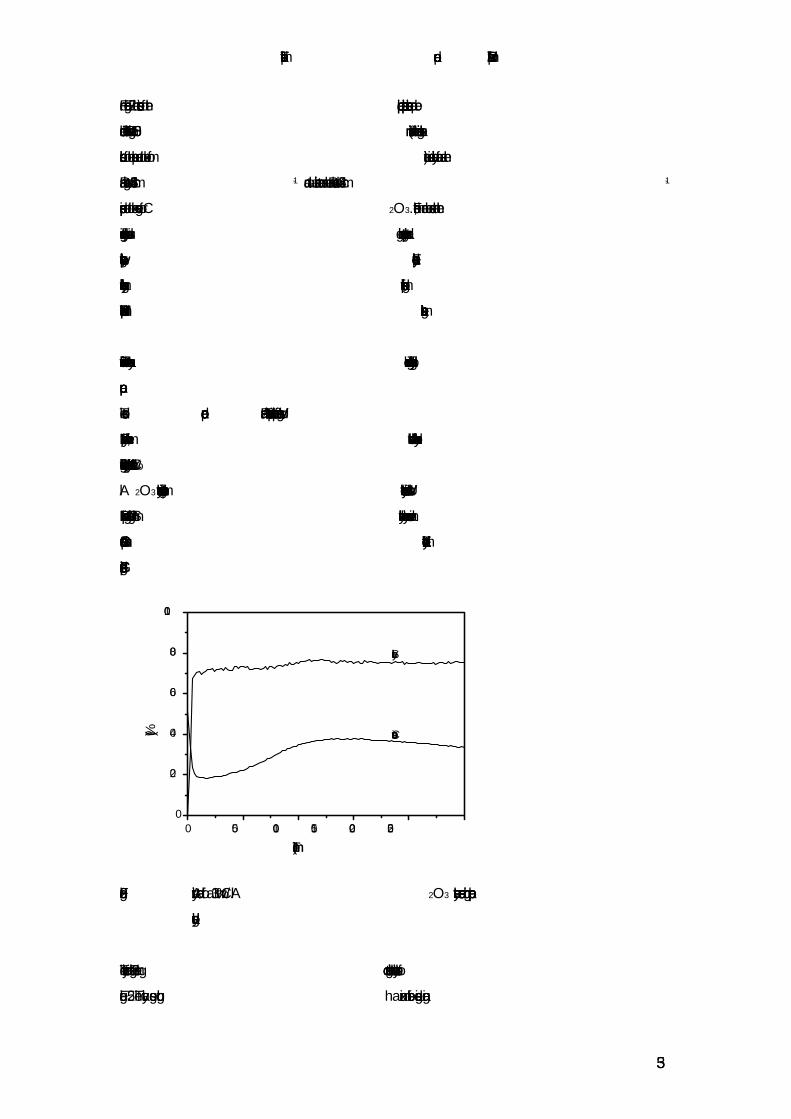
Figure 2.8 Activity data of a 13 wt% Cr / Al2O3 catalyst measured during propane
dehydrogenation.
The activity data in Figure 2.8 are in good agreement with the catalytic results of
Figure 2.5. The activity goes through a maximum before decreasing again.

Chapter 2
36
Furthermore coke is formed decreasing the selectivity to ca. 75 %. Also the Raman
data in Figure 2.9 show no differences compared to the previously described
experiment in the other set-up. The two coke bands at Raman shifts of 1330 and 1580
cm-1 increase during propane dehydrogenation and disappear again during
regeneration of the catalyst. The resemblance so far is not surprising since the same
catalyst was used in the previously described experiment. The bands at 800, 1050 and
1200 cm-1 originate from the quartz cell used in these experiments. The sharp band at
1555 cm-1 can be assigned to O2. This O2 is present in the air outside the reactor
between the reactor and objective (5.5”) and thus NOT present inside the reactor. By
measuring Raman via this objective, the detection of this peak is unavoidable.
750 1000 1250 1500 1750 2000
Inte
nsity
(a.u
.)
Raman shift (cm-1)
a,dc
d
Figure 2.9 Raman data of a 13 wt% Cr / Al2O3 catalyst a) before switching to propane
dehydrogenation, b) after 2 h and c) 4 h of dehydrogenation and d) after complete
reoxidation.
However, with this set-up it is also possible to measure UV-Vis-NIR spectroscopy as
a function of the catalyst bed height. When looking at the individual UV-Vis-NIR
spectra similar spectra are obtained as presented in Figures 2.6A and B. However,
these similarities end when the development of coke is monitored as function of time
via the course of the baseline at 1000 nm. Figure 2.10 shows the course of the
background level in the UV-Vis-NIR spectra at different heights of the catalyst.

The development of an operando Raman / UV-Vis-NIR set-up
37
0 50 100 150 200 250
4
3
2
1
Abs
orpt
ion
(a.u
.)
Time (min)
Figure 2.10 UV-Vis-NIR trends of sample absorbance at 1000 nm over time measured at
different heights in the reactor (1 = top, 4 = bottom).
From this figure it is clear that a large difference exists in the background signal
between the top and the bottom of the reactor. Since the background signal is
indicative for the blackening of the catalyst, and thus the amount of coke formed on
the catalyst, this suggests that the amount of coke at the bottom of the reactor is
larger than at the top.
This is in agreement with observations performed after cooling the reactor to room
temperature in helium at the end of the dehydrogenation cycle. After removal of the
reactor from the oven a clear coke gradient could be observed visually over the
catalyst bed. The top of the bed was light green, slowly changing into dark gray
towards the bottom of the catalyst. Thermogravimetric analysis (coke combustion in
air) showed a coke content on the catalyst increasing from 0.1 wt% at the top of the
catalyst bed to 1.0 wt% at the bottom of the bed.
Implications of combining spectroscopic information to catalytic data simultaneously
with the described experiments it is shown that it is possible to obtain operando
Raman and UV-Vis-NIR spectra and correlate the features to activity data. With the
possibility of monitoring coke in a dynamical way, this information can be
implemented in a process control system, which adjusts cycle times for the
dehydrogenation process to optimally run the process. Before this is reality, it would
be best if the qualitative Raman information on the amount of coke present on the
catalyst could be quantified.
Gas in
Gas out
1
2
3
4

Chapter 2
38
Operando UV-Vis-NIR measurements can be used to monitor the long-term
deactivation of the catalyst. Puurunen and Weckhuysen34 have reported that the
active chromium oxide species in the dehydrogenation is most likely the chromium
oxide, which undergoes a redox cycle in the dehydrogenation-regeneration cycles.
Permanent deactivation of the catalyst is linked to a decrease in the amount of this
redox type chromium oxide. Therefore, the change in the relative peak intensities of
the 450 and 630 nm bands on switching from air to propane can be used to determine
when the catalyst needs to be replaced. The capability of operando UV-Vis-NIR
measurements to determine long-term deactivation was verified by performing an
experiment in which the catalyst was purposely deactivated. Therefore, the catalyst
was put in an oven at 1200 °C. It is known that at this temperature the chromium
incorporates the alumina and is deactivated, which is similar to the ‘lost’ of
chromium during the catalyst life. In Figure 2.11 the UV-Vis-NIR spectra of the fresh
and deactivated catalysts are presented. Chromium oxide is slowly ‘loss’ during the
catalyst life and as a result is migrated into the alumina support. This results in the
absorption shifting to higher energies. This change in the UV-Vis-NIR spectrum
shows that operando measurements can provide essential information on the catalyst
activity and the related deactivation phenomena.
200 300 400 500 600 700 800 900 1000
Abs
orba
nce
(a.u
.)
Wavelength (nm)
Figure 2.11 Comparison between the UV–Vis spectra of a fresh 13 wt% chromium on
alumina catalyst (solid) and a deactivated catalyst in which the chromium has
moved into the alumina lattice by a high-temperature treatment (dotted, 1473
K, 12 h).

The development of an operando Raman / UV-Vis-NIR set-up
39
Conclusions
The results in this chapter show the value of combining operando spectroscopic
techniques with on-line product analysis using mass spectrometry and / or micro-
GC. It has been shown that operando spectroscopy is an effective method to study the
dynamics of a chromium oxide catalyst during the dehydrogenation of propane. UV-
Vis-NIR spectroscopy is able to monitor the oxidation state of the catalyst and the
changing background signal is indicative for the coke content on the catalyst. Raman
spectroscopy provides information on the coke content on the catalyst, which is in
agreement with UV-Vis-NIR spectroscopy. Increasing the number of UV-Vis-NIR
probes makes it possible to monitor the catalyst as a function of the catalyst bed
height. It is suggested that the system could be up-scaled to an industrial
environment if the amount of coke can be determined, i.e. if on-line quantitative
information could be gathered.
References 1. Eramo, M., Asia Petrochemical Industry Conference Raw Materials Committee Meeting,
Kuala Lumpur, Malaysia, 2004.
2. Short, P. L., Chem. Eng. News, 2005, 83, 30.
3. Milmo, S., Chem. World, 2005, 2, 36.
4. Tullo, A. H., Chem. Eng. News, 2003, 81, 15.
5. Aitani, A. M., Oil Gas Eur. Mag., 2004, 30, 36.
6. Parkinson, G., CEPmagazine, 2004.
7. Walther, M., Oil & Gas J., 2003, 101, 52.
8. Houdek, J. M.; Andersen, J., ARTC 8th Annual Meeting, Kuala Lumpur, 2005.
9. Tan, L., Asia Petrochemical Industry Conference Raw Materials Committee Meeting,
Kuala Lumpur, Malaysia, 2004.
10. Calamur, N.; Carrera, M. Propylene. In Kirk-Othmer Encyclopedia of Chemical
Technology; online edition ed.; John Wiley & Sons, Inc, 1996.
11. Bhasin, M. M.; Mccain, J. H.; Vora, B. V.; Imai, T.; Pujado, P. R., Appl. Catal. A-Gen., 2001,
221, 397.
12. Eisele, P.; Killpack, R. Propene. In Ullmannʹs Encyclopedia of Industrial Chemistry;
online edition ed.; Wiley-VCH Verlag GmbH & Co., 2000.
13. Catofin Dehydrogenation, 2005 at www.ABB.com
14. Oleflex tm Process for Propylene Production, 2004 at www.UOP.com
15. Buyanov, R. A.; Pakhomov, N. A., Kinet. Catal., 2001, 42, 64.
16. The Uhde Star Process ʹOxydehydrogenation of light paraffins to olefinsʹ, 2003 at
www.uhde.de.

Chapter 2
40
17. Uhdeʹs STAR process - Oxydehydrogenation of propane or butanes to olefins, 2004 at
www.uhde.de.
18. Buonomo, F.; Sanfilippo, D.; Trifiro, F. Dehydrogenation Reactions. In Handbook of
Heterogeneous Catalysis; Ertl, G., Knozinger, H., Weitkamp, J., Eds.; VCH: Weinheim,
1997; Vol. 5.
19. Chua, Y. T.; Stair, P. C., J. Catal., 2003, 213, 39.
20. Nijhuis, T. A.; Tinnemans, S. J.; Visser, T.; Weckhuysen, B. M., Phys. Chem. Chem. Phys.,
2003, 5, 4361.
21. Nijhuis, T. A.; Tinnemans, S. J.; Visser, T.; Weckhuysen, B. M., Chem. Eng. Sci., 2004, 59,
5487.
22. Scarano, D.; Spoto, G.; Bordiga, S.; Carnelli, L.; Ricchiardi, G.; Zecchina, A., Langmuir,
1994, 10, 3094.
23. Vidano, R. P.; Fischbach, D. B.; Willis, L. J.; Loehr, T. M., Solid State Commun., 1981, 39,
341.
24. Lespade, P.; Marchand, A.; Couzi, M.; Cruege, F., Carbon, 1984, 22, 375.
25. Ager, J. W.; Veirs, D. K.; Shamir, J.; Rosenblatt, G. M., J. Appl. Phys., 1990, 68, 3598.
26. Kong, F.; Kostecki, R.; Nadeau, G.; Song, X.; Zaghib, K.; Kinoshita, K.; McLarnon, F., J.
Power Sources, 2001, 97-8, 58.
27. Sze, S. K.; Siddique, N.; Sloan, J. J.; Escribano, R., Atmos. Environ., 2001, 35, 561.
28. Compagnini, G.; Puglisi, O.; Foti, G., Carbon, 1997, 35, 1793.
29. Escribano, R.; Sloan, J. J.; Siddique, N.; Sze, N.; Dudev, T., Vibr. Spectrosc., 2001, 26, 179.
30. Mertes, S.; Dippel, B.; Schwarzenbock, A., J. Aerosol Sci., 2004, 35, 347.
31. Wang, Y.; Alsmeyer, D. C.; McCreery, R. L., Chem. Mat., 1990, 2, 557.
32. Vuurman, M. A.; Hardcastle, F. D.; Wachs, I. E., J. Mol. Catal., 1993, 84, 193.
33. Weckhuysen, B. M.; Wachs, I. E.; Schoonheydt, R. A., Chem. Rev., 1996, 96, 3327.
34. Puurunen, R. L.; Weckhuysen, B. M., J. Catal., 2002, 210, 418.