operation and maintenance cost estimator (omce) to ... · operation and maintenance cost estimator...
TRANSCRIPT
ECN-M--09-126
Operation and maintenance cost estimator (OMCE) to estimate the future O&M costs of offshore wind
farmsL.W.M.M. Rademakers
H. Braam T.S. Obdam
R.P. v.d. Pieterman
This report has been presented at the European Offshore Wind 2009 Conference, Stockholm, 14-16 September, 2009

ECN-M--09-126 2
ECN-M--09-126 3
OPERATION AND MAINTENANCE COST ESTIMATOR (OMCE) TO ESTIMATE THE FUTURE O&M COSTS OF OFFSHORE WIND FARMS
L.W.M.M. Rademakers, H. Braam, T.S. Obdam, R.P. v.d. Pieterman
Energy Research Centre of the Netherlands (ECN) Wind Energy, P.O. Box 1, 1755 ZG Petten
Tel. (+31) 224 56 4943, Fax. (+31) 224 56 8214 [email protected]
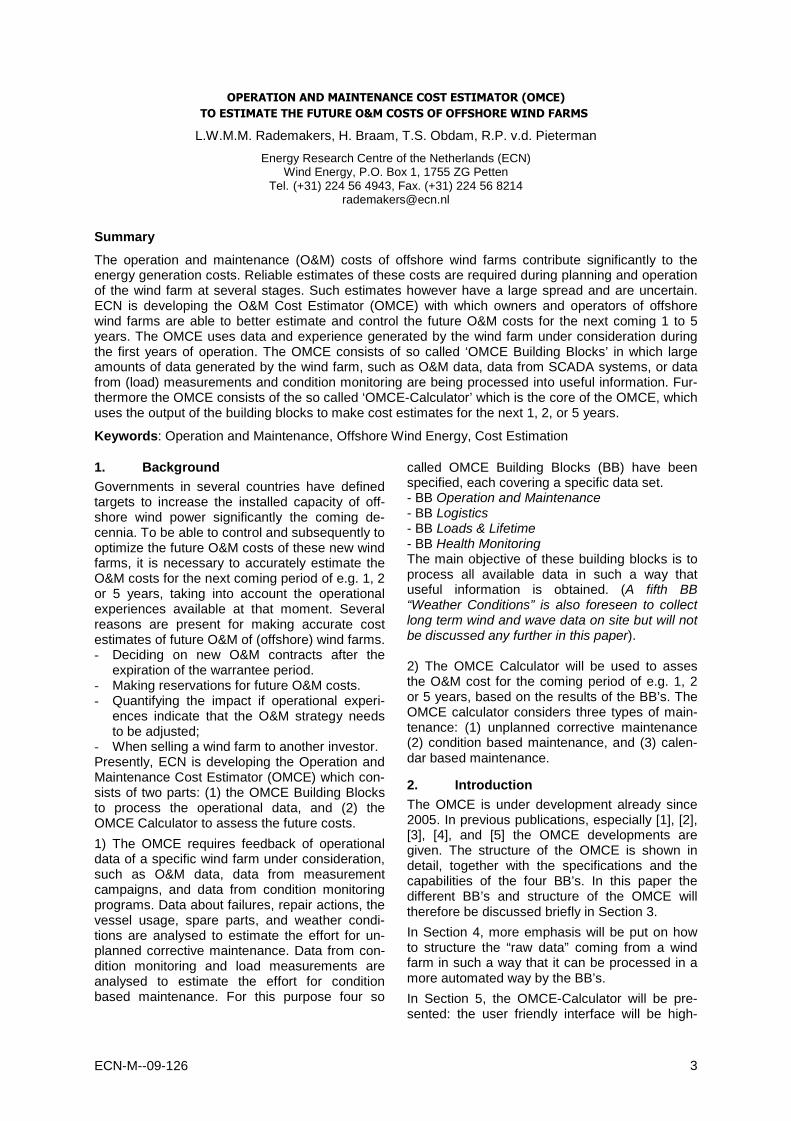
Summary
The operation and maintenance (O&M) costs of offshore wind farms contribute significantly to the energy generation costs. Reliable estimates of these costs are required during planning and operation of the wind farm at several stages. Such estimates however have a large spread and are uncertain. ECN is developing the O&M Cost Estimator (OMCE) with which owners and operators of offshore wind farms are able to better estimate and control the future O&M costs for the next coming 1 to 5 years. The OMCE uses data and experience generated by the wind farm under consideration during the first years of operation. The OMCE consists of so called ‘OMCE Building Blocks’ in which large amounts of data generated by the wind farm, such as O&M data, data from SCADA systems, or data from (load) measurements and condition monitoring are being processed into useful information. Fur-thermore the OMCE consists of the so called ‘OMCE-Calculator’ which is the core of the OMCE, which uses the output of the building blocks to make cost estimates for the next 1, 2, or 5 years.
Keywords: Operation and Maintenance, Offshore Wind Energy, Cost Estimation
1. Background Governments in several countries have defined targets to increase the installed capacity of off-shore wind power significantly the coming de-cennia. To be able to control and subsequently to optimize the future O&M costs of these new wind farms, it is necessary to accurately estimate the O&M costs for the next coming period of e.g. 1, 2 or 5 years, taking into account the operational experiences available at that moment. Several reasons are present for making accurate cost estimates of future O&M of (offshore) wind farms. - Deciding on new O&M contracts after the
expiration of the warrantee period. - Making reservations for future O&M costs. - Quantifying the impact if operational experi-
ences indicate that the O&M strategy needs to be adjusted;
- When selling a wind farm to another investor. Presently, ECN is developing the Operation and Maintenance Cost Estimator (OMCE) which con-sists of two parts: (1) the OMCE Building Blocks to process the operational data, and (2) the OMCE Calculator to assess the future costs.
1) The OMCE requires feedback of operational data of a specific wind farm under consideration, such as O&M data, data from measurement campaigns, and data from condition monitoring programs. Data about failures, repair actions, the vessel usage, spare parts, and weather condi-tions are analysed to estimate the effort for un-planned corrective maintenance. Data from con-dition monitoring and load measurements are analysed to estimate the effort for condition based maintenance. For this purpose four so
called OMCE Building Blocks (BB) have been specified, each covering a specific data set. - BB Operation and Maintenance - BB Logistics - BB Loads & Lifetime - BB Health Monitoring The main objective of these building blocks is to process all available data in such a way that useful information is obtained. (A fifth BB “Weather Conditions” is also foreseen to collect long term wind and wave data on site but will not be discussed any further in this paper). 2) The OMCE Calculator will be used to asses the O&M cost for the coming period of e.g. 1, 2 or 5 years, based on the results of the BB’s. The OMCE calculator considers three types of main-tenance: (1) unplanned corrective maintenance (2) condition based maintenance, and (3) calen-dar based maintenance.
2. Introduction The OMCE is under development already since 2005. In previous publications, especially [1], [2], [3], [4], and [5] the OMCE developments are given. The structure of the OMCE is shown in detail, together with the specifications and the capabilities of the four BB’s. In this paper the different BB’s and structure of the OMCE will therefore be discussed briefly in Section 3.
In Section 4, more emphasis will be put on how to structure the “raw data” coming from a wind farm in such a way that it can be processed in a more automated way by the BB’s.
In Section 5, the OMCE-Calculator will be pre-sented: the user friendly interface will be high-
ECN-M--09-126 4
lighted and the capabilities will be demonstrated by means of examples.
Finally in Section 6, the paper will discuss the position of the OMCE within the daily procedures for O&M of an offshore wind farm. The OMCE should not be regarded as a replacement of a maintenance management system. In fact it is an add-on to such a system.
3. OMCE Structure
3.1 Total OMCE concept
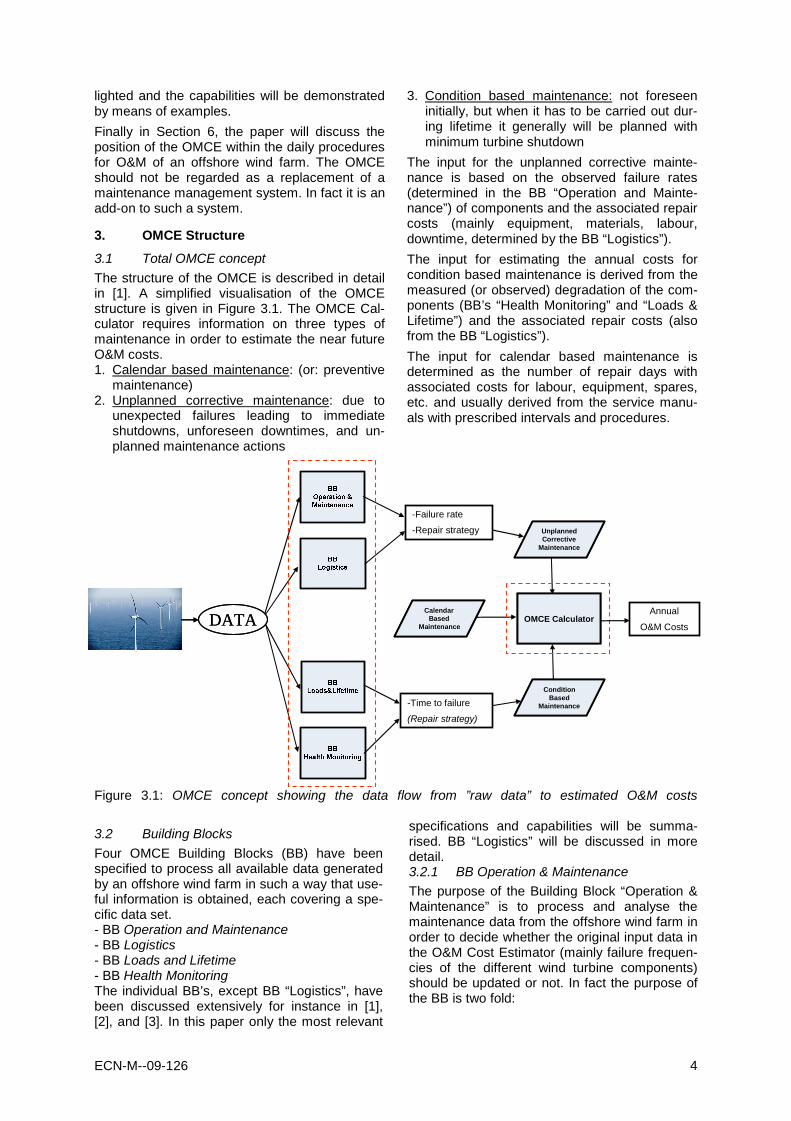
The structure of the OMCE is described in detail in [1]. A simplified visualisation of the OMCE structure is given in Figure 3.1. The OMCE Cal-culator requires information on three types of maintenance in order to estimate the near future O&M costs. 1. Calendar based maintenance: (or: preventive
maintenance) 2. Unplanned corrective maintenance: due to
unexpected failures leading to immediate shutdowns, unforeseen downtimes, and un-planned maintenance actions
3. Condition based maintenance: not foreseen initially, but when it has to be carried out dur-ing lifetime it generally will be planned with minimum turbine shutdown
The input for the unplanned corrective mainte-nance is based on the observed failure rates (determined in the BB “Operation and Mainte-nance”) of components and the associated repair costs (mainly equipment, materials, labour, downtime, determined by the BB “Logistics”).
The input for estimating the annual costs for condition based maintenance is derived from the measured (or observed) degradation of the com-ponents (BB’s “Health Monitoring” and “Loads & Lifetime”) and the associated repair costs (also from the BB “Logistics”).
The input for calendar based maintenance is determined as the number of repair days with associated costs for labour, equipment, spares, etc. and usually derived from the service manu-als with prescribed intervals and procedures.
Figure 3.1: OMCE concept showing the data flow from ”raw data” to estimated O&M costs
3.2 Building Blocks
Four OMCE Building Blocks (BB) have been specified to process all available data generated by an offshore wind farm in such a way that use-ful information is obtained, each covering a spe-cific data set. - BB Operation and Maintenance - BB Logistics - BB Loads and Lifetime - BB Health Monitoring The individual BB’s, except BB “Logistics”, have been discussed extensively for instance in [1], [2], and [3]. In this paper only the most relevant
specifications and capabilities will be summa-rised. BB “Logistics” will be discussed in more detail. 3.2.1 BB Operation & Maintenance
The purpose of the Building Block “Operation & Maintenance” is to process and analyse the maintenance data from the offshore wind farm in order to decide whether the original input data in the O&M Cost Estimator (mainly failure frequen-cies of the different wind turbine components) should be updated or not. In fact the purpose of the BB is two fold:
INFO
INFO
DATADATA
-Failure rate
-Repair strategy
-Time to failure
(Repair strategy)
Annual
O&M CostsOMCE Calculator
Condition Based
Maintenance
Unplanned Corrective
Maintenance
Calendar Based
MaintenanceOMCE Calculator
Condition Based
Maintenance
Unplanned Corrective
Maintenance
Calendar Based
Maintenance
ECN-M--09-126 5
1. generating information about the failure be-haviour of the components among others to assess the adequacy of the maintenance strategy, e.g. by means of trend analyses and ranking of failures;
2. generating updated figures of the failure rates (and failure modes) and repair actions of components to be used as input for the OMCE Calculator.
Based on the ECN Maintenance Manager pro-ject [6] a database structure has been developed to collect the maintenance information from wind turbines in a systematic manner. The database is specific for a certain turbine type because it contains the detailed breakdown of the turbine. The breakdown includes the failure classes and predefined repair classes. It is important that pre-defined answers are defined in this data-base, so that processing of the data can be automated. (Author’s note: At present ECN is investigating the adequacy of the “Reference Designation System for Power Plants (RDS-PP) [14] as a system for defining a turbine breakdown and defining systems and components in a unique way as a starting point for data collection. The first results show that the RDS-PP method is very useful but is yet not widely accepted.)
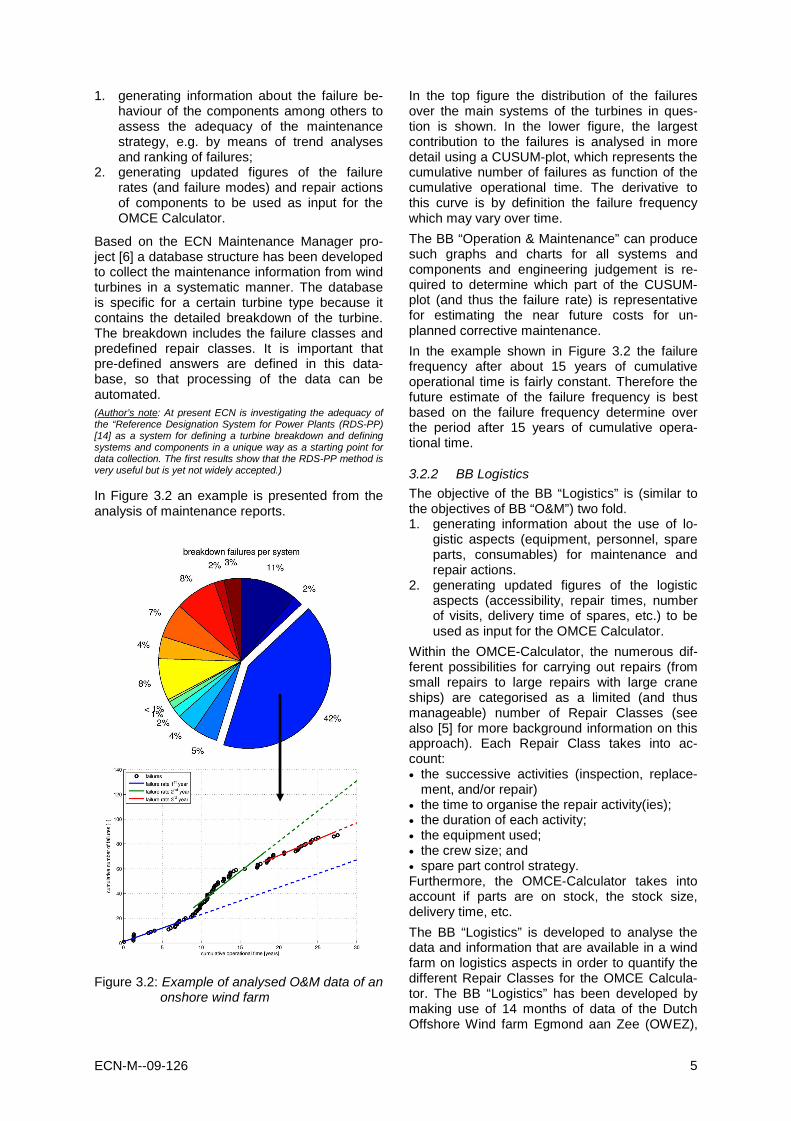
In Figure 3.2 an example is presented from the analysis of maintenance reports.
Figure 3.2: Example of analysed O&M data of an
onshore wind farm
In the top figure the distribution of the failures over the main systems of the turbines in ques-tion is shown. In the lower figure, the largest contribution to the failures is analysed in more detail using a CUSUM-plot, which represents the cumulative number of failures as function of the cumulative operational time. The derivative to this curve is by definition the failure frequency which may vary over time.
The BB “Operation & Maintenance” can produce such graphs and charts for all systems and components and engineering judgement is re-quired to determine which part of the CUSUM-plot (and thus the failure rate) is representative for estimating the near future costs for un-planned corrective maintenance.
In the example shown in Figure 3.2 the failure frequency after about 15 years of cumulative operational time is fairly constant. Therefore the future estimate of the failure frequency is best based on the failure frequency determine over the period after 15 years of cumulative opera-tional time.
3.2.2 BB Logistics
The objective of the BB “Logistics” is (similar to the objectives of BB “O&M”) two fold. 1. generating information about the use of lo-
gistic aspects (equipment, personnel, spare parts, consumables) for maintenance and repair actions.
2. generating updated figures of the logistic aspects (accessibility, repair times, number of visits, delivery time of spares, etc.) to be used as input for the OMCE Calculator.
Within the OMCE-Calculator, the numerous dif-ferent possibilities for carrying out repairs (from small repairs to large repairs with large crane ships) are categorised as a limited (and thus manageable) number of Repair Classes (see also [5] for more background information on this approach). Each Repair Class takes into ac-count: • the successive activities (inspection, replace-
ment, and/or repair) • the time to organise the repair activity(ies); • the duration of each activity; • the equipment used; • the crew size; and • spare part control strategy. Furthermore, the OMCE-Calculator takes into account if parts are on stock, the stock size, delivery time, etc.
The BB “Logistics” is developed to analyse the data and information that are available in a wind farm on logistics aspects in order to quantify the different Repair Classes for the OMCE Calcula-tor. The BB “Logistics” has been developed by making use of 14 months of data of the Dutch Offshore Wind farm Egmond aan Zee (OWEZ),
ECN-M--09-126 6
owned by Noordzeewind. The OWEZ Wind farm consists of 36 Vestas V90 turbines. The data and information that have been analysed com-prised the following. 1 • SCADA data and overviews of alarms, includ-
ing downtimes and production figures; • Visits (planned and executed); • Sheets with information on transfer and hoist-
ing equipment and on the crew size; • Weather conditions on a daily basis; • Information on spares used; • “Hand made” monthly reports with most rele-
vant findings of the wind farm.
It was concluded that the data processing to obtain the relevant data for the different Repair Classes appeared to be very labour intensive. The different sources of information were com-plementary to each other but the relationship between them was not always clear. “Reverse” engineering was often necessary to re-construct what actually has happened and how failures were actually repaired. Two aspects appeared to be crucial in the data processing:
1. Often it was unclear from the individual re-ports what the trigger was for a certain visit or repair action. The trigger can be for instance an alarm leading to a shutdown, or the result of an inspection. If the trigger leads to a se-quence of different maintenance actions, it should be clear afterwards which group of ac-tions belong to one event.
2. The events need to be sorted in chronological order. This means that the list with alarms and information from vessel transfers, use of crane ships, weather information and person-nel needs to be integrated into one list.
It was concluded by the authors that the different data sources with information on logistics (equipment and spare parts) cannot be analysed straight forwardly. An intermediate step is nec-essary to structure the data before it can be processed by the BB “Logistics”. Within the OMCE development this structured list with events is called and “event list” and will be dis-cussed in more detail in Section 4.
Although the data analysis appeared to be la-bour intensive, meaningful results have been obtained to demonstrate the usefulness of the BB “Logistics”. It was not possible due to limita-tions in budget and time to analyse the data of
1 In parallel to the development, construction, and operation of the wind farm a measurement and monitoring program is carried out (called MEP-NSW) in order to learn lessons on technical and environmental aspects that can be used for the development of new offshore wind farms. The logistics data of the OWEZ wind farm has been submitted by Noordzeewind to ECN as part of this monitoring program. The MEP-NSW program is mainly funded by SenterNovem.
all 36 turbines. The examples below are based on four turbines only.
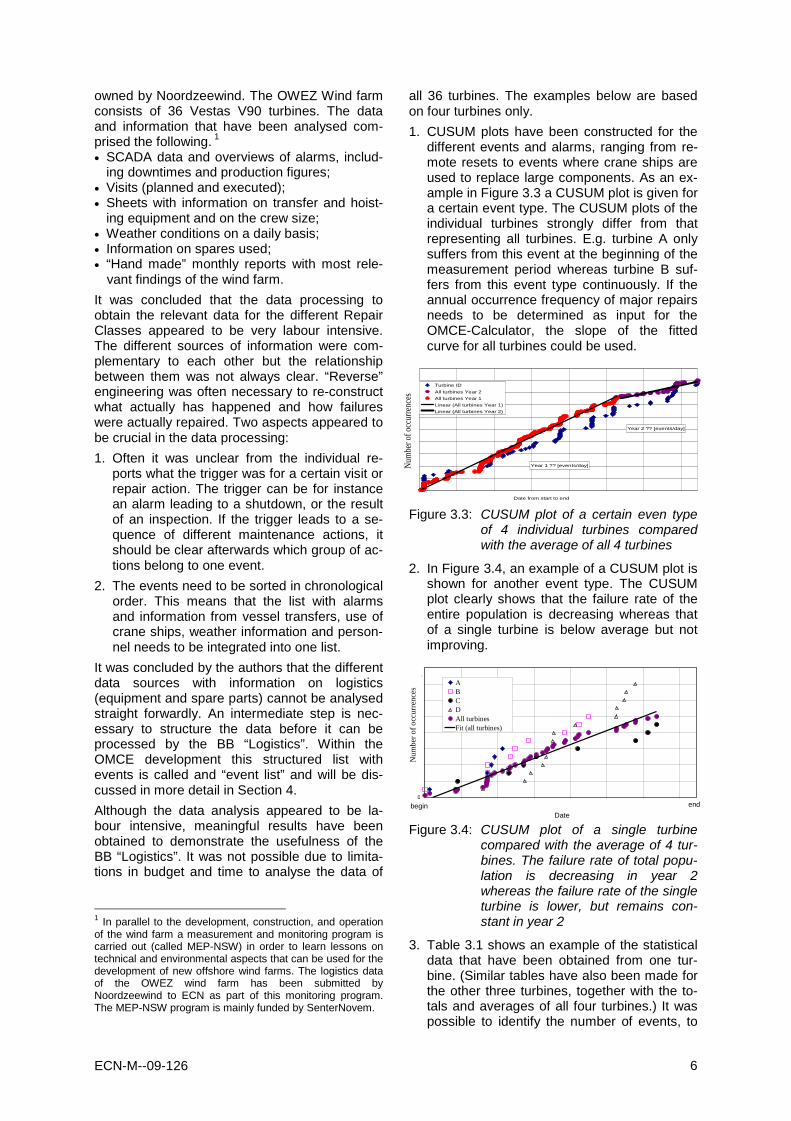
1. CUSUM plots have been constructed for the different events and alarms, ranging from re-mote resets to events where crane ships are used to replace large components. As an ex-ample in Figure 3.3 a CUSUM plot is given for a certain event type. The CUSUM plots of the individual turbines strongly differ from that representing all turbines. E.g. turbine A only suffers from this event at the beginning of the measurement period whereas turbine B suf-fers from this event type continuously. If the annual occurrence frequency of major repairs needs to be determined as input for the OMCE-Calculator, the slope of the fitted curve for all turbines could be used.
Figure 3.3: CUSUM plot of a certain even type of 4 individual turbines compared with the average of all 4 turbines
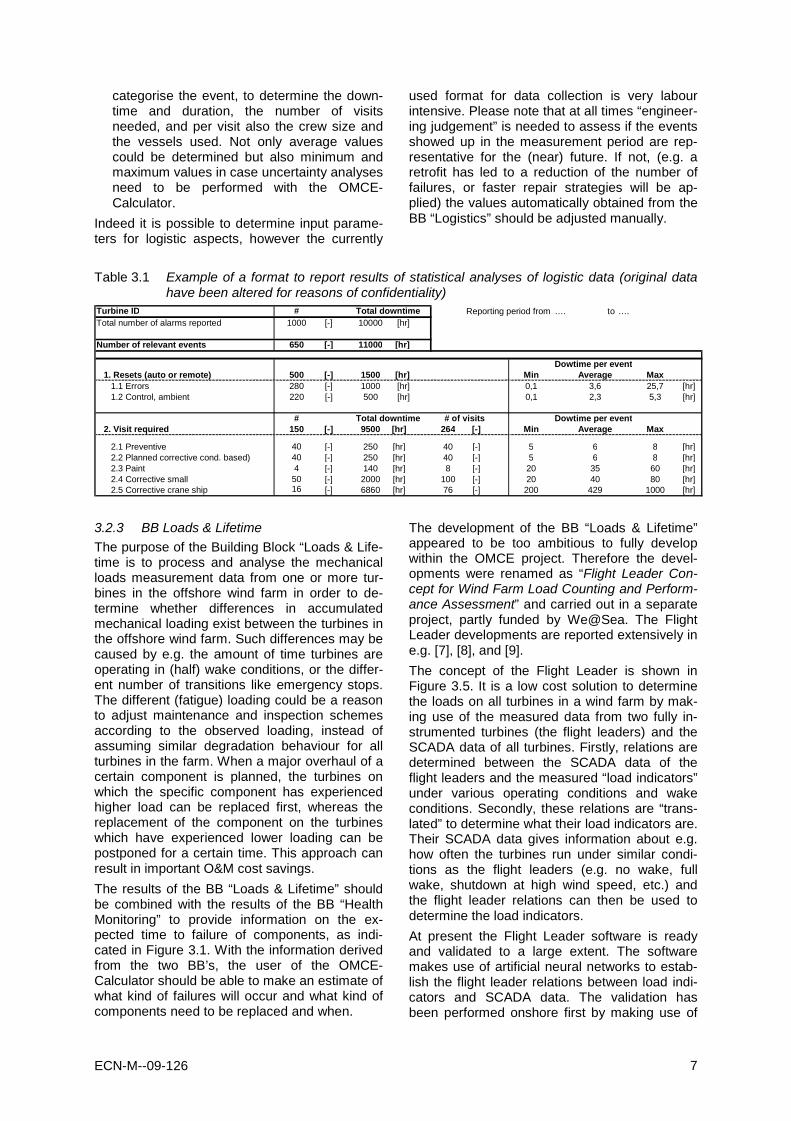
2. In Figure 3.4, an example of a CUSUM plot is shown for another event type. The CUSUM plot clearly shows that the failure rate of the entire population is decreasing whereas that of a single turbine is below average but not improving.
Figure 3.4: CUSUM plot of a single turbine compared with the average of 4 tur-bines. The failure rate of total popu-lation is decreasing in year 2 whereas the failure rate of the single turbine is lower, but remains con-stant in year 2
3. Table 3.1 shows an example of the statistical data that have been obtained from one tur-bine. (Similar tables have also been made for the other three turbines, together with the to-tals and averages of all four turbines.) It was possible to identify the number of events, to
0
begin end Date
mber lure
9999 A B C
All turbines Linear (All turbines)
N
umbe
r of
occ
urre
nces
A B C D All turbines Fit (all turbines)
N
umbe
r of o
ccur
renc
es
Year 1 ?? [events/day]
Year 2 ?? [events/day]
Date from start to end
Turbine ID
All turbines Year 2
All turbines Year 1
Linear (All turbines Year 1)
Linear (All turbines Year 2)
ECN-M--09-126 7
categorise the event, to determine the down-time and duration, the number of visits needed, and per visit also the crew size and the vessels used. Not only average values could be determined but also minimum and maximum values in case uncertainty analyses need to be performed with the OMCE-Calculator.
Indeed it is possible to determine input parame-ters for logistic aspects, however the currently
used format for data collection is very labour intensive. Please note that at all times “engineer-ing judgement” is needed to assess if the events showed up in the measurement period are rep-resentative for the (near) future. If not, (e.g. a retrofit has led to a reduction of the number of failures, or faster repair strategies will be ap-plied) the values automatically obtained from the BB “Logistics” should be adjusted manually.
Table 3.1 Example of a format to report results of statistical analyses of logistic data (original data have been altered for reasons of confidentiality)
Turbine ID # Total downtime Reporting period from …. to ….Total number of alarms reported 1000 [-] 10000 [hr]
Number of relevant events 650 [-] 11000 [hr]
Dowtime per event1. Resets (auto or remote) 500 [-] 1500 [hr] Min Average Max
1.1 Errors 280 [-] 1000 [hr] 0,1 3,6 25,7 [hr]1.2 Control, ambient 220 [-] 500 [hr] 0,1 2,3 5,3 [hr]
# Total downtime # of visits Dowtime per event2. Visit required 150 [-] 9500 [hr] 264 [-] Min Average Max
2.1 Preventive 40 [-] 250 [hr] 40 [-] 5 6 8 [hr]2.2 Planned corrective cond. based) 40 [-] 250 [hr] 40 [-] 5 6 8 [hr]2.3 Paint 4 [-] 140 [hr] 8 [-] 20 35 60 [hr]2.4 Corrective small 50 [-] 2000 [hr] 100 [-] 20 40 80 [hr]2.5 Corrective crane ship 16 [-] 6860 [hr] 76 [-] 200 429 1000 [hr]
3.2.3 BB Loads & Lifetime
The purpose of the Building Block “Loads & Life-time is to process and analyse the mechanical loads measurement data from one or more tur-bines in the offshore wind farm in order to de-termine whether differences in accumulated mechanical loading exist between the turbines in the offshore wind farm. Such differences may be caused by e.g. the amount of time turbines are operating in (half) wake conditions, or the differ-ent number of transitions like emergency stops. The different (fatigue) loading could be a reason to adjust maintenance and inspection schemes according to the observed loading, instead of assuming similar degradation behaviour for all turbines in the farm. When a major overhaul of a certain component is planned, the turbines on which the specific component has experienced higher load can be replaced first, whereas the replacement of the component on the turbines which have experienced lower loading can be postponed for a certain time. This approach can result in important O&M cost savings.
The results of the BB “Loads & Lifetime” should be combined with the results of the BB “Health Monitoring” to provide information on the ex-pected time to failure of components, as indi-cated in Figure 3.1. With the information derived from the two BB’s, the user of the OMCE-Calculator should be able to make an estimate of what kind of failures will occur and what kind of components need to be replaced and when.
The development of the BB “Loads & Lifetime” appeared to be too ambitious to fully develop within the OMCE project. Therefore the devel-opments were renamed as “Flight Leader Con-cept for Wind Farm Load Counting and Perform-ance Assessment” and carried out in a separate project, partly funded by We@Sea. The Flight Leader developments are reported extensively in e.g. [7], [8], and [9].
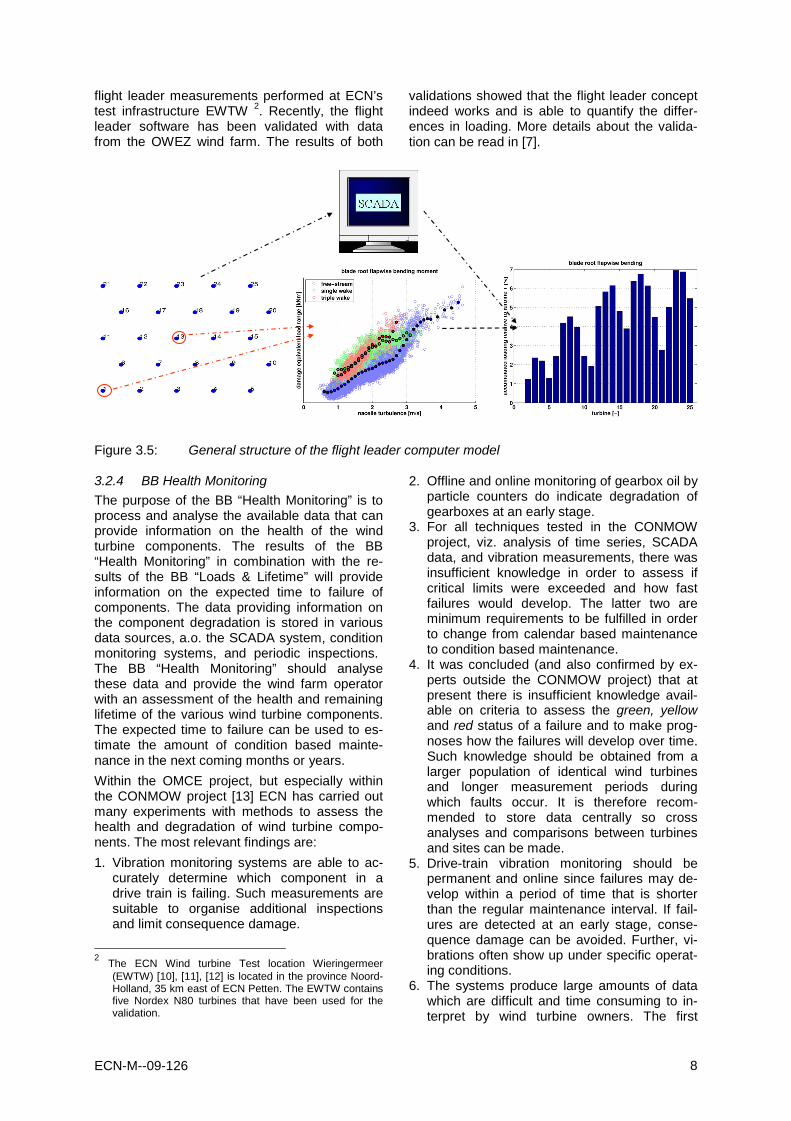
The concept of the Flight Leader is shown in Figure 3.5. It is a low cost solution to determine the loads on all turbines in a wind farm by mak-ing use of the measured data from two fully in-strumented turbines (the flight leaders) and the SCADA data of all turbines. Firstly, relations are determined between the SCADA data of the flight leaders and the measured “load indicators” under various operating conditions and wake conditions. Secondly, these relations are “trans-lated” to determine what their load indicators are. Their SCADA data gives information about e.g. how often the turbines run under similar condi-tions as the flight leaders (e.g. no wake, full wake, shutdown at high wind speed, etc.) and the flight leader relations can then be used to determine the load indicators.
At present the Flight Leader software is ready and validated to a large extent. The software makes use of artificial neural networks to estab-lish the flight leader relations between load indi-cators and SCADA data. The validation has been performed onshore first by making use of
ECN-M--09-126 8
flight leader measurements performed at ECN’s test infrastructure EWTW 2. Recently, the flight leader software has been validated with data from the OWEZ wind farm. The results of both
validations showed that the flight leader concept indeed works and is able to quantify the differ-ences in loading. More details about the valida-tion can be read in [7].
Figure 3.5: General structure of the flight leader computer model 3.2.4 BB Health Monitoring
The purpose of the BB “Health Monitoring” is to process and analyse the available data that can provide information on the health of the wind turbine components. The results of the BB “Health Monitoring” in combination with the re-sults of the BB “Loads & Lifetime” will provide information on the expected time to failure of components. The data providing information on the component degradation is stored in various data sources, a.o. the SCADA system, condition monitoring systems, and periodic inspections.2 The BB “Health Monitoring” should analyse these data and provide the wind farm operator with an assessment of the health and remaining lifetime of the various wind turbine components. The expected time to failure can be used to es-timate the amount of condition based mainte-nance in the next coming months or years.
Within the OMCE project, but especially within the CONMOW project [13] ECN has carried out many experiments with methods to assess the health and degradation of wind turbine compo-nents. The most relevant findings are:
1. Vibration monitoring systems are able to ac-curately determine which component in a drive train is failing. Such measurements are suitable to organise additional inspections and limit consequence damage.
2 The ECN Wind turbine Test location Wieringermeer
(EWTW) [10], [11], [12] is located in the province Noord-Holland, 35 km east of ECN Petten. The EWTW contains five Nordex N80 turbines that have been used for the validation.
2. Offline and online monitoring of gearbox oil by particle counters do indicate degradation of gearboxes at an early stage.
3. For all techniques tested in the CONMOW project, viz. analysis of time series, SCADA data, and vibration measurements, there was insufficient knowledge in order to assess if critical limits were exceeded and how fast failures would develop. The latter two are minimum requirements to be fulfilled in order to change from calendar based maintenance to condition based maintenance.
4. It was concluded (and also confirmed by ex-perts outside the CONMOW project) that at present there is insufficient knowledge avail-able on criteria to assess the green, yellow and red status of a failure and to make prog-noses how the failures will develop over time. Such knowledge should be obtained from a larger population of identical wind turbines and longer measurement periods during which faults occur. It is therefore recom-mended to store data centrally so cross analyses and comparisons between turbines and sites can be made.
5. Drive-train vibration monitoring should be permanent and online since failures may de-velop within a period of time that is shorter than the regular maintenance interval. If fail-ures are detected at an early stage, conse-quence damage can be avoided. Further, vi-brations often show up under specific operat-ing conditions.
6. The systems produce large amounts of data which are difficult and time consuming to in-terpret by wind turbine owners. The first
ECN-M--09-126 9
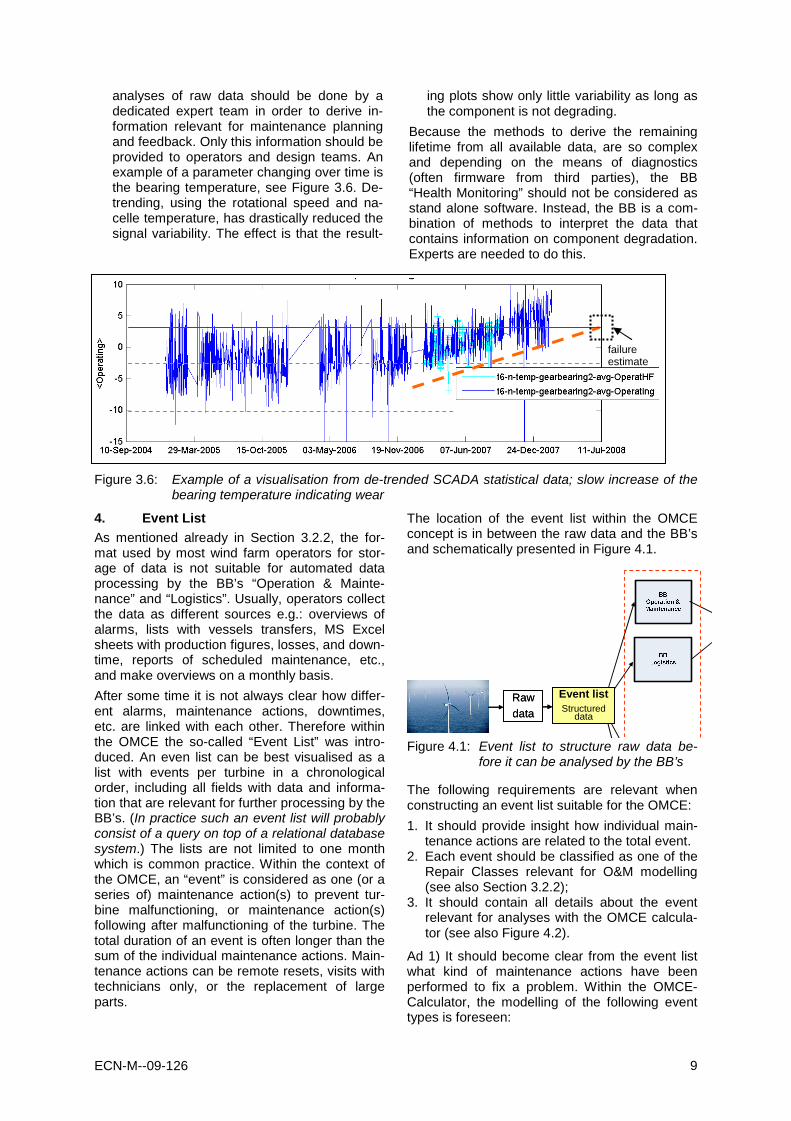
analyses of raw data should be done by a dedicated expert team in order to derive in-formation relevant for maintenance planning and feedback. Only this information should be provided to operators and design teams. An example of a parameter changing over time is the bearing temperature, see Figure 3.6. De-trending, using the rotational speed and na-celle temperature, has drastically reduced the signal variability. The effect is that the result-
ing plots show only little variability as long as the component is not degrading.
Because the methods to derive the remaining lifetime from all available data, are so complex and depending on the means of diagnostics (often firmware from third parties), the BB “Health Monitoring” should not be considered as stand alone software. Instead, the BB is a com-bination of methods to interpret the data that contains information on component degradation. Experts are needed to do this.
Figure 3.6: Example of a visualisation from de-trended SCADA statistical data; slow increase of the
bearing temperature indicating wear
4. Event List As mentioned already in Section 3.2.2, the for-mat used by most wind farm operators for stor-age of data is not suitable for automated data processing by the BB’s “Operation & Mainte-nance” and “Logistics”. Usually, operators collect the data as different sources e.g.: overviews of alarms, lists with vessels transfers, MS Excel sheets with production figures, losses, and down-time, reports of scheduled maintenance, etc., and make overviews on a monthly basis.
After some time it is not always clear how differ-ent alarms, maintenance actions, downtimes, etc. are linked with each other. Therefore within the OMCE the so-called “Event List” was intro-duced. An even list can be best visualised as a list with events per turbine in a chronological order, including all fields with data and informa-tion that are relevant for further processing by the BB’s. (In practice such an event list will probably consist of a query on top of a relational database system.) The lists are not limited to one month which is common practice. Within the context of the OMCE, an “event” is considered as one (or a series of) maintenance action(s) to prevent tur-bine malfunctioning, or maintenance action(s) following after malfunctioning of the turbine. The total duration of an event is often longer than the sum of the individual maintenance actions. Main-tenance actions can be remote resets, visits with technicians only, or the replacement of large parts.
The location of the event list within the OMCE concept is in between the raw data and the BB’s and schematically presented in Figure 4.1.
Figure 4.1: Event list to structure raw data be-fore it can be analysed by the BB’s
The following requirements are relevant when constructing an event list suitable for the OMCE:
1. It should provide insight how individual main-tenance actions are related to the total event.
2. Each event should be classified as one of the Repair Classes relevant for O&M modelling (see also Section 3.2.2);
3. It should contain all details about the event relevant for analyses with the OMCE calcula-tor (see also Figure 4.2).
Ad 1) It should become clear from the event list what kind of maintenance actions have been performed to fix a problem. Within the OMCE-Calculator, the modelling of the following event types is foreseen:
failure estimate
Rawdata
Event list Structured
data
Rawdata
Event list Structured
data
ECN-M--09-126 10
• preventive maintenance; • unplanned corrective maintenance; • condition based maintenance; • shutdown with automatic reset A preventive maintenance event may consist for example of three visits with each a duration of 8 hours. An unplanned corrective maintenance action may consist for example of: several alarms with a remote resets, on site visits to bet-ter understand the problem, replacement of a component with a large vessel, and additional visits for commissioning and the total downtime is longer than the duration of the individual main-tenance actions. The present situation is such that operators receive data and maintenance sheets from service providers and manual effort is needed to establish the relations between the individual actions. If however, the operators be-come in charge of the repair actions they can define a repair job with a unique code after the first trigger (alarm or observation) and close the job after the problem is solved. The unique code could ensure the relation between the individual actions.
Ad 2) To classify the different events it is neces-sary to subdivide the four above mentioned event types. For example, the event “unplanned correc-tive maintenance” can be subdivided into:
• visit with personnel only (small boat); • visit with personnel only (helicopter); • ……; • replacement of large parts (supply vessel and
crane barge).
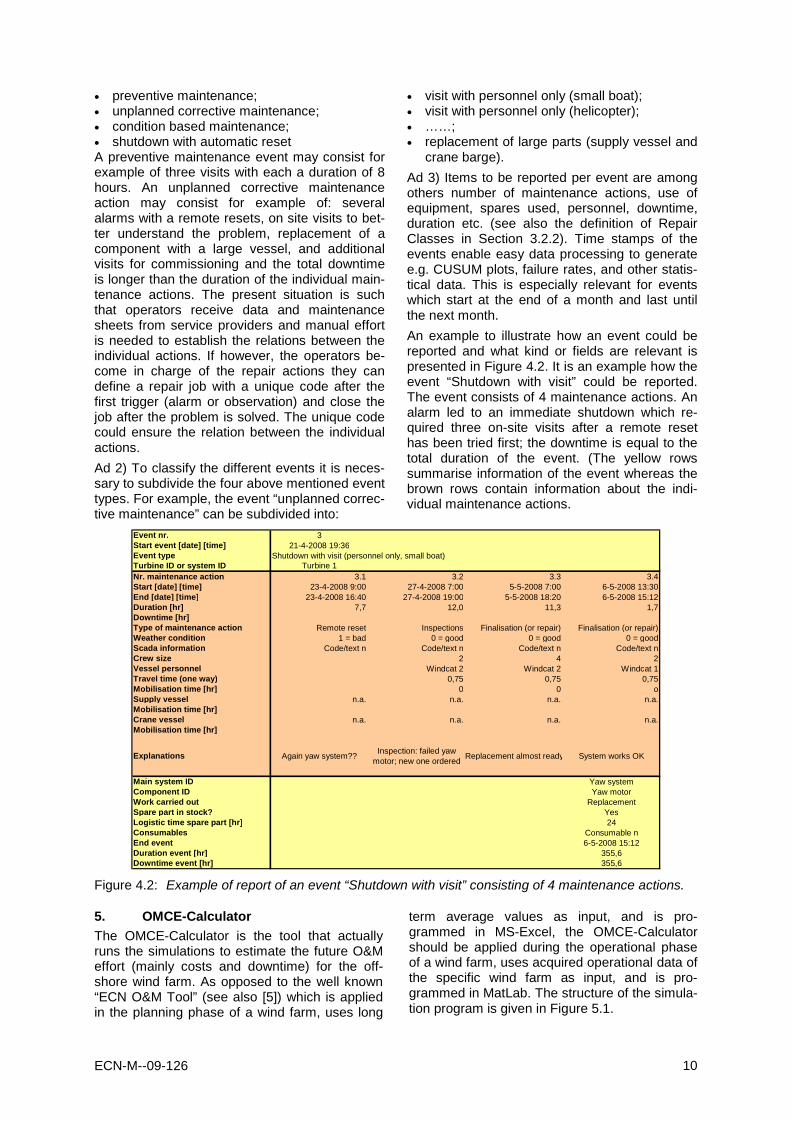
Ad 3) Items to be reported per event are among others number of maintenance actions, use of equipment, spares used, personnel, downtime, duration etc. (see also the definition of Repair Classes in Section 3.2.2). Time stamps of the events enable easy data processing to generate e.g. CUSUM plots, failure rates, and other statis-tical data. This is especially relevant for events which start at the end of a month and last until the next month.
An example to illustrate how an event could be reported and what kind or fields are relevant is presented in Figure 4.2. It is an example how the event “Shutdown with visit” could be reported. The event consists of 4 maintenance actions. An alarm led to an immediate shutdown which re-quired three on-site visits after a remote reset has been tried first; the downtime is equal to the total duration of the event. (The yellow rows summarise information of the event whereas the brown rows contain information about the indi-vidual maintenance actions.
Event nr. 3Start event [date] [time] 21-4-2008 19:36Event type Shutdown with visit (personnel only, small boat)Turbine ID or system ID Turbine 1Nr. maintenance action 3.1 3.2 3.3 3.4Start [date] [time] 23-4-2008 9:00 27-4-2008 7:00 5-5-2008 7:00 6-5-2008 13:30End [date] [time] 23-4-2008 16:40 27-4-2008 19:00 5-5-2008 18:20 6-5-2008 15:12Duration [hr] 7,7 12,0 11,3 1,7Downtime [hr]Type of maintenance action Remote reset Inspections Finalisation (or repair) Finalisation (or repair)Weather condition 1 = bad 0 = good 0 = good 0 = goodScada information Code/text n Code/text n Code/text n Code/text nCrew size 2 4 2Vessel personnel Windcat 2 Windcat 2 Windcat 1Travel time (one way) 0,75 0,75 0,75Mobilisation time [hr] 0 0 oSupply vessel n.a. n.a. n.a. n.a.Mobilisation time [hr]Crane vessel n.a. n.a. n.a. n.a.Mobilisation time [hr]
Explanations Again yaw system??Inspection: failed yaw
motor; new one orderedReplacement almost ready System works OK
Main system ID Yaw systemComponent ID Yaw motorWork carried out ReplacementSpare part in stock? YesLogistic time spare part [hr] 24Consumables Consumable nEnd event 6-5-2008 15:12Duration event [hr] 355,6Downtime event [hr] 355,6
Figure 4.2: Example of report of an event “Shutdown with visit” consisting of 4 maintenance actions.
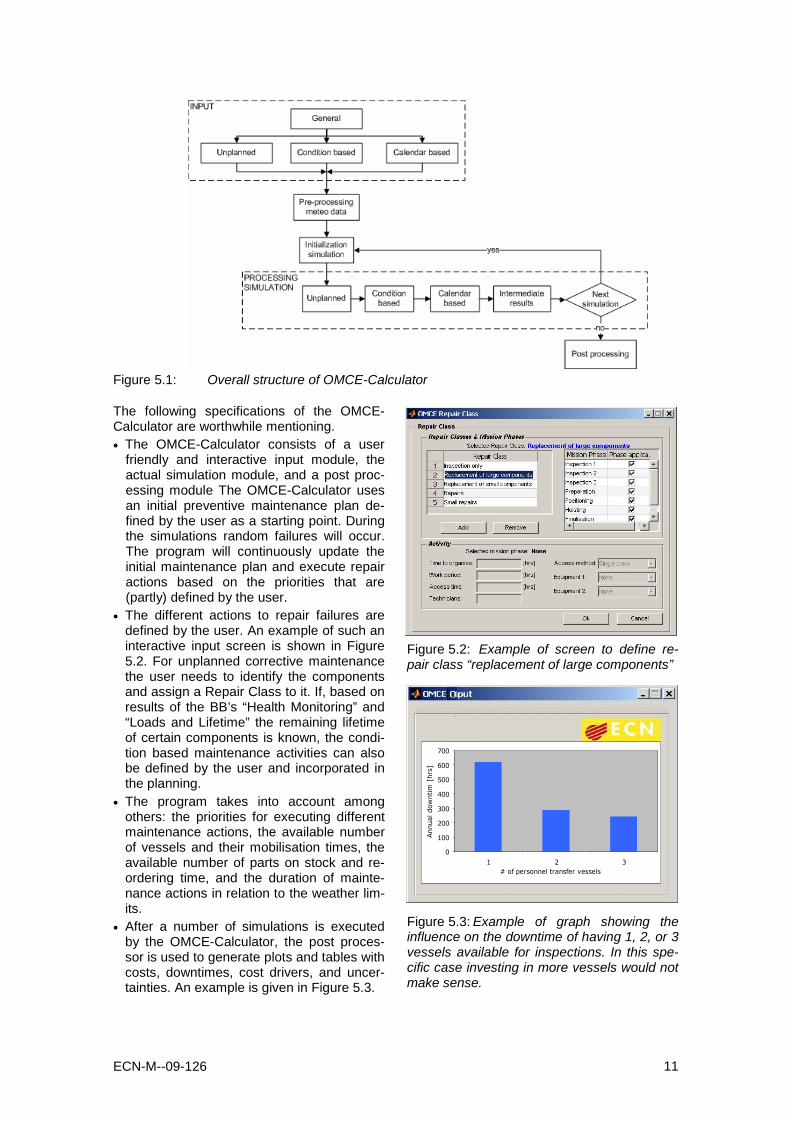
5. OMCE-Calculator The OMCE-Calculator is the tool that actually runs the simulations to estimate the future O&M effort (mainly costs and downtime) for the off-shore wind farm. As opposed to the well known “ECN O&M Tool” (see also [5]) which is applied in the planning phase of a wind farm, uses long
term average values as input, and is pro-grammed in MS-Excel, the OMCE-Calculator should be applied during the operational phase of a wind farm, uses acquired operational data of the specific wind farm as input, and is pro-grammed in MatLab. The structure of the simula-tion program is given in Figure 5.1.
ECN-M--09-126 11
Figure 5.1: Overall structure of OMCE-Calculator
The following specifications of the OMCE-Calculator are worthwhile mentioning. • The OMCE-Calculator consists of a user
friendly and interactive input module, the actual simulation module, and a post proc-essing module The OMCE-Calculator uses an initial preventive maintenance plan de-fined by the user as a starting point. During the simulations random failures will occur. The program will continuously update the initial maintenance plan and execute repair actions based on the priorities that are (partly) defined by the user.
• The different actions to repair failures are defined by the user. An example of such an interactive input screen is shown in Figure 5.2. For unplanned corrective maintenance the user needs to identify the components and assign a Repair Class to it. If, based on results of the BB’s “Health Monitoring” and “Loads and Lifetime” the remaining lifetime of certain components is known, the condi-tion based maintenance activities can also be defined by the user and incorporated in the planning.
• The program takes into account among others: the priorities for executing different maintenance actions, the available number of vessels and their mobilisation times, the available number of parts on stock and re-ordering time, and the duration of mainte-nance actions in relation to the weather lim-its.
• After a number of simulations is executed by the OMCE-Calculator, the post proces-sor is used to generate plots and tables with costs, downtimes, cost drivers, and uncer-tainties. An example is given in Figure 5.3.
Figure 5.2: Example of screen to define re-pair class “replacement of large components”
Figure 5.3: Example of graph showing the influence on the downtime of having 1, 2, or 3 vessels available for inspections. In this spe-cific case investing in more vessels would not make sense.
0
100
200
300
400
500
600
700
1 2 3# of personnel transfer vessels
Annu
al d
owntim
[hr
s]

ECN-M--09-126 12
6. Concluding remarks The OMCE is not a replacement of a mainte-nance management system that is commonly being used to generate work orders and monitor the progress of jobs. The BB’s and the event list of the OMCE however could be integrated in a maintenance management system to a large extent. Such a maintenance management system (or portals, or share points) could be used to centrally store the wind farm data and determine the relations between the different maintenance actions. The OMCE-Calculator could work as an add-on to a maintenance management system. The maintenance management system and the BB’s could be used to update the input parameters periodically. After the updates the OMCE-Calculator can be used to assess if the estimated O&M costs are still valid or need to be adjusted. The first release of the OMCE-Calculator is expected end of 2009.
Acknowledgements The development of the specifications for the OMCE-Calculator and the OMCE BB’s is carried out and co-financed by the Bsik pro-gramme ‘Large-scale Wind Power Generation Offshore’ of the consortium We@Sea (www.we-at-sea.org). The development of the event list and the programming of the OMCE-Calculator is carried out within the D OWES (Dutch Offshore Wind Energy Services) pro-ject which is financially supported by the European Fund for Regional Developments (EFRO) of the EU (www.dowes.nl). The au-thors also want to thank Noordzeewind and SenterNovem for providing the O&M data of the OWEZ wind farm.
References [1] L.W.M.M. Rademakers, H. Braam, T.S. Obdam; Esti-
mating Costs of Operation and Maintenance of Offshore Wind Farms; ECN-M--08-027, Paper presented at the EWEC 2008, Brussels
[2] T.S. Obdam, H. Braam, L.W.M.M Rademakers, P.J. Eecen; Estimating Costs of Operation and Maintenance of Offshore Wind Farms; ECN-M--07-120; Paper pre-sented at the European Offshore Wind Energy Confer-ence 2007, Berlin, Germany
[3] Eecen, P.J.; Braam, H.; Rademakers, L.W.M.M.; Ob-dam, T.S.: Estimating Costs of Operation and Mainte-nance of Offshore Wind Farms, ECN-M--07-045, Paper presented at the EWEC 2007, Milan, Italy
[4] Eecen, P.J.; Braam, H.; Rademakers, L.W.M.M. Devel-opment of operations and maintenance cost estimator; ECN-RX--06-058; Paper presented at the EWEC 2006, Athens, Greece
[5] Rademakers, L.W.M.M.; Braam, H.; Obdam, T.S.; Frohböse, P.; Kruse, N.: Tools for Estimating Operation and Maintenance Costs of Offshore Wind Farms: Stat-of-the-art; ECN-M--08-026; Paper presented at the EWEC 2008, Brussels, Belgium.
[6] H. Braam, L.W.M.M Rademakers; The Maintenance Manager; Collecting and Analysing Maintenance Data of Wind Turbines; ECN-C--01-012.
[7] Obdam, T.S. et al.: Flight Leader Concept for Wind Farm Loading Counting: Offshore evaluation; Paper presented at the EOW 2009, Stockholm, Sweden
[8] Obdam, T.S.; Rademakers, L.W.M.M.; Braam, H.: Flight Leader Concept for Wind Farm Loading Counting and Performance Assessment; ECN-M--09-054; Paper pre-sented at the EWEC 2009, Marseille, France
[9] T.S. Obdam, L.W.M.M. Rademakers, H. Braam; Flight Leader Concept for Wind Farm Load Counting: First Offshore Implementation, ECN-M--09-114 Paper pre-sented at the OWEMES conference, Brindisi, May 21-23th, 2009.
[10] P.J. Eecen, J.P. Verhoef; EWTW Meteorological data-base; Description June 2003 – May 2006, ECN-E-06-004; September 2006.
[11] P.J. Eecen, et. al.; Measurements at the ECN Wind Turbine Test Location Wieringermeer; ECN-RX--06-055; February 2006.
[12] P.J. Eecen, et. al.; LTVM statistics database; ECN-CX--05-084; September 2005.
[13] E.J. Wiggelinkhuizen et. al.; CONMOW Final Report; ECN-E-07-044; July 2007.
[14] VGB Power Tech: “Guideline Reference Designation System for Power Plants, RDS-PP; Application Expla-nations for Wind Power Plants”; VGB 116 D2, First edi-tion 2007