operation and maintenance costs of rural water … · operation and maintenance costs of rural...
TRANSCRIPT

IRC Symposium 2010 Pumps, Pipes and Promises
Operation and maintenance costs of rural water supply schemes in South Africa
J. Gibson (Maluti GSM Consulting Engineers, South Africa)
Abstract
This paper presents the findings from an analysis of financial data collected from a nine-year support programme in the Chris Hani and Alfred Nzo District Municipalities in the Eastern Cape Province of South Africa. The projects served a total of 67,437 rural households. The data illustrates that the costs of providing technical support to rural settlements may vary significantly from scheme to scheme. In the South African context, this has particular implications for the subsidy provided to each municipality by national government to support the provision of basic water services. The impact of geographic location, as well as the scale / technology choice, on the actual cost is explored. It is also noted that careful consideration must be given to balancing ‘economies of scale’ with the ‘cost of complexity’ as very large, technologically advanced systems become difficult and expensive to operate. The paper identifies the actual costs associated with a comprehensive approach to operation and maintenance (O&M) that included local CBO’s carrying out appropriate tasks at scheme level, together with skilled and competent technical and institutional support. These actual costs are compared with other methods of determining the financial resources required to support the O&M of rural water services infrastructure such as: 1. Engineering estimates (‘costed norms’) 2. Activity based costing, and 3. Equitable Share allocations of the South African National Treasury.
A significant finding of this research is that the technical support costs of rural water schemes are large in quantum, as well as in proportion to other items. The costs for technical support and travel represent 52% and 65% of the total operational cost for the two project areas respectively.
Keywords
Rural Water Supply, Post-Construction Costs, Operation and Maintenance, Technical Support.

1. BACKGROUND TO THE STUDY
1.1 Introduction
The actual costs associated with the operation and maintenance of rural water supply schemes are rarely reported accurately. This lack of clarity is often due to the service not being ‘ring fenced’ with some costs being allocated to other services or departments of the organisation. Furthermore, when costs are reported, it is not always clear what level of service has actually been delivered. Data on the quality of water delivered is seldom reported, likewise, the continuity of supply is often unknown. It has been reported elsewhere that at any given time a significant number of schemes may not be working. In a study by RWSN(1) they reported that 33% of all infrastructure was dysfunctional, with an equally worrying figure of 46% being reported by WaterAid(2). In South Africa, a survey of newly constructed projects was undertaken in 2007and it was found that ‘both bulk and household water projects scored poorly in reliability’(3).
1.2 Project Experience in South Africa
This paper draws on data from the experience of Maluti GSM Consulting Engineers (MGSM) in their role as a Support Service Agent (SSA) working with Community Based Organisations (CBO’s) to provide water supply services on behalf of two municipalities in the impoverished Eastern Cape Province of South Africa. In both instances the services of MGSM were contracted through open bidding processes.
Figures1a and 1b: Maps of ANDM and CHDM Areas Showing Scattered
Settlements

The two water services organisations concerned, Alfred Nzo (ANDM) and Chris Hani (CHDM) District Municipalities, identified the benefits of using CBO’s in the provision of water services. As noted by the RWSN(1), the belief that communities are always capable of managing the infrastructure on their own is a commonly held myth. In South Africa it was identified that such a service delivery model would require some degree of technical and management support with provision for such being included in national legislation(4).
Figures 2a & 2b: CBO Operator and Typical Water Points and Collection Methods
In 2001 the Alfred Nzo DM implemented a pilot project to investigate requirements for the successful implementation of such CBO based service delivery approach for rural water services. This pilot project covered one third of the total area of the ANDM. Very soon after the pilot project commenced, the lessons learnt were incorporated into a roll-out of the programme to the rest of the District. This project ran successfully until 2005, at which point the ANDM internalised their function by assigning responsibility for technical support to its own staff. The Chris Hani DM identified the successes achieved in ANDM and implemented a similar programme in 2004. In this case, the rehabilitation and re-commissioning of many small schemes was required before effective O&M could be implemented. The need to re-commission many of the schemes proved to be easier and less costly than was initially foreseen, indicating that many failed schemes were unserviceable due to relatively minor technical faults. Both of these initiatives were driven by the fact that the District Municipalities were mandated as Water Service Authorities from 1st July 2003. As such, the District Municipalities inherited the

responsibility for many rural schemes from the Department of Water Affairs and Local Municipalities. The towns within each of the project areas continued to run autonomously with their own staff, with the SSA programme providing ad-hoc support.
Figures 3a & 3b: Rudimentary Infrastructure
Both the ANDM and CHDM areas are characterised by scattered rural settlements where people depend largely on wage remittances, social grants and, to an ever- decreasing extent, subsistence agriculture for their livelihood.
Figures 4a & 4b: Typical Rural Village Scenes

National Government currently provides an unconditional grant (Equitable Share) to each municipality to support the provision of free basic services to indigent (poor) households. This grant is calculated using a standard allocation per poor household per service, irrespective of settlement type or location:
Free basic water is defined to be a supply of six cubic meters of potable water per household per month, at no more than a 200m walking distance.
The minimum standard for free basic sanitation is based on the existence of no less than a ventilated improved pit latrine.
An indigent household is defined as one that had a monthly income below R800 (USD 115), at the time of the 2001 census.
The level of poverty in such rural areas is very high (90%+) and therefore it was possible for the Municipalities to fund the total cost of operations from the Equitable Share Grant without any condition set for community-level cost recovery.
Table 1: Scope of Support Service Contracts
Villages Served
Households Served
Alfred Nzo District Municipality
(2002 – 2005)
Matatiele Local Municipality (formerly Umzimvubu North)
144 27,154
Chris Hani District Municipality
(2004 2009)
Villages located in 3 Local Municipalities (Intsika Yethu, Sakhisizwe, Emalahleni)
285 40,283
Notes: 1. Household served determined from actual counts from satellite imagery. 2. Villages typically range in size from about 50 to 400 households.
Schemes included in the SSA programmes varied in technology and extent from large multi-village schemes supplied from dams and water treatment plants to, hand-pump installations. The level of service within settlements was mainly based on communal standpipes. The national guideline for rural water supplies stipulates that no person should walk more than 200m to collect water; however it was found that many of the schemes had rudimentary reticulation where walking distances, exceeded 200m. It should also be noted that the vast majority of schemes made no provision for disinfection since the source of water was, in most cases, either a protected spring or a borehole. In some cases meeting acceptable water quality requirements presented a particular challenge to the operations team. The objective of the SSA and CBO programme was to ensure that potable water was supplied reliably. The CBO performed day to day operational tasks with support from the SSA available

for technically or logistically challenging situations. The level of service targeted by the operations team was as follows:
Reliability / continuity of Supply = 98% assurance,
Water Quality maintained at acceptable levels, - e-coli count 0 per 100ml (ideal) - e-coli count 0–10 per 100ml (need for intervention) - e-coli count >10 per 100ml (unacceptable)
These service level parameters were monitored and reported on by the SSA monthly. Support interventions by the SSA were guided by these reports. Continuity of service was calculated as a percentage of ‘operational tap-days’. Local administrators recorded which taps were working on a daily basis and compared this with a theoretical maximum (number of taps x days in the month). Water quality was monitored in two ways. Firstly, the community's perceptions of taste, smell and sight were recorded. Secondly, monthly samples were taken at each village and driven to a laboratory that was up to 250km away where they were submitted for bacteriological testing. This process for monitoring water quality was practically implementable and compliant with the sampling interval requirements of the National Water Quality Standard (SANS 241).
1.3 Scale of the Projects In order to ensure the levels of service described above, Maluti GSM were expected to:
Support local operators in carrying out repairs and maintenance
Service and repair mechanical and electrical equipment (mech/elec), (75% of all installations were visited each month, with no installation neglected for longer
than two months).
Deliver diesel where required
Procure and deliver material and spares
Prepare monthly reports
Provide technical support (engineering)
Facilitate the functioning of the CBO’s.
Train local operators
The scope of work of the two contracts exhibited differences in terms of their extent and the type of infrastructure installed.

Note: Dams are owned by the National Department of Water Affairs and are
therefore not included as the Municipal's responsibility.
Figure 5: Comparison of Water Supply Infrastructure. It is generally true that the CHDM is served by more boreholes and stand alone schemes than the ANDM area which has more regional gravity-fed schemes supplied from springs and streams that flow from the nearby Drakensberg Mountains.
2. METHODOLOGY
2.1 Introduction This research was undertaken with the aim of identifying the real costs of support to Rural Water Supply Schemes and to highlight the main cost drivers associated with such support. The paper also evaluates the usefulness of cost and budget estimation tools that have been developed by various government departments in South Africa. The output from these tools was compared with actual cost figures gathered by Maluti GSM while working in the CHDM area for 41/2 years and for 51/2 years in ANDM. Various government departments in South Africa have developed tools and guidelines to assist municipal officials and professionals in the financial planning for the installation of new infrastructure, as well as for operation and maintenance. These tools were developed on the basis of a ‘costed norm’ approach. Since the base costs determined in all of the methods used in this research were recorded in different years, it was necessary to equate these to a cost relevant in 2010. This was calculated using industry accepted escalation figures (SAFCEC)(5).

The current replacement costs (CRC) quoted in this paper assumes that a contracted company will be used for construction of capital works. Items such as VAT, contractors, Preliminary & General items and Engineering Fees are included. The DWAF Guideline does not provide for these items, hence the figures were increased by 65% to accommodate these expenses. The possible range of these items is illustrated in Table 2.
Table 2: Summary of Additional Project Costs (6)
VAT P&G Fees
Very Small Projects 14% 15 – 30% 39%
Small Projects 14% 12 – 25% 33%
Medium Projects 14% 8 – 20% 23%
Large Projects 14% 5 – 15% 19%
The input for the various cost estimation techniques and the parameters of actual costs are illustrated below:
Figure 6: Cost Estimation and Actual Cost Parameters

2.2 Comparison of costing methodologies
Actual Cost Data
Since Maluti GSM carried all of the costs of the programme and then billed the respective municipalities (8), it was possible to establish a ‘ring fenced’ impression of the real costs associated with the delivery of water services. The invoices reflected the total costs of the programme, including operations, maintenance and all expenses associated with administrative and logistical support to the CBO’s. A representative sample of cost data was extracted for each of the project areas. In the case of CHDM, this was for 29 months from within the period, November 2006 to May 2009. For ANDM, 28 months of invoices in the period covering April 2003 to July 2005 were used. Once again the accepted industry escalation factors were used to establish an equivalent cost for June 2010(5).
Department of Water Affairs Cost Benchmarks
The Department of Water Affairs and Forestry (DWAF), (now referred to as the Department of Water Affairs), regularly collects cost data related to the implementation of new projects and the operation and maintenance costs associated with the various infrastructural items (6). As shown in Figure 6, this guideline provides information on cost estimates for schemes in a range from very small (167 households) to large (8,300 households). The basic planning premise is that costs are primarily linked to the population served. Adjustment of values and costs to figures relevant in June 2010 (from a base cost in 2003) required an escalation of 1.46 times.
Department of Provincial and Local Government Cost Estimation Guidelines
The South African Department of Co-operative Government and Traditional Affairs (CoGTA), formerly known as the Department of Local Government and Housing (DPLG) has also produced a document (7) with similar applicability to that discussed above. The operation and maintenance costs that were used in this research were derived from this DPLG manual and are detailed below:
Table 3: DPLG O&M Calculation Factors
Item Operations (as % of CRC)
Maintenance (as % of CRC)
Boreholes 3% 4%
Springs / Weirs 0.4% 0.25%
Bulk Pipelines 0.1% 0.5%
Reservoirs 0.1% 0.7%
Reticulation Pipelines 0.1% 1.7%

Water Treatment Works n-a to this contract 2.3%
Tap-stands 3% 4%
Diesel Powered Pumps 3% 4.6%
Electric Powered Pumps 2% 2.3% Note: Water treatment works and daily operations were paid for by the Department of Water Affairs. The SSA was only responsible for maintenance support.
An escalation factor of 1.3 times(5) was found to apply between costs in the base year (2006) and the present.
Activity Based Cost Model
Soon after the start of the ANDM contract, Maluti GSM, together with the client, developed an activity based cost model to assist the client municipality with annual budget preparation. This was developed to inform the planned expansion of the programme to the two thirds of the district that was not covered by the pilot project. This cost model allocates resources such as manpower, vehicles, materials etc. on the basis of the number and types of scheme to be operated and maintained. Schemes are specified in terms of their geographical extent (villages served) and their degree of technical complexity:
Table 4: Activity Based Cost Model Input Parameters
Geographical Extent Technical Complexity
A 11 – 17 villages 1 Water treatment / power / reticulation
B 5 – 10 villages 2 Power / reticulation
C 2 - 4 villages 3 Gravity / reticulation
D 1 village 4 Gravity / no reticulation
5 Windmills
6 Hand-pumps Note: Rural water schemes in these areas seldom exceed 17 villages. A notable exception is
the Tsojana Regional Scheme that serves more than 40 villages, and is being increased in size all the time. This scheme was modeled as a number of type ‘A’ schemes.
Current rates (2010) were used for the calculations included in this paper.
Equitable Share
The financial allocations from the National Treasury to each municipality were informed and guided by the annually published Division of Revenue Act (9). It was necessary to calculate the amount of this allocation relevant to the scope of work carried out in the SSA contracts. Notably the total allocation made allowances for indigent residents in the towns, which did not form part of the SSA contracts.

3. FINDINGS AND DISCUSSION
The experience of Maluti GSM from the SSA programme was characterised by a large proportion of operational interruptions resulting from the failure of an item of mechanical or electrical equipment. The following example of the team’s experience with hand-pumps is used to illustrate the need for technical support, particularly where mech/elec equipment is utilised. While it is generally presumed that hand-pumps are an appropriate technology choice for developing world applications, it was the experience of the team that however simple and reliable the technology may appear to be, the issue of ‘repair-ability’ should not be neglected. Often the failure mode of hand-pumps was of the sort that equipment such as a welding kit was required to effect repairs. Clearly it would be unreasonable to expect every rural village or CBO to have such equipment and expertise. This example illustrates the recurring theme of small failures resulting in dysfunctional schemes. In this case a small welding repair may appear to be trivial to a technically skilled and appropriately equipped technician, but without this intervention the water supply to whole communities can be jeopardised.
3.1 Actual Costs
The actual costs associated with the running of the schemes are presented below:
Table 5: Actual Support and O&M Cost Data
Project Area Monthly Annual Cost per H-Hold
(R/annum)
Cost per H-Hold
(USD/annum)
Chris Hani DM R1,789,661 R21,475,928 R533 USD 76.91
Alfred Nzo DM R 518,637 R 6,223,647 R229 USD 33.05 Note: 1. These figures have been adjusted to the equivalent of 2010 prices
2. Amounts exclude VAT 3. Exchange rate USD1.00 = R6.93
Most significantly the comparison of actual costs between the two project areas indicates that operations in the CHDM area cost 3.5 times more than similar activities in the ANDM area. The cost per household served being 2.3 times greater. To calculate the quantum of the anticipated increased challenge in providing technical support to the larger service area in the CHDM, it would be necessary to develop a system that reduces the required scope of work (as detailed in table 1) to a single common denominator , although this would be difficult in practice. When the variance in the scale of infrastructure to be operated and maintained is examined, the following is observed:

CHDM supplies water in twice as many villages as ANDM, but to only 50% more households,
CHDM has 70% more pipelines
CHDM has 83% more taps
CHDM has almost five times as many mech/elec installations
While it is acknowledged that correlation does not necessarily imply causation, these numbers indicate that the increase in cost is disproportionately influenced by the amount of mechanical and electrical equipment that had been installed. 3.1.1 Cost Breakdown The breakdown of the costs shown below illustrates the significant increase in support required as a consequence of the higher number of mech/elec installations:
Technical staff requirement in CHDM is 2.4 higher than that required in ANDM
CBO in ANDM cost was 2.6 times higher in CHDM
Materials costs were 11.5 times higher in CHDM
Travel costs were 4 times greater in CHDM
Service Providers costs were 9 times more in CHDM
Fuel costs were 7.4 times greater in CHDM
-
200,000
400,000
600,000
800,000
1,000,000
1,200,000
USD
pe
r a
nn
um
O&M Costs Items
ANDM
CHDM
Notes: 1. Disbursements = (material, spares etc)
2. Service providers = (work contracted out, water quality testing, etc)
Figure 7: Proportional Contribution to Total Support and O&M Costs The disproportionate increase in travel costs for CHDM can be related to the fact that the schemes in the ANDM area were, on average, about 50km from the base of operation. In the case of CHDM schemes, the distance was 100km. The relative increase in cost of material and

spares can be attributed to the fact that mech/elec installations with moving parts are far more prone to failure than buried or static infrastructure such as pipelines and reservoirs.
Table 6: Relative Contribution to Total Cost
3.1.2 Key Findings The data presented in the earlier pages provide evidence that the support costs required to achieve effective O&M for rural water supply schemes constitute a large proportion of the total costs. This is a cause for some concern as it has the following implications:
The subsidy requirements for financial sustainability may be higher than previously assumed.
High costs indicate that the level of technical challenge is greater than was originally anticipated.
Widely accepted methods of budgeting for O&M such as percentages of Current Replacement Costs or allocation of budget per person served may in fact not be sufficiently linked to the real challenges faced.
The fact that not all supply areas are equally endowed with water resources has a significant impact on what type of scheme is developed. This has a profound impact on the funds required to firstly, construct schemes and secondly, to carry out effective long term operation and maintenance. Based on data gathered, the main cost drivers that have been identified are: 1. Technical staff required for technologically advanced equipment. 2. Travel costs associated with scattered schemes located in remote areas or away from
service centres. 3. Spare parts and material costs, particularly on schemes utilising engines, motors and
pumps.
3.2 Capital Replacement and O&M Costs
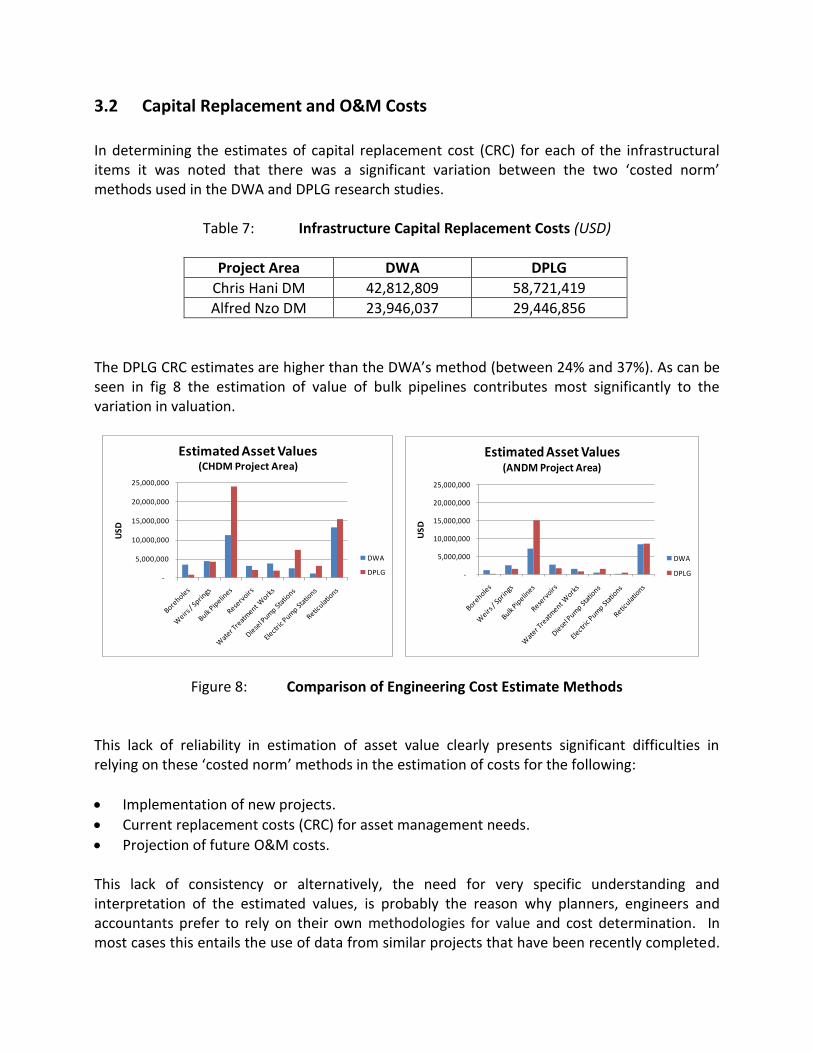
In determining the estimates of capital replacement cost (CRC) for each of the infrastructural items it was noted that there was a significant variation between the two ‘costed norm’ methods used in the DWA and DPLG research studies.
Table 7: Infrastructure Capital Replacement Costs (USD)
Project Area DWA DPLG
Chris Hani DM 42,812,809 58,721,419
Alfred Nzo DM 23,946,037 29,446,856
The DPLG CRC estimates are higher than the DWA’s method (between 24% and 37%). As can be seen in fig 8 the estimation of value of bulk pipelines contributes most significantly to the variation in valuation.
-
5,000,000
10,000,000
15,000,000
20,000,000
25,000,000
USD
Estimated Asset Values(CHDM Project Area)
DWA
DPLG
-
5,000,000
10,000,000
15,000,000
20,000,000
25,000,000
US
D
Estimated Asset Values(ANDM Project Area)
DWA
DPLG
Figure 8: Comparison of Engineering Cost Estimate Methods This lack of reliability in estimation of asset value clearly presents significant difficulties in relying on these ‘costed norm’ methods in the estimation of costs for the following:
Implementation of new projects.
Current replacement costs (CRC) for asset management needs.
Projection of future O&M costs. This lack of consistency or alternatively, the need for very specific understanding and interpretation of the estimated values, is probably the reason why planners, engineers and accountants prefer to rely on their own methodologies for value and cost determination. In most cases this entails the use of data from similar projects that have been recently completed.

This can however be problematic since in addition to a lack of consistency, any firm performing such analysis may not have access to data on all of the infrastructure items under consideration. This is very significant in the determination of resources required for O&M. In the absence of pertinent data, the variances in estimation of Current Replacement Costs of earlier research will be merely carried over to O&M cost estimates when a percentage of CRC approach is adopted. Using these two approaches the following O&M costs were predicted.
Table 8: Operation and Maintenance Cost estimates, Produced using Engineering Estimates. (USD / annum)
Once again the substantial variation between the two methods of cost estimation is noted. Significantly, the costs associated with the O&M of reticulation systems represent 92% of the total variation in both cases. It is therefore presumed that the DWA model provides for a number of activities (such as administrative and support activities) that are not considered in calculations using DPLG guidelines, for example:
Billing and tariff collection.
Proportions of senior management staff costs. Based on these calculations the O&M costs represent the following relationship to Capital Replacement Costs:

Table 9: Operation and Maintenance Cost vs. Capital Replacement Costs
Project Area DWA Method DPLG Method
Chris Hani DM 18.7% 2.2%
Alfred Nzo DM 19.8% 1.5%
This table illustrates the wide and unrealistic variance in estimated O&M costs when these ‘costed norm’ tools are used at face value. The implication is that ‘costed norm’ based models should be used with caution since one will never be sure: 1. What tasks are in fact being ‘costed’, and 2. Whether the norms used are applicable to the situation under consideration.
3.3 Activity Based Cost Model
The activity based cost model described above yielded estimates of annual operational costs of R28.5 million (USD 4.1 million) and R12.3 million (USD 1.8 million) for the schemes in CHDM and ANDM.
0
500,000
1,000,000
1,500,000
2,000,000
2,500,000
3,000,000
3,500,000
4,000,000
4,500,000
CHDM ANDM
US
D p
er
an
nu
m
Estimated O&M Costs (from activity based model)
Project Costs
Tech Support
Figure 9: Comparison of Activity Based Cost Model Outputs
From the figure above, it is observed that technical support costs represent 54% and 49% of the total for CHDM and ANDM costs respectively. This high budget proportion of technical support can be attributed to the following:

The salary costs of professionally and technically qualified people are significantly higher than the labour costs of local project staff
The remoteness of rural schemes, in particular those that require the use of technically more advanced mechanical and electrical equipment, necessitate large direct travel costs (vehicles) as well as high travel time costs associated with relatively expensive personnel
Costs for items such as spares and fuel are relatively low due to the small size of many of the components of the schemes.
The costs calculated here are based on charge out rates that include provision for:
Technical and management staff salaries
Travel
CBO salaries
Materials, fuel and chemicals
Administration costs Figure 10 below demonstrates the impact of project size and technology choice on the estimated O&M costs. The significance of this graph can be observed at the point representing the costs relative to ‘2-4 villages’ (population between 1,500 – 6,000). It is noted that significant economies of scale appear to be realised when schemes are of this size or larger.
0.0
0.5
1.0
1.5
2.0
2.5
1 v
illa
ge
2 -
4 v
illa
ge
s
5 -1
0 v
illa
ge
s
11
-1
7 v
illa
ge
s
Mo
nth
ly C
os
t p
er
Ca
pit
a (
US
D)
Scheme Size
Estimated O&M Costs for Rural Water Supply Schemes (from activity based cost model)
wtw/power/retic
power/retic
gravity/retic
gravity/no retic
windmill
handpump
Notes: - 1 village, population estimate < 1,500 people
- 2 to 4 villages, population estimate = 1,500 to 6,000 people - 5 to 10 villages, population estimate = 6,000 to 15,000 people - 10 to 17 village, population estimate = 15,000 to 25,000 people
Figure 10: Effect of Technology Choice and Scheme Size on O&M Costs

Clearly it is an ongoing challenge to develop rural water schemes that are large enough to attract economies of scale, but not in ways where the complexity that accompanies effective O&M becomes an onerous challenge that cannot be effectively addressed.
3.4 Equitable Share Allocations
Extracts from the Division of Revenue Act 2010 (DORA) indicate that the following budgets were made available to support the provision of water services to the areas discussed in this paper.
Table 10: Equitable Share Available for Rural Water Services (USD)
Equitable Share Allocation
(DORA 2009)
Equitable Share Available for the SSA Area
(92% of allocation)
CHDM Project Area
Intsika Yethu LM area 2,476,768 2,278,626
Sakhisizwe LM area 1,052,814 968,589
Emalahleni LM area (part) 1,928,860 282,479
Total 3,529,693
ANDM Project Area
Matatiele LM area 3,309,957 3,045,160 Note: Percentage of allocation (92%) discussed in section 2.6 The Equitable Share grant from National treasury is unconditional, there is therefore no obligation
on municipalities to allocate this funding to water services.
Data presented in Table 10 suggests that the Equitable Share allocated to each municipal area makes no allowance for the difference in operational and maintenance costs of schemes within each area. The subsidy is calculated by National Treasury purely on the basis of census statistics and allocated to the municipalities accordingly. Calculations do not account for the actual cost of providing a reliable supply of safe drinking water across different contexts using different technologies.
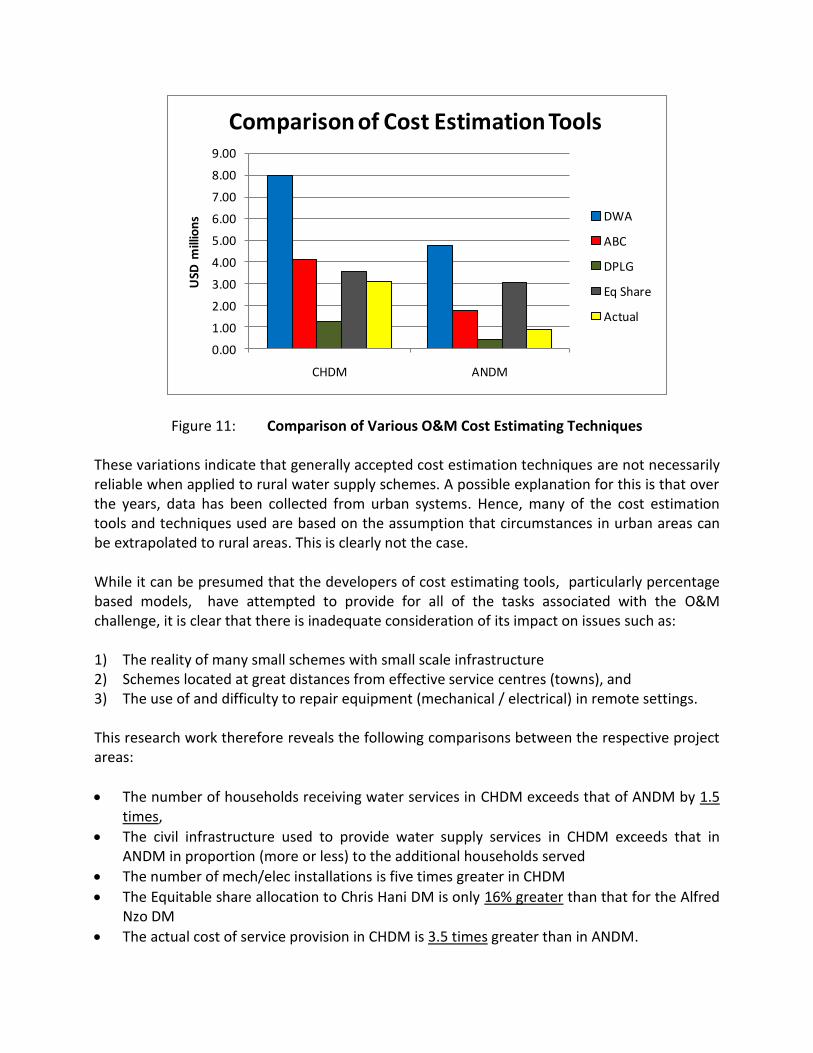
3.5 Comparison of Budget Determination Methods
Comparing the various methods of cost and budget determination with the actual costs recorded during the Maluti GSM Support Services Agent contracts, significant variations are observed:
0.00
1.00
2.00
3.00
4.00
5.00
6.00
7.00
8.00
9.00
CHDM ANDM
USD
mill
ion
s
Comparison of Cost Estimation Tools
DWA
ABC
DPLG
Eq Share
Actual
Figure 11: Comparison of Various O&M Cost Estimating Techniques These variations indicate that generally accepted cost estimation techniques are not necessarily reliable when applied to rural water supply schemes. A possible explanation for this is that over the years, data has been collected from urban systems. Hence, many of the cost estimation tools and techniques used are based on the assumption that circumstances in urban areas can be extrapolated to rural areas. This is clearly not the case. While it can be presumed that the developers of cost estimating tools, particularly percentage based models, have attempted to provide for all of the tasks associated with the O&M challenge, it is clear that there is inadequate consideration of its impact on issues such as: 1) The reality of many small schemes with small scale infrastructure 2) Schemes located at great distances from effective service centres (towns), and 3) The use of and difficulty to repair equipment (mechanical / electrical) in remote settings. This research work therefore reveals the following comparisons between the respective project areas:
The number of households receiving water services in CHDM exceeds that of ANDM by 1.5 times,
The civil infrastructure used to provide water supply services in CHDM exceeds that in ANDM in proportion (more or less) to the additional households served
The number of mech/elec installations is five times greater in CHDM
The Equitable share allocation to Chris Hani DM is only 16% greater than that for the Alfred Nzo DM
The actual cost of service provision in CHDM is 3.5 times greater than in ANDM.

This highlights the disproportionate contribution of mechanical / electrical installations to the operation and maintenance challenge. To implement an effective O&M regime, one must not neglect to consider the long distances specialist contractors must travel from major towns where such skills are available. Also the challenge in effectively communicating the nature of faults and failures to such service providers should not be underestimated. The skills required to effectively identify faults and service mech/elec systems are generally not easily found within rural villages, and in fact not even in local small towns. The technical nature of such installations is becoming continually more sophisticated, creating a need for even greater technical expertise. The lesson to take from this is that careful consideration of what is the most appropriate technology for a given area must be continually reassessed in project planning and design phases. This is all to say nothing of the onerous logistical challenge that an operation, such as described in this paper, presents. A particular management system was developed by Maluti GSM to enable the organisation to undertake this type of work. Such organisational ‘software’ is not easily transferable and rigid municipal systems present operational challenges of their own. The inherent complexity and variability of small rural schemes require greater flexibility and reactive capacity. The significant variation in equitable share allocations from the actual costs also deserves some comment. As previously mentioned, the budget allocations from National Treasury are calculated on the basis of census figures, particularly the number of indigent families. The fact that the ANDM allocation is over three times greater than the actual costs, and that the allocation to CHDM is marginally greater than actual, indicates that certain municipalities may face a far greater financial challenge than others. No discussion on the cost of services would be complete without some comment on effectiveness and efficiency. Analysis of data collected in the final six months of both contracts indicated the following:
Table 11: Service Standard Compliance
Area Water Quality
Continuity of Supply
CHDM 98% 96%
ANDM 83% 84%
At face value it appears that the level of service supplied in the ANDM area was significantly less than that delivered in CHDM. It should however be considered that this ‘lack of performance’
may be an inherent function of the infrastructure (e.g. surface water sources without treatment facilities will tend to deliver water of lesser quality than those with treatment systems). In such circumstances the available infrastructure may in fact be operated optimally but still be unable to achieve the desired service level. Achieving a higher level of compliance would only be possible through further capital investment and the continuous upgrade of infrastructure.
4. CONCLUSIONS
As a result of this analysis of the SSA programmes, it is concluded that: 1. There is a definite need for effective technical and management support to rural water
schemes to maintain functionality of the infrastructure. Such a support team may require a significant number of highly skilled staff members.
2. The cost of such technical support represents a large proportion of the overall cost of operation.
3. The recurrent costs associated with material, spares and fuel for rural schemes were found to be proportionally low in the overall cost, particularly where there were few mech/elec installations.
4. To enhance reliability and reduce the maintenance costs of rural water supply schemes, the concept of repair-ability must be given adequate consideration in project design.
5. The main cost drivers for O&M of rural water schemes were identified as being: a. the nature of the infrastructure, particularly if mech/elec installations are utilised
(skilled people required) b. Remoteness of the schemes (travel) c. Number of schemes under consideration (logistics)
The comparison of cost estimating techniques and actual operational data indicate the following: 1. Significant variations are observed when different cost estimating tools and methodologies
were used to estimate O&M costs for a known level of service from a given set of infrastructural items.
2. Cost models often have built-in assumptions that may not be apparent to users. 3. Percentage of construction cost (CRC) based estimates should be used with caution since
the generally accepted norm of 3-6% is probably derived from experience with urban projects.
4. The use of metrics such as cost per capita served ($/cap) or cost per volume of water supplied ($/m3) can lead to inappropriate cost estimates.
5. While it may be desirable to attempt to create a generic protocol for the estimation and prediction of O&M costs, this paper indicates that the development of such a model may be difficult, if not, impossible, to create. The costs of construction and subsequent continued Operation and Maintenance may be widely variable due to the following:

a. the significant influence of technology choice, b. scale of the scheme, c. geographic location of the project relative to centres of technical support;
6. In view of this it is suggested that planners wishing to estimate future costs should endeavor to develop realistic ‘Activity Based Cost Models’ that incorporate the specifics of the project at hand. This will require careful consideration of the actual operational tasks associated with the installed infrastructure within the context of the size of the scheme and its location.
7. Basic rural schemes are not necessarily cheaper to operate and manage than reticulated urban networks. In South Africa, this raises particular questions about how to allocate the O&M subsidy equitably across urban and rural settlements, in ways that take account of the real cost of rural service provision.
5. DISCUSSION AND RECOMMENDATIONS There is a need for continued research and monitoring of costs incurred in providing rural water services. Importantly the actual level of service delivered must be recorded along with the cost data. This is necessary since it is implicit that similar levels of effectiveness and efficiency must be considered. In view of the lack of credible universal metrics for rural water supply costing, it is recommended that further research be conducted to explore trends and correlations. It is the opinion of this author that single parameter systems ($/cap or $/m3) will not satisfy this need.
6. REFERENCES 1. K Danert et al, July 2009, Myths of Rural Water Supply Sector, Rural Water Supply Network.
2. B Taylor, July 2009, Addressing the Sustainability Crisis, Lessons from research on managing
rural water projects, WaterAid.
3. Council for Scientific and Industrial Research, 2007, Findings of Spot Check Assessment of
MIG Projects. For the Department of Water Affairs.
4. The Legislature of the Republic of South Africa, 1997, Water Services Act, Government of
the Republic of South Africa.
5. www.safcec.org.za/
6. Department of Water Affairs and Forestry, 2002, Cost Benchmarks for Water Supply
Projects, Government of the Republic of South Africa.

7. Department of Provincial and Local Government, 2006, Guidelines for Infrastructure Asset
Management in Local Government: 2006 -2009, Government of the Republic of South
Africa.
8. Maluti GSM Consulting Engineers, 2001 – 2009, Monthly Invoices to Chris Hani and Alfred
Nzo District Municipalities.
9. National Treasury, 2009, Division of Revenue Act, Government of the republic of South
Africa.
ACKNOWLEDGEMENTS Gratitude is extended to Mr TT Dlamini for managing day to day operational activities and preparing monthly reports. Ms K Eales is thanked for contributing to the content and editing of this paper.
CONTACT DETAILS Maluti GSM Consulting Engineers P.O. Box 8125, Nahoon, East London South Africa James Gibson [email protected]