operation manual - communication technology manual november 4, 2014 p/n 998-6060 revision 1.3 turner...
TRANSCRIPT

Operation Manual
November 4, 2014P/N 998-6060Revision 1.3
TURNER DESIGNS845 W. Maude AvenueSunnyvale, CA 94085Phone: (408) 749-0994FAX: (408) 749-0998
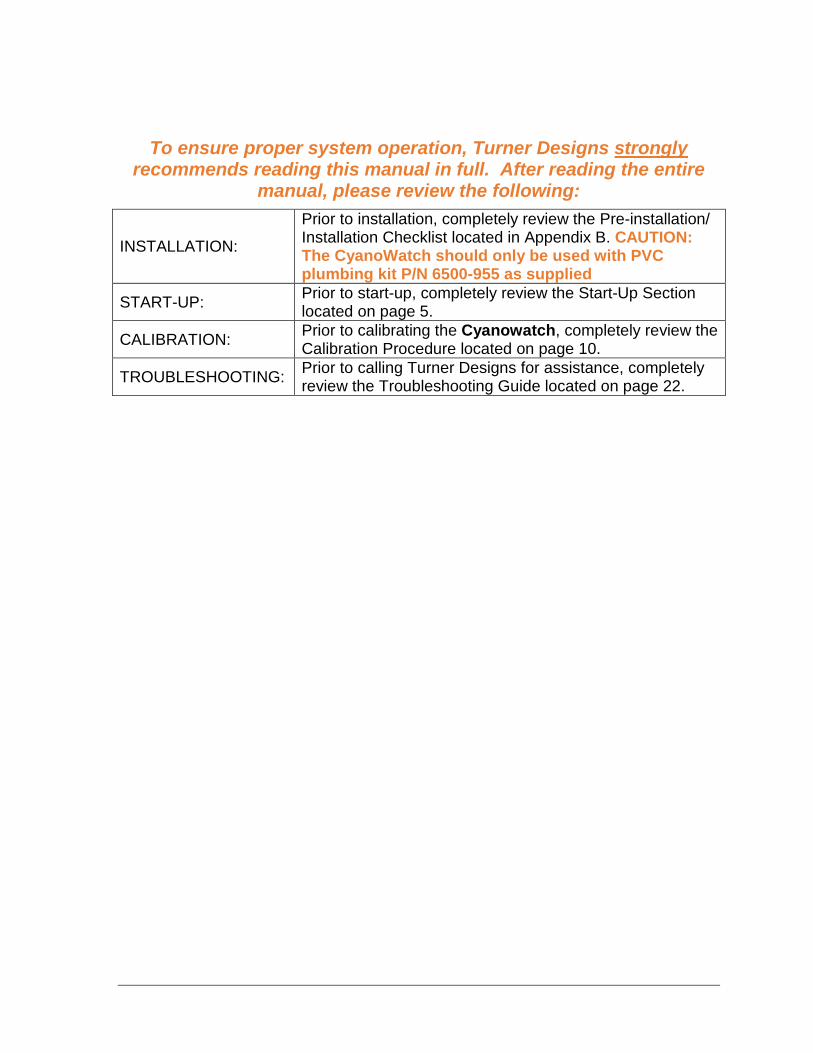
To ensure proper system operation, Turner Designs stronglyrecommends reading this manual in full. After reading the entire
manual, please review the following:
INSTALLATION:
Prior to installation, completely review the Pre-installation/Installation Checklist located in Appendix B. CAUTION:The CyanoWatch should only be used with PVCplumbing kit P/N 6500-955 as supplied
START-UP:Prior to start-up, completely review the Start-Up Sectionlocated on page 5.
CALIBRATION:Prior to calibrating the Cyanowatch, completely review theCalibration Procedure located on page 10.
TROUBLESHOOTING:Prior to calling Turner Designs for assistance, completelyreview the Troubleshooting Guide located on page 22.

TABLE OF CONTENTS
INTRODUCTION .................................... 1THEORY OF OPERATION ..................... 1
Data Interpretation....................... 2SPECIFICATIONS .................................. 3INSTALLATION...................................... 3
Pre-Installation/Installation........... 3Power & Utilities Required ........... 3Required Tools & Accessories..... 3Location & Sampling Point........... 3Mechanical Connections ............. 4Electrical Connections ................. 4
START-UP.............................................. 5Start-Up Procedure...................... 5Monitoring Mode.......................... 6
CALIBRATION ..................................... 10Calibration Procedure................ 10Notes on Calibrating .................. 11Calibration Data Screen ............ 12Table 1. Calibration Data........... 12
INTERNAL DATA LOGGER................. 13Parameters................................ 13Software Installation .................. 13Running IDL Software ............... 14Examining Downloaded Data .... 15
PREVENTIVE MAINTENANCE ............ 16Cleaning Basket Strainer........... 16Calibrating ................................. 16Cleaning Flowcell ...................... 17Biofouling .................................. 17Replacement Parts.................... 17
ALARMS .............................................. 18Alarm Delay............................... 18Alarm Activation ........................ 18Multiple Alarms.......................... 18
Alarm History ............................ 18Notes About Alarms .................. 18Definitions ................................. 19
TROUBLESHOOTING ......................... 20Diagnostics ............................... 20Troubleshooting Guide.............. 22
Service Assistance/Returned Goods........................ 24
Specifications/Accessories ................... 25WARRANTY......................................... 26
APPENDICIESA: CONFIGURATION SHEET............... 27B. INSTALLATION CHECKLIST ........... 28C: FIRMWARE FUNCTIONS................ 29D: SCREENS FLOW CHARTS............. 31
System Value ScreensUser ID Screens........................ 31Diagnostic Screens ................... 31Time/Date/Alarm Screens ......... 32Data Logger Screens ................ 32Calibration Screens................... 33
E: TROUBLESHOOTING WORKSHEET ... 34F: FIGURES……………………………….35G: Cyanowatch White Paper………… …42
FIGURES & DIAGRAMS..........................Figure 1. Fluorescence Detection ... 1Figure 2. Front View-External............ 9Figure 3. Inlet Plumbing .................. 36Figure 4. Outlet Plumbing ............... 37Figure 5. Front View-Internal........... 38Figure 6. Front View-External.......... 39Definitions....................................... 41

1 cyanowatch REV 1.3
INTRODUCTION
CYANOBACTERIA FLUORESCENCE
Cyanowatch is afluorescencesensor designed tomonitor the level ofcyanobacteria inwater. TheCyanowatchcontinually sensesthe concentrationof eitherphycocyanin, (PC)or phycoerythrin,(PE) fluorescentpigments unique to
cyanobacteria
Phycobilin pigments are a group ofaccessory pigments unique tocyanobacteria. PC and PE are twophycobilin pigments that also happen tohave strong and unique fluorescent signalsthat can be detected by the CyanoWatch.Cyanobacterial species living in freshwaterenvironments tend to containpredominantly phycocyanin, while marinespecies contain predominantly morephycoerythrin. Prior to ordering aCyanoWatch, the decision must be madeas to which of the phycobilin pigments theinstrument will be used to detect.
The fluorescence is measured directly,using in vivo cyanobacteria detection,without extraction or chemical treatment.For many types of qualitative work, in vivomeasurement alone may answer theexperimenter’s questions. For quantitativedeterminations, the in vivo data iscalibrated by correlation with othermeasurements, such as cell counts,extracted pigment analysis or filterruntimes.
FLUOROMETERThe sample water containingcyanobacteria cells is measured in a side-stream of the water as it passes through apolished, glass tube in the detectionsystem. An excitation light source shinesacross the glass tube, the cyanobacteria in
the water fluoresces, and a photodiodereads the fluoresced light. The quantity oflight emitted is proportional to the amountof cyanobacteria present in the system(see Figure 1 below).
The Cyanowatch consists of amicroprocessor-based fluorometer withelectrical inputs/outputs for a flow switch,4-20mA signal and data logging. It isengineered to ensure reliability and pre-assembled to simplify installation.Plumbing and calibration accessories mayneed to be acquired (see ReplacementParts, page 17, for a list of recommendedparts and Figures 3 and 4, pages 36 and37, for the plumbing diagrams).
UNITSBecause in vivo cyanobacteria detection isa relative measurement we have notincluded units on the Cyanowatch screenor in the logged data. However, ifcorrelation between the Cyanowatchsignal and cell counts or extracted pigmentanalysis is conducted, the Cyanowatchcan be calibrated to estimate actualcyanobacteria concentration in cells/mL orµg/L, please see Appendix G for greaterdetail..THEORY OF OPERATION
WaterSample Flow
EmissionRead By
Photodiode
ExcitationBy A Light
Source
90.0°
Figure 1. Fluorescent Detection
Theory of OperationFluorescence data can be used to supplyan indication of cyanobacteria growth inthe sample water. Although thefluorescence data is not quantitative, seeAppendix G, a robust relationship betweenthe fluorescence signal and actualcyanobacteria concentration can be easilydetermined through a comparison with cell
2 cyanowatch REV 1.3
counts or extracted pigment samples.However, in many instances it may bemore useful to develop a relationshipbetween the fluorescence signal andanother measure of cyanobacteria growthsuch as taste and odor analysis, orpresence of toxic compounds. In othercases the relative fluorescence signal maybe all that is needed to make informeddecisions. The power of the CyanowatchSystem is in the sensitivity of thefluorescence measurement, and it’s abilityto continuously monitor the cyanobacteriacommunity which is constantly changing;sometimes very rapidly.
The Cyanowatch is designed to be easilyinterfaced into external logging or datacollection software packages. It has ananalog 4-20mA signal that can deliver real-time fluorescence data to an externallogging system. The system also has a20,000-point internal data logger with user-selectable data logging intervals. Loggeddata can be downloaded to a PC using theRS-232 data output port (see Internal DataLogger section, pg. 13).
Data InterpretationUpon installation of the Cyanowatch, thefluorescence data should be compared todata from other systems that are affectedor used to monitor cyanobacteria. Forexample, taste and odor problems may becorrelated with increased levels ofcyanobacteria. Once this relationship hasbeen determined you can set alarms onthe Cyanowatch (see Alarms, pg. 18) orthrough the external logging system tonotify you when this level is reached.With this information you will be able totake actions to avoid taste and odorproblems. Other examples of data that canbe used to compare against theCyanowatch data include; cell counts,turbidity or extracted chlorophyll data.
Once relationships between cyanobacteriafluorescence and other measures ofinterest have been established, thefluorescence data can be used to assist indecision making. Examples of how thefluorescence data can be used include:
1) Determining when to treat water forhigh concentrations of cyanobacteriaand thus minimizing the amount oftreatment chemical used and avoidtaste and odor problems.
2) Location of water intake to minimizetreating water with high cyanobacterialbiomass.

3 cyanowatch REV 1.3
SPECIFICATIONSSensitivity: 150 cells/mLLinear Range: 0 – 50,000 cells/mLLight Source: Phycocyanin = Yellow: Phycoerythrin = GreenExcitation Optics: ;PC = 638 nm; PE = 528 nmEmission Optics: PC = 740 nm; PE = 573 nmPower: 90-250 VAC, 50/60 Hz, 5 ampsRelay: 90-250VAC, 50/60Hz, 5 amps (fused at 3.15 amps, Type “F”)Signal Output: One 4-20 mA (isolated)Dimensions: 8” W x 4” D x 15” HWeight: 5 lbs. [2.3 kg]Enclosure: Approximates NEMA 4XMaximum Water Pressure: 100 psiInlet/Outlet Pipe Size: ¼” NPT (male/female)Outlet Pipe Size: ¼” NPT (female)Ambient Temperature: 40-120 °F [4-49 °C]Maximum Sample Temperature: 140 °F [60 °C]Relative Humidity: 0-100%Overvoltage Category IIPollution Category I
INSTALLATION
Pre-Installation/InstallationA pre-installation/installation checklistprovides important guidelines andinformation to aid in preparing forinstallation. The checklist is found inAppendix B.
Power & Utilities RequiredPower: 100-130 VAC/200-250VAC,50/60 Hz, 5 amps.Signal Output: One 4-20 mA signal(isolated)Water Sample: Supplied to unit at 0.5gpm minimum and less than 100 psi.Drain: The Cyanowatch sample outletshould be piped to drain with no backpressure, i.e., drain pipes must be belowthe unit. In installations where this is notfeasible, contact Turner DesignsTechnical Support for further assistance.Required Tools and AccessoriesStandard plumbing and electrical tools arerequired for the installation.
A terminal strip screwdriver is provided formaking terminal strip connections.CAUTION: The CyanoWatch shouldonly be used with PVC plumbing kitP/N 6500-955 as supplied.
The Cyanowatch should be piped asshown in Figures 3 and 4, pages 36 and37. The components may be purchasedseparately or as a package throughTurner Designs.
Location of Cyanowatch and SamplingPointThe Cyanowatch is rated for lightindustrial environments. Do not installwithin 10 feet/3 meters of devices such aslarge generators that generate a strongelectromagnetic field.
It is extremely important to eliminate airentrapment in the sample line. The bestway to accomplish this is to sample fromthe center of the pipe or from the side ofthe pipe.
The unit should not be installed in directsunlight; this could cause the internaltemperature of the unit to be significantlyhigher than ambient and produce errors ordamage the components.Note: The maximum environmenttemperature is specified at 120oF/49oC.
Do not mount this instrument onvibrating walls or surfaces. Damagecan occur to critical components.

4 cyanowatch REV 1.3
Mechanical ConnectionsRefer to Figure 6, Appendix F for thelocation of the required mechanicalconnections.
Two ¼ inch NPT pipe connections areprovided for ¼ inch PVC pipe hook-up.The sample outlet line is ¼ inch female;the sample inlet line is ¼ inch male shutoff valve.
If the Plumbing Accessory Kit ispurchased, the outlet line is ¼ inch NPT(female) to connect to user-supplied ¼inch male piping; the inlet line is ½ inchNPT (female) to connect to user-supplied½ inch male piping (see Figures 3 and 4on pages 36-37).
IMPORTANT:Sample discharge should flow to anunrestricted drain. Pipe rises greater than10 feet [3 m] should be avoided.
Mounting eyelets are an integral part ofthe plastic housing. Mounting the unit ateye level is recommended.
Electrical Connections
Electrical connections should be madeonly by trained personnel
Refer to Figure 5, pg. 38 for the “TerminalConnections”, showing the terminal striplocation and configuration of the requiredelectrical connections for the power,pump, flow switch and 4-20 mAconnections.
To access the terminal strip, TURN OFFMAIN POWER TO THE INSTRUMENTAT CIRCUIT BREAKER, then remove thelower enclosure face (4 screws). Thereare two terminal strips within theinstrument. #1-9 are for AC connectionsand A-L are for input/output connections.
To connect a wire to the terminal strip,TURN OFF MAIN POWER TO THEINSTRUMENT AT CIRCUIT BREAKER.Loosen the proper terminal screw(screwdriver provided) and insert wirefrom below into terminal. Tighten screwfirmly. A termination legend is providedon the backside of the enclosure door forreference.
To disconnect a wire, TURN OFF MAINPOWER TO THE INSTRUMENT ATCIRCUIT BREAKER. Loosen thetermination screw and pull the wire out ofthe terminal.
When finished, carefully insert the ribboncable onto the PCB and replace enclosureface with the 4 screws.
Signal wires and power wiring shouldNOT be run in the same conduit.Failure to separate or shield these wireswill result in electrical interference.

5 cyanowatch REV 1.3
START-UPBefore start-up, the following items shouldbe procured:
Calibration Solution P/N 6500-900(ordered/shipped separately from unit) Distilled Water Dilute Acid (not included) Plumbing Kit P/N 6500-955
(ordered/shipped separately fromunit)
Items listed above as ‘ordered/sentseparately’ do not automatically ship with anorder.
Start-Up Procedure1. Bring the sample flow to the unit. Check for
leaks in the plumbing.
2. Switch the Main Power Switch (under theenclosure face; see Figure 2, page 9) to theON position. The LCD will illuminate.
When the power is first turned on, an IDscreen will appear for a few seconds,showing the firmware version and date.After 10 seconds (or press <ENT> or<HOME> for immediate access), the HOMEscreen will appear. The HOME screen willdisplay the uncalibrated phycocyanin orphycoerythrin fluorescence value (3 digits).
If the screen is blank, try adjusting thescreen contrast using the UP and DOWNARROWS.
SAMPLE HOME SCREEN
Cyanowatch
During start-up, all system values should berecorded in the configuration record locatedin Appendix A.
Entering System Values & DefinitionsFrom the HOME screen, press <0> toenter/change the first System Value;Calibration Solution Value.
For future reference, a diagram of thescreens is located on page 31.
<0> Cal Soln Value (Calibration SolutionValue) -- This value relates the value of thecalibration standard to a fluorescencemeasurement. The default value of 15 fromTable 1 on page 12 is recommended,unless you are establishing a correlation toa known concentration as described inAppendix G.
Before entering/changing the first SystemValue, the unit will prompt for the User I.D.and the screen will read
Please input ID:
Enter a valid USER ID (default is 8520)
Press <ENT>
Key in the Calibration Solution Value
Press <ENT>Press <HOME>
From the HOME screen, press <1> toenter/change the second System Value;Background Value.
<1> Background Value— This value is thebackground fluorescence (%) for thesample. Background fluorescence can becaused by materials in the sample waterthat have a similar fluorescence signature tophycocyanin or phycoerythrin. Examples ofinterfering compounds include dissolvedorganic matter, accessory algal pigments,and degraded chlorophyll (pheophytin).High concentrations of interferingcompounds can result in a slight increase tothe fluorescence signal.
A means of compensating for thisbackground fluorescence is to estimate thecontribution of the interfering compounds tothe fluorescent signal and enter the level ofinterference as the background value. Thesystem will then automatically subtract theentered background level % from thefluorescent reading. The degree of

6 cyanowatch REV 1.3
background fluorescence varies from site tosite.
The Unit must be calibrated prior to settingthe Background Value.
To determine the appropriate backgroundvalue %, filter a sample of water through aGF/F or membrane filter to remove allcyanobacterial cells. Next, inject the filtrateinto the Cyanowatch using the syringeprovided. Assuming that the defaultcalibration is active (secondary standard setto 500), take the fluorescence value of thefiltrate and plug into the following formula;Filtrate fluorescence (X) / 5 = BackgroundFluorescence %
Press <1>Press <ENT>Key in the Background Value (%)Press <ENT>Press <HOME>
From the HOME screen, press <2> toenter/change the third System Value; HighSignal Alarm Level.
<2> High Signal Alarm Level—If the fluorescence level rises above thislevel (and remains there for a 5 minutedelay period), a high signal alarm will betriggered. The alarm triggers the 5V DCsignal output which can be used to controlexternal devices such as a light, siren orexternal control device. Please also see thesection on Alarms, page 18.
Press <2>Press <ENT>Key in the High Signal Alarm LevelPress <ENT>Press <HOME>
Initially you will most likely want to leave theHigh Signal Alarm disabled until youbecome familiar with the typical fluctuationsin cyanobacteria levels. Once this isestablished you will now recognizeabnormally high signal levels and then beable to set the alarm appropriately.
From the HOME screen, press <3> toenter/change the fourth System Value;4 mA Output.
<3> 4 mA Output—The 4-20 mA outputcan be connected by a signal wire to a datalogger or other device to collect and storeremotely from the unit. Outputs can be setto correspond to a certain range offluorescence values. Typically the 4 mAoutput is set at 0.
The unit will reject as INVALID INPUT thenew 4 mA value if it is not lower than the 20mA output value.
Press <3>Press <ENT>Key in the 4 mA outputPress <ENT>Press <HOME>
From the HOME screen, press <4> toenter/change the fifth System Value; 20 mAOutput.
<4> 20 mA Output—The 4-20 mA outputcan be connected by a signal wire to a datalogger or other device to collect and storeremotely from the unit. Outputs can be setto correspond to a certain range offluorescence values. The 20 mA outputshould be set to a value slightly higher thanthe highest fluorescence signal(phycocyanin or phycoerythrinconcentration) you expect to experience. Ifthe signal exceeds the assigned 20 mAvalue, the unit will simply output 20mA. Ifthe 20mA value is set excessively high youwill limit the resolution of your analog data.
The unit will reject as INVALID INPUT thenew 20 mA value if it is not higher than the4 mA output value.
Press <4>Press <ENT>Key in the 20 mA outputPress <ENT>Press <HOME>

7 cyanowatch REV 1.3
The narrower the range of the 4-20 mAsettings, the greater the resolution.
During an alarm condition, the 4-20 mAoutput will still send out the fluorescencesignal.
During calibration the 4-20 mA output willsend out a 4-mA signal.
From the HOME screen, press <5> toenter/change the sixth System Value; UserID
<5> User ID Change—For security, aUSER ID is required to change the SystemValues or calibrate the unit. The original, ordefault, value is 8520.
To change the USER ID;
Press <5>Key in Master ID (1962)Press <ENT>Key in new User ID.Press <ENT>Press <HOME>
From the HOME screen, press <6> to viewthe seventh System Value; AC Relay Status
<6> AC Relay Status—Displays the currentactivation status of AC Relays A and B.This screen is for visual status only. TheAC Relays are used to control an externaldevice activation state cannot be alteredfrom the screen.
Press <6>Status of AC Relays A & BPress <HOME>
Setting the Real-Time Clock
For future reference, record all set-upvalues in Appendix A.
Before changing the date or time, be sure todownload any data from the data logger.
From the HOME screen, press <> toaccess the date, time, and AC relay alarmvalues.
<0> Hour—For the datalogger to referencethe correct time, the hour of day must beentered. Only 1-12 numerical values will beaccepted.
Press <>, from HOMEPress <0> Key in the hour of day (1-12)Press <ENT>Press <ESC> to return to clock menu
<1> AM/PM—For the datalogger toreference the correct time (morning orevening), AM/PM must be entered. Use<ENT> to toggle between AM/PM.
Press <>, from HOMEPress <1>Press <ENT> to toggle betweenAM/PMPress <ESC> to return to clock menu
<2> Minutes—For the datalogger toreference the correct time, the number ofminutes after the hour must be entered.
Press <>, from HOMEPress <2> Key in the minutes after thehour (0-59)Press <ENT>Press <ESC> to return to clock menu
<3> Month—For the datalogger toreference the correct date, the month of theyear must be entered.
Press <>, from HOMEPress <3> Key in the month (1-12)Press <ENT>Press <ESC> to return to clock menu
<4> Date—For the datalogger to referencethe correct date, the day of the month mustbe entered.
Press <>, from HOMEPress <4> Key in the day (1-31)Press <ENT>Press <ESC> to return to clock menu

8 cyanowatch REV 1.3
<5> Year—For the datalogger to referencethe correct date, the year must be entered.
Press <>, from HOMEPress <5>Key in the year (00-99)Press <ENT>Press <ESC> to return to clock menu
<6> AC Cycle Time— Controls thefrequency in which AC Relay Outputs areactivated. Range from 10 minutes to 96hours.
Press <>, from HOMEPress <6>Press <ENT> to toggle (0min – 96hrs)Press <ESC> to return to clock menu
<7> AC On Time— Controls the length oftime the AC Relay Outputs stay on whenthey are activated. Range from 0-100% ofthe AC Cycle Time.
Press <>, from HOMEPress <7>Press <ENT> to toggle (0-100%)
Press <ESC> to return to clock menu
For Example: If you would like to use theAC Relay to control sample source using anautomated valve you may want to sampleraw water (containing algal cells) for 30minutes every hour. In this case you wouldset the AC Cycle Time to 60minutes and theAC On Time to 50%. The result would bethat the valve would allow treated municipalwater to run through the system for 30minutes every hour, thus limiting the effectsof biofouling, and raw sample water wouldflow through the system for 30 minutes anhour.
The Cyanowatch unit start-up has nowbeen completed.
CAUTION: After start-up, wait a minimumof 15 minutes before calibrating the unit toallow the unit to come to equilibrium.

9 cyanowatch REV 1.3
Figure 2. Cyanowatch - Front View-External

10 cyanowatch REV 1.3
CALIBRATION
Calibration ProcedureThe Calibration Procedure will takeapproximately 5 minutes. The cleaningprocedure will take approximately 10minutes. Refer to Figure 2 on previouspage, for locations of items referred to inthis procedure. For further reference, adiagram of the screens and a briefsummary of the System Values can befound on page 27.
Bubbles trapped in the syringe duringinjection of the blank or calibrationstandard are a possible cause ofinstrument error. With the syringe in avertical position, tap the syringe againsta solid object to move the bubbles tothe needle end of the syringe. Then,force the bubbles out by pushing asmall amount of solution through theneedle end of the syringe.
Step 1 Close the two-way valve flowcell shut-offvalve. The valve is closed when thehandle is horizontal.
Blank and Dilute Acid Solutions:Both the Blank and Acid Solutions arenot included with the CyanowatchSystem. Deinoized water should be usedas the Blank. 10% Sulfuric Acidrecommended or 1:1 HCl is acceptableif the flowcell is well rinsed.
Calibration Solution:Confirm that the correct CalibrationSolution is entered before beginning theCalibration Procedure by pressing <0>from the HOME screen. See Start UpProcedure for details, pg. 5.
Step 2 Clean the unit by injecting the dilute acidsolution with a syringe into the flowcell.See Notes on Calibration for details,page 12. The syringe screws onto theLuer Lock fitting on the inlet of theflowcell (see Figure 2, page 9). Afterfilling the syringe with 60 ml of diluteacid, screw the syringe onto the fitting,inject the dilute acid at a slow, steady
rate into the flowcell, and allow it to standfor 3 to 5 minutes. Next, using a clean60 ml syringe, flush the flowcellthoroughly with 60 ml of blank solution.
Syringes are provided in the Accessoryand Calibration Kits. To purchaseadditional syringes see ReplacementParts, page 17.
Step 3 Press <ENT> from the HOMEscreen:
1. Calib 2. Data
Cal 0 Days Ago
Step 4 Press <1> the unit will request IDentry (unless recently entered):
Please input ID:
If requested, enter valid USER ID(originally 8520) on the keypad.
Step 5 Press <ENT>:
CALIBRATE SYSTEM<1> to start
Step 6 Press <1>:
BLANK
SOLUTION
Using the blank solution syringe, flushthe flowcell with 60 ml of blank solutionvia the Luer-lock Injection Port. Theninject another 60 ml blank solution andallow it to remain in the flowcell byleaving the syringe attached.
Step 7 Press <ENT>:
BLANK %:
XXXX

11 cyanowatch REV 1.3
Any value less than 25% is acceptable.If the blank is over 25% and <0> ispressed, you will receive an errormessage. Press <ESC> to abort thecalibration and check the blank solution.
When reading is stable, press <0>. Theunit will display a flashing “WAIT/wait”message in the lower right-hand cornerof the screen while the unit registers theblank.
Then, the screen will display:
To continuePress <ENT>
Press <ENT>:
CALIBRATIONSOLUTION
Using a clean syringe, flush the flowcellwith 60 ml of Turner Designs calibrationsolution (see Replacement Parts, pg.17)via the Luer-lock Injection Port. Theninject another 60 ml calibration solutionand allow it to remain in the flowcell byleaving the syringe attached.
For Phycocyanin instruments, dilute theTurner Designs Calibration Solution to100 ppb concentration, (4:1 dilution). ForPhycoerythrin instruments, dilute TurnerDesigns Cal Solution to a concentrationof 10 ppb (40:1).
Step 9 Press <ENT>:
CAL SOLUTION %:XX
Wait for the reading to stabilize. TheCAL SOLUTION % should be 1-10%When the CAL SOLUTION % is stableand between 1 and 10, press <*>. Theunit will display a “WAIT/wait” messagein the lower right-hand corner of thescreen while it registers the calibrationsolution.Then, the screen will display:
To continuePress <ENT>
Step 10 Remove the syringe and press<ENT>:
Press <1> to EndCalibration
Press <1> to accept the calibrationsettings. The calibration is now complete.YOU MUST press <1> or the calibrationwill revert to the previous settings.
Step 11 Open the flowcell shut-off valve.The valve is open when the handle isvertical.
** Calibration is finished **
Step 12 Press <HOME> to return to theHOME Screen and normal operations.
Notes on Calibrating1. Calibrate the unit when you have time togo through all the steps without interruption(approximately 10 minutes). If the keypadis not used for 15 minutes, the unit willautomatically return to the HOME screen.The previous calibration will be maintained.
2. The AC Relay activation schedule is notaltered during calibration.
3. A request to begin calibration when analarm is activated will be denied, unlessthe alarm is for:
High Signal Alarm (“S-H”);
4. The following alarms will not bemonitored during calibration:
High Signal Alarm (“S-H”);No Sample Flow Alarm (“N-F”)
5. If an internal unit function alarm (“F-A”alarm) occurs during calibration, whenyou return to the HOME screen, “ALM”will be blinking in the upper left handcorner of the screen. Correct the

12 cyanowatch REV 1.3
condition causing the alarm, thenrecalibrate the unit.
6. During calibration, the 4-20 mA outputwill send out a 4-mA signal.
7. Use distilled or de-ionized water as blanksolution. If you are not using commercialdistilled water, check your source ofblank solution against distilled water forbackground fluorescence. DO NOT USESAMPLE WATER AS A SOURCE OFBLANK SOLUTION. Use of the wrongblanking solution can result in inaccuratefluorescence values.
8. Use only Turner Designs fluorescencecalibration solution (see CalibrationSolutions in the Replacement Parts, page17). These calibration solutions meetstrict specifications that are difficult toachieve when the solutions are made atthe customer’s site. Not using the TurnerDesigns solutions could result ininaccurate fluorescence values.
9. All solutions are injected with a syringeinto the stainless steel Luer-lock InjectionPort. Depress plunger at a steady,slow rate.
10. Use a separate syringe for the blankand calibration solutions.
11. Avoid injecting bubbles into the unit.Bubbles trapped when injecting theblank and calibration solution are apossible cause of instrument error. Withthe syringe in a vertical position, tap thesyringe against a solid object to movethe bubbles to the needle end of thesyringe. Then, force the bubbles out bypushing a small amount of solutionthrough the needle end of the syringe.
12. The LEFT ARROW may be used toreturn to previous calibration screens.
13. During the calibration sequence, MAKESURE to wait for BLANK % and CALSOLUTION % readings to stabilizebefore pressing the appropriate key onthe keypad.
14. DO NOT allow the calibration solution tosit in the flowcell for longer thannecessary (approximately 2 minutes).
15. To abort the calibration and maintainthe current calibration settings, press<ESC> before step 9 is completed. Theunit will prompt
<1> Abort Cal<ESC> Continue
Press <1> to abort.
16. The entire calibration procedure mustbe completed for the new valuesentered during calibration to be store
Calibration Data ScreenThis screen provides a check on propercalibration. It is accessed from theHOME screen by pressing <ENT>, then<2>.
Table 1. Calibration DataBlank Cal
StdAccess Key <ENT> & <2>Default 0.0 15.0Range 0-250 0-1,000
Blank: Shows raw data output for blanksolution as set during calibration.It can be used to check proper calibration.
Blanking capability of the instrumentis 25% (e.g. maximum blanking ofraw data is 250.0)
Cal Std: Shows raw data output for thestandard solution as set during calibration.It can be used to check proper calibration.

13 cyanowatch REV 1.3
INTERNAL DATA LOGGERCyanowatch is equipped with an internaldata logger to record the unit’s output.Data is saved in a compressed binary(BIN) format to be downloaded andconverted to ASCII data with the InternalData Logger (IDL) software.
Data Logger ParametersThe unit’s data logger is accessed from theHOME screen by pressing the data disk<> symbol on the keypad. From the datalogger menu, you can turn the data loggeron/off, set the interval, and download anderase data.
The clock is important to the data loggingfunctions. Once the date and time are setand data has been logged, download thecurrent data before changing the date ortime or you may corrupt or erase your data.
1. From the HOME screen, press <> to seethe data logger menu. Beforeentering/changing the data logger, the unitwill prompt for the User I.D. (Default=8520)and the screen will read:
After entering the User ID the screen willread:
2. To log data or stop logging data, press<0>:
Press <ENT> to toggle from Stop toLogging. Press <ESC> to return to themain Datalogger screen.
3. To set the data logging interval press <1>.Press <ENT> to toggle from 1, 2, 3, 5, 10,20, or 30 minutes, or 1 second.
Download current data before changingthe data-logging interval or you maycorrupt your data.
4. To download the data to a Windowsbased PC or to erase data, from the datalogger menu, press <2> or <3>,respectively.
Installing the Internal Data LoggerSoftware
The Internal Data Logger (IDL) software isdesigned to interface from theCyanowatch to a Windows based PC. TheIDL program is used to download thecompressed data from the Cyanowatchand convert it to an ASCII format for usewith a spreadsheet or other program.To install the IDL software:1. Insert the IDL disk into your
computer.2. Access “Run” from Windows. Type:
a:\setup. (Be sure to enter the correctdrive for the disk.
Running the Internal Data LoggerSoftware
To download data from theCyanowatch:
1. Using the cable provided, connect yourcomputer to the unit’s serial port -phone jack style connector. See Figure2, page 9 to locate.
2. Load the IDL program on the PC byclicking twice on the IDL.exe icon. TheIDL Main Menu will appear.
3. Click on Serial Port Setup to select theappropriate port (1, 2, or 3) for your PC.
4. Click on Download Data fromInstrument to File to display thedownloading box on the PC.
Please input ID:
Status: Stop<ENT> to toggle
Datalogger:
<0> - <3>
Interval: 1 min<ENT> to toggle

14 cyanowatch REV 1.3
You may download and convert to anASCII file in a single process by clicking onDownload and Convert Data fromInstrument to File. In this case, IDL willprompt you for downloading, thenconversion in a single processincorporating steps 5 - 10.
5. From the Cyanowatch, set the datalogger to Stop, by pressing <> fromthe HOME screen, then <0>, then<ENT> to toggle.
6. From the Cyanowatch, access thedownloading screen by pressing <2>from the data logger main menu:
7. On the Cyanowatch, press <8> fivetimes to start downloading data. ThePC will display a bar graph and datablock countdown. The Cyanowatch willdisplay:
If there is an error in downloading data,the following screen will be displayed:
a. If the error screen appears, press<ESC> and make sure the serialcable is securely connected andoperational.
b. Make sure the correct serial porthas been selected (IDL softwaremain menu).
c. Check to make sure that theCyanowatch date and timefunctions have not been changedfor the current data logged.
d. Verify that you completed steps 1- 7. Correct screens must bedisplayed on both the computerand Cyanowatch.
8. When downloading is finished, IDL willask you to name the file and select thepath (folder) for the downloaded file.Click on Browse to change the nameor path; or you can accept the defaultname (test.bin) and path. Then, clickon OK to return to the Main Menu.
If you would like to wait until later toconvert the data to ASCII format inorder to save disk space, then skip tostep 12. To convert the data to anASCII file now, go on to step 9.
9. To convert a BIN file to a regular ASCIIfile (PRN file), from the PC click on theConvert Downloaded Data File toASCII File. IDL will then ask you whatfile you would like to convert to ASCII.Click on Browse to locate the file orclick on OK to accept the default file.
10. Click on OK to begin conversion. IDLwill display “Conversion has started.”IDL will convert the BIN file to an ASCIIfile of the same name with theextension “PRN”. When “Conversioncompleted” appears, click on OK toreturn to IDL Main Menu.
11. To exit IDL, click on the “X” in the upperright-hand corner of the softwarewindow or select “Exit” from the filemenu.
12. Disconnect the computer from the unit.Erase the data currently in theCyanowatch by pressing <> from theHOME screen, then <3> from the datalogger menu:
When data is erased, the unit will display:
Erase data:<9> 5X to start
Erase data:All Data Erased
Download data:5x <8> to start
Download data:Data Blks: XX
Comm error !!!<ESC> to retry

15 cyanowatch REV 1.3
13. Enter new internal data loggingparameters on the Cyanowatch ifdesired, or resume logging with theprevious parameters.
14.Return the unit to normal operation.
Examining the Downloaded Data
The ASCII-format “PRN” files can beopened, viewed, or printed using moststandard computer programs. To examinethe data, run your program, then open orimport the “PRN” file containing thedownloaded data.
A typical line of data from the internal datalogger will look like this (your numbers willvary):
00001: 10/24/91 14:10:28 = 11.300
Index Date TimeSampleReading

16 cyanowatch REV 1.3
PREVENTIVE MAINTENANCEProper preventive maintenance is critical tothe success of the Cyanowatch System.Once the unit is installed, started-up, andcalibrated, the initial settings should notrequire change. Refer to Start-up, page 5,of this manual for instructions. Any start-up or shutdown must be made using theCyanowatch Main Power Switch (seeFigure 2, page 9).
The System Values are retained in batteryback-up memory for up to five years.However, the Start-up procedure should befollowed to ensure fluorometer calibrationand alarm settings are correct if the unithas been disconnected for any length oftime.
This unit has been assembled with a newdesiccant plug to ensure the areasurrounding the flowcell is free of anymoisture. As this plug absorbscondensate, it will change from a light blueto light pink at the saturation point andshould be replaced promptly. The unit canremain in operation during thisreplacement. Readings should bemonitored during this replacement time assmall variances might occur. Refer to theReplacement Parts section, pg. 17, forreplacement plugs ordering information.
The following preventivemaintenanceshould be performed to ensure optimumoperation and maximum life.
Cleaning the Basket StrainerThe basket strainer screen should becleaned as needed as follows:1) Shut off the inlet valve to the basket
strainer;2) Remove the screen by unscrewing the
clear plastic basket housing and cleanthe screen;
3) Replace the screen;4) Open the inlet valve to the basket
strainer.5) Wait for the unit to equilibrate and air to
purge from the unit.
CalibratingCalibration should be checked regularly.
Typically, calibration should be checkedusing the secondary standard included inthe calibration kit every two to three weeks.
Cleaning the FlowcellHow often the flowcell should be cleaneddepends on the quality of the water beingmonitored. The flowcell is unlikely to clog,but occasionally residue or biofilms canbuild up on the inside of the glass cuvette.A fouled or discolored flowcell can result inlow or erratic readings.
Initially, routine flowcell cleaning should beconducted and fluorescence readingsbefore and after cleaning should carefullynoted. If a significant change in the readingresulted from cleaning, a shorter cleaninginterval should be implemented. If therewas no significant change in the readingafter cleaning, a longer cleaning intervalcan be used.
For routine cleaning, follow steps 1 and 2in the Calibration Procedure, page 10;open the flowcell shut-off valve whencleaning completed.
For cleaning the flowcell with a brush,perform the following steps (refer to Figure2, pg. 9):
1. Turn OFF the Main Power Switch.
2. Shut off the flow to the flowcell. Flow isoff when valve handle below the flowcell ishorizontal. It is recommended that theinlet valve be closed and the 3-way outletvalve also be closed (the outlet valve isthen open to the atmosphere; see Figures4 and 5, pages 37-38).
3. CAUTION: After injecting acid solutioninto the flowcell via the luer lock port, besure to flush it out completely BEFOREremoving the clean-out cap.
4. Remove the clean-out cap and open theclean out valve (horizontal position). Dipthe flowcell brush into the dilute acidsolution and insert it gently into the clean-out opening.

17 cyanowatch REV 1.3
5. Slide it gently up and down in theopening to remove any coating on theglass cuvette.
6. Close the clean-out valve (verticalposition) and replace the flowcell clean-out cap.
7. Turn on the flow. Flow is ON when thevalve handle is vertical.
8. Turn ON the Main Power Switch.
9. Calibrate the unit after allowing it towarm up for 15 minutes (refer toCalibration Procedure, page 10).
BiofoulingSample water containing bacterial and algalcells will be in contact with the glass flowcell ofthe Cyanowatch System. Because of this abiofilm will gradually begin to grow on theflowcell and at some point the film will becomethick enough to interfere with the fluorescentreadings. The rate of fouling will change fromsite to site.
The Cyanowatch has an optical compensationsystem that will correct for fouling to a certainpoint. Beyond this it is the user’s responsibilityto clean the flowcell on a regular basis toprevent corruption of the data. There areseveral ways in which the rate of biofoulingcan be slowed.1) Flow rate: As the flow rate in the flowcell
increases the rate to which biofoulingorganisms and attach and grow on theflowcell walls will decrease. The minimumflow rate required is 0.5 gpm. Flow rates inthe range of 2-5 gpm could significantlydecrease flowcell fouling rates.
2) Flowcell cleaning: The Cyanowatch hasbeen designed to allow quick and easycleaning of the flowcell. A regularschedule should be established in order toprevent the establishment of biofoulingorganisms on the flowcell.
Replacement Parts:6500-900 Cyanobacteria Cal Kit6000-970 Desiccant Plugs (Pkg. 3)6000-350 Flowcell Brush (Pkg. 3)6000-119 Data Cable6000-910 Syringes (Pkg. 10)120-0110 Flow Switch119-0103 Basket Strainer

18 cyanowatch REV 1.3
ALARMSAlarms have been built into the unit towarn about conditions relating to highalgal levels and internal instrumentfunctions. There are two types of alarmsfor Cyanowatch:
1. System function alarms, Fluorometer(lamp) and No Flow (“F-A” and “N-F”alarms). See Table 2.
2. High Signal alarms. See Table 3, page 19.
Refer to Table 5, page 25, for defaultvalues.
Alarm DelayTo avoid unnecessary triggering ofalarms, the condition must be in effect fora certain delay period. See Tables 2 and3.
Alarm ActivationWhen an alarm is triggered, “ALM” willblink in the upper left hand corner of theHOME screen. From any other screen,when the alarm is first activated, the unitwill return to the HOME screen, displaythe “ALM” message in the upper lefthand corner. Pressing the <ESC> keywill display the current alarm. Take theappropriate action to clear the condition(see Troubleshooting, page 20).When the condition triggering the alarmis cured, “ALM” will disappear from theHOME screen.Alarms cannot be aborted without curingthe problem.
Multiple AlarmsIf multiple alarms are triggered, alarmswill be listed on the alarm screen when<ESC> is pressed from the HOMEscreen. Note: Alarms are not listed inthe order they occur. For example, thealarm screen might display:
N-F F-A
Alarm HistoryThe alarm history can be viewed, bypressing <> (LEFT ARROW) from theHOME screen. This shows which alarmshave been activated since the alarmhistory screen was last cleared. To clearthis screen, press <*> five times while thealarm history screen is displayed; “Noalarm since last reset” will be displayed.
Notes About Alarms1. No alarms are monitored when the
unit is turned OFF.2. Certain alarms are not monitored
during calibration (see Notes onCalibrating, page 11).
3. When the unit is first powered up, theHIGH SIGNAL alarm will begin to bemonitored 5 minutes after start up.Thus, a problem or spike during start-up will not mistrigger the HIGHSIGNAL ALARM.
4. All alarms will be reset automaticallyif the alarm condition is corrected.
5. During an alarm condition, the 4-20mA will still send out the fluorescencesignal.
Table 2. System Function Alarms
AlarmDelay(min.)
AlarmCondition
Normal
Lamp(F-A)
1 OFF ON
No SampleFlow (N-F)
5 OFF ON
Table 3. High Signal Alarms
AlarmDelay(min.)
Range Default
High Signal(S-H)
2 0.2-999 999

19 cyanowatch REV 1.3
System Function Alarm Definitionsa. Lamp (F-A)--Indicates the status of theexcitation light source. Reports whetherthe lamp is OFF or ON. If the power is ONand the lamp is good, the diagnosticscreen will display “Lamp: ON”.b. No Sample Flow (N-F)--If there is aproblem with the sample flow lasting for the10 minute delay period, a “N-F” alarm willbe noted. The flow switch used is rated at0.5 gpm minimum flow (tolerance is 0.4 -0.6 gpm).
If there is a “N-F” alarm, check terminalconnections to the flow switch. Checkthe sample feed lines and the unit’sflowcell for any restriction.
Electrical connections should beperformed only by trained personnel.
To determine which alarm is currentlyactive, press <ESC> from the HOMEscreen and the alarm status screen willappear.
F-A N-F
You may also view the lamp and flowstatus in real-time by accessing thediagnostic screens. The diagnosticscreens are accessed by pressing <*>from the HOME screen and then <ENT>.See Diagnostic Screen flowchart, pg. 31.If the Lamp displays “OFF” and there ispower to the unit, contact the TurnerDesigns Technical Support.
High Signal (S-H)--If the fluorescencesignal rises above the user-set level (seeTable 5, page 24), and remains there forthe 2 minute delay period, a “S-H” alarmwill be noted.
If there is a “S-H” alarm, check if the HighSignal Alarm Level is set too low. Verifythat calibration has been performedproperly.

20 cyanowatch REV 1.3
TROUBLESHOOTING
IntroductionBecause the Cyanowatch systemincludes hardware, software, andchemistry, it is important to collect all thediagnostic data first. To facilitate datacollection, each Cyanowatch unit isshipped with the TroubleshootingWorksheet ( E). After collecting the datarequested by the worksheet mostproblems can be solved over the phonewith the assistance of Turner DesignsTechnical Services. See ServiceAssistance/Returned Goods, page 24, forcontact information.
When using this guide, it is assumed thatall problems associated with an alarmhave been resolved first. Something assimple as a clogged basket strainer canlead to other alarm messages, whichcould all be solved at one time simply bycleaning basket strainer. Generallyspeaking, if there is no System FunctionAlarm (“F-A” alarm), this is persuasiveevidence that the electronics of theinstrument are functioning properly. Inthat case, it is likely that any problem iseither mechanical, or has resulted fromanother system problem, or it or it maybe an operational error.
The troubleshooting procedure worksbest in this sequence:
1. Handle any alarms (see Alarms, page 17).
2. Determine whether or not the SystemValues have been entered correctly (seerecorded values in Appendix A and theSystem Default Values in Table 5, page24).
3. Perform the Diagnostics procedure asdescribed on the following page.
4. Determine whether or not the chemistry isbehaving as expected. Does the blankread close to zero on the HOME screenand calibration solution read between 1-5%on the calibration screen? Check the “Caldata” screen (see Calibration Data Screen,
page 11) to determine whether the lastcalibration seems correct.
5. Complete the TroubleshootingWorksheet, Appendix E.
6. Contact the Turner Designs TechnicalSupport (see Service Assistance/ReturnedGoods, page 24).
DiagnosticsCyanowatch contains diagnostic screensand functions to aid in troubleshooting.These functions are accessed from theHOME screen by pressing <*>, then<ENT> to page through the series of 4screens. Press the <LEFT ARROW> toreturn to a previous screen, or <ESC> or<HOME> to return to the HOME screen.1. From the HOME screen, press <*>
TURNER DESIGNS
6600XBL 1.0 0302
This screen displays the version numberand release date of the firmware installedin the instrument.
2. From the above screen, press <ENT>
Raw: XXXFS% XX
Raw—The “raw” signal output is the outputfrom the unit’s light detector. This is theoutput Cyanowatch uses (in conjunctionwith the Cal Soln Value, Background value,etc.) to arrive at the fluorescence readouton the HOME screen. It can be used todiagnose problems with the unit. Forexample, if the HOME screen always readszero, and the Raw reading is also zero,there may be an optics problem. If theHOME screen reads zero but the Rawreading does not read zero, then check theCal Soln Value to make sure the propervalue is entered.FS%--Acts like an analog meter. Indicatesthe raw signal output as a percentage ofthe maximum that can be read.Value RangeRAW 0.00 to 1000.00(reading >1000.00 will display “OVER”)FS% 0 to 100 (if Blank equals 0)

21 cyanowatch REV 1.3
3. From the above screen, press <ENT>
1: Test RlyA: ON
2: Test RlyB: OFF
AC Outputs—Two independent solid staterelays control AC electrical output throughconnections (terminal strip connections 4-9) If Cyanowatch is connected to anautomated valve or other control device viaterminal strip connections 4-9, this functionallows you to test whether the unit’sinternal circuitry is operating and terminalstrip connections are correct. To test thedevice control of the Cyanowatch, thedevice itself must be on, working, andproperly connected to the terminal strip.Press <1> (or <2>) from the screen above,then <ENT> to toggle the chosen relay ONand OFF. The device should go on whenON is selected and off when OFF isselected. If it does not, then be sure tocheck the device itself first, then check theterminal strip connections (trainedpersonnel ONLY). When the test isfinished, return to the HOME screen anddevice control will revert to control bycurrent unit values.This function can serve as a “manualoverride” for device control tests. While onthis screen, you can turn a device on andoff regardless of the unit values previouslyentered.
4. From the above screen, press <ENT>
Oper: XXXX HrsLamp ON Flow: ON
Oper—This indicates how many hours theunit has been in operation sinceinstallation.Lamp—This indicates whether the LEDlight source is operating properly.Flow—This indicates whether the flow isON/OFF.
5. From the above screen, press<ENT>:
Blank: X.X
Cal std: XXX.X
For definitions, ranges, and default valuesof these items, see Calibration DataScreen, page 12.

22 cyanowatch REV 1.3
Troubleshooting GuideREMEMBER, handle any alarms FIRST.
SYMPTOM POSSIBLE CAUSE SOLUTION
HOME screen displaysover/OVER (blinking fromover to OVER).
A blinking ‘over/OVER’ is adifferent symptom than asteady ‘OVER’ and indicatesthat the sample readingexceeds 999. This is mostlikely related to the SystemValues entered for the site.If, for example, a Cal SolnValue of 200 was erroneouslyentered, the unit’s numericalcalculation of the samplereading might exceed 999.(NOTE: Examine “PossibleCause”/”Solution” in thenumbered order.)
1. System Values areincorrect (i.e. Cal SolnValue, etc.).
1. Check the ConfigurationRecord for the site. Access theSystem Values and verify thatthey are entered correctly.
2. Incorrect calibration 1. Check the Calibration Datascreen. Recalibrate the unit; besure to use the correct calibrationsolution and that the reading isbetween 1% - 10%. Check theexpiration date of the solution.
HOME screen displaysOVER (not blinking from overto OVER).
A steady ‘OVER’ is a differentsymptom than a blinking‘over/OVER’ and indicatesthat the sample reading is toohigh for the unit’s lightdetector. This is related tothe chemistry of the sampleand displays that the samplereadings are too high for theunit at the current sensitivitylevel. (NOTE: Examine the“Possible Cause”/”Solution” inthe numbered order.)
1. Possible opticsproblem. Improper ordeteriorated filters.
Check the FS% reading in theDiagnostics sequence.

23 cyanowatch REV 1.3
SYMPTOM POSSIBLE CAUSE SOLUTION
2. Incorrect calibration. Recalibrate the unit, making surethat you are using the correctCalibration Solution, and that itreads between 1 and 10%.Check the expiration date of thesolution.
3. System Values areincorrect (i.e. Cal SolnValue, etc.).
Check the Configuration Record.Access the System Values andverify they are entered correctly.
HOME screen displays minussign (negative readings), i.e.,sample is reading lessconcentrated than blank asset during last calibration.
1. Fouled flowcell. Thoroughly clean and rinseflowcell with recommendedsolution, using the brush ifnecessary. (See Cleaning theFlowcell, page 16.)
2. Calibrated withcontaminated blankingsolution, or thecalibration solution wasused instead of the blanksolution.
Recalibrate.
HOME screen reads zero. System Valuesincorrectly set.
Make sure valid System Valuesentered (see Appendix A).
Screen blank or black. LCD’s screen contrasttoo high or too low
If screen is blank, adjust contrastby pressing UP ARROW (ifscreen is black, use the DOWNARROW) continuously untilscreen is visible. Use UP andDOWN arrows to fine adjust.
Unit does not calibrate. Failure to completeentire calibrationprocedure.
You must press <1> at the end ofthe calibration sequence for theunit to accept the values.Recalibrate.
AC Out is not operatingproperly.
1. Problem with terminalstrip connections; ordevice itself.
If there is an alarm, check theHigh Signal Alarm for 0-5V signalproblems. Refer to Diagnostics(page 20), AC Out test function,to test if the unit is properlycontrolling the device using theAC Relays. Make sure the deviceitself is powered on andoperational.
2. Fuse has ‘blown’. Replace fuse with spare fuselocated in the spare fuse holderon the PCB.
24 cyanowatch REV 1.3
SYMPTOM POSSIBLE CAUSE SOLUTION
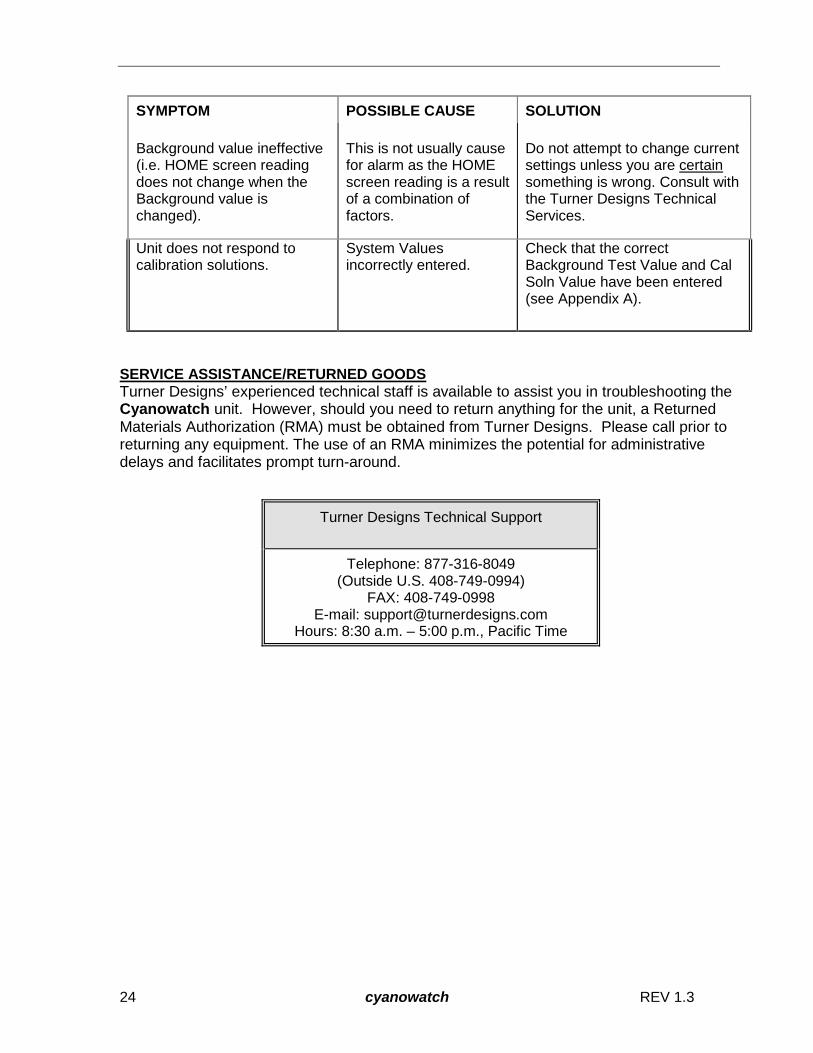
Background value ineffective(i.e. HOME screen readingdoes not change when theBackground value ischanged).
This is not usually causefor alarm as the HOMEscreen reading is a resultof a combination offactors.
Do not attempt to change currentsettings unless you are certainsomething is wrong. Consult withthe Turner Designs TechnicalServices.
Unit does not respond tocalibration solutions.
System Valuesincorrectly entered.
Check that the correctBackground Test Value and CalSoln Value have been entered(see Appendix A).
SERVICE ASSISTANCE/RETURNED GOODSTurner Designs’ experienced technical staff is available to assist you in troubleshooting theCyanowatch unit. However, should you need to return anything for the unit, a ReturnedMaterials Authorization (RMA) must be obtained from Turner Designs. Please call prior toreturning any equipment. The use of an RMA minimizes the potential for administrativedelays and facilitates prompt turn-around.
Turner Designs Technical Support
Telephone: 877-316-8049(Outside U.S. 408-749-0994)
FAX: 408-749-0998E-mail: [email protected]
Hours: 8:30 a.m. – 5:00 p.m., Pacific Time

25 cyanowatch REV 1.3
SPECIFICATIONS AND ACCESSORIESSpecificationsSensitivity 150 cells/mLLinear Range 0 – 50,000 cells/mLLight Source Phycocyanin = Yellow: Phycoerythrin = GreenExcitation Optics PC = 638 nm; PE = 670 nmEmission Optics PC = 740 nm; PE = 573 nmPower: 90-250 VAC/200-250 VAC, 50/60 Hz, 5 ampsRelays: 90-250 VAC/200-250 VAC, 50/60 Hz, 5 amps (fused at
3.15 amps ea. Type “F”)Signal output: One 4-20 mA, isolated
Dimensions: 8” W x 4” D x 15” H; 20cm x 10cm x 38cmWeight: 5 lbs; 2.3 kgEnclosure: Approximates NEMA 4X
Sample Flow:Maximum Water Pressure: 100 psi
Plumbing:Inlet/Outlet Pipe Size: ¼” NPT (Male/Female)
Environment:Ambient Temperature: 40°F to 120°F; 4°C to 49°CMaximum sample temperature: 140°F; 60°CRelative Humidity: 0-100%
Table 5. System Default Values and Ranges
SYSTEM VALUE ACCESS KEY DEFAULTVALUE
RANGE
Cal Soln Value <0> 15.00 0.000 to998.000
Background Value <1> 0.0% 0.0 to 100.0
High Signal Alarm Level <2> 999.000 (PPM) 0.004 to999.000
4 mA Output <3> 0.000 0 to 998.000
20 mA Output <4> 100.00 0.002 to999.000
Software Version <*> N/A Fixed
Master ID <5> 7420 Fixed
User ID <5> 8520 0 TO 9999
AC Cycle Time <clock>, <6> OFF 1 to 168 hours
AC On Time <clock>, <7> OFF 1 to 1440 min.
26 cyanowatch REV 1.3
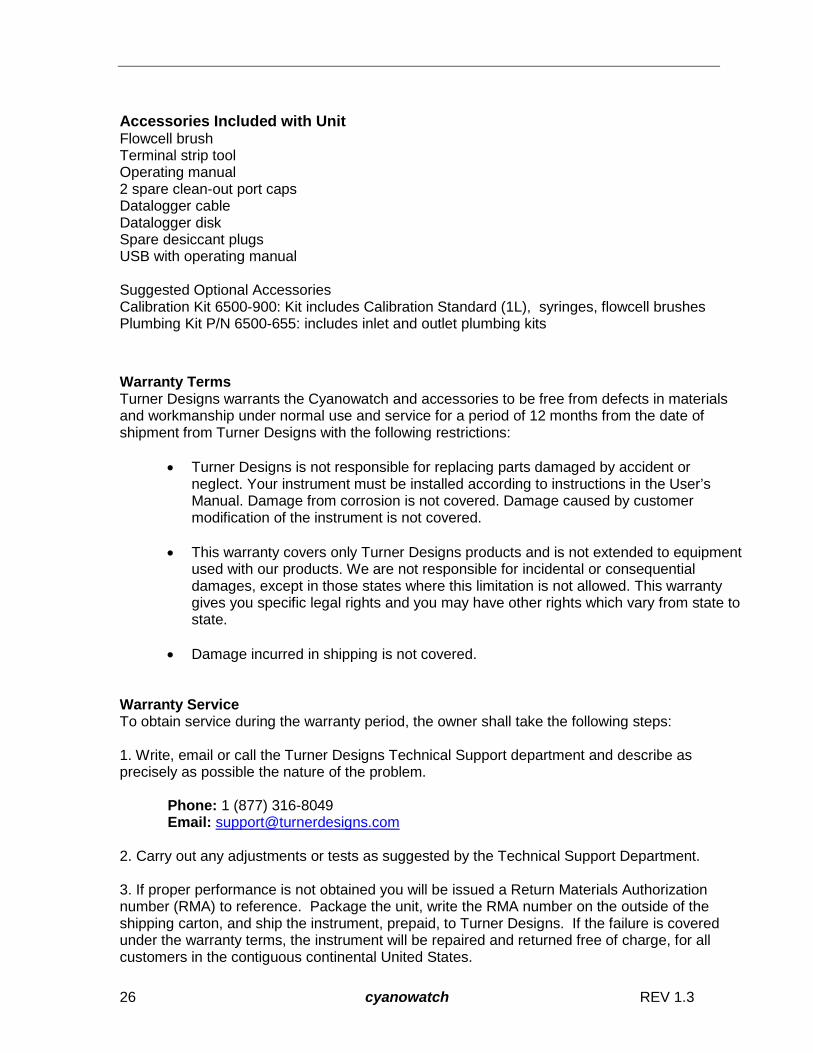
Accessories Included with UnitFlowcell brushTerminal strip toolOperating manual2 spare clean-out port capsDatalogger cableDatalogger diskSpare desiccant plugsUSB with operating manual
Suggested Optional AccessoriesCalibration Kit 6500-900: Kit includes Calibration Standard (1L), syringes, flowcell brushesPlumbing Kit P/N 6500-655: includes inlet and outlet plumbing kits
Warranty TermsTurner Designs warrants the Cyanowatch and accessories to be free from defects in materialsand workmanship under normal use and service for a period of 12 months from the date ofshipment from Turner Designs with the following restrictions:
• Turner Designs is not responsible for replacing parts damaged by accident orneglect. Your instrument must be installed according to instructions in the User’sManual. Damage from corrosion is not covered. Damage caused by customermodification of the instrument is not covered.
• This warranty covers only Turner Designs products and is not extended to equipmentused with our products. We are not responsible for incidental or consequentialdamages, except in those states where this limitation is not allowed. This warrantygives you specific legal rights and you may have other rights which vary from state tostate.
• Damage incurred in shipping is not covered.
Warranty ServiceTo obtain service during the warranty period, the owner shall take the following steps:
1. Write, email or call the Turner Designs Technical Support department and describe asprecisely as possible the nature of the problem.
Phone: 1 (877) 316-8049Email: [email protected]
2. Carry out any adjustments or tests as suggested by the Technical Support Department.
3. If proper performance is not obtained you will be issued a Return Materials Authorizationnumber (RMA) to reference. Package the unit, write the RMA number on the outside of theshipping carton, and ship the instrument, prepaid, to Turner Designs. If the failure is coveredunder the warranty terms, the instrument will be repaired and returned free of charge, for allcustomers in the contiguous continental United States.

27 cyanowatch REV 1.3
For customers outside of the contiguous continental United States who purchased equipmentfrom one of our authorized distributors, contact the distributor. If you purchased directly, contactus. We will repair the instrument at no charge. Customer pays for shipping duties anddocumentation to Turner Designs. Turner Designs pays for return shipment (custom duties,taxes and fees are the responsibility of the customer).
Out-of-Warranty ServiceFollow steps for Warranty Service as listed above. If our Technical Support department canassist you by phone or correspondence, we will be glad to, at no charge. Repair service will bebilled on a fixed price basis, plus any applicable duties and/or taxes. Shipment to TurnerDesigns should be prepaid. Your bill will include return shipment freight charges.
Address for Shipment:Turner Designs, Inc.845 W. Maude Ave.Sunnyvale, CA 94085

28 cyanowatch REV 1.3
APPENDIX ACONFIGURATION RECORD
Date Configured: _____Technician: _____Serial Number:_______
System Value
Background Value
Cal. Solution Value
High Signal Alarm Setpoint
4mA Output
20mA Output
AC Cycle Time
AC On Time
User ID
Range
0.0 to 100.0 %
0.000 to 998.000
0.004 to 999.000
0.000 to 998.000
0.002 to 999.000
10min – 96hours
1 to 100% of AC Cycle Time
4 digit
Configuration

29 cyanowatch REV 1.3
APPENDIX BPre-Installation/Installation Checklist
The following checklist is provided so the appropriate preparations may be made prior toequipment start-up. Completion of the listed items is mandatory to assure proper installation anda properly-functioning piece of equipment.
1. ________ ________ Check sample water background fluorescence (Background lab testcode).
2. ________ ________ Check that the turbidity is less than 150 NTU.3. ________ ________ Assure water temperatures of 32-140 oF.
INSTALLATION REQUIREMENTS - CUSTOMER1. ________ ________ Locate the unit within 125 feet from the sample point.2. ________ ________ Locate the unit out of direct sunlight.3. ________ ________ Locate the unit where ambient temperatures are 40-120 °F/4-49 °C.4. ________ ________ Locate the unit at least 10 feet/3 meters from devices such as large
generators, which require a great deal of electrical power, orgenerate a strong electromagnetic field.
CUSTOMER REQUIREMENTS - PLUMBER1. ________ ________ The sample stream must be plumbed to the unit to deliver at a rate
>0.5 gpm (between 0.5 and 1.25 gpm is optimal) and <100 psi. One½-inch and one ¼-inch NPT pipe connections (both female) areprovided for PVC pipe hook-up. Refer to Figure 3 and 4, page 36-37. Ensure that sampling point will avoid air entrapment.
2. ________ ________ Sample from the side of the water line to avoid air entrapment.3. ________ ________ Provide a free, unrestricted drain for the sample stream, preferablyto the tower basin - no back pressure, max. 10 ft/3 m rise.
CUSTOMER REQUIREMENTS - ELECTRICIAN1. ________ ________ Ensure that the environment will support a NEMA 4X-type
enclosure.2. ________ ________ Provide 90-250 VAC, 50/60 Hz, 5 amp electrical service to the
Cyanowatch.3. ________ ________ If the unit’s 4-20 mA output signal will be used, check to see if an
isolator should be purchased.4. ________ ________ Terminate flow switch wiring on terminal strip (refer to Figure 5, pg.
38).
FINAL REQUIREMENTS - CUSTOMER1. ________ ________ Obtain needed materials (calibration solution, distilled water,dilute acid, calibration kit, flowcell cleaning brushes)
Customer’s Responsibilities: This checklist outlines the work that is required prior to start-up.Work is necessary to ensure quality and proper operation. However, if any of theserequirements cannot be met, contact Turner Designs Technical Services. In some cases,alternative procedures will still provide reliable results.

30 cyanowatch REV 1.3
APPENDIX CFIRMWARE FUNCTIONSThe unit has a software interface that simplifies calibration and changes of unit values (SeeScreens Flow Charts, pages 31-33). The following descriptions of the unit’s softwarefunctions will help provide a better understanding of the unit:1. Screens—Built into the unit are a series of computerized screens, which are called
up using the keypad and shown on the digital display.
1.1Home Screen—Once the unit has been activated, the HOME screen iscontinuously displayed, except when accessing other screens.
From the HOME screen, access the calibration data and the calibrationsequence by pressing <ENT>. Other screens are accessed from the HOMEscreen by pressing various keys on the keypad.
Go to the HOME screen by pressing the <HOME> key, except during thecalibration procedure. To return to the HOME screen from calibration, first press<ESC> to abort the calibration sequence.
1.2 Warning Screens—There are warning screens throughout the software thatinform of invalid entries (for values or ID).
1.3 Alarms—When an alarm occurs, “ALM” blinks in the upper left hand corner ofthe HOME screen. The nature of the alarm can be discovered by pressing<ESC> from the HOME screen (see Alarms, page 17, and Troubleshooting, page19).
2. Keypad Functions
2.1Left Arrow—The LEFT ARROW can be used to correct typing errors when datais being entered or changed. It acts as a backspace or delete key.
During calibration, it can be used to return to previous screens in the sequence ifyou wish to re-run the calibration.
It is also used from the HOME screen to view the alarm history.
2.2 Up and Down Arrows—From HOME screen, can be used to change screencontrast.
2.3 Escape and Enter—You can escape to the previous screen or abort thecalibration sequence by pressing the <ESC> key.
While viewing a System Value, press <ENT> to access the screen to change that value.After entering a new System Value, press <ENT> to accept the new value.
3. User Identification—To change System Values or to calibrate the instrument, afour-digit USER ID is required.
For security, a MASTER ID, different from the USER ID, is required to view orchange the USER ID.
31 cyanowatch REV 1.3
Once an ID has been entered, if the keypad is not used for 15 minutes, the unit willautomatically return to the HOME screen. The ID will have to be entered againbefore the unit values can be changed or calibration can be performed.
4. Fluorescence Display—After the unit is powered-up or after calibration, thefluorescence displayed will not react immediately, but will respond after a delay ofabout 10 seconds.
5. LCD Contrast—The contrast of the Liquid Crystal Display can be adjusted on anyscreen (except during calibration) by pressing the UP and DOWN ARROWS.

32 cyanowatch REV 1.3
APPENDIX DScreens Flow ChartSystems Values. From the HOME screen, press key to view value. To change value, press<ENT> while viewing, input ID, enter new value, and press <ENT> again. Press HOMEscreen.
Home Screen showsfluorescence signaland whether datalogger and alarms areactive.
Relates the value ofthe tracer standard toa fluorescencemeasurement.
Backgroundfluorescence forsystem.
Set the fluorescencevalue that onceexceeded will set theHigh Signal Alarm
Output can be set tocorrespond to a certainfluorescence signal.
View alarms triggeredsince last reset.
If alarm is triggered,shows which alarm(s).
XXXCyanowatch
Cal Soln value:XXX.XXX
Background ValueXX.X
4mA output:XXX.XXX
20mA output:XXX.XXX
S-H N-F
N-F
TURNER DESIGNS6600XBL 1.0 0302
Raw: XXX.XXFS%: XX
1: Test RlyA: ON2: Test RlyB: OFF
1: 4mA XXX2: 20mA XXXX
Input MASTER ID:
User ID:XXXX
XXXXNew:
0
1
2
3
4
←
5
Θ
ENT
ENT
ENT
HOME
ESC
Diagnostic Screens. Toaccess unit's diagnosticscreens, from HOME press:
To view or change User ID,Master ID is required:
Blank: XX.XCal std: XXX.X
ENT
Oper: XXX HrsLamp ON Flow ONENT
High Sig Alarm:XXX.XXX
ENT

33 cyanowatch REV 1.3
Screens Flow Chart (Con’t)From the HOME screen, press <>, <>, or <*>to access the following functions. Forexample, to change the clock settings or alarm functions, first press <>, then the numberof the function to be changed. Key in the new value and press <ENT>, then <ESC> toreturn to the clock menu.Time*, Date*, & Alarm Screens Datalogger Screens
<0> to 02/21/99<7> 07:58:30AM
Hour: 7New:
AM/PM: PM<ENT> to toggle
Min: 0New:
Month: 2New:
Date: 0New:
Year: 02New:
AC Cycle Time: Off<ENT> to toggle
AC Limit Time:0%<ENT> to toggle
0
1
2
3
4
5
6
7
Datalogger:<0> - <3>
Status: Stop<ENT> to toggle
*Interval: 1min<ENT> to toggle
Download data:5x <8> to start
Erase data:5x <9> to start
0
1
2
3
*Download data logger beforechanging!
Changing Calibration Solution ValueFrom the HOME screen:
0 Cal Solu Value100
100New: 20
ENTPlease input ID:
XXXX
ENT
ESC

34 cyanowatch REV 1.3
Screens Flow Chart (Con’t): Calibration ScreensClean the flowcell before calibrating.PressKey
See Screen
HOME XXXCyanowatch
1. From the HOME screen, press <ENT>.
ENT 1. Calib 2. DataCal XX Days Ago
2. Press <2> to view raw data output for blank and standardas set during current calibration, OR, press <1> to begincalibration sequence.
2 Blank: XX.XCal std: XXX.X
1 Please input ID: 3. If requested, key in ID and press <ENT>. If notrequested, go to step 4.
ENT CALIBRATE SYSTEM<1> To Start
4. Press <1> to begin.
1 BLANKSOLUTION
5. Close the valve to stop sample flow by moving lever tothe horizontal position. Inject 120 ml of blank solution (flushwith 60 ml, then allow portion of second 60 ml to remain inflowcell). Press <ENT>.
ENT BLANK %:XX
6. If the number shown is less than 25, wait for number tostabilize, then press <0>.
0 BLANK %:XX wait
7. After WAIT command disappears, unit will prompt you topress <ENT> to continue.
To continuePress <ENT>
8. Press <ENT>.
ENT CALIBRATIONSOLUTION
9. Inject 120 ml of calibration solution (flush with 60 ml, thenallow portion of second 60 ml to remain in flowcell). Press<ENT>.
ENT CAL SOLUTION %:XX
10. If the number shown is between 1 and 10, wait forreading to stabilize, then press <*>. WAIT command willappear.
* CAL SOLUTION %:XX wait
11. When finished, unit will prompt you to press <ENT> tocontinue.
To continuePress <ENT>
12. Press <ENT>.
ENT Press <1> to EndCalibration
13. Press <1> to accept the new calibration settings. Unitreturns to calibration menu. Open valve to start sample flowby returning lever to the vertical position. Calibration isfinished.

35 cyanowatch REV 1.3
APPENDIX ECyanowatch TROUBLESHOOTING WORKSHEETThe Troubleshooting Worksheet is designed to facilitate diagnostic data collection. Aftercollecting all data on the worksheet, most problems can be solved over the telephone.Refer to the Service Assistance/Returned Goods Section for the appropriate numbers.
Please fill out worksheet completely—All entries are important
GENERAL INFORMATION:Unit Serial No.:(Tag is located beneath sample block.)Field Contact Name:Field Contact Phone:Description of Symptoms:Date/Time Symptoms Started:Describe Any Physical Damage To Unit:Date of Last Calibration:(Press <ENT> from HOME screen to read last calibration date.)
THE HOME SCREEN READS: RFU
If “ALM” is blinking, press<ESC> and record alarms
PHYSICAL INSPECTION:1. Is main power switch on? YES NO2. Can LCD contrast be adjusted using the
UP/DOWN arrows? YES NO
3. Date flowcell was last cleaned:With Acid:With Brush:
4. Turn main power to the instrument off and remove enclosure face being carefulto remove keypad ribbon cable from the circuit board. Tug each wire to theterminal strip to see if it is firmly connected.

36 cyanowatch REV 1.3
[Cyanowatch TROUBLESHOOTING WORKSHEET]
CyanowatchRECORD SYSTEM VALUES
ACCESS KEYS
<HOME> <0>
<HOME> <1>
<HOME> <2>
<HOME> <←>
<HOME> <> <6>
<HOME> <> <7>
<HOME> <*>
<HOME> <*> <ENT>
<HOME> <*> <ENT> <ENT> <1>
<HOME> <*> <ENT> <ENT> <ENT>
<HOME><*><ENT><ENT><ENT><ENT>
SYSTEM VALUE
Cal Soln Value
Background Value
High Signal Alarm
Alarm History(list alarms)
AC Cycle Time
AC On Time
Software Version
Raw (Blank):FS %(Blank):Raw (Cal Std):FS %(Cal Std):
Does AC Relay A & Bgo off/on when <ENT>toggled?
Oper. Hrs:Lamp:Flow:
Blank:Cal std:
VALUE
_______________

37 cyanowatch REV 1.3
Appendix F: FIGURES Figure 3. Cyanowatch Inlet Plumbing

38 cyanowatch REV 1.3
Figure 4. Cyanowatch Outlet Plumbing

39 cyanowatch REV 1.3
Figure 5. Cyanowatch - Front View
Dimensions are in inches

40 cyanowatch REV 1.3
Figure 6. Cyanowatch - Front View-External

41 cyanowatch REV 1.3
Definitions:
1. LCD Digital Display—This liquid crystal display (LCD) shows the screens and continuouslydisplays the HOME screen when values are not being entered or viewed.
Except during calibration, the contrast of the LCD can be adjusted on any screen by pressingthe UP or DOWN ARROW.
2. Keypad—The keypad is used to enter new unit values and to move between screens. Once the User or Master Identification has been entered, if the keypad is not used for 15
minutes, the unit will automatically return to the HOME screen.
3. Main Power Switch—This is the main power switch for the entire unit. When ON, the LCDwill illuminate.
4. AC Power Circuit Breakers—There are two 3.15 amp circuit fuses located inside the lowerenclosure. Two spare fuses are provided within the instrument enclosure.
5. Inlet Line Shut-off Valve—This valve is used to direct the sample flow to the unit. Whenthe handle is vertical, the valve is open and sample flows into the unit. When the handle ishorizontal, sample flow is stopped, permitting calibration solutions to be injected into the unitvia the Luer-lock injection port.
6. Luer-lock Injection Port—During instrument calibration, standard and blank solutions areinjected into the unit using a syringe at the Luer-lock connection adjacent the valve. Theunit is calibrated using a secondary standard dilution and a blank solution (distilled water).
7. Clean-out Cap—This cap permits access to the flowcell for cleaning with a brush whenflushing with acid alone is not effective
8. Sample In—This is where the sample intake line is attached, to allow sample to flowthrough the unit.
9. Sample Out—The sample exhaust line attaches here. There MUST be a valve at this pointif there is backpressure on the line, which is open during normal operation. If there is backpressure on the line, close the valve during calibration; be aware that some solution willflush to the floor.
10. Sample Block—This houses the flowcell and optical filters. To change the flowcell or filters,the Sample Block must be replaced.
11.Power Terminal Strip—Located behind the bottom enclosure front panel. Power, AC out,flow switch, and 4-20 mA chart recorder connections are made on this strip (see Figure 4,page 37). Electrical connections should be made only by trained personnel.

42 cyanowatch REV 1.3
APPENDIX G
CYANOBACTERIA DETECTION IN WATER USING IN VIVO FLUOROMETRY
Overview
Cyanobacteria, a.k.a. blue-green algae, are common forms of photosynthetic bacteria present inmost freshwater and marine systems. The monitoring of cyanobacteria is of growing interest ina number of research and monitoring fields and of particular interest is the monitoring ofcyanobacteria as a public health risk. As the rates of eutrophication accelerate due to humanimpacts on aquatic ecosystems, algal blooms are becoming a more common problem. In thecase of cyanobacterial blooms, some species can produce toxins generally referred to ascyanotoxins that can cause health risks to humans and animals. The real-time monitoring ofcyanobacteria through fluorometry can serve as an early warning system for potentiallyhazardous conditions. In addition to potential toxin production, cyanobacteria blooms can alsoresult in water with an unpleasant appearance, and in the case of drinking water, an unpleasanttaste and odor. These problems adversely affect water quality and diminish the water'srecreational utility. Also of concern are high cell concentrations causing an increase in filter runtimes in drinking water plants. Thus, monitoring the cyanobacteria population and distribution inlakes, reservoirs and coastal areas is extremely important for resource protection, public healthand safety, and overall economics.
Turner Designs has produced a line of solid-state fluorescence instruments that can be used todetect the in vivo fluorescence (IVF) of cyanobacterial pigments in natural waters. Thistechnology represents a new practical and robust tool for researchers and water resourcemanagers to improve monitoring systems and improve water quality, in order to prevent theoccurrence of potentially hazardous conditions.
Fluorescent PigmentsTurner Designs fluorescence instrumentation has set the standard for the monitoring ofchlorophyll a (the primary photosynthetic pigment) levels in water. Chlorophyll a detectionsupplies data on the total algal biomass (all photosynthetic organisms contain the chlorophyll apigment). However, different types of phytoplankton and cyanobacteria have unique sets ofaccessory pigments that serve a variety of roles for the organism. These accessory pigmentsare often unique to a class of algae or cyanobacteria and can be used to identify a specificgroup. Cyanobacteria contain accessory pigments from the phycobiliprotein family. Theprimary phycobilin pigments are phycocyanin (PC) and phycoerythrin (PE) that happen to havestrong fluorescent signatures that do not interfere with the fluorescence of the chlorophylls (SeeAppendix A, Figures 1-3). This allows for the in vivo detection of cyanobacteria withoutinterference from other groups of algae. PC is the predominant phycobilin in freshwaterenvironments while PE is the predominant pigment in marine environments. When purchasingan instrument a decision must be made as to which phycobilin pigment the instrument will beconfigured for.
43 cyanowatch REV 1.3
Methods of Cyanobacteria Detection
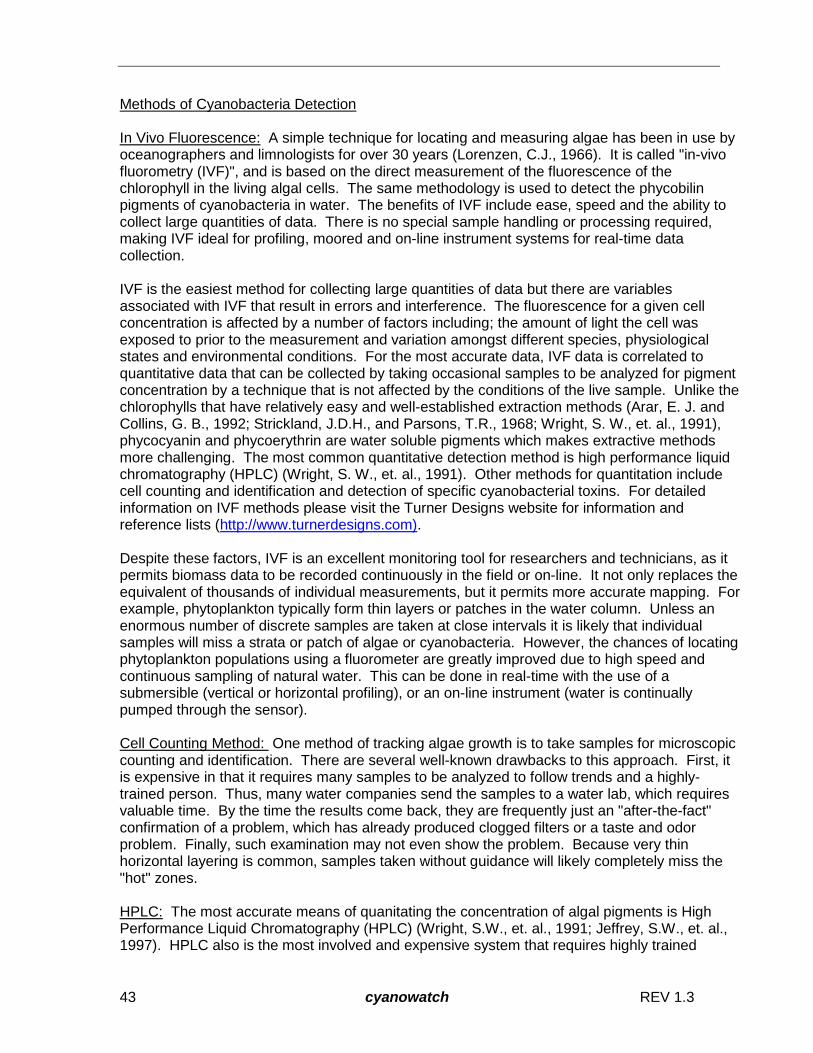
In Vivo Fluorescence: A simple technique for locating and measuring algae has been in use byoceanographers and limnologists for over 30 years (Lorenzen, C.J., 1966). It is called "in-vivofluorometry (IVF)", and is based on the direct measurement of the fluorescence of thechlorophyll in the living algal cells. The same methodology is used to detect the phycobilinpigments of cyanobacteria in water. The benefits of IVF include ease, speed and the ability tocollect large quantities of data. There is no special sample handling or processing required,making IVF ideal for profiling, moored and on-line instrument systems for real-time datacollection.
IVF is the easiest method for collecting large quantities of data but there are variablesassociated with IVF that result in errors and interference. The fluorescence for a given cellconcentration is affected by a number of factors including; the amount of light the cell wasexposed to prior to the measurement and variation amongst different species, physiologicalstates and environmental conditions. For the most accurate data, IVF data is correlated toquantitative data that can be collected by taking occasional samples to be analyzed for pigmentconcentration by a technique that is not affected by the conditions of the live sample. Unlike thechlorophylls that have relatively easy and well-established extraction methods (Arar, E. J. andCollins, G. B., 1992; Strickland, J.D.H., and Parsons, T.R., 1968; Wright, S. W., et. al., 1991),phycocyanin and phycoerythrin are water soluble pigments which makes extractive methodsmore challenging. The most common quantitative detection method is high performance liquidchromatography (HPLC) (Wright, S. W., et. al., 1991). Other methods for quantitation includecell counting and identification and detection of specific cyanobacterial toxins. For detailedinformation on IVF methods please visit the Turner Designs website for information andreference lists (http://www.turnerdesigns.com).
Despite these factors, IVF is an excellent monitoring tool for researchers and technicians, as itpermits biomass data to be recorded continuously in the field or on-line. It not only replaces theequivalent of thousands of individual measurements, but it permits more accurate mapping. Forexample, phytoplankton typically form thin layers or patches in the water column. Unless anenormous number of discrete samples are taken at close intervals it is likely that individualsamples will miss a strata or patch of algae or cyanobacteria. However, the chances of locatingphytoplankton populations using a fluorometer are greatly improved due to high speed andcontinuous sampling of natural water. This can be done in real-time with the use of asubmersible (vertical or horizontal profiling), or an on-line instrument (water is continuallypumped through the sensor).
Cell Counting Method: One method of tracking algae growth is to take samples for microscopiccounting and identification. There are several well-known drawbacks to this approach. First, itis expensive in that it requires many samples to be analyzed to follow trends and a highly-trained person. Thus, many water companies send the samples to a water lab, which requiresvaluable time. By the time the results come back, they are frequently just an "after-the-fact"confirmation of a problem, which has already produced clogged filters or a taste and odorproblem. Finally, such examination may not even show the problem. Because very thinhorizontal layering is common, samples taken without guidance will likely completely miss the"hot" zones.
HPLC: The most accurate means of quanitating the concentration of algal pigments is HighPerformance Liquid Chromatography (HPLC) (Wright, S.W., et. al., 1991; Jeffrey, S.W., et. al.,1997). HPLC also is the most involved and expensive system that requires highly trained
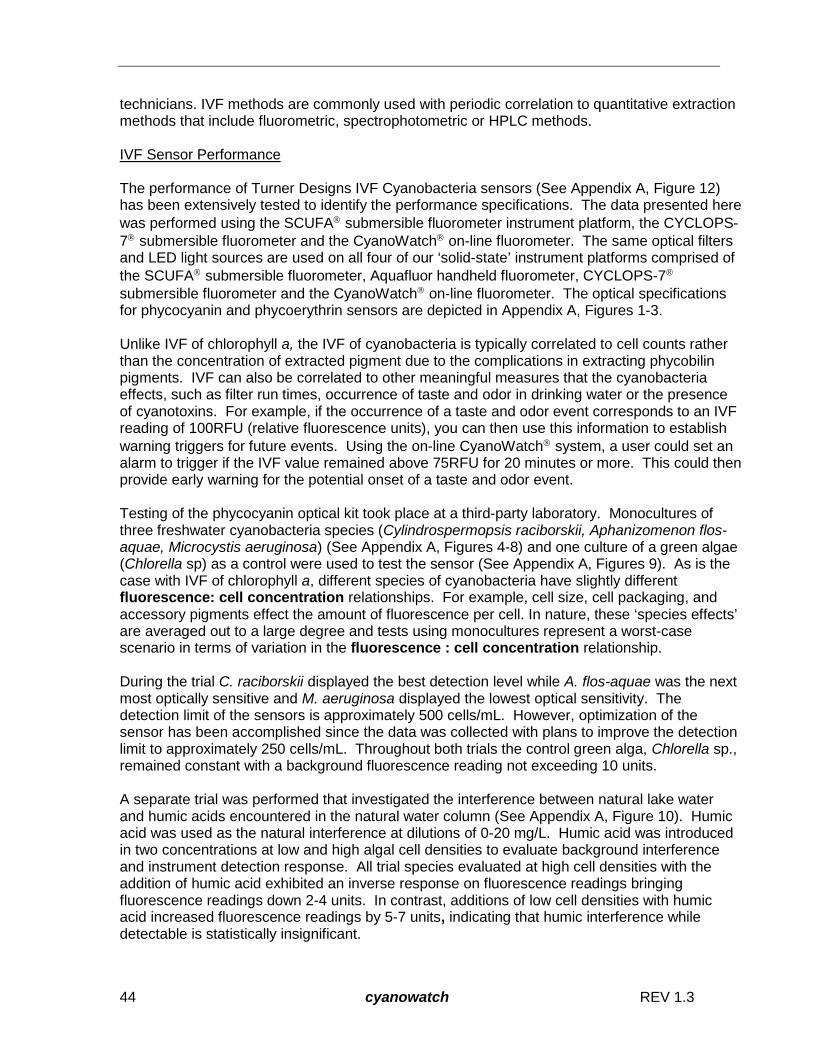
44 cyanowatch REV 1.3
technicians. IVF methods are commonly used with periodic correlation to quantitative extractionmethods that include fluorometric, spectrophotometric or HPLC methods.
IVF Sensor Performance
The performance of Turner Designs IVF Cyanobacteria sensors (See Appendix A, Figure 12)has been extensively tested to identify the performance specifications. The data presented herewas performed using the SCUFA submersible fluorometer instrument platform, the CYCLOPS-7 submersible fluorometer and the CyanoWatch on-line fluorometer. The same optical filtersand LED light sources are used on all four of our ‘solid-state’ instrument platforms comprised ofthe SCUFA submersible fluorometer, Aquafluor handheld fluorometer, CYCLOPS-7
submersible fluorometer and the CyanoWatch on-line fluorometer. The optical specificationsfor phycocyanin and phycoerythrin sensors are depicted in Appendix A, Figures 1-3.
Unlike IVF of chlorophyll a, the IVF of cyanobacteria is typically correlated to cell counts ratherthan the concentration of extracted pigment due to the complications in extracting phycobilinpigments. IVF can also be correlated to other meaningful measures that the cyanobacteriaeffects, such as filter run times, occurrence of taste and odor in drinking water or the presenceof cyanotoxins. For example, if the occurrence of a taste and odor event corresponds to an IVFreading of 100RFU (relative fluorescence units), you can then use this information to establishwarning triggers for future events. Using the on-line CyanoWatch system, a user could set analarm to trigger if the IVF value remained above 75RFU for 20 minutes or more. This could thenprovide early warning for the potential onset of a taste and odor event.
Testing of the phycocyanin optical kit took place at a third-party laboratory. Monocultures ofthree freshwater cyanobacteria species (Cylindrospermopsis raciborskii, Aphanizomenon flos-aquae, Microcystis aeruginosa) (See Appendix A, Figures 4-8) and one culture of a green algae(Chlorella sp) as a control were used to test the sensor (See Appendix A, Figures 9). As is thecase with IVF of chlorophyll a, different species of cyanobacteria have slightly differentfluorescence: cell concentration relationships. For example, cell size, cell packaging, andaccessory pigments effect the amount of fluorescence per cell. In nature, these ‘species effects’are averaged out to a large degree and tests using monocultures represent a worst-casescenario in terms of variation in the fluorescence : cell concentration relationship.
During the trial C. raciborskii displayed the best detection level while A. flos-aquae was the nextmost optically sensitive and M. aeruginosa displayed the lowest optical sensitivity. Thedetection limit of the sensors is approximately 500 cells/mL. However, optimization of thesensor has been accomplished since the data was collected with plans to improve the detectionlimit to approximately 250 cells/mL. Throughout both trials the control green alga, Chlorella sp.,remained constant with a background fluorescence reading not exceeding 10 units.
A separate trial was performed that investigated the interference between natural lake waterand humic acids encountered in the natural water column (See Appendix A, Figure 10). Humicacid was used as the natural interference at dilutions of 0-20 mg/L. Humic acid was introducedin two concentrations at low and high algal cell densities to evaluate background interferenceand instrument detection response. All trial species evaluated at high cell densities with theaddition of humic acid exhibited an inverse response on fluorescence readings bringingfluorescence readings down 2-4 units. In contrast, additions of low cell densities with humicacid increased fluorescence readings by 5-7 units, indicating that humic interference whiledetectable is statistically insignificant.

45 cyanowatch REV 1.3
Performance of the phycoerythrin optical kit was conducted on the CYCLOPS-7 submersiblefluorometer instrument platform. Laboratory tests were run using two purified and commerciallyavailable phycoerythrin pigments, B-phycoerythrin and R-phycoerythrin. A combination of thevarious phycoerythrin pigments would be present in natural systems and dilutions of both weretested using the CYCLOPS-7 (See Appendix A, Figure 11). Excellent signal noise and linearityvalues were achieved. Field testing of the phycoerythrin systems is underway and results willbe posted to the Turner Designs website as soon as possible.
ApplicationsCyanobacteria has been found to be a numerically abundant faction of the phytoplanktoncommunity. Their roles in primary production, community structure, and spatial and temporaldistribution are of interest for numerous scientific studies as well as natural water monitoring.Since chlorophyll fluorescence cannot be used to accurately determine cyanobacterialpresence, analyzing phycobilin concentrations is essential for detecting, quantifying, andmonitoring cyanobacterial levels.
• Early Warning of Harmful Algal Blooms• Improve The Quality Of Water Supplied• Taste & Odor• Reservoir Management• Increase Filter-Run Time• Reduce Algaecide Required and Optimize Algaecide Application
Early Warning of Harmful Algal BloomsInterest in cyanobacteria occurrence and toxin production has been growing rapidly in recentyears. Consumer awareness and concern is growing too. Utilities must have reliable data oncyanobacteria and possible toxins from their source water supplies to address these concerns.Taking precautionary measures to avoid potential health risks by cyanotoxins from a HarmfulAlgal Bloom is a responsibility of all agencies or organizations with the mandate to monitor andprotect water resources or recreational waters. IVF of cyanobacterial pigments represents animportant new technology that should not be overlooked. IVF will become a key parameter thatwill improve monitoring systems to provide data on cyanobacteria biomass.
Many species of cyanobacteria produce toxins generally referred to as cyanotoxins. In acyanobacteria bloom, these toxins can cause health risks to humans and animals and the real-time monitoring of cyanobacteria can serve as an early warning system for potentiallyhazardous conditions. Drinking water sources, recreational lakes, ponds and coastal areas areall susceptible to the impacts of cyanobacterial blooms.
The US EPA has listed cyanobacteria to their Water Contaminant Candidate List(http://www.epa.gov/safewater/ccl/cclfs.html) and currently list cyanobacteria as an unregulatedwater contaminant. The EPA Unregulated Contaminant Monitoring Rule (UCMR,http://www.epa.gov/safewater/ucmr.html) may be revised in the future to include a twelve (12)month monitoring program for many drinking water treatment utilities for cyanotoxins and/orcyanobacteria. The “Drinking Water Contaminant Candidate List 2: Notice” that was publishedin the Federal Register on April 2, 2004, pages 17406 – 17415, included “Cyanobacteria (blue-green algae), other freshwater algae, and their toxins” in the microbiological contaminantcandidate list. Utilities should prepare well in advance for future monitoring requirements suchas this by monitoring now to develop an occurrence database and assessment.
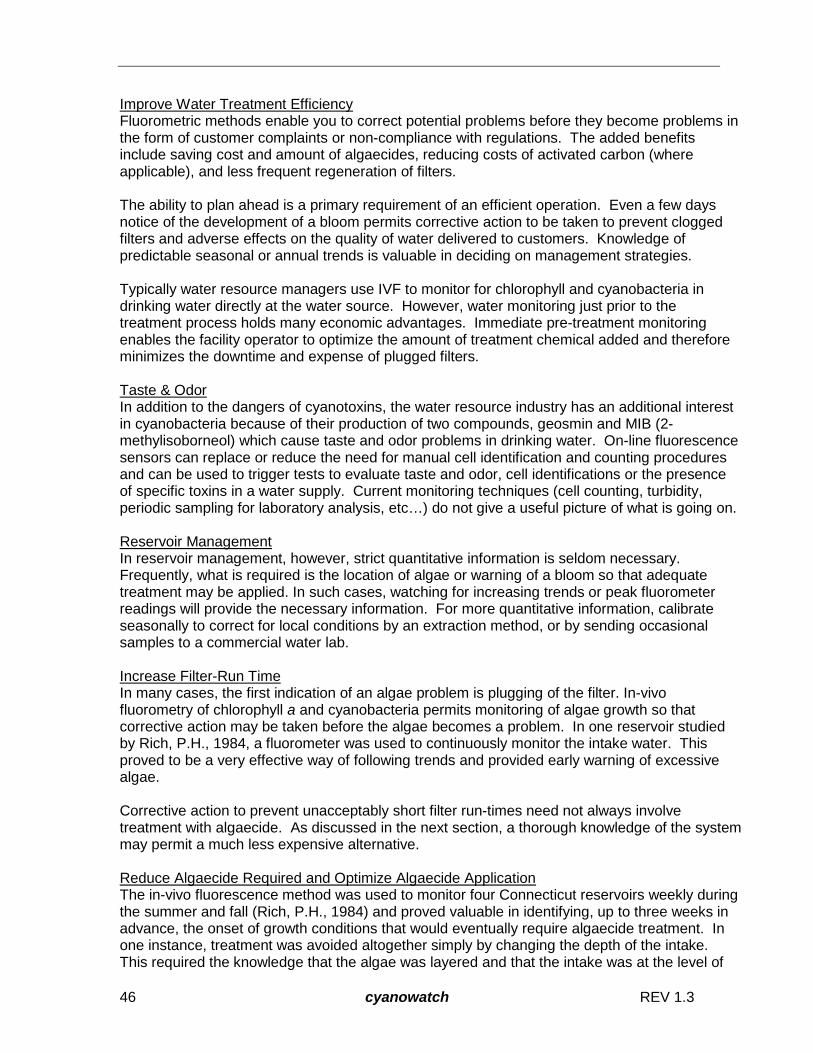
46 cyanowatch REV 1.3
Improve Water Treatment EfficiencyFluorometric methods enable you to correct potential problems before they become problems inthe form of customer complaints or non-compliance with regulations. The added benefitsinclude saving cost and amount of algaecides, reducing costs of activated carbon (whereapplicable), and less frequent regeneration of filters.
The ability to plan ahead is a primary requirement of an efficient operation. Even a few daysnotice of the development of a bloom permits corrective action to be taken to prevent cloggedfilters and adverse effects on the quality of water delivered to customers. Knowledge ofpredictable seasonal or annual trends is valuable in deciding on management strategies.
Typically water resource managers use IVF to monitor for chlorophyll and cyanobacteria indrinking water directly at the water source. However, water monitoring just prior to thetreatment process holds many economic advantages. Immediate pre-treatment monitoringenables the facility operator to optimize the amount of treatment chemical added and thereforeminimizes the downtime and expense of plugged filters.
Taste & OdorIn addition to the dangers of cyanotoxins, the water resource industry has an additional interestin cyanobacteria because of their production of two compounds, geosmin and MIB (2-methylisoborneol) which cause taste and odor problems in drinking water. On-line fluorescencesensors can replace or reduce the need for manual cell identification and counting proceduresand can be used to trigger tests to evaluate taste and odor, cell identifications or the presenceof specific toxins in a water supply. Current monitoring techniques (cell counting, turbidity,periodic sampling for laboratory analysis, etc…) do not give a useful picture of what is going on.
Reservoir ManagementIn reservoir management, however, strict quantitative information is seldom necessary.Frequently, what is required is the location of algae or warning of a bloom so that adequatetreatment may be applied. In such cases, watching for increasing trends or peak fluorometerreadings will provide the necessary information. For more quantitative information, calibrateseasonally to correct for local conditions by an extraction method, or by sending occasionalsamples to a commercial water lab.
Increase Filter-Run TimeIn many cases, the first indication of an algae problem is plugging of the filter. In-vivofluorometry of chlorophyll a and cyanobacteria permits monitoring of algae growth so thatcorrective action may be taken before the algae becomes a problem. In one reservoir studiedby Rich, P.H., 1984, a fluorometer was used to continuously monitor the intake water. Thisproved to be a very effective way of following trends and provided early warning of excessivealgae.
Corrective action to prevent unacceptably short filter run-times need not always involvetreatment with algaecide. As discussed in the next section, a thorough knowledge of the systemmay permit a much less expensive alternative.
Reduce Algaecide Required and Optimize Algaecide ApplicationThe in-vivo fluorescence method was used to monitor four Connecticut reservoirs weekly duringthe summer and fall (Rich, P.H., 1984) and proved valuable in identifying, up to three weeks inadvance, the onset of growth conditions that would eventually require algaecide treatment. Inone instance, treatment was avoided altogether simply by changing the depth of the intake.This required the knowledge that the algae was layered and that the intake was at the level of

47 cyanowatch REV 1.3
the layer. Since only small changes are required, even systems that are not designed for it caneasily be rigged with siphons to vary intake depth.
In-vivo fluorescence provides a means of monitoring the effectiveness of algaecide treatment.Given a stable stratified condition, experiments can be run in a remote section of the reservoir todetermine the optimum quantity and means of application. This can markedly reduce theannual cost of algaecide.
Failure to recognize that the algae is layered deep below the surface may result in the use ofinsufficient algaecide at the surface. A killing concentration does not reach the layer, and thetreatment is wasted. However, if it is known that the algae is concentrated in a thin layer aspecific distance below the surface (8 meters for example), then surface application is probablynot the best course. Why add excessive algaecide to produce a killing concentration in theenormous volume of water above the "target" layer?
Conclusions and Contact InformationCyanobacteria monitoring with IVF sensors represents an important development in watermonitoring technology. Routine monitoring labor can be reduced significantly by replacing theneed for regular cell counting and cell identification with IVF. In addition, the ability to monitor inreal-time, and the accuracy and reliability of fluorescence sensors, will significantly improve theefficiency of the monitoring system. Dramatic savings in treatment chemical use, filter run timesand an overall improvement in water quality are very attainable results through theimplementation of fluorescence sensors. Finally, real-time monitoring of cyanobacteria canprovide a valuable early-warning system to potentially hazardous conditions. Increasingfluorescence signals or the attainment of a threshold concentration can be used to trigger morespecific and expensive testing that are able to identify specific species or toxins of concern.
Turner Designs is committed to developing more affordable, easy-to-use and accuratefluorescence sensors for environmental applications. In addition, we will continually work withpartners and customers to make as much real-world data available to the public on theeffectiveness and accuracy of our sensors for the applications described above. Please do nothesitate to contact us or visit our website for the most recent field data and user information forall of our cyanobacteria sensors.
Also, if you have any questions or comments regarding this paper or any Turner Designsproduct or document please do not hesitate to contact us.
Website: www.turnerdesigns.com
Sales Support:E: [email protected]: Within the US 1(877) 316-8049 ext. 117
Outside the US 1(408) 749-0994F: 1(408) 749-0998
Technical Support:E: [email protected]: Within the US 1(877) 316-8049 ext. 116
Outside the US 1(408) 749-0994F: 1(408) 749-0998

48 cyanowatch REV 1.3
APPENDIX A – Figures & Graphs
Figure 1: Fluorometer configuration for detection of chlorophyll a
Figure 2: Fluorometer configuration for detection of phycocyanin
Figure 3: Fluorometer configuration for detection of phycoerythrin
570 nm 700 nm
PEExcitation
Filter
PEEmission
Filter
Algae Sample
Photodiode
ToReadout
GreenYellow RedOrang
525nmLED
500 nm
GreenYellow
PCExcitation
Filter
PCEmission
Filter
Photodiode
500 nm 600 nm
Algae Sample
ToReadout
RedOrang
590nmLED
650 nm 700 nm
800 nm
Violet BlueGreen
Yellow Oran Red
LED
Chl aExcitation
Filter
Chl aEmission
Filter
Photodiode
400 nm 600 nm
Algae Sample
ToReadout
460 nm 685 nm
595 nm
530 nm
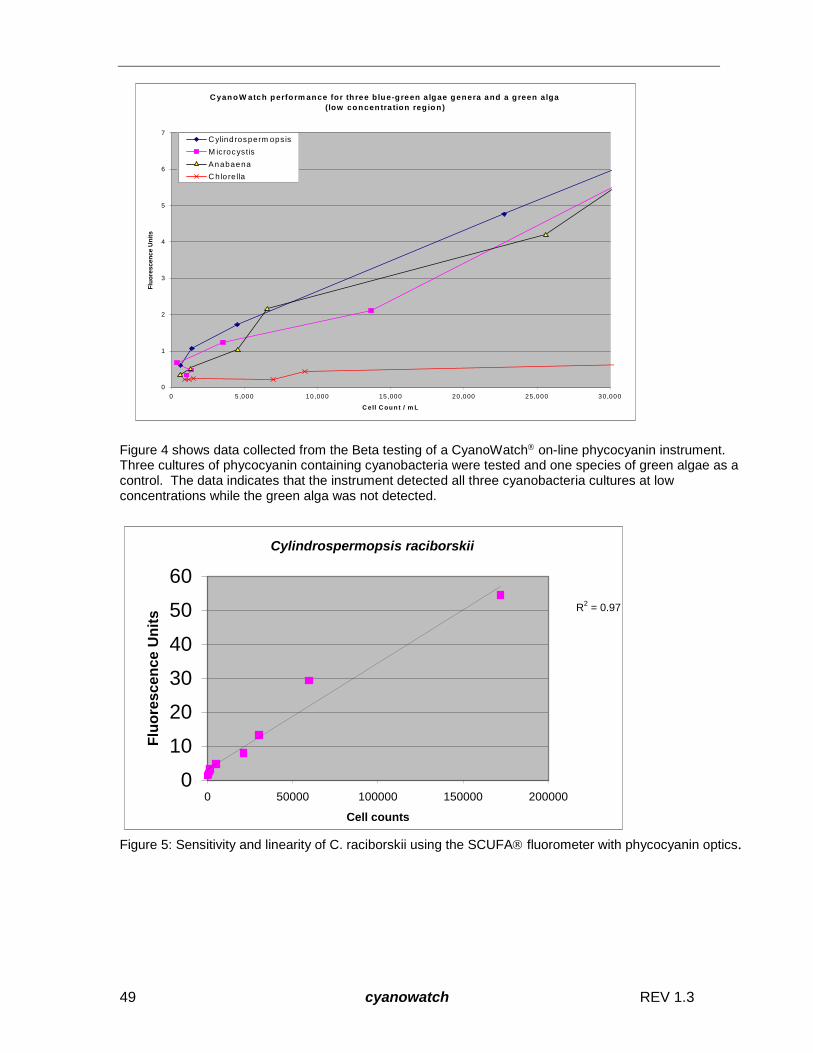
49 cyanowatch REV 1.3
Figure 4 shows data collected from the Beta testing of a CyanoWatch on-line phycocyanin instrument.Three cultures of phycocyanin containing cyanobacteria were tested and one species of green algae as acontrol. The data indicates that the instrument detected all three cyanobacteria cultures at lowconcentrations while the green alga was not detected.
Cylindrospermopsis raciborskii
R2 = 0.97
0
10
20
30
40
50
60
0 50000 100000 150000 200000
Cell counts
Flu
ore
scen
ce
Un
its
Figure 5: Sensitivity and linearity of C. raciborskii using the SCUFA fluorometer with phycocyanin optics.
C yanoW atch perform ance for th ree blue-green a lgae genera and a green alga
(low concentra tion reg ion )
0
1
2
3
4
5
6
7
0 5,000 10,000 15,000 20,000 25,000 30,000
C ell C ou n t / m L
Flu
ore
scen
ce
Un
its
C ylind rosperm opsis
M icrocystis
Anabaena
C hlo re lla

50 cyanowatch REV 1.3
Cylindrospermopsis raciborskii
R2 = 0.90
0
1
2
3
4
5
6
0 2000 4000 6000
Cells per mL
Flu
ore
scen
ce
Un
its
Figure 6: Sensitivity and linearity of C. raciborskii at low cell concentrations using the SCUFA
fluorometer with phycocyanin optics.
Anabaena flos-aquae
R2 = 0.96
0
10
20
30
40
50
0 10000 20000 30000 40000 50000 60000
Cells per mL
Flu
ore
sc
en
ce
Un
its
Figure 7: Sensitivity and linearity of A. flos-aquae using the SCUFA fluorometer with phycocyanin optics.
Microcycystis aeruginosa
12/15/03
R2 = 0.99
05
10152025303540
0 20000 40000 60000 80000 100000
Cells per mL
Flu
ore
sc
en
ce
Un
its
Figure 8: Sensitivity and linearity of M. aeruginosa using the SCUFA fluorometer with phycocyanin
optics.

51 cyanowatch REV 1.3
Figure 9: Chlorella sp. (a green alga containing no phycobilin pigments) sensitivity of the SCUFA
fluorometer with phycocyanin optics. The graph indicates that algal groups not containing phycocyanin donot interfere with the fluorescence readings.
Figure 10. Graph of simulation of natural lake water versus humic interference in opticaldetection of the SCUFA fluorometer with phycocyanin optics. Even at high humicconcentrations there was not a significant fluorescence signal indicating that the optics are notsusceptible to humic interference.
Figure 11. A combination of the various phycoerythrin pigments would be present in naturalsystems and dilutions of both were tested using the CYCLOPS-7.
Phycoerythrin(C7 SNXX)
0
500
1000
1500
2000
2500
3000
3500
0 20 40 60 80 100 120
pigment concentration (ug/L)
RF
U(m
V)
X1
0g
ain
B-Phycoerythrin
R-Phycoerythrin
Linear (R-Phycoerythrin)
Linear (B-Phycoerythrin)
Chlorella sp.
0
2
4
6
8
10
12
14
16
014
235
515
3229
8244
96
1065
0
3372
5
5715
5
7506
0
Cell Counts
Flu
ore
scen
ce
Un
its
Humic Acid in Filtered Lake Water
0
5
10
15
20
0 2 5 10 15 20
Humic Concentration mg/L
Scu
faF
lore
scen
ce
read
ing

52 cyanowatch REV 1.3
References
Arar, E. J., and Collins, G. B., METHOD 445.0, IN VITRO DETERMINATION OFCHLOROPHYLL a and PHEOPHYTIN a IN MARINE AND FRESHWATERPHYTOPLANKTON BY FLUORESCENCE, In: Methods for the Determination ofChemical Substances in Marine and Estuarine Environmental Samples. EnvironmentalMonitoring Systems Laboratory, Office of Research and Development, U.S. E.P.A.,Cincinnati, Ohio (EPA/600/R-92/121, Nov. 1992).
Jeffrey, S.W., Mantoura, R.F.C., and Wright, S.W. 1997. Phytoplankton pigments inoceanography: Guidelines to modern methods. UNESCO Publishing, Paris, 661 pp.
Lorenzen, C.J. 1966. A METHOD FOR THE CONTINUOUS MEASUREMENT OF IN-VIVO CHLOROPHYLL CONCENTRATION. Deep Sea Research, 13, 223-227.
Rich, P.H. 1984. THE DEVELOPMENT OF A CHLOROPHYLL MONITORINGPROGRAM FOR WATER SUPPLY RESERVOIRS USING IN-VIVO FLUORIMETRY.Institute of Water Resources, The University of Connecticut. Prepared for the UnitedStates Department of the Interior, Research Project Technical Completion Report G832-05.
Strickland, J.D.H., and Parsons, T.R. 1968. A practical handbook of seawater analysis.Fish. Res. Board Can. Bull. 167:311 p.
Wright, S. W., Jeffrey, S. W., Mantoura, R. F. C., Llewellyn, C. A., BjØrnland, T.,Repeta,D., and Welschmeyer, N. 1991. Improved HPLC method for the analysis of chlorophyllsand carotenoids from marine phytoplankton. Mar. Ecol. Prog. Ser. 77:183-96.