operations and maintenance practices and their impact on
TRANSCRIPT

1
The impact of operations and maintenance practices on power plant
performance
Dr Shyong Wai Foon
Assistant General Manager, (Strategic Management) Strategic Management & Organizational
Development, Distribution Division, Tenaga Nasional Berhad
Tel: +60379679385, Fax: +60379600340; Email: [email protected]
and
Professor Milé Terziovski, PhD
Curtin Graduate School of Business, Curtin University
Tel: 61 8 92667900; Fax: 61 8 92663368; e-mail: [email protected]
Abstract
The aim of the study was to examine the impact of Operations and Maintenance (O&M)
practices, individually and collectively, on power plant performance. Data were collected from
more than 100 power plants in Australia and Malaysia. The reliability and validity (content,
construct, and criterion) of the practice and performance measures were evaluated. Our study
showed that the relationship between O&M practices and plant performance is significant and
positive in a cross-sectional sense. Both people-oriented “soft” as well as technically-oriented
“hard” practices were found to be positive and significant predictors of plant performance. This
is consistent with literature on socio-technical systems theory that both “soft” and “hard”
practices are required to complement each other to produce and sustain high performance.
Among the practices, executive commitment and TPM1-orientation are the strongest significant
predictors of plant performance. Our findings also highlight the impact of maintenance practices
on plant performance compared to other practices such as long-term planning, customer focus,
knowledge management, and employee involvement. Based on our study we conclude that Total
Quality Management (TQM) and maintenance philosophies are sources of sustainable
competitive advantage in the power generation sector. The implication of our research findings is
that plant managers need to allocate more “softer” resources to the operations and maintenance
function if they expect to increase the impact on plant availability.
Keywords: TQM, Quality Management, TPM, Operations, Maintenance, power plant
1 TPM stands for Total Productive Maintenance

2
Introduction
The purpose of the restructuring of the electricity supply industry (ESI) was to increase delivery
efficiency through market competition (Electricity Supply Association of Australia Limited,
2001; Loredo & Suarez, 2000; Yokell & Violette, 1988; Zhang et al., 2004). Restructuring has
also introduced new risks for power plant operators. At the operation level, cost, plant reliability
and availability, safety, and environmental compliance are important priorities (Draper Jr, 1998;
Matusheski, 2000). Plant reliability and availability underpin power plant business performance.
Failure of plants to attain high levels of availability can result in significant risks to the plant
operators financially. For example, a study conducted recently on one of the thermal power
plants in Malaysia found that it had cost its parent company losses amounting to RM175m
(AUD$58m) in lost availability over a period of 2.5 years. It was determined that these losses
were a result of poor plant availability. To achieve this objective, relevant plant level O&M
activities should intensify to ensure high plant availability and utilization levels are achieved
(Davis, 1995; Desirey, 2000; Moubray, 1997; Swanson, 2001; Tsuchiya, 1992).
However, researchers and industry practitioners have often overlooked the role of equipment
effectiveness in operational performance (Fredendall et al., 1997; Nakajima, 1989; Schonberger,
1986). Roth and Miller (1992) asserted that maintenance management might well be the biggest
challenge facing power plants in a fiercely competitive market. In order to sustain high plant
availability and at the same time meet the cost and regulatory requirements, we contend that
appropriate maintenance strategies need to be integrated with other management functions
(Nakajima, 1989).
Contributing to this gap in knowledge can assist researchers and practitioners in understanding
the role of practices in determining power plant performance as there is now considerable
pressure on power plants managers to perform in the competitive deregulated environment
(David, 1993; Lindsay & Peter, 1998). Consequent to the above, we have articulated the research
question: Which operations and maintenance practices are critical predictors of plant
performance? Answers to the research question would provide a deeper understanding of best
predictors of plant performance. This would assist managers to allocate limited resources to
those areas, which have the most significant contribution to plant performance.

3
Literature review and Theoretical Framework
We reviewed the literature on TQM and TPM to identify the key variables that should be
included in the theoretical framework. The studies that we draw upon for this work were carried
out in the past decade. The relationship between total quality management practices and
organizational performance has been explored in many empirical studies (Ahire et al., 1996;
Black & Porter, 1996; Flynn et al., 1994; Powell, 1995)). Samson and Terziovski (1999)
investigated the relationship using the Malcolm Baldrige National Quality Award (MBNQA)
criteria in a large cross-sectional examination of over 1000 manufacturing companies in
Australia and New Zealand.
The study found that the seven constructs in the MBNQA criteria were valid and reliable
measures of the TQM concept. These constructs are leadership, people, customer focus, strategic
planning, information and analysis, process management, and performance. Samson and
Terziovski also found that organizational performance is more strongly and significantly
predicted by the softer TQM elements of leadership, customer focus, and human resource
management. The other three factors (planning, information and analysis, and process
management) were found to be insignificant.
This finding is consistent with the conclusion in a study by Ahire et al. (1996) who found that
product quality is strongly linked with human resource management, and Powell (1995), who
found that competitive advantage is more strongly related to human factors such as executive
commitment, open organization, and employee empowerment and less dependable on the
techniques and tools of TQM. Other researchers and practitioners have come to realise the
importance of maintenance strategy to increase the availability of existing equipment and reduce
the need for additional capital investment.
Most of the studies in this area involve the study of the impact of TPM and its implementation on
manufacturing performance (Bamber et al., 1999; Brah & Chong, 2004; Chan et al., 2005;
Cooke, 2000; Ireland & Dale, 2001; McKone & Weiss, 1998a). Some of these studies were
found to have little or no effect on performance (see Cigolini & Turco, 1997), or that the efficacy
of the TPM programme has to be implemented together with other quality improvement
programmes like TQM and JIT (McKone et al., 2001). These studies anecdotally claim that an
integrated framework incorporating elements from TQM and TPM can assure successful
implementation of O&M strategy and better plant performance.

4
We limit the operationalization of the TPM construct to maintenance practices such as
prevention maintenance, record keeping, reliability centred maintenance and so on. Other
empirical research has also been carried out where the studies consider more than one of the
three concepts TQM, JIT, and TPM. There is a general agreement in the literature (McKone et
al., 1999) that TQM, JIT, and TPM constitute quality programmes for performance improvement
and are closely interlinked with each other. For example, practices such as committed leadership,
customer focus, use of information, and strategic planning are common to TQM and JIT and to
some extent, TPM.
We argue that the practices identified as comprising TQM, JIT, and TPM can generally be
subdivided into “soft” or people-oriented practices and “hard” or technical-oriented practices. In
our study, we measure both “soft” and “hard” practices together and relate them to plant
performance. On the performance construct, we incorporate both operational as well as
social/regulatory outcomes.
We define “soft” practices as related to leadership, employees, as well as customers. “Hard”
practices, on the other hand, concern the techniques, tools, and processes in the organizations,
which comprise infrastructure components such as planning, use of information, and
maintenance functions. Therefore soft practices are those practices that can lead to the
development of an organizational culture to facilitate high performance. Hard factors are
associated with processes, tools and techniques used by an organization to attain its objectives.
Theoretical Framework and Hypothesis
We acknowledge that there will always be debates about what factors to be included into any
practices framework. In the context of power plant operations, information gathered from the
literature review, and from the work experience of the researchers, we found that practices
relating to total quality and maintenance management are actively implemented in most plants.
This is not surprising since the introduction of the total quality management concept and the
promotion of quality by most governments; quality practices are now widely instituted in most
companies (Powell, 1995).
Therefore, we draw from the total quality management literature in order to ascertain which
factors we should include in the O&M framework. These factors are: committed leadership,
employee involvement, customer focus, strategic planning, knowledge management, and TPM-
orientation. Committed leadership, employee involvement and customer focus all involve the

5
need for people relationships, and therefore are categorized under the people-oriented soft
category.
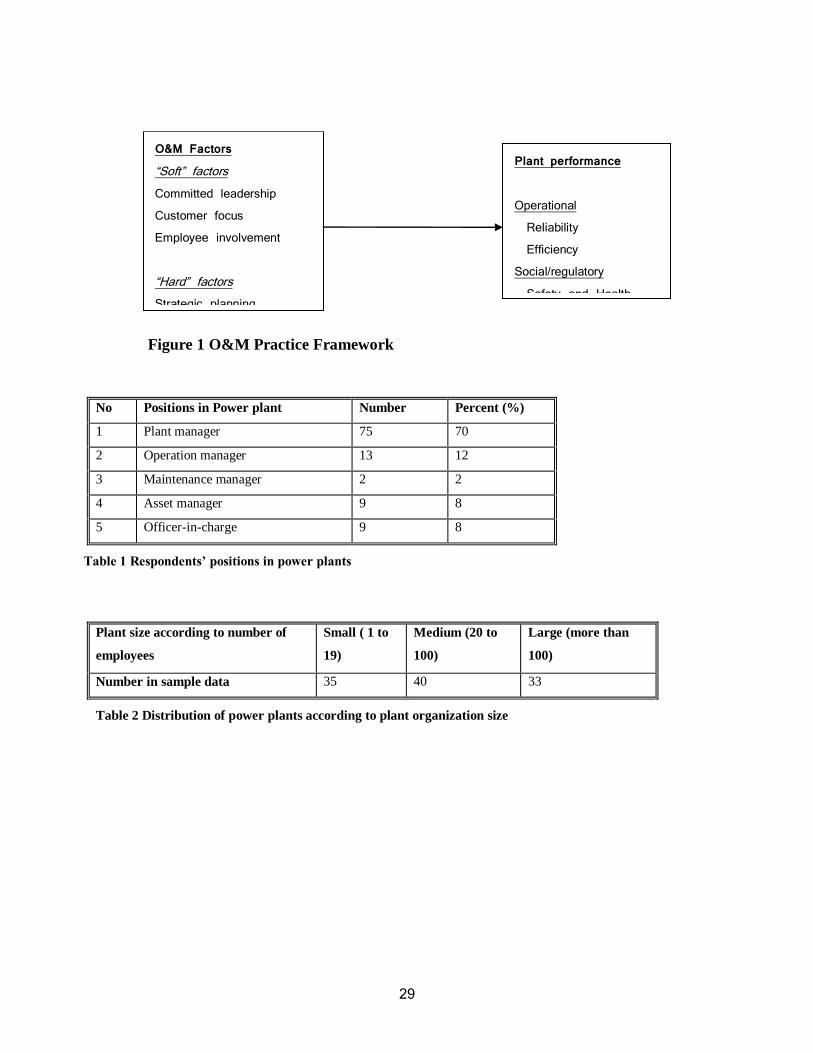
Conversely, the O&M factors of strategic planning, knowledge management, and TPM-
orientation maintenance are more likely to be “mechanistic” or process-based and therefore
categorized under the technically-oriented hard category (Tse et al., 2007). Our empirical work
aims to validate these factors and determine the relationships between these factors and plant
performance. Figure 1 shows the O&M Practice framework.
<<<Insert figure 1 here>>
Definitions
In this section, we define the constructs that we have included in the Operations and
Maintenance Practice Framework (Figure 1).
Committed leadership
This factor is considered as one of the key ‘drivers’ of performance. It examines senior
leadership involvement in setting direction for their power plants and creates a culture focusing
on customers’ requirements (Malcolm Baldrige National Award Criteria, 1994). Leadership also
plays a key role in facilitating innovative changes in the power plant work environment; to create
a safe and conducive work-place; install a management system supporting the plant’s purpose of
high performance (Skinner, 2004) through continual learning, employee development, and close
sensitivity to the local community and natural environment. In our study, the leadership practices
relate to the transformational leadership style (Bass, 1985). The above discussion indicates that
committed leadership has a strong influence over plant performance. Therefore, committed
leadership is expected to have a significant and positive relationship with plant performance.
Employee involvement
In our study, we have included employee involvement, as literature on quality and TPM suggests
that the participation and commitment of employees bring about improvement in performance
(Davis, 1995; Dean & Bowen, 1994; Nakajima, 1988; Tsuchiya, 1992). Literature on quality
suggests that the participation and commitment of all employees are “enabled” to bring about
improvement in performance, giving credence to the fact that organizations’ greatest assets are in
their workforce and the people making up the organizations (Huselid, 1995; Youndt et al., 1996).
By enabling them through cross-functional training, empowerment, skills development, use of

6
cross-functional teams, and others, their creativity in solving problems and contribution to the
achievement of quality as well as plant efficiency can be considered as sources of competitive
advantage (Barney, 1991).
Based on the above discussion, a higher level of employee involvement can bring about a greater
level of quality and enduring solutions to plant problems. In this way, plant productivity is
enhanced and improved. In addition, higher levels of employee involvement create better
understanding and a climate of trust in the organization. The construct employee involvement is
therefore predicted to have a positive and significant effect on plant performance. Our survey for
this factor focuses on such issues as elimination of barriers, evaluation of employee suggestions,
empowerment of staff, cross-functional teamwork, and increased autonomy in decision-making.
Customer focus
The TQM literature asserts that meeting customers’ needs is the main purpose of the existence of
the organization (Deming, 1982; Imai, 1986; Juran, 1992). It considers the relationship the
organization establishes that leads to customer satisfaction, loyalty, and retention (Drucker, 1974)
and how the plant manages the customer relationship and communication of the concept of
customer to the workforce. The above indicates that the customer focus construct is a key factor
in plant performance and is therefore expected to have a positive and significant relationship
with plant performance. Measures relating to the customer focus construct include knowing
external customers requirements and expectations, customer satisfaction, prompt resolution of
customers complaints and problems, and actively responsive to customers’ needs.
Strategic planning
This factor describes the plant’s strategic and business planning as well as deployment of plans
(Davis, 1995; Evans, 1996). It emphasizes the long range planning, alignment of operational
resources with corporate business mission, a process for formal strategic planning, and the extent
of the centrality of purpose and mission of the plant within. With respect to power plants,
strategic planning provides the link between the present and the future. It also promotes a clear
understanding among management and employees of the plant’s link to its corporate mission,
vision and business strategies, resulting in an alignment of resources internally to attain plant
objectives (Ansoff, 1987). Thus, it is expected that this construct will have a positive and
significant relationship with plant performance.
Knowledge Management

7
The TQM literature suggests that information and data is the ‘lifeblood’ of the organization
(Skinner, 2004), and organizations that collect and analyze information consistently tend to be
successful. This factor is concerned with the underlying TQM philosophy that decision-making
should be based on facts (Crosby, 1979; Deming, 1982; Feigenbaum, 1991). It involves
collection and analysis of data and information about customer needs, operational performance
and problems, and feedback on improvement activities or strategies undertaken by the plant, and
knowledge of the complexity of the plant operations. Knowledge management enhances the
skills and competencies of the employees in the power plants (Deming, 1982; Evans & Lindsay,
1999). In particular, training and education, which are components of knowledge management,
motivate employees to perform better in the belief that the company is investing in them. Overall
the employees’ capability and hence organizational capability increases, the outcome of which is
improved plant performance. Therefore it is predicted that the knowledge management construct
is positively and significantly related to plant performance.
TPM-orientation
This factor is concerned with activities that are responsible for equipment effectiveness. TPM
(Swanson, 2001) focuses on the maintenance strategy, the extent of preventive maintenance, the
use of root cause analysis for identifying defects and carrying out trouble-shooting activities to
bring the plant back to normal operation in the shortest time possible, and keeping and use of
records for maintenance analysis as well as carrying out reliability based maintenance activity.
High production is assured which in turn motivates plant management to commit more resources
such as training and skills development to sustain the TPM program (Senju, 1992). Employees
too are motivated to be more involved. Teamwork increases which promotes greater shared
responsibility and more ownership of plant problems (Zainal & Noorliza, 2000). Plant
performance increases overall when equipment is better and effectively maintained. Therefore,
the TPM-orientation construct is likely to be positively and significantly related to plant
performance.
Plant Performance
Plant performance is measured along dimensions of operational (reliability, capacity utilization)
and social/regulatory (environment, community, safety). We have decided to use plant
availability, which is an outcome of plant reliability as an indicator for the continual operation
and viability of the power plant. All the above performance constructs are measured subjectively.

8
Though many researchers argue for a balanced set of financial and non-financial measures to
measure performance, there are a number of reasons to opt for subjective operational and
social/regulatory data in this study (Kaplan & Norton, 2006). The main reason for the use of
subjective non-financial measures to measure performance was the unwillingness of the
deregulated power generation industry players to divulge “sensitive” commercial and financial
information2. This is especially so with the privately held power companies which comprise a
substantial portion of the sample size. Hypotheses
This study tests the relationships between the soft factors such as committed leadership,
customer focus and employee involvement with plant operational as well as social/regulatory
performance. It also tests the relationships between the hard factors such as strategic planning,
knowledge management and TPM-oriented with plant operational and social regulatory
performance.
Based on the foregoing, our hypotheses examine the relationships and predictive power of both
the “soft” and “hard” factors with plant performance. The two hypotheses are:
H1: There is a significant and positive relationship between the people-oriented “soft”
factors and overall plant performance.
H2: There is a significant and positive relationship between the technically- or process-
oriented “hard” factors and overall plant performance.
Testing the above hypothesized relationships on the three people-oriented soft factors is
important because they provide useful information of their significance in relation to plant
performance. In addition, they provide important information on the relative strengths of the
three people-related constructs which can be used for comparison with the results of other studies
that indicate people-related factors are important sources of competitive advantage (Powell, 1995;
Samson & Terziovski, 1999). Similarly, testing of the hypothesized relationships on technically-
oriented hard constructs provide important information on the effect of technically-oriented
O&M factors on plant performance. Generally there is a lack of empirical studies that
incorporate both the social and technological sides of an organization (Cua et al., 2001) where
the role of equipment effectiveness is included. By testing the above hypotheses, this study can
2 To quote from an industry source in Australia “… the operators are quite ‘pathological’ about releasing
data and information…” (Chong Ong, Head of Victorian SP-Ausnet Network Operation)

9
show the relative significance and strength of O&M practices related to equipment performance
(Senju, 1992).
Contextual factors
In order to control for systematic biasing effects, a number of contextual variables are identified
and included in this study. By doing so, it is intended to examine whether these contextual
variables affect the hypothesized relationships between the O&M model and plant performance.
Such variables that are deemed important are plant size (number of employees) (Ketokivi &
Schroeder, 2004), plant age (Joskow & Schmalensee, 1987), market environment (Ketokivi &
Schroeder, 2004), and generation technologies (Woodward, 1958). The plant organization size is
classified into three categories: (a) small, from one to 19 people, (b) medium, from 20 to 100
people, and (c) large, with more than 100 people. For plant age, we divided the power plants in
two groups where one group consisted of those plants with less than 20 years of operation. The
other grouped those plants that had been in operation for more than 20 years. The 20th-year
period is chosen to demarcate them into new and older plants, and is also the time period for
most power purchase agreements, most notably power plants using gas turbine technology. As
for market environment, we classified this factor into two classes, that is, regulated and open
market. For generation technology, we classified them into the four dominant technologies of
conventional thermal, simple cycle gas turbine, combined cycle Gas Turbine /Steam Turbine and
hydro.
Methodology and analysis of data
A mail survey was used to gather data from the power plants located in Malaysia and Australia
in order to test the above hypotheses. Power plants in Malaysia and Australia were chosen for
study because the restructuring and deregulation of the ESIs in the two countries started at the
same time and this would provide a basis for comparison between the two countries. The names
and mailing addresses of the power plants in Malaysia and Australia were initially gathered from
the lists which appeared in the statistics section of the Energy Commission website (Electricity
Supply Department Energy Commission, 2004) and Electricity Supply Association Australia
respectively.
Sample Population and Response Rates
The initial lists identified 63 and 206 plants in Malaysia and Australia respectively. The lists
were scrutinized and adjustments made to include only those power plants that were operated

10
commercially and subjected to some sort of competitive forces. Plants that were left off included
those that were yet to be operational, those that operated singly to provide partial supply to
isolated communities, those that were unmanned and remotely operated, experimental plants like
solar powered generators, and in-house co-generators. Our sample population includes ‘true’
power generators that utilize conventional energy conversion technology. Such plants comprise
conventional thermal steam plant, combine-cycle power plants, simple cycle gas turbines,
reciprocating engines, renewable energy plants (e.g., wind farms), and hydro. The final list
produced 42 and 173 individual power plants in Malaysia and Australia respectively.
Mail out of the survey instrument was staggered in two phases. For the first phase, the survey
questionnaire was sent to power plants within Malaysia in August 2006. In the second phase, the
same survey questionnaire was mailed out to Australian power plants in October 2006.
Responses from the two countries were collected over a period of two months each. A total of
108 responses were received, 41 from Malaysia and 67 in Australia. This yielded response rates
of 98 percent and 39 percent respectively, giving a total combined response rate of 50 percent.
As will be explained and discussed in the data preparation section, these 108 responses formed
the data set for all analyses in this study. Managers/team leaders in charge of the plant generating
assets or plant operation answered all responses. The respondents were considered to have the
necessary experience and knowledge on power plants operations.
Survey Instrument
The survey instrument was eight pages long. A total of 89 questions were included in the
questionnaire. Development of the questions in the survey instrument was carried out by the
researchers using a number of sources based on relevant literature in TQM (Ahire et al., 1996;
Black & Porter, 1996; Cua et al., 2001; Powell, 1995; Samson & Terziovski, 1999), TPM (Brah
& Chong, 2004; Desirey, 2000; McKone et al., 1999; McKone & Weiss, 1998b) and
maintenance (Desirey, 2000). Questions were formulated based on criteria that included The
Australian Business Excellence Framework (2004), Malcolm Baldrige National Quality Program
Criteria for Performance Excellence (2007) and TNB’s AKP Award Criteria (2006). The
questionnaire was pre-tested with colleagues and power plant managers in Tenaga Nasional
Berhad, Malaysia as well as power plant engineering and management consultants. Changes
were made to the questionnaire based on the pre-test feedback.

11
There were 59 research questions out of 89 originally selected that were relevant to the research
questions associated with this study. These 59 questions were the variables used as inputs for
analysis. These variables were assigned to seven constructs as theorized in the O&M Model:
Committed leadership, Customer focus, Employee Involvement, Strategic Planning, Knowledge
Management, TPM-orientation, and Performance. Questions were also formulated to provide a
description of the power plants and respondents.
Descriptive statistics
These include the following:.
Profile of respondents
Respondents’ positions in the power plants
The majority of the respondents were from the plant managers or staffs who were in senior management
positions at the power plants. Plants that do not have management positions responded through their
officers-in-charge. About 92% of the respondents were plant managers and managers who hold senior
positions in the power plants. These senior positions include operations, maintenance and asset
management. Table 1 shows the distribution of respondents according to their positions.
<<<Insert table 1 here>>
Many of these managers have years of experience in the power generation industry. Besides being
knowledgeable in the technical aspects of running a power plant, they are also involved in managing
resources to ensure the viability of the business itself. An analysis of the power plant work experience
among the respondents shows that the average work experience was about 22 years. About 80% of the
respondents had ten or more years working in the power generation industry. The highest work
experience recorded in the sample data was 45 years. The majority of the respondents, nearly 40%, had
between 20 and 30 years work experience in the power generation industry. Thus the survey questionnaire
data used for the statistical analysis were the expressed opinions of experienced representatives from the
power generation industry in Malaysia and Australia.
Plant organization size (number of employees)
Following the convention used in most management studies, plant size is classified according to the
number of employees. The plant organization size is classified into three categories: (a) small, from one to
19 people, (b) medium, from 20 to 100 people, and (c) large, with more than 100 people. Table 2 shows
the distribution of the power plants in the sample data into the three categories. The power plants are
found to be distributed equally among the three categories. From the technical aspects, power plant sizes

12
can be classified in terms of plant capacity as total installed capacity in megawatts of power. This
category of representing plant size is described in the next section.
<<<Insert table 2 here>>
Plant size (total installed capacity)
Total installed capacity measured in megawatts of the power plants in the sample data is shown in figure
2 below. The majority of the power plants in the sample size are sized from 10 megawatts and above. For
the sample data in this study, only three power plants were found to have installed capacity of 10
megawatts and less. A check reveals that the three are renewable energy power plants (landfill gas and
mini hydro).
<<<Insert figure 2 here>>
Table 3 shows the number of power plants in each category according to plant installed capacity and
number of employees. It shows that large power plants with installed capacities greater than 100
megawatts tend to have more employees (that is, medium to large). However, the indication is that plants
with higher installed capacities do not necessary indicate more employees working there. The power
generation industry is highly automated, more so in modern plants that were constructed in the last few
years. With more competition and privatization, the industry had undergone a change in terms of scale of
employment with more emphasis on economic rather than social benefits.
<<<Insert table 3 here>>
The sample data appears to have elicited a good spread of respondents in terms of organization size where
the number of power plants is more or less equal in numbers for small, medium and large size categories.
Plant age
Plant ages are categorised into groups of five years. The distribution is shown in figure 3 below. Most of
the power plants in the sample data were relatively new, about 42% were less than 15 years old. About
one quarter had been in operation for more than 30 years. Therefore, it is not unreasonable to say that the
sample data contains information on power plants with a relatively wide range of operating ages. For
analysis, power plants were divided in two groups where one group consisted of those plants with less
than 20 years of operation. The other grouped those plants that had been in operation for more than 20

13
years. The 20th-year period is chosen to demarcate them into new and older plants, and is also the time
period for most power purchase agreements.
<<<Insert figure 3 here>>
The representation of plant age in the statistical data analysis is important as it is theorised as one of the
contextual factors which may determine plant performance (Ketokivi & Schroeder, 2004). Wear and tear,
parts deterioration, fatigue and obsolescence are represented by age. There may be differences in
efficiency and flexibility between new and old plants. Hence an analysis of plant age is appropriate and in
line with the research study.
Location (market environment)
The power generation industries in both Malaysia and Australia have been opened up to competition, as
represented by degree of regulation. Competition in the form of PPA-driven privatization, and thus
limited in scope, is found in Malaysia and in the Australian States of Western Australia and Northern
Territory. Open competition in the form of market bidding is prevalent in the states of Queensland, New
South Wales, Victoria, South Australia and Tasmania. The sample data comprise responses of power
plants located in the above-mentioned regions. The distribution of responses from open market and PPA
“privatized” market regions was shown in figure 4 below. The number of power plants in open market
and PPA-driven privatized market regions was found to be nearly equal in the sample data.
<<<Insert figure 4 here>>
Generation technology
We can classify the generation technologies based on the conversion processes from different energy
sources into electrical energy. For this study, they are classified into (a) conventional thermal steam
turbine (ST) power plant, (b) simple cycle gas turbine (GT) power plant, (c) combined cycle GT/ST
power plant, (d) hydro, (e) wind, and (f) renewables. Figure 5 shows that four major generation
technologies constituted more than 80% of the sample size. These four technologies are the dominant
types of generation technologies used by the contemporary power industry.
<<<Insert figure 5 here>>
These four dominant technologies of conventional thermal, simple cycle gas turbine, combined cycle
GT/ST and hydro are more or less equally represented in numbers in the sample data. Wind and

14
renewables constituted about two percent of the sample size. Though these two technologies are emerging
in importance with the growing awareness of global warming, they are still at the infancy stage. Thus it is
reasonable to suggest that the sample data represents a well balanced mix of the generation technologies
normally found in the power generation industry.
In addition, the type of generation technology used is dependent on the availability of fuel resources in the
country. Malaysia’s generation mix is skewed towards the use of its indigenous gas resources. Australia’s
plentiful and easily accessible coal reserves in the eastern states of the continent shape its generation mix.
Thus we have, in Malaysia the predominant combined cycle gas turbine technology which prevails to
capitalize on the gas while the Australia relies very much on the well-proven technology of coal-fired
steam turbine technology.
<<<Insert table 4 here>>
Information regarding the prevalence of generation technologies and generation mix is discernible from
the sample data. Table 4 illustrates the pattern of generation mix for both Malaysia and Australia. The
pattern confirms the generation mix in both countries. The sample data is representative of the generation
industry in the two countries in this aspect.
Products and services
The respondents were requested to list the electricity-related products or services offered by their power
plants. The main energy products are (a) base-load energy, (b) intermediate-load energy, and (c) peak-
load energy. Ancillary services are also offered. These services are to maintain key technical
characteristics of the network system. They include services such as (a) spinning or operating reserve
(FCAS)3, (b) voltage support (NCAS)
4, and (c) black-start capability. Tables 5 and 6 indicate that number
of power plants in sample data that are classified into the various energy products and ancillary services.
About 40% of the power plants concerned are peakers. The remainder is made up of base and
intermediate load plants. This is a fair balance of generating assets in any system where peakers and non-
peakers are needed to support a system economically and effectively.
<<<Insert table 5 here>>
3 Also known as frequency control ancillary services (FCAS). 4 Also known as network control ancillary services (NCAS).

15
However, ancillary services in terms of FCAS, NCAS and black-start capability can be supplied by most
power plants. These services are as a result of the design and operating philosophies that are incorporated
into the power plant during the project development stage. More than 30% the surveyed plants offered
FCAS and NCAS.
<<<Insert table 6 here>>
Base-load and intermediate-load demands are supplied by large conventional thermal and combined cycle
power plants where economy of scale in the production of electricity is imperative. Hydro and simple
cycle GT power plants fill the slot for peak demand. Characteristics such as quick response in start up and
load following inherent in both hydro and simple cycle GT generators fit in nicely with the load demand
volatility. Renewable, of course, caters to the base load demand for maximum efficiency (Table 7).
<<<Insert table 7 here>>
The sample data therefore represents a true cross-section of power plants in terms of load demand types.
It also presents a picture that is representative of the types of plants in terms of generation technology in
line with conventional power generation industry wisdom.
Ownership
Ownership is defined for this research as state or private. State-ownership here encompasses ownership
by utility companies and public, whereas private ownership includes internationally based companies as
well. Mixed ownership is the other category and is classified as other. Table 8 shows the distribution of
power plant ownership in the sample data.
<<<Insert table 8 here>>
Competitive advantage
Literature and conventional wisdom in the power generation industry list that the main competitive
advantages of power plants are based on their physical attributes. These physical attributes are unit size,
number of operating units, low cost of plant maintenance, availability of spares, and last but not least, low
or negligible fuel cost (Stoft, 2002).
For this research, power plants respondents were requested to list the advantage of each of the physical
attributes mentioned above as compared to their nearest competitors. Table 9 lists the distribution of
power plants in terms of physical attributes and perceived competitive advantage as compared to nearest

16
competitor. Among the attributes, number of generating units stands out as an important contributing
factor in plant competitiveness within the same category. The number of generating units in the plant
relates to the flexibility of operation as having more than one generating unit per plant. If one unit is down,
the other units can pick up the load demand without shutting down the entire plant. Unit size may have
slight competitive advantage. The larger the unit size, the more economical the production is. The other
attributes such as low maintenance cost, spares availability, and fuel cost are found to not contribute to
competitiveness.
Though cost of fuel constitutes about 70% of the total generating cost in a conventional power plant
(Bureau of Industry Economics, 1992), and thus its impact on any power plant competitiveness is high,
the data here suggest that plants in the same category of competition use the same type of fuel. Hence,
any competitive advantage in fuel cost is negated. For example, the Victorian power plants use readily
available brown coal obtained from the same region. In Malaysia, however, the dominant fuel is natural
gas that is supplied by the only national gas supplier at a fixed price.
<<<Insert table 9 here>>
Similarly, attributes like spares availability and maintenance cost are not considered as sources of
competitive advantage because most of the power plants catering to the specific load demand have
generating units of basically the same design and, perhaps, make. The generating equipment market is
dominated by the “big five” suppliers – General Electric of the US, Siemens of Germany, the Swiss-
Swedish ABB, the Anglo-French GEC-Alsthom and Mitsubishi Heavy Industries of Japan. These
companies control an estimated 76% of the “new-build” market for fossil- and nuclear-fuelled power
station equipment (Financial Times, 1998).
The findings of this subsection implied that in a competitive market, flexibility of operation (number of
generating units) and, to a slight extent, unit size, are very important competitive factors especially when
operating risks are high, and cost efficiency is a major concern.
Plant availability and capacity utilization
Last but not least, the survey also requested data on plant performance in terms of plant availability and
capacity utilization. As this research also looks into the effects of competition on plant performance in
these two measures, the data on power plant from Malaysia and Australia are compared. Deregulation in
the power generation industry has stopped at privatization for Malaysia whereas Australia under its
National Electricity Market (NEM) has an open wholesale market. Tables 10 and 11 show the distribution
of power plants in terms of plant availability and capacity utilization in Malaysia and Australia
respectively.

17
The findings show that on both scores, there were more power plants in Australia with very high plant
availability and capacity factors (for both cases, more than 95%). High plant availability means that the
generating units are always ready to generate. However, Table 11 also shows that power plants in the two
countries have an almost similar number of power plants in the high category (more than 91% for plant
availability) comprising about 66% of Malaysian and 69% of Australian plants. This indicates that market
competition, to certain extent, may have some influence on plant performance in terms of plant
availability.
There are, however, a noticeable number of power plants in Australia in this sample data with a capacity
factor less than 10% (Table 12). This indicates that there is a higher incidence of underutilized generating
assets in Australia. The present industry structure in the NEM region is such that the portfolio balance of
base, intermediate and peaking plants was overweight in base and intermediate sectors. Simhauser (2007),
CEO of one of the largest power companies in Australia, pointed out that in his paper presented to an
energy conference held in Australia on supply-side portfolio that peaking plants in NEM regions are
“drifting further and further away from optimality”.
<<<Insert table 10 here>>
It means that there has been a build-up of a number of large conventional base-load steam plants that are
modern and more efficient than older plants. As a result, existing but less efficient old thermal plants are
pressed to operate in the peaking sector. For example, Queensland has a number of old coal-fired steam
plants that on average are operated only during the summer months when demand is high.
On this matter, power plants in Malaysia are better utilized with the majority (45%) in the 81–95%
capacity factor category. In a PPA-driven environment such Malaysia’s, the size, type and location of
generating assets are constructed based on detailed feasibility studies on system requirements and on
carefully analyzed projected demand and supply. A more conservative approach is therefore taken in this
case in deciding the optimal generation portfolio. Productive and allocative efficiencies among the
generation portfolio can thus be attained. Productive efficiency refers to the capacity utilization of the
generating sector, and allocative efficiency refers to the efficient mix of generating plants that are
required to service a region. In the more competitive open market, the construction of power plants is
based more on a market approach signalled by electricity market prices. In a commodity-like energy
market, business incentive to construct and operate generating plants with large installed capacities and
economies of scale to cater to base load demand is high.
<<<Insert table 11 here>>

18
Synthesis and conclusion of descriptive statistics
This section has reviewed the survey findings using descriptive statistics where the profiles of the
participating power plants were investigated. Supplementary analysis on the competitiveness in terms of
the physical attributes and comparison of operational performance of power plants in different market
environments was made.
The sample data reveal a cross-section of power generating plants in terms of types of plant size
according to number of employees and installed capacities, plant age, generation technologies, ownership,
plant location, and products/services offered. Respondents, the majority of whom were in senior
management positions, were experienced in power plant operation and management. Thus the
information provided was a reflection of their practices in a generally technically complex industry and
can be accepted with high confidence.
The electricity industry is very much dependent on the type of natural fuel resources that a country has.
Malaysia, which espouses a four-fuel strategy based on coal, natural gas, oil and hydro, is at present very
much dependent on natural gas (Electricity Supply Department Energy Commission, 2005) which is more
efficiently utilized in the production of electricity from combined cycle gas turbines – hence the
prevalence of this type of generation technology in that country.
Conversely, Australia, which is blessed with an abundance of easily accessible and cheap coal deposits,
uses coal as the main source of fuel in most of its power plants for electricity production. Other types of
fuel used in the generation industry in both countries include hydro and to a certain extent, renewables.
The kind of strategic resources in a particular country are reflected in the types of generation used which
are thus represented very well in the sample data.
Generation technology, location, plant age and plant size are contextual variables used in the statistical
analysis. Location here assumes the role of the competitive environment that is represented by the type of
markets, that is, the Malaysian PPA-driven market and Australian open market. Plant age is categorised
into two groups. Plant size in terms of the number of employees indicates a close pattern to plant size in
terms of installed capacity. In line with extant research, the number of employees is used to represent
plant size in this study (Ketokivi & Schroeder, 2004). Three categories, that is, small, medium and large,
are employed for this purpose.
Judging from the operational performance in terms of plant availability and capacity utilization, the
differences between the two countries reflect the market environments in which they operate. Though
cultures do come into play when comparisons are made between two or more countries, the nature of the
power generation industry is such that the work culture emphasis on plant reliability and availability is the
same.

19
Overall the descriptive findings provide a profile of the industry and general view of the competitiveness
in the two electricity wholesale markets. However, what constitutes competitiveness as described here
pertains more towards economic factors such as economy of scale, thermal efficiencies and fuel costs.
These factors are reflected in the size of power plants, type of generation used, location, and type of loads
catered for.
The next sections provide an analysis on the internal factors on power plant performance.
Statistical Data Analysis
Assessment of non-response bias
In this study, the technique of wave analysis was used to assess non-response bias (Rogelberg & Stanton,
2007). This approach compares the survey variables of pre-deadline responses with late responders. As
suggested, though, by Rogelberg and Stantion (2007) that this method does not indicate conclusively an
absence of bias. Nevertheless, if a difference exists between the two groups, then some degree of non-
response bias exists.
The data set of power plants from Australia was divided into two groups: pre-deadline and post-deadline.
A total of 36 power plants made up the pre-deadline group. Thirty late respondents made up the post
deadline group. A number of questions were identified from the survey questionnaire that had high
predictive validity and tested for differences between the two groups (independent sample t-test) (Field,
2005). The results of the analysis indicate that there was no significant response bias in the sample
concerned.
Incomplete response
The second stage in the treatment of data was the issue of incomplete responses or missing responses.
There were three missing data points in the relevant data set. SPSS MVA (Missing Value Analysis) was
used to examine and test for significance of missing data distribution (Tabachnick & Fidell, 2007). The
analysis indicated that the number of missing data in any one variable did not exceed 5 per cent of data
missing, and the distribution pattern of missing data was random. Thus, it could be inferred that the 3
missing data were MCAR (missing completely at random). Treatment of missing data includes removing
cases or variables with missing data from the analysis, and using an imputation technique (Hair et al.,
1998; Tabachnick & Fidell, 2007). For this study, prior knowledge substitution was used. Tabachnick and
Fidell (2007) suggest that this is an effective method when sample size is large and the number of missing
values small. It basically involved imputing the missing data with a well-educated guess. This was carried
out by identifying and observing the cases (i.e., power plants) with missing data variables and comparing
these variables in other similar power plants, which had complete set of data.

20
Scanning for outliers
The third stage of data preparation involved the screening of outliers. This stage also included checking
for data normality. Presence of outliers and normality of data usually exist together. All variables in the
data set used the 7-point Likert-type interval scale. After appropriate treatment which includes variable
transformation (Hair et al., 1998; Tabachnick & Fidell, 2007) and deletions, skew was still present in
eighteen of the variables. The skew ranged from 1.00 to 1.90. These variables were retained (Hair et al.,
1998). Three other variables were heavily skewed (z-skew=-3.787, -4.319 and -4.541) and were removed
from further analysis.
Analysis procedures
The next stage was to carry out a factor analysis of the variables to ensure that they are reliable indicators
of the constructs. A cut-off loading of 0.5 was used to screen out variables that were weak indicators of
the constructs. (Stevens, 1996, p.371). For this study, Kaiser-Meyer-Olkin measure of sampling adequacy
(KMO) was used (see Kaiser, 1970). Kaiser (1974) suggests that samples that have KMO values below
0.5 are unacceptable, between 0.5 and 0.7 as mediocre, between 0.7 and 0.8 as good, between 0.8 and 0.9
as great, and above 0.9 as superb. KMO measure of sampling adequacy for this analysis was greater than
0.8.
The composite variables derived from the factor analysis formed the independent variables. Six composite
variables were identified as independent variables. The dependent variable was the composite
performance variable. The identified composite variables were tested for internal reliability for which all
were found to have Cronbach’s alpha exceeding 0.7 (Nunnally, 1978).
Research Results
Tables 12 and 13 show the results of factor and reliability analyses. Hair et al. (1998, p.111) informed that
the choice of the cut-off factor loading relates to practical and statistical significance. The significance of
a factor loading depends on sample size. Stevens (1996) contended that for a sample size of 100
respondents, variables with factor loadings of about 0.5 and higher are significant. For this study, a cut-off
loading of 0.50 was used to screen and remove variables that were weak indicators of the constructs.
Of the forty-four variables used for the factor analysis, fifteen variables fail to make the cut-off, leaving
twenty-nine variables to constitute the six constructs, which are divided into “soft” and “hard” practices.
The six identified constructs are: (1) committed leadership, (2) employee involvement, (3) customer focus,
(4) strategic planning, (5) knowledge management, and (6) TPM-orientation. The dependent construct is
the nine-item plant performance (Table 14). The reliability values of the six independent and one

21
dependent constructs meet or exceed Nunnally’s recommended standard (Chronbach Alpha > 0.70) for
early stage research (Nunnally, 1978).
<<<Insert Table 12, 13, and 14 here >>>
Table 15 shows the bivariate correlation matrix of the six independent and one dependent variable factors.
The result of the correlation analysis is discussed in the following section.
People/customer-oriented “soft” factors and performance
The results of the bi-variate correlation analysis of this study suggest that “soft” practices are significant
and positive in the relationship with plant performance. This is consistent with extant literature in
management practices (Powell, 1995; Samson & Terziovski, 1999). The results of this study suggest that
the “soft” practice of committed leadership has the strongest influence on plant performance than
employee involvement and customer focus.
Process-oriented “hard” factors and performance
The “hard” practices indicate moderate to strong and significant correlations with plant performance.
Strategic planning had moderate and significant relationships with overall performance (r=0.445, p<0.01).
Similarly, the result also indicated moderate and significant correlations between knowledge management
systems and overall performance (r=0.473, p<0.01). TPM-orientation had moderate to strong and
significant relationships with overall performance (r=0.548, p<0.01). The results of the bi-variate
correlation analysis indicate that “hard” practices factors are significantly albeit with varying strengths
related with performance. Of the “hard” practices factors, TPM-orientation is more highly correlated than
the other two factors with performance. These results are supported by literature on maintenance practices
and manufacturing performance (Brah & Chong, 2004; McKone et al., 2001).
<<<Insert Table 15 here >>>
Table 16 shows the multiple regression of the six independent factors regressed on plant performance, F7.
Together with the result of the bivariate analysis, the multiple regression analysis is used to test the
hypotheses 1 and 2 stated earlier.
<<<Insert Table 16 here >>>
Testing of Hypotheses
Table 16 shows that the linear regression model (adj. R square=0.470) explains 47.0 percent of the
variation in overall plant performance. The result indicates that of the “soft” practices factors, only
committed leadership exhibited highly significant and positive relationship with overall plant
performance (beta=0.481, t(101)=4.779, p<0.001). Examination of the correlation matrix in Table 15
shows that the Pearson correlation coefficients between the “soft” practices factors and plant performance
are positive and significant. Committed leadership (r=0.645, p<0.01) has the strongest relationship among

22
the three “soft” practices, followed by customer focus (r=0.450, p<0.01) and employee involvement
(r=0.407, p<0.01). Based on the correlation analysis, all three factors are positive and significant in their
relationships with overall performance. Therefore, hypothesis H1 is supported.
The results of the bi-variate correlation analysis (Table 15) indicate that TPM-orientation had a strong and
significant correlation with overall plant performance (r=0.548, p<0.001), followed by knowledge
management systems (r=0.473, p<0.001) and strategic planning (r=0.445, p<0.001). The three factors
together (strategic planning, knowledge management systems and TPM-orientation) have a greater
explanatory power on overall plant performance. Based on the correlation analysis, all three “hard”
factors are positive and significant in their relationship with overall plant performance. Therefore,
hypothesis H2 is supported.
Bi-variate correlation was used in this study to test the linear relationships between variables or factors.
This method indicates that if one variable (for example, one of the “soft” or “hard” factors) deviates from
its mean the other variable (in this case, performance) is also expected to deviate from its mean in similar
manner. Multiple regression analysis tests the relationship between a set of factors in combination
together and an outcome which in this case are the sets of “soft” and “hard” factors and the overall plant
performance outcome. This statistical technique is based on the assumption of a linear relationship
between each independent variable and the dependent variable (Hair et al., 1998). MRA calculates a
separate regression coefficient for each independent variable that describes its relationship with the
dependent variable. The researcher is then able to evaluate the relative influence of each independent
variable from the coefficients (Hair et al., 2003). Hence, the use of MRA here will test the reliability and
validity of the O&M model by testing hypotheses H1 and H2.
Validity and reliability
There is a need to determine whether the constructs of the O&M model are valid and reliable measures of
the underlying practices elements. In other words, they measure what they are intended to measure.
Content, construct, and criterion validities are considered (Hair et al., 1998).
Content validity
A review of appropriate literature of the area of study concern contributed substantially to the content
validity of the research. The elements and measurement items that make up the O&M model selected
were based on extensive review of literature on total quality management, human resource practices,
and plant maintenance practices. The literature included major national quality awards from Malaysia,
Australia, the United States, and Europe. To locate these elements and measurement items within the
context of the power generation industry, appropriate literature on economic, public policy, electrical
engineering and strategy on regulated and deregulated industries was reviewed as well. Content or face

23
validity can be assured when there is widespread agreement generally from among the literature
concerned on the various aspects of the area of study. Therefore, it is reasonable to believe that the
measures of the O&M model were considered to have content validity. The items, which were developed
from these sources, would clearly define the boundaries and conceptualization of the O&M model.
Construct validity
Construct validity is the extent to which an operational measure for a theoretical construct measures the
defined construct (Hair et al., 1998; Hair et al., 2003). Two checks are usually used to assess construct
validity, that is, convergent and discriminant validity. The construct validity for each of the practice
elements was assessed by using Principal Components Factor Analysis (Hair et al., 1998). The items for
each of the factors were factor analyzed (using an orthogonal Varimax rotation). Items, which had, factor
loadings less than 0.50 were dropped. Convergent validity is then established for all the items loaded onto
a particular factor (construct). Discriminant validity is also established as these items already loaded on
the particular construct would not represent the other factors (constructs). Tables 12 and 13 show the
results of the items and their factor loadings.
Criterion Validity
Also known as predictive or external validity, criterion validity is concerned with the ability whether the
construct(s) performs as expected relative with other variables of the plant performance. The result as
shown in Table 16 produces R equals to 0.707 indicating that the six factors have a reasonably high
degree of criterion-related validity when taken together and explain 47 per cent of variance in plant
performance. Therefore, the model has strong external validity.
Reliability
Chronbach’s alpha is the most commonly used reliability coefficient to determine the internal consistency
of a set of measurement items. Coefficient alpha ranges between the values 0.00 to 1.00. The SPSS for
Windows reliability test software was used to assess separately the internal consistency of each of the
factors (constructs). The results of the reliability test are shown in Tables 12 and 13. All constructs had
Chronbach’s alpha exceeding 0.7.
Test of Strength of Relationship (adjustment for contextual variables)
For contextual variables, we make use of multivariate analysis of variance (MANOVA) and MANCOVA
to test for strength of relationship. MANOVA is an extension of the analysis of variance (ANOVA). It is
used as a replacement for ANOVA when more than one dependent variable exists (Hair et al., 1998). It is
a dependence technique that is used to assess the statistical differences between the means of two or more
groups. Such groups can, as in this study, include categories on plant size, plant age groups, market

24
environment, and technologies. It measures the differences for two or more metric dependent variables
based on a set of categorical variables acting as independent variables. In using MANOVA, the dependent
variables should be related in some way or there is a theoretical basis to consider them together (Field,
2005). Both ANOVA and MANOVA are used in this study to examine whether any statistical differences
were present among the groups on the linear combination of the dependent variables.
A number of statistical tests are available in MANOVA to test for the significance of main effects and
interactions. These tests include Wilk’s Lambda, Pillai’s Trace, Hotelling’s Trace, and Roy’s largest root.
Tabachnick and Fidell (2007) recommend Wilk’s Lambda for general use. Tukey’s post-hoc test is then
employed to pinpoint the significant differences among the groups of the set of variables which are
significant in the multivariate test.
Confounding variables are variables that are correlated with the outcome or the dependent variable. These
variables are not part of the main experimental manipulation or the study, but nevertheless have an
influence on the dependent variable. As such, we need to control or partial out the effect of these variables
before any statistical analysis such as analysis of variance is carried out. This process compares the means
of several of these variables, but controls for the effect of one or more other variables (Field, 2005).
This adjustment process is called analysis of covariance (ANCOVA) (Hair et al., 1998; Meyer, 1993).
ANCOVA is an extension of ANOVA. It enables the researcher to explore the differences between
groups while statistically controlling for an additional continuous variable called covariate (Tabachnick &
Fidell, 2007). For a comparison of samples with more than one dependent variable, the multivariate
analysis of covariance (MANCOVA) is used. In this study MANCOVA is used to analyze the effects of
these variables on the dependent variable. The three soft factors and three hard factors were used as
covariates to explore the differences in plant organization size, plant age, market environment and
generation technology.
In this study, the following contextual categories are divided into their respective groupings as follow:
(1) plant size: small (1-20 staff), medium (21-100 staff), and large (more than 100 staff) (Feng, 2006)
(2) plant age: group 1 (1-20 years) and group 2 (>20 years)
(3) market environment: group 1 (open) and group 2 (PPA-driven)
(4) generation technology: group1 (steam turbine), group 2 (gas turbine), group 3 (combined cycle), and
group 4 (hydro & others).
Comparison of the two regression equations in Table 16 and 17 indicates that the coefficients of the
independent variables have not changed significantly. The independent variables are committed
leadership, employee involvement, customer focus, strategic planning, knowledge management and TPM-
orientation. With reference to Tables 5 and 6, and comparing the b and p values of the estimate fitted

25
linear models, the results indicate that there is no significant changes in both the b and p values between
the fitted linear models when adjusted for plant size, age, market type and generation technology.
<<<Insert Table 17 here >>>
Similarly, adjusted R2 is not changed significantly (adj R
2 was 0.470 and 0.472 prior and after
adjustment for plant organization size, adj R2 was 0.470 and 0.467 prior and after adjustment for
plant organization size, adj R2 was 0.470 and 0.468 prior and after adjustment for market type,
adj R2 was 0.470 and 0.523 prior and after adjustment for generation technology respectively).
This shows that the explanatory power for plant performance is not changed significantly when
the relationship between the O&M factors and plant performance was adjusted for plant
organization size, plant age, market type and generation technology
Discussions of Results
The results of the regression analysis show that committed leadership (beta=0.481, t(101)=4.779,
p<0.001) and TPM-orientation (beta=0.282, t(101)=2.871, p<0.001) are significant
differentiators between high and low performing power plants. The area of research on
sustainable competitive advantage for organizations using the resource-based theory, either on
TQM (Cua et al., 2001; Powell, 1995), TPM (Brah & Chong, 2004; Cua et al., 2001), JIT (Cua et
al., 2001), or human resource management (Huselid, 1995), have people practices as the basis of
their findings or the so-called “soft” practices.
We found that the “hard” TPM-oriented practice of keeping records, total preventive
maintenance, and collection and analysis of information, are also significant. High levels of
leadership commitment effectively align and focus the available resources in attaining plant
operational objectives, and maintenance systems or processes that involve a TPM-orientation
efficiently utilize those resources in actively seeking to improve equipment and plant reliability,
availability, and efficiency. This tends to produce high overall performance. It underscores the
importance that both people-oriented “soft” and process/technical-oriented “hard” practices are
required in order to attain high plant performance.
However, among the “soft” and “hard” practices, employee involvement has the lowest
correlation with plant performance (r=0.407, p<0.01). This contradicts some of the earlier
findings that people management score consistently higher than other factors (Powell, 1995;
Samson & Terziovski, 1999). One plausible reason for the contradiction is that power plant is
still managed conservatively. Though the industry had been deregulated for about 10 years,

26
remnants of the traditional management style still exist. The majority of large power plants are
still owned by power utilities or government-linked companies in Malaysia (Electricity Supply
Department Energy Commission, 2005), New South Wales or Queensland (Parer, 2002). It is not
surprising that plants that have been privatized such as in Victoria have achieved better
performance (Tamaschke & Skoufa, 2007). Tests carried out indicate that there are significant
differences in performance means between privatized and utility owned plants in terms of plant
reliability (t(3.125), df(68.527), p=0.03) and safety records (t(2.172), df(66.686), p=0.033).
Privatised plants may have greater degree of employee empowerment and involvement than non-
privatised plants.
Conclusion
The main finding of this study is that effective operations and maintenance of power plants needs
to comprise both “soft” and “hard” practices in order to achieve competitive advantage in the
deregulated power generation sector. Committed leadership and maintenance oriented towards
TPM were found to be the main differentiators between high and low performing plants. We also
conclude that the O&M framework is a valid and reliable model for assessing plant performance.
The empirical findings suggest that in addition to quality practices, which tend towards
developing the people aspect of the organization, the technical aspect of plant equipment and
physical assets should be given equal emphasis.
Implications for Plant Managers
The implication of our research findings for plant managers is that they need to allocate more “softer”
resources to the operations and maintenance function if they expect high plant availability. Apart from
capacity, commercial considerations, and fuel cost (David, 1993), O&M practices are an important
differentiating factor in the competitive ESI. One outcome from this study is that more attention should be
paid by management to ensuring equipment effectiveness through appropriate maintenance. Literature on
maintenance reiterates this point (Desirey, 2000; Fredendall et al., 1997; Lamb, 1996; Moubray, 1997;
Yam et al., 2000). Studies conducted on the relationship between the maintenance function and plant
performance consistently point to the important function of maintenance (Brah & Chong, 2004;
Cooke, 2003). In the context of power plant operations, most have implemented quality standards such
as the ISO standard series. Yet the effectiveness of ISO certification in power plants in Malaysia and
Australia (whether or not it helps them to perform) is still uncertain as indicated by the empirical studies
on the manufacturing sector in the two countries (Jabnoun & Kanapathy, 1998; Terziovski, 1997).

27
The findings of this study add to the arguments with the support of hypotheses H1 and H2 with potential
implications for the national bodies of the two countries which are involved in the promotion of quality
management. Hypotheses H1 and H2 confirmed that, in addition to the softer dimensions of practices, the
harder technically-oriented dimensions of practices related to preventive maintenance are important for
operational performance.
The importance of the findings of H1 and H2 indicates that a quality framework alone may not be as
beneficial as expected for improved plant performance. It may therefore be pertinent to revise the criteria
of the national quality awards to include factor(s) concerning equipment effectiveness as one of the core
categories for the development of a strong maintenance program to enhance competitiveness and thus
significance of the manufacturing sector (Nakajima, 1989). A more effective approach may be the set-up
of a national or industry body complementing the quality bodies to be responsible for better equipment
management. It is suggested that this new body be involved in promoting and administering a national
excellence award for plant maintenance. The Japan Institute of Plant Maintenance (JIPM), which is
responsible for the prestigious PM Excellence Award, is one such example that has successfully promoted
the development of a maintenance culture in Japan (Senju, 1992).
The value of this finding is all the more important given the capital-intensive and strategic nature of the
power generation industry. The increase in plant reliability and thus availability not only assures the
authorities of cost-effective electricity but also optimizes the country’s generating assets. Optimizing the
generating assets can reduce reserve margins thereby saving unnecessary capital expenditures on new
power plant built-ups that would not be utilised efficiently (Price, 1999). The case of the current large
reserve margins in Malaysia of more than 40% points to the fact that high plant unavailability in previous
years was one of the factors contributing to the overbuilt capacity (Annual Report 2006 Tenaga Nasional
Berhad, 2006; Booz Allen & Hamilton, 1998b).
The confirmation of H1 and H2 has implications for plant managers. Hypotheses H1 and H2 confirmed
that the O&M model is a valid and reliable measuring instrument for predicting the relationship between
O&M and plant performance. As such, the O&M model offers a framework for power plants to assess
themselves by comparing where they are relative to the “best” O&M practices. The self-assessment
process should then indicate to the plant managers the differences in O&M practices. It should also
indicate as well the efficacy of using a TQM framework for plant improvement as practised by some of
the power plants. The self-assessment should enable a plant to identify its strengths and weaknesses so
that a strategy can be formulated for improving plant performance (Evans & Lindsay, 1999).
“Best” practice implementation of O&M

28
Most power plants still follow the old traditional hierarchical structure in implementing an effective O&M
policy. However, many plants implemented these changes without credible evidence in terms of which
O&M practices contribute to plant performance, and why and how they contribute to this performance.
Thus, the results of the hypotheses H1 and H2 have significant implications for power plant managers for
the implementation of effective O&M strategy and methods.
H1 and H2 confirm that higher plant performance requires the simultaneous use of soft and hard
dimensions of the O&M leadership and TPM-orientation. These two O&M factors are better predictors
than employee involvement, customer focus, strategic planning, and knowledge management. The finding
here would alert managers to the relative importance of plant maintenance practices over other practices
associated with long-term planning, customer focus, employee involvement and knowledge management.
The influence of the other factors such as employee involvement, customer focus, strategic planning, and
knowledge management on plant performance is significant only in their relationships with plant
performance individually but not collectively as indicated in the regression result.
The findings also indicate that contextual factors are not strong contributors to plant performance.
Nevertheless, the findings indicate that thermal plants that do not have natural constraining elements can
have higher performance in terms of capacity utilization than non-thermal plants which depend very much
on the natural environment. However, the effect of these contextual factors on the strength of the
relationship between O&M factors and plant performance is not significant. This indicates that internal
O&M factors have more explanatory power on plant performance than contextual factors.
The main implication resulting from this study at all levels is that the traditional O&M practices that
emphasize control and command need to be changed to reflect the current situation following
deregulation. Strong people-related practices and a proactive maintenance program that emphasizes
preventive maintenance are the two main attributes of an effective O&M to bring about high power plant
performance.
Limitations
Our research is cross-sectional in nature, therefore, it does not permit us to account for the lag between
implementation and performance. This limitation may be overcome by conducting a longitudinal study.
Secondly, our performance measures are subjective and may be subject to response bias. Furthermore, the
introduction of competition has made the availability of objective data difficult. Third, the number of
alternative renewable energy power plants in our sample is low. Renewable energy plants are growing in
importance with public and energy policy maker. Further research into this area may reveal other
innovative aspects of O&M practices.
29
Figure 1 O&M Practice Framework
No Positions in Power plant Number Percent (%)
1 Plant manager 75 70
2 Operation manager 13 12
3 Maintenance manager 2 2
4 Asset manager 9 8
5 Officer-in-charge 9 8
Table 1 Respondents’ positions in power plants
Plant size according to number of
employees
Small ( 1 to
19)
Medium (20 to
100)
Large (more than
100)
Number in sample data 35 40 33
Table 2 Distribution of power plants according to plant organization size
O&M Factors “Soft” factors Committed leadership Customer focus Employee involvement “Hard” factors Strategic planning Knowledge Management TPM-orientation
Plant performance Operational Reliability Efficiency
Social/regulatory Safety and Health Environmental impact Community

30
0
5
10
15
20
25
30
35
40
1 to 10 11 to 100 101 to 500 501 to 1000 > 1000
Group Size Category MW
Num
ber
of p
ower
pla
nts
Figure 1 Distribution of power plants by group size (MW)
Plant group size categories (MW)
Organization
size (number
of employees)
1 to 10 11 to 100 101 to 500 501 to 1000 >1000
Small ( 1 to 19) 3 19 11 2 0
Medium (20 to 99) - 14 20 5 1
Large (>100) - 2 4 9 18
Table 3 Cross-tabulation of organization size (number of employees) and plant installed capacity (MW)
11
13
18
7
18
78
5
13
0
5
10
15
20
1 to 5 6 to 10 11 to 15 16 to 20 21 to 25 26 to 30 31 to 35 36 to 40 > 41
Age category in y ears
Perc
ent
Figure 2 Distribution of power plants according to age category for sample data

31
Figure 3 Distribution of power plants in PPA-driven privatized market and open market regions
Open market PPA-driven privatized market Market type
60
50
40
30
20
10 0
0
53 55
Number of power plants

32
Figure 4 Generation technologies and the distribution in the sample data
No Type of technologies Malaysia Australia
1 Conventional thermal steam turbine 4 20
2 Combined cycle gas/steam turbine 14 7
3 Simple cycle gas turbine 6 21
4 Hydro 8 16
5 Diesel genset 8 1
6 Renewable 1 0
7 Other 0 1
Total 41 67
Table 4 Distribution of generation technologies by country
Base load plants Intermediate load plants Peak load plants
38 26 44
Table 5 Number of power plants according to plant loads
0
5
10
15
20
25
30
Generation technologies
Percent

33
FCAS NCAS Blackstart
34 41 64
Table 6 Number of power plants according to ancillary services
Type of load Conventional
thermal plant
Simple
cycle GT
Combined
cycle GT/ST
Hydro Renewable Diesel
genset
Base load 13 3 15 3 1 3
Intermediate
load
8 3 6 6 0 3
Peak load 3 20 4 10 0 6
Table 7 Cross tabulation of process technology and type of energy products among power plants in sample
data
Ownership Number of power plants Percent of power plants
State-owned 55 51
Privately-owned 43 40
Other 10 9
Table 8 Distribution of power plant ownership in sample data
Physical
attributes
Number of
power plants
Percentage
Unit size No competitive advantage 34 32
Competitive advantage 36 33
Indifferent 37 34
Number of
generating units
No competitive advantage 30 28
Competitive advantage 41 38

34
Indifferent 36 33
Low maintenance
cost
No competitive advantage 31 29
Competitive advantage 35 32
Indifferent 40 37
Easy availability
of spares
No competitive advantage 36 33
Competitive advantage 36 33
Indifferent 35 32
Fuel cost No competitive advantage 46 43
Competitive advantage 46 43
Indifferent 15 14
Table 9 Distribution of power plants in terms of physical attributes and perceived competitive advantage as
compared to nearest competitor
Country
Malaysia Australia
No. of
stations
Percentage No. of
stations
Percentage
Availability less than 80% 9 22.0 4 6.1
81–90% 5 12.2 16 24.2
91–95% 23 56.1 18 27.3
more than 95% 4 9.8 28 42.4
Total 41 100.0 66 100.0
Table 10 Availability factor by country
Country
Malaysia Australia
No. of
stations
Percentage No. of
stations
Percentage
Capacity factor less than 10% 0 0 15 22.7
11–20% 2 5.0 3 4.5
21–40% 2 5.0 6 9.1
41–60% 6 15.0 9 13.6
61–80% 11 27.5 9 13.6
81–95% 18 45.0 11 16.7
more than 95% 1 2.5 13 19.7
Total 40 100.0 66 100.0
Table 11 Capacity factor by country

35
F1: Committed leadership Construct reliability, α =0.719
ITEM FACTOR LOADINGS
q25- actively encourage change in our plant 0.513
q29- environmental (“green’) protection issues are proactively
managed at this site
0.572
q66- excellent Occupational Health and Safety practices 0.552
q26- there is a high degree of unity of purpose throughout our plant 0.595
F2: Employee Involvement Construct reliability, α =0.826
ITEM FACTOR LOADINGS
q43- there is increased employee autonomy in decision-making 0.815
q45- problems solved through small group sessions 0.761
q27- we have eliminated barriers between individuals and/or
departments
0.694
q42- all employee suggestions are evaluated 0.631
q40- cross-functional teams are often used 0.615
F3: Customer focus Construct reliability, α =0.907
ITEM FACTOR LOADINGS
q74- our company actively seeks ways to meet customers’
requirements
0.861
q73- customers’ complaints and problems are resolved promptly
and efficiently
0.834
q72- we are customer focused 0.808
q70- we strive to be highly responsive to our customers 0.781
q69- know our external customers’ 0.632
Table 12 Factor analysis: Independent variables (people/customer-oriented “soft” practices)
F4: Strategic planning Construct reliability, α =0.905
ITEM FACTOR LOADINGS
q33- our plant has a formal strategic planning process which results in a written mission, long range goals and strategies for
implementation
0.778
q34- plant management routinely reviews and updates a long-range
strategic plan
0.722
q31- we have a written statement of strategy covering all operations
which is clearly articulated and agreed to by our senior plant staff.
0.706
q30- we have a mission statement which has been communicated
throughout the plant and is supported by our staff
0.589
q32- plant’s operation effectively aligned with corporate business
mission
0.564
F5: Knowledge management Construct reliability, α =0.846
ITEM FACTOR LOADINGS
q39- we have plant-wide training and development process, 0.731

36
including career path planning, for all our employees
q48- we make use of benchmarking data 0.688
q47- charts showing plant performance are posted on the plant floor 0.668
q38- top management is committed to employee training 0.648
q65- employee satisfaction is formally and regularly measured 0.635
q37- ongoing education and training for all employees is
encouraged
0.603
F6: TPM orientation Construct reliability, α =0.816
ITEM FACTOR LOADINGS
q55- records of maintenance are kept 0.863
q56- our plant has established a total preventive maintenance
programme
0.730
q53- preventive maintenance is widely practiced in our plant 0.567
q50- collect and analyse information on important activities 0.603
Table 13 Factor analysis: Independent variables (process-oriented “hard” practices)
F9: Overall plant performance Construct reliability, α =0.775
ITEM
q75- has high success in meeting anti-pollution targets
q76- unplanned outage rate is low
q77- plant’s unit cost of production has decreased
q78- have reduced the number of unit trippings
q79- industrial safety record is excellent
q80- measures in our plant that always exceed or meet environmental requirements
q81- plant was accident-free
q82- relationship with our neighbourhood community is excellent
q83- plant production of electricity has increased
Table 14 Items and reliability: Dependent construct (Plant performance)
F1 (IV) F2 (IV) F3 (IV) F4 (IV) F5 (IV) F6 (IV) F7
(DV)
F1: committed leadership 1
F2: employee involvement .596** 1
F3: customer focus .538** .469** 1
F4: strategic planning .597** .531** .580** 1
F5: knowledge management system .490** .374** .423** .659** 1
F6: TPM-orientation .492** .335** .498** .607** .616** 1
F7: Plant performance .645** .407** .450** .445** .473* .548** 1
IV – independent variable ** Correlation significant at the 0.01 level (1-tailed)
DV – dependent variable
Table 15 Correlation matrix of constructs
Analysis of Variance (ANOVA) B Beta t-test p
Dependent variable, F7: Overall plant performance
F(6,101)=16.802 (Sig. F = 0.000)
Multiple R=0.707, R square=0.500, adj R square=0.470
Intercept 0.114 4.1095 0.000
Factor 1: committed leadership 0.443 0.481 4.779 0.000
Factor 2: employee involvement 0.021 0.025 0.271 0.787
Factor 3: customer focus 0.056 0.076 0.816 0.416
Factor 4: strategic planning -0.107 -0.151 -1.331 0.186

37
Factor 5: knowledge management 0.097 0.122 1.205 0.231
Factor 6: TPM-orientation 0.228 0.282 2.871 0.005
Table 16 Summary of Regression Analysis on Dependent Variable, F7: Overall Plant performance
Parameter estimates Dependent variable Parameter Coefficient B Std.
error p
Overall plant performance Intercept 0.134 0.031 0.000 R2=0.512 (Adj R2=0.472) Committed
leadership 0.451 0.093 0.000
Employee involvement
-0.025 0.084 0.769
Customer focus 0.043 0.070 0.534 Strategic planning -0.070 0.084 0.410 Knowledge
management 0.106 0.080 0.191
TPM-orientation 0.241 0.082 0.004 Plant size – small -0.044 0.028 0.122 Plant size –medium -0.022 0.025 0.373 Plant size – large 0 Parameter estimates Dependent variable Parameter Coefficient B Std.
error p
Overall plant performance Intercept 0.127 0.033 0.000 R2=0.502 (Adj R2=0.467) Committed
leadership 0.451 0.093 0.000
Employee involvement
0.016 0.078 0.837
Customer focus 0.046 0.070 0.512 Strategic planning -0.099 0.082 0.230 Knowledge
management 0.096 0.080 0.234
TPM-orientation 0.211 0.083 0.012 Age (1-20yrs) -0.015 0.021 0.462 Age (>20yrs) 0 Parameter estimates

38
Dependent variable Parameter Coefficient B Std. error
p
Overall plant performance Intercept 0.125 0.031 0.000 R2=0.502 (Adj R2=0.468) Committed
leadership 0.451 0.093 0.000
Employee involvement
0.026 0.077 0.737
Customer focus 0.039 0.072 0.593 Strategic planning -0.102 0.081 0.209 Knowledge
management 0.106 0.081 0.194
TPM-orientation 0.211 0.082 0.011 Market (PPA) -0.018 0.021 0.391 Market (open) 0 Parameter estimates Dependent variable Parameter Coefficient B Std.
error p
Overall plant performance Intercept 0.055 0.033 0.094 R2=0.567 (Adj R2=0.523) Committed
leadership 0.401 0.094 0.000
Employee involvement
0.023 0.086 0.787
Customer focus -0.093 0.072 0.197 Strategic planning -0.035 0.084 0.678 Knowledge
management -0.018 0.086 0.831
TPM-orientation 0.269 0.079 0.001 Gen(ST) 0.103 0.028 0.000 Gen(GT) 0.072 0.032 0.020 Gen(CC) 0.073 0.029 0.014 Gen(H&O) 0
Table 17. Summary of Regression Analysis on Dependent Variable, F7: Overall Plant
Performance with contextual variables of Plant size, plant age, market type, and generation technology
References

39
Ahire, S., Golhar, D., & Waller, M. (1996). Development and validation of tqm
implementation constructs. Decision Sciences, 27(1), 23-56.
Ansoff, I. (1987). Corporate Strategy (Rev. ed.). London: Penguin Books.
Bamber, C., Sharp, J., & Hides, M. (1999). Factors affecting successful implementation of
total productive maintenance: A uk manufacturing case study perspective. Journal
of Quality in Maintenance Engineering, 5(3), 162-181.
Barney, J. (1991). Firm resources and sustained competitive advantage. Journal of
Management, 17(1), 99-120.
Bass, B. M. (1985). Leadership and performance beyond expectations. New York: Free Press.
Black, S., & Porter, L. (1996). Identification of the critical factors of tqm. Decision Sciences,
27(1), 1-21.
Booz Allen & Hamilton. (1998). Cbps o&m management: Virtuous cycle. KL: TNB.
Brah, S. A., & Chong, W. K. (2004). Relationship between total productive maintenance
and performance. International Journal of Production Research, 42(12), 2383-2401.
Chan, F., Lau, H., Ip, R., Chan, H., & Kong, S. (2005). Implementation of total productive
maintenance: A case study. International Journal of Production Economics, 95, 71-94.
Cigolini, R., & Turco, F. (1997). Total productive maintenance practices: A survey in italy.
Journal of Quality in Maintenance Engineering, 3(4), 259-272.
Cooke, F. L. (2000). Implementing tpm in plant maintenance: Some organisational barriers.
The International Journal of Quality & Reliability Management, 17(9), 1003.
Cooke, F. L. (2003). Plant maintenance strategy: Evidence from four british manufacturing
firms. Journal of Quality in Maintenance Engineering, 9(3), 239.
Crosby, P. B. (1979). Quality is free. New York: McGraw-Hill Book Company.
Cua, K. O., McKone, K. E., & Schroeder, R. G. (2001). Relationships between
implementation of tqm, jit, and tpm and manufacturing performance. Journal of
Operations Management, 19, 675-694.
Dangayach, G., & Deshmukh, S (2001). Manufacturing strategy: Literature review and
some issues. International Journal of Operations and Production Management, 217(7),
884-932
David, A. K. (1993). Competitive bidding in electricity supply. Paper presented at the IEE
Proceedings-C.
Davis, F. E. (1995). Best practice awareness. North Strathfield NSW: Rollocorp.
Dean, J. W., Jr., & Bowen, D. E. (1994). Management theory and total quality: Improving
research and practice through theory development. The Academy of Management
Review, 19(3), 392-418.
Deming, W. E. (1982). Out of crisis. Cambridge, Mass.: Massachusetts Institute of
Technology.
Desirey, S. T. (2000). Positioning maintenance as a competitive advantage. Plant
Engineering, 54(5), 66.
Draper Jr, E. L. (1998). Assessment of deregulation and competition. In A. All engineers
dinner at American Power Conference (Ed.). Chicago: IEEE Power Engineering
Review.
Drucker, P. F. (1975). The practice of management. London: William Heinemann.
Electricity Supply Association of Australia Limited. (2001). Electricity australia 2001 (No.
54th): ESAA.

40
Electricity Supply Department Energy Commission. (2004). Statistics of electricity supply
industry in malaysia year 2004 edition. KL: Energy Commission.
Evans, J. R. (1996). Leading practices for achieving quality and high performance. Paper
presented at the Benchmarking for Quality Management & Technology.
Feigenbaum, A. V. (1991). Total quality control (3rd, revised ed.). New York: McGraw-Hill
Inc.
Feng, M. (2006). The relationship between motivation and effort in the implementation of ISO
management systems and organizational performance. Melbourne: University of
Melbourne.
Field, A. (2005). Discovering statistics using spss (2nd ed.). London: Sage Publications.
Flynn, B. B., Schroeder, R. G., & Sakakibara, S. (1994). A framework for quality
management research and an associated measurement instrument. Journal of
Operations Management, 11(4), 339-366.
Fredendall, L. D., Patterson, J. W., William, J. K., & Tom, G. (1997). Maintenance:
Modeling its strategic impact. Journal of Managerial Issues, 9(4), 440.
Guadagnoli, E., & Velicer, W. F. (1988). Relation of sample size to the stability of
components patterns. Psychological Bulletin, 103(2), 265-275.
Hair, J. F., Anderson, R. E., Tatham, R. L., & Black, W. C. (1998). Multivariate data
analysis (Fifth ed.). London/Sydney/New Dehli: Prentice Hall International.
Hair, J. F., Babin, B., Money, A. H., & Samouel, P. (2003). Essentials of business research
methods: Wiley.
Huselid, M. A. (1995). The impact of human resource management practices on turnover,
productivity, and corporate financial performance. Academy of Management
Journal, 38(3), 635.
Imai, M. (1986). Kaizan: The key to japan's competitive success. New York: Random House
Business Division.
Ireland, F., & Dale, B. (2001). A study of total productive maintenance implementation.
Journal of Quality in Maintenance Engineering, 7(3), 183-191.
Joskow, P. L., & Schmalensee, R. (1987). The performance of coal-burning electric
generating units in the United States: 1960-1980. Journal of Applied Econometrics,
2(2), 85-109.
Juran, J. M. (1992). Juran on quality by design. New York: The Free Press.
Kaiser, H. F. (1970). A second generation little jiffy. Psychometrika, 35(4), 401-415.
Kaiser, H. F. (1974). An index of factorial simplicity. Psychometrika, 39(1), 31-36.
Kaplan, R. S., & Norton, D. P. (2004). Strategy maps: Converting intangible assets into
tangible outcomes. Boston: Harvard Business School Press.
Kass, R., & Tinsley, H. (1979). Factor analysis. Journal of Leisurre Research, 11, 120-138.
Ketokivi, M., & Schroeder, R. (2004). Manufacturing practices, strategic fit and
performance: A routine-based view. International Journal of Operations and
Production Management, 24(2), 171-191.
Lamb, R. G. (1996). Plant availability performance: The missing player in manufacturing
competitiveness. IIE Solutions, 28(1), 34.
Lawrence, P. R., & Lorsch, J. W. (1986). Organization and environment: Managing
differentiation and integration (Rev. ed.). Boston: Harvard Business School Press.
Lindsay, N., & Peter, J.D. (1998). Electricity industry reform: A case analysis in Australia.
Journal of Organizational Change Management, 11(6), 481.

41
Loredo, E., & Suarez, E. (2000). Privatisation and deregulation: Corporate governance
consequences in a global economy. Corporate Governance, 8(1), 65-74.
MacCallum, R. C., Widaman, K. F., Zhang, S., & Hong, S. (1999). Sample size in factor
analysis. Psychological Methods, 4(1), 84-99.
Malcolm Baldrige National Award Criteria. (1994). Malcolm baldrige national award
criteria. Washington DC: United States Department of Commerce, National
Institute of Standards and Technology.
Matusheski, R. (2000, July 23-26). Analytical methods for plant efficiency and reliability
improvements. Paper presented at the 2000 International Joint Power Generation
Conference, Miami Beach, Florida.
McKone, K. E., Schroeder, R. G., & Cua, K. O. (1999). Total productive maintenance: A
contextual view. Journal of Operations management, 17(2), 123-144.
McKone, K. E., Schroeder, R. G., & Cua, K. O. (2001). The impact of total productive
maintenance practices on manufacturing performance. Journal of Operations
Management, 19, 39-58.
McKone, K. E., & Weiss, E. N. (1998a). Total productive maintenance: Bridging the gap
between practice and research. Production and Operations Management, 7(4), 335-
351.
McKone, K. E., & Weiss, E. N. (1998b). Tpm: Planned and autonomous maintenance:
Bridging the gap between practice and research. Production and Operations
Management, 7(4), 335-351.
Moubray, J. (1997). Reliability-centred maintenance rcm ii (2nd ed.). Oxford: Butterworth-
Heinemann.
Nakajima, S. (1988). Introduction to tpm. Cambridge MA: Productivity Press.
Nakajima, S. (Ed.). (1989). Tpm development program: Implementing total productive
maintenance. Cambridge, Mass.: Productivity Press.
NIST. (2007). Criteria for performance excellence: National Institute of Standards and
Technology.
Nunnally, J. C. (1978). Psychometric theory (2nd ed.). New York: McGraw-Hill.
Parer, W. R. (2002). Towards a truly national and efficient energy market. Canberra:
Council of Australian Governments Energy Market Review.
Powell, T. C. (1995). Total quality management as competitive advantage: A review and
empirical study. Strategic Management Journal, 16(1), 15-37.
Rogelberg, S., & Stanton, J. M. (2007). Introduction: Understanding and dealing with
organizational survey nonresponse. Organizational Research Methods, 10(2), 195-209.
Samson, D., & Terziovski, M. (1999). The relationship between total quality management
practices and operational performance. Journal of Operations Management, 17, 393-
409.
Schonberger, R. J. (1986). World class manufacturing: The lessons of simplicity applied.
London: Collier Macmillan Publishers.
Senju, S. (1992). TQC and TPM. Tokyo: Asian Productivity Organization.
Skinner, A. (2004). The Australian business excellence framework. Sydney: SAI Global.
Stevens, J. (1996). Applied multivariate statistics for the social sciences (3rd ed.). NJ:
Hillsdale.
Swanson, L. (2001). Linking maintenance strategies to performance. International Journal
of Production Economics, 70, 237-244.

42
Tabachnick, B. G., & Fidell, L. S. (2007). Using multivariate statistics (5th ed.). New York:
Harper & Row.
Tamaschke, R., & Skoufa, L. (2007). Strategy in a restructured industry environment: The
case of electricity generation firms. Paper presented at the 5th ANZAM Operations
Management Symposium and 1st Asia Pacific Operations Management Symposium,
Melbourne.
Tenaga Nasional Berhad. (2006). Akp award criteria. KL.
Tse, E., Cainey, A., & Haddock, R. (2007). Evolution on the global stage. Strategy +
Business.
Tsuchiya, S. (1992). Quality maintenance: Zero defects through equipment management.
Cambridge, MA: Productivity Press.
Woodward, J. (1958). Management and technology. London: HMSO.
Yam, R. C. M., Tse, P., Ling, L., & Fung, F. (2000). Enhancement of maintenance
management through benchmarking. Journal of Quality in Maintenance
Engineering, 6(4), 224-240.
Yokell, M. D., & Violette, D. M. (1988). Market structure and opportunities in the electric
utility industry today. Public Utilities Fortnightly, 121(1), 9.
Youndt, M. A., Snell, S. A., Dean, J. W., Jr., & Lepak, D. P. (1996). Human resource
management, manufacturing strategy, and firm performance. Academy of
Management Journal, 39(4), 836
Zainal, A. A., & Noorliza, K. (2000). Quality practices that pay: Empowerment and
teamwork. Malaysian Management Review, 35(2)
Zhang, Y.-F., Parker, D., & Kirkpatrick, C. (2004). Electricity sector reform in developing
countries: An econometric assessment of the effects of privatization, competition
and regulation. Centre on Regulation and Competition Working paper series (paper
no. 62)(Paper no 62).

43
Appendix
SURVEY QUESTIONNAIRE
THE RELATIONSHIP BETWEEN MANAGEMENT PRACTICES AND PERFORMANCE OF POWER
GENERATION PLANTS
Management Practices Framework
Committed leadership
Strategic Planning
Training
Employee Involvement
Information and Feedback
Planned Maintenance
Open culture
People Management
Customer focus
Management Practices
Plant performance
Reliability Capacity Utilization Safety
Environmental Compliance

44
1.0 BASIC PLANT DATA
BACKGROUND INFORMATION
1. Name of power plant (or hydro scheme): ________________________
2. Please circle the number that best indicates the ownership of this plant. (Circle all that apply)
1 2 3 4 5
Utility-owned Publicly-owned
Privately-owned
Foreign-owned
Other:_________________________________________________ (Please specify)
Please specify _______
3. How many employees work at your plant presently? ______________
4. What is the estimated age of your oldest power generating plant assets at this site? ____________ years
PLANT CHARACTERISTICS
1. Indicate the MAJOR power generating technology found at your plant.
(Please circle the relevant number in the boxes. You can circle more than once)
1 2 3 4 5 6 7 8
Conventional thermal steam turbine
Simple Cycle Gas turbine
Combined Cycle Gas Turbine
Hydro Wind power
Renewable (biomass /landfill gas)
Diesel
Other: ________________________________________________________________(please specify)
2. Number of units and installed capacities of your plant. (Please circle the appropriate number)
a. Unit capacity (MW)
1 2 3 4 5 6 7
Less than 1
MW
Between 1 MW
and 10MW
Between 11MW
and 50MW
Between 51MW
and 100MW
Between 101MW
and 150MW
Between 151MW
and 200MW
More than
200MW
b. Number of generating units in your plant (or hydro scheme)

45
1 2 3 4 5 6 7
One Between 2 and 4 Between 5 and 7 Between 8 and 10 Between 11 and
15
Between 15 and
20 More than 20
c. Total plant capacity at your site
................................ MW
GEOGRAPHICAL LOCATION
1. Please indicate the following regions within which your power plant is located.
(Please TICK ONE only)
1 2 3 4 5 6
Northern (for West
Malaysia)
Central (for West
Malaysia)
Eastern (for West
Malaysia)
Southern (for West
Malaysia) Sarawak Sabah
MARKET SEGMENT
Please circle one number against each statement where: 1 = “Strongly disagree”, 2 = “Moderately disagree”, 3 = “Mildly disagree”, 4 = “Neither agree nor disagree”, 5= “Mildly Agree”, 6 = “Moderately agree” and 7 =“Strongly agree” 1. The following statements relate to the Major location characteristics of
your power plant.
2. The following statements relate to the operational characteristics of your power plant.
a. Our plant generates base load energy most of the time 1 2 3 4 5 6 7
b. Our plant generates semi-base load energy most of the time 1 2 3 4 5 6 7
c. Our plant generates peak load energy most of the time 1 2 3 4 5 6 7
Strongly disagree Strongly agree
a. Our plant is located near load centres 1 2 3 4 5 6 7
b. Our plant is located at present site primarily due to engineering requirements (such as adequate land, cooling water, environmental factors)
1 2 3 4 5 6 7
c. Our plant is located at present site primarily because of easy access to fuel or natural renewable sources
1 2 3 4 5 6 7

46
d. Our plant regularly provides spinning and operating reserve 1 2 3 4 5 6 7
e. Our plant is regularly requested to support system voltage 1 2 3 4 5 6 7
f. Our plant has blackstart capability 1 2 3 4 5 6 7
g. Our plant operation is not constrained by transmission network 1 2 3 4 5 6 7
3. Relative to our closest competitors, our plant has an advantage in:
a. Unit size (installed capacity per unit) 1 2 3 4 5 6 7
b. Number of operating units in our plant 1 2 3 4 5 6 7
c. Low plant maintenance cost 1 2 3 4 5 6 7
d. Spare parts availability 1 2 3 4 5 6 7
e. Low or nil fuel cost 1 2 3 4 5 6 7

47
2.0 MANAGEMENT PRACTICES
For questions 2.1 to 2.9 below, please circle the number which best describes your plant’s PRESENT position where:
1 = “Strongly disagree”, 2 = “Moderately disagree”, 3 = “Mildly disagree”, 4 = “Neither agree nor disagree”, 5= “Mildly Agree”, 6 = “Moderately agree” and 7 =“Strongly agree”
2.1 COMMITTED LEADERSHIP
a. Senior plant management staffs actively encourage change in our plant 1 2 3 4 5 6 7
b. There is a high degree of unity of purpose throughout our plant 1 2 3 4 5 6 7
c. We have eliminated barriers between individuals and /or departments. 1 2 3 4 5 6 7
d. At this plant we proactively pursue continuous improvement rather than reacting to crisis/”fire-fighting”
1 2 3 4 5 6 7
e. Environmental (“green”) protection issues are proactively managed at this site
1 2 3 4 5 6 7
2.2 STRATEGIC PLANNING
a. We have a mission statement which has been communicated throughout the plant and is supported by our staff
1 2 3 4 5 6 7
b. We have a written statement of strategy covering all operations, which is clearly articulated and agreed to by our senior plant staff
1 2 3 4 5 6 7
c. Our plant's operations are effectively aligned with the corporate business mission.
1 2 3 4 5 6 7
d. Our plant has a formal strategic planning process which results in a written mission, long-range goals and strategies for implementation
1 2 3 4 5 6 7
e. Plant management routinely reviews and updates a long-range strategic plan 1 2 3 4 5 6 7
2.3. TRAINING
a. Employees receive training to perform multiple tasks 1 2 3 4 5 6 7
b. Employee flexibility, multi-skilling and training are actively used to support improved performance
1 2 3 4 5 6 7
c. Ongoing education and training for all employees is encouraged 1 2 3 4 5 6 7
d. Top management is committed to employee training 1 2 3 4 5 6 7
e. We have a plant-wide training and development process, including career path planning, for all our employees
1 2 3 4 5 6 7
2.4. EMPLOYEE INVOLVEMENT
a. Cross-functional teams are often used 1 2 3 4 5 6 7
b. During problem solving sessions, we make an effort to get all team members’ opinions and ideas before making a decision
1 2 3 4 5 6 7
c. All employee suggestions are evaluated 1 2 3 4 5 6 7
Strongly disagree Strongly agree

48
d. There is increased employee autonomy in decision-making 1 2 3 4 5 6 7
e. Our staff are empowered to make decisions 1 2 3 4 5 6 7
f. In the past 3 years, many problems have been solved through small group sessions
1 2 3 4 5 6 7
2.5. INFORMATION AND FEEDBACK
a. Important data are presented and communicated to employees 1 2 3 4 5 6 7
b. Charts showing plant performance are posted on the plant floor 1 2 3 4 5 6 7
c. We make use of benchmarking data 1 2 3 4 5 6 7
d. Information on productivity is readily available to employees 1 2 3 4 5 6 7
e. We collect and analyse information on our important activities 1 2 3 4 5 6 7
f. We have easy access to the information we need 1 2 3 4 5 6 7
2.6. PLANNED MAINTENANCE
a. We emphasize reliability maintenance as a strategy 1 2 3 4 5 6 7
b. Preventive maintenance is widely practiced in our plant 1 2 3 4 5 6 7
c. Operating, maintenance, and technical personnel are fully involved in doing root cause analysis
1 2 3 4 5 6 7
d. Records of maintenance are kept 1 2 3 4 5 6 7
e. Our plant has established a total preventive maintenance programme 1 2 3 4 5 6 7
2.7. OPEN CULTURE
a. We have a flat hierarchical organizational structure 1 2 3 4 5 6 7
b. Our operation decisions are detailed in formal written reports 1 2 3 4 5 6 7
c. We have a more open, trusting organizational culture 1 2 3 4 5 6 7
d. In our plant there is less bureaucracy 1 2 3 4 5 6 7
e. We often make use of empowered work teams 1 2 3 4 5 6 7
f. There is increased staff autonomy in decision-making 1 2 3 4 5 6 7
2.8. PEOPLE MANAGEMENT
a. The concept of the “internal customer” is well understood at this plant 1 2 3 4 5 6 7
b. Our site has effective “top-down” and “bottom-up” communication 1 2 3 4 5 6 7
c. Employee satisfaction is formally and regularly measured 1 2 3 4 5 6 7
d. Our Occupational Health and Safety practices are excellent 1 2 3 4 5 6 7
e. Reward and recognition systems support the plant’s performance objectives 1 2 3 4 5 6 7
f. We have internal promotion of staff 1 2 3 4 5 6 7
2.9. CUSTOMER FOCUS
a. We know our external customers’ current and future requirements 1 2 3 4 5 6 7
b. We strive to be highly responsive to our customers’ needs 1 2 3 4 5 6 7

49
c. We regularly measure external customer satisfaction 1 2 3 4 5 6 7
d. We are customer focussed 1 2 3 4 5 6 7
e. Customers’ complaints and problems are resolved promptly and efficiently 1 2 3 4 5 6 7
f. Our company actively seeks ways to meet customers’ requirements 1 2 3 4 5 6 7
3.0 PLANT PERFORMANCE
For question (1) below, please circle the number which best describes your plant’s PRESENT position:
1 = “Strongly disagree”, 2 = “Moderately disagree”, 3 = “Mildly disagree”, 4 = “Neither agree nor disagree”, 5= “Mildly Agree”, 6 = “Moderately agree” and 7 =“Strongly agree”
1. Over the past three years, . . .
a. …. our plant has high success in meeting anti-pollution targets 1 2 3 4 5 6 7
b. …..our plant unplanned outage rate is low 1 2 3 4 5 6 7
c. …..our plant’s unit cost of production has decreased 1 2 3 4 5 6 7
d. …..we have reduced the number of unit trippings 1 2 3 4 5 6 7
e. …..our industrial safety record is excellent 1 2 3 4 5 6 7
f. ….we have put in place measures in our plant that always exceed or meet environmental requirements
1 2 3 4 5 6 7
g. .... our plant was “accident-free” 1 2 3 4 5 6 7
h. .....our relationship with our neighbourhood community is excellent 1 2 3 4 5 6 7
i. ….our plant production of electricity has increased 1 2 3 4 5 6 7
2. Please indicate your plant’s current performance level for EACH of the indicators by writing down a single number,
ranging from 1 through 7, in the vacant end column.
Indicators 1 2 3 4 5 6 7 (1-7)
A Average annual plant capacity factor % for the past three financial years
<10 11-20 21-40 41-60 61-80 81-95 >95
B Average annual Plant Equivalent Availability factor % for the past three financial years
<50 51-60 61-70 71-80 81-90 91-95 >95
Strongly disagree Strongly agree

50
______________________________________________________________________________
4.0 RESPONDENT’s PARTICULARS
Finally we would like to end by asking a few bits of information about yourself so that we can put your other replies in greater context.
1. Years of service in this power plant/site: …………………………
2. Years of work experience in power sector: ..........................................
3. Please indicate your position (or job title) within your power plant
…………………………………………………………..
4. Your comments, if any
……………………………………………………………………………………………………………………………………………………………………………………………………………………………………………………………………………………………………
…………………………………………………………………………………………………………………………………………………………………………………………..................................................................................
.................................................................................................................................................................................................................................
............................................................................................................................................................ .....................................................................
........................................................................................................