operations, maintenance, and monitoring plan 2015 update
TRANSCRIPT

4700 West 77th Street
Minneapolis, MN 55435-4803
Phone: 952.832.2600 Fax: 952.832.2601
Operations, Maintenance, and Monitoring Plan – 2015
Update
Groundwater Remediation System
Prepared for
Flint Hills Resources Alaska, LLC
December 2015
Prepared by:
Barr Engineering Company
4700 West 77th Street
Minneapolis, MN 55435
__________________________
Brian Angerman
Vice President
Qualified Person as defined by 18 AAC 75.990

i
Operations, Maintenance and Monitoring Plan – 2015 Update
Groundwater Remediation System
December 2015
Contents
1.0 Introduction .........................................................................................................................................................................1
1.1 Purpose ............................................................................................................................................................................1
1.2 Process Overview ..........................................................................................................................................................1
1.3 Process Description .....................................................................................................................................................1
1.4 Estimated Duration of Treatment System ...........................................................................................................2
2.0 Operations and Maintenance .......................................................................................................................................3
2.1 Routine maintenance and schedule ......................................................................................................................5
3.0 Groundwater Remediation System Performance Monitoring ..........................................................................9
3.1 Groundwater recovery performance goal and targets ...................................................................................9
3.2 Treatment system performance ..............................................................................................................................9
3.3 Capture zone monitoring ....................................................................................................................................... 10
3.3.1 Hydraulic capture ................................................................................................................................................. 10
3.3.2 Contaminant Capture ......................................................................................................................................... 11
3.4 LNAPL Recovery Performance Monitoring ...................................................................................................... 11
3.4.1 Light Nonaqueous Phase Liquid Transmissivity ........................................................................................ 11
3.4.2 Light Nonaqueous Phase Liquid Recovery Volume................................................................................. 12
4.0 Performance Monitoring Evaluation ....................................................................................................................... 13
4.1 Treatment system performance ........................................................................................................................... 13
4.2 Hydraulic capture performance ........................................................................................................................... 13
4.3 Contaminant capture performance .................................................................................................................... 13
4.4 LNAPL recovery performance ............................................................................................................................... 14
5.0 Documentation of Changes to OMM Plan ........................................................................................................... 16
6.0 OMM Reporting Schedule .......................................................................................................................................... 17
7.0 References ......................................................................................................................................................................... 18

ii
List of Tables
Table 1 Performance Monitoring Well Network
List of Figures
Figure 1 Groundwater Remediation System Layout
Figure 2 Hydraulic Capture Zone Performance Monitoring Network
Figure 3 Sulfolane Performance Monitoring Network
Figure 4 BTEX Performance Monitoring Network
Attachment
Attachment 1 Summary of Revisions to the OMM Plan

1
1.0 Introduction
1.1 Purpose
On behalf of Flint Hills Resources Alaska, LLC (FHRA), Barr Engineering Company (Barr) has prepared this
update to the Operation, Maintenance and Monitoring (OMM) Plan for the groundwater remediation
system at the Flint Hills Resources Alaska, LLC (FHR) North Pole Terminal (NPT) located in North Pole,
Alaska. The original OMM Plan was submitted in October 2014. This updated OMM Plan is referred to as
the OMM Plan – 2015 Update. A change log is included as Attachment 1.
The groundwater remediation system includes multiple groundwater recovery wells, two treatment
systems, and light non-aqueous phase liquid (LNAPL) recovery and recycling. This OMM Plan summarizes
the methods and schedules for operation, maintenance, and monitoring of this remediation system. The
groundwater remediation system was designed to protect onsite workers, enhance LNAPL recovery,
remediate the groundwater plume, and eliminate offsite migration of contaminants. This plan adopts and
references information, work, and analysis described in more detail in the Onsite Revised Sampling and
Analysis Plan (RSAP; Appendix A, ARCADIS, 2015a). A Long-Term Monitoring Plan (LTM Plan; ARCADIS
2014b) has also been prepared, and updated (LTM Plan – 2015 Update; ARCADIS, 2015c), to document
groundwater monitoring frequency and schedules for the site.
1.2 Process Overview
Groundwater recovery wells are utilized to extract impacted groundwater and provide hydraulic control of
dissolved phase hydrocarbons and sulfolane1. The recovered groundwater is treated within two onsite
treatment systems, the original (East) and expanded (West) treatment systems. Both treatment systems
use granular activated carbon (GAC). The two systems are referred to below as “GAC East” and “GAC
West”, respectively.
LNAPL is present in the soil in portions of the site and it accumulates in some site monitoring, observation
and recovery wells. Recovery of LNAPL from site wells constitutes hydrocarbon contaminant source
removal.
1.3 Process Description
Primary components of the groundwater remediation system include ten groundwater recovery wells
(seven of which have dual-phase capability for LNAPL recovery), two groundwater treatment systems, and
numerous LNAPL recovery wells (Figure 1). The FHRA Groundwater Remediation Operating Manual
includes a detailed description of the groundwater remediation system components and procedures for
their operation.
1 Currently this system is operated to prevent off site migration of contaminants above performance
standards and COC levels set out in the Final Onsite Cleanup Plan (OCP. ARCADIS 2014c).

2
The groundwater remediation system includes two separate treatment systems (GAC East and GAC West).
Treated groundwater from GAC East is pumped to the South Gravel Pit under Alaska Department of
Environmental Conservation (ADEC) wastewater disposal permit No. 2005 DB-0012. A discharge
monitoring report (DMR) is submitted to ADEC on a monthly basis. The GAC West system discharges
treated groundwater to the North Gravel Pit with monthly monitoring and quarterly DMR submittal to
ADEC.
1.4 Estimated Duration of Treatment System
There is currently no ACL set for sulfolane and FHRA has appealed the performance standard noted in the
2014 OCP. Given the uncertainty around the cleanup level, an estimated duration of operation for the
groundwater treatment systems cannot be calculated.
Five year reviews of the groundwater extraction and treatment systems and LNAPL recovery programs will
be documented and submitted to ADEC for review. The five year reviews will assess progress toward
cleanup objectives including system performance and exit strategy. A technical memo will be submitted to
ADEC for approval to discontinue operation of each remedial approach once it has been determined that
they are no longer necessary to meet cleanup objectives. For further information regarding closure of
remediation activity, see Sections 5.2.5 and 5.4.10 of the Final Onsite Cleanup Plan (OCP, ARCADIS 2014c).

3
2.0 Operations and Maintenance
The layout of the groundwater remediation system is depicted on Figure 1. Included on Figure 1 are wells
that recover groundwater, wells with capability to recover both groundwater and LNAPL, wells in which
LNAPL has been recovered, and the two groundwater treatment systems (GAC East and GAC West). The
remainder of this section presents the operating manual and maintenance schedule for the groundwater
remediation system.
FHRA maintains a Groundwater Remediation Operating Manual for the groundwater remediation system
which is used by FHRA operators of the groundwater remediation system. This manual is reviewed on an
annual basis and revised as necessary. In 2015, after discussions with ADEC, recovery well R-40 was
brought back into service to supplement groundwater recovery in the vicinity of R-45 due to loss of
specific capacity from fouling. The design groundwater recovery flow rates for the ten recovery wells are
shown below. The collective groundwater remediation system flow rate has been determined through a
combination of hydraulic capture modeling and groundwater level measurements that demonstrate
capture. The target flow rates listed below have been updated to reflect knowledge gained during the
past year of operation and are subject to ongoing adjustment. The effectiveness of groundwater recovery
is determined by aquifer testing and observed capture (Section 4), not by these target flow rates.
R-21 – 40 to 50 gallons per minute (gpm)
R-35R – 50 to 65 gpm
R-40 – see R-45 below
R-42 – 60 to 85 gpm
R-43 – 60 to 85 gpm
R-44 – 60 to 70 gpm
R-45 – operated in conjunction with R-40 such that the combined rates of these wells are in the
range of 50 to 65 gpm
R-46 – 30 to 40 gpm
R-47 – 55 to 80 gpm
R-48 – 80 to 120 gpm
If the combined target flow rates cannot be achieved due to limitations of a recovery well or treatment
system capacity, operations staff shall notify the FHRA Environmental Department. This notification will
trigger evaluation of measured hydraulic capture width/depth and development of a corrective action
plan for restoring the flowrate if deemed necessary. Corrective action will include:

4
1. The onsite remediation Compliance System Owner will meet with the operator on duty or
supervisor of operations with other key discipline leaders such as reliability/ third party
remediation engineer.
2. The problem will be defined and a root cause analysis performed.
3. The site operations manual will be consulted.
4. Corrective actions will be implemented.
5. Performance will be re-checked.
6. Knowledge will be captured if the problem is resolved or the problem definition process will be
restarted.
Monthly DMRs will reflect corrective actions taken. FHRA will notify ADEC of any maintenance event that
FHRA believes will impact the performance of the system. This notification will occur within 7 days of
FHRA’s knowledge of the event. FHRA will notify ADEC of any catastrophic event within 24 hours of
knowledge of the event.
FHRA will continue LNAPL recovery operations which include skimming (through both the existing
groundwater extraction system and individual skimming systems) and intermittent mechanical (e.g.,
vacuum truck) or hand recovery (e.g., hand pumps). Periodic LNAPL baildown tests will be conducted to
evaluate transmissivity and recoverability of LNAPL in accessible areas of the site per the RSAP
(Appendix A, ARCADIS, 2015a). Ongoing continuous and seasonal LNAPL skimming will recover mobile
LNAPL, reduce LNAPL mass, and support natural source zone depletion (NSZD).
FHRA staff or its consultants currently perform LNAPL baildown testing semiannually, generally in March
and late October to target water table minima. The results are then evaluated and used to optimize
mechanical recovery operations as discussed in Section 4.4. In general, the product recovery systems are
pneumatic skimmers which consist of a submersible air-driven pump, with an intake located behind a
hydrophobic filter. The intake and filter are located on a vertical slide apparatus; the density of the filter
allows the intake to be placed at the LNAPL/water interface.
The typical operational configuration of a skimming system will include the following components:
Four-inch or larger- diameter recovery well
Compressed air supply for the skimmer pump
Collection drums for the recovered product
Well houses to insulate the skimmer systems for winter operations
Wells identified for continuous LNAPL recovery will be equipped with a product recovery system and
LNAPL will be collected in a 55-gallon drum (or larger tank as needed) for recycling. During periods of
high water table elevation (generally during the summer months) when the LNAPL smear zone may be
submerged, flow of LNAPL into recovery wells is expected to be minimal and skimming may be
discontinued until groundwater elevations drop.

5
At locations where LNAPL transmissivity is found to be low, or other restrictions prevent installation of a
permanent skimmer pump, non-continuous or seasonal LNAPL skimming may be implemented.
Evaluation factors for LNAPL recovery operations are provided in Section 4.
2.1 Routine maintenance and schedule
The following table summarizes routine maintenance for the groundwater remediation system.
Groundwater Recovery Wells
Process Unit or
Equipment Maintenance Task
Frequency or
Initiation Trigger
Additional Notes on
Maintenance Activities
Recovery Wells
Inspection of recovery
wells
Every two to three
years unless reduced
pumping capacity is
observed (within 2 feet
of pump intake)
Cleaning and
redevelopment of
recovery wells
As needed, based on
inspection results
Recovery Well
Pumps
Check well pump level
As needed based on
flow rate and well
drawdown (avoid
cavitation)
Pump should be set
approximately 1 foot off the
well bottom. Setting is
controlled by support cable
Inspect well pump
condition
At least once every
16,000 hours – can be
completed during well
inspection once per
two years
Recovery Well
Flowmeters
Removal and cleaning of
meter flow tube
In response to error
messages on magnetic
flowmeter output
Wells R-42, R-47, and R-48 can
continue operating with meter
flow tube removed; use meter
bypass line in well house
Product Recovery
Skimmers
Inspect pump bladder
and repair/replace if
needed
As indicated by loss of
flow from pump or
other operational
issues

6
GAC East System
Process Unit or
Equipment Maintenance Task
Frequency or
Initiation Trigger
Additional Notes on
Maintenance Activities
Pre-filters Replace pre-filter media
Based on differential
pressure trigger of 25
psi
Continued need for the
prefilters will be evaluated
Coalescer
Change out coalescer
media
Based on differential
pressure trigger of 10
psi
Continued need for the
coalescer will be evaluated
Remove free product
accumulating in coalescer
Inspected once per
shift per operating
manual; remove as
needed and inspect
product recovery
system upstream
Continued need for the
coalescer will be evaluated
Air Strippers
Alternate off-line air
stripper units
Based on benzene,
toluene, ethyl benzene,
and xylenes (BTEX)
concentrations in
effluent of operating
units
Inspect blower condition
Completed during
downtime for saddle-
chip media
replacement
Replace air stripper
saddle-chip media
Completed when vessel
is switched to the off-
line units based on
BTEX concentrations
Gallery Pond Remove accumulated
solids from pond bottom
Inspect at the end of
every winter season
and remove solids if
needed for operation
Inspect baffle system
Inspect at the end of
winter season and
repair as needed

7
Sand Filters Replace sand media
Based on excessive
pressure drop if
treatment capacity is
limited
GAC Vessels Replace GAC media
Based on contaminant
breakthrough with
consideration of
weather conditions and
operational situation
Alternatively, GAC changeout
can be completed based on
excessive pressure drop if
treatment capacity becomes
limited. Follow FHR
procedures. A GAC change
out procedure is included in
the FHRA procedures for the
operation of the system.
GAC West System
Process Unit or
Equipment Maintenance Task
Frequency or
Initiation Trigger
Additional Notes on
Maintenance Activities
Gallery Pond
Monitoring volume in
seepage collection area
between liners
Measure depth to
water level in collection
area weekly; follow
FHRA procedure if
pump-out is required
Pumping of the seepage water
should be completed if the
water level reading in the
collection area is 5 feet (or an
angled distance to water of
about 22 feet in the
monitoring pipe)
Remove accumulated
solids from pond bottom
Inspect at the end of
every winter season
and remove solids if
needed for operation
Inspect and clean
aeration diffusers
Complete when pond
solids are being
removed
Potential plugging issues can
be identified by uneven
distribution among the four
diffusers during operation
Greensand Filter
Unit (Horizontal
Pressure Filter,
HPF)
Regeneration of
Greensand Plus media
with Potassium
Permanganate
Once per every 6-12
months (operation
dependent)
Follow FHRA procedure

8
Assessment of media
condition and recharge or
replacement of media
If high head loss
shutdown differential
pressure of 30 psi
(default value) is
reached
High head loss pressure is set
above the default differential
pressure for a backwash of 8
psi
Follow FHRA procedure for
recharge or media
replacement if needed
GAC Vessels
Replace GAC media
Based on contaminant
breakthrough, with
consideration of
weather conditions and
operational situation
Alternatively, GAC changeout
can be completed based on
excessive pressure drop if
treatment capacity becomes
limited. Follow FHRA
procedures. A GAC change
out procedure is included in
the FHRA procedures for
operation of the system.
Change process series of
GAC vessels (move lead
to former lag vessels)
In response to media
change-out in lead
vessel
Starting in A/B-C-D order;
rotate based on change-out;
order (series versus parallel)
subject to change based on
observed performance
Chemical Feed
System
Refill sodium hypochlorite
tote from delivery truck Twice per month
Frequency subject to change if
dose needs to be increased or
decreased based on operation;
follow FHRA procedure for
assisting with and observing
delivery

9
3.0 Groundwater Remediation System Performance
Monitoring
Performance of the existing groundwater remediation system is described in Section 5.4 of the OCP
(ARCADIS 2014c) and has been verified to date by:
Evaluating hydraulic capture using field measurements of groundwater levels and using the site
groundwater flow model.
Evaluating contaminant capture based on contaminant concentration trends in monitoring wells
in the vicinity of the groundwater remediation system.
Recording groundwater pumping rates from recovery wells and groundwater remediation system
up time.
Monitoring recovered groundwater quality.
Monitoring treated groundwater discharge quality per associated permits.
Measuring LNAPL transmissivity, recovery volume and rate from each well at which these
measurements or activities are completed.
Performance goals, targets, and ongoing performance monitoring for the OMM Plan are described below.
Sampling and analysis of groundwater, surface water, effluent, and water treatment media will be
performed according to the methods described in the RSAP.
3.1 Groundwater recovery performance goal and targets
The performance goal for the groundwater recovery component of the remediation system is to maintain
operation of recovery wells to maintain capture of the upgradient sulfolane plume above 15 µg/L. This
performance standard is the subject of an appeal filed by FHRA. Downtime events must be managed to
maximize recapture of any groundwater movement in the recovery zone during the downtime events.
Target flow rates for the recovery wells to achieve the performance goal are presented in Section 2.0.
3.2 Treatment system performance
FHRA will collect water samples from the influent and discharge of the two treatment systems on a
monthly basis. Samples from the GAC East system will be analyzed for sulfolane and additional
parameters required by the discharge permit (BTEX, pH, and polyaromatic hydrocarbons [PAHs]). Samples
from the GAC West system will be analyzed for sulfolane, pH, iron, manganese, and total organic carbon
(TOC) in accordance with the monitoring requirements set by ADEC. Additional samples may be collected
from either of the treatment systems as needed to evaluate performance of the individual components of
the system, or adjust monitoring parameters depending on future permit conditions.

10
The water quality data will be used to confirm that the treatment systems are effectively treating
hydrocarbon compounds (in the GAC East system) and sulfolane and to confirm compliance with the
discharge permit and monitoring requirements. Influent and discharge water quality will be presented in
the routine groundwater monitoring reports. If sulfolane breakthrough above 15 µg/L (or other
performance standard for the site when revised) or petroleum hydrocarbon breakthrough above the
ADEC Table C (18 AAC 75.345) groundwater cleanup levels occurs, corrective action will be performed as
outlined in Section 2. ADEC (Contaminated Sites project manager) will be notified within 7 days of
corrective action.
3.3 Capture zone monitoring
Monitoring of the capture zone of the groundwater recovery component of the remediation system
consists of 1) hydraulic capture estimation based on field measurements of water levels in selected
monitoring wells, and 2) contaminant capture monitoring based on the groundwater sampling from
selected monitoring wells. Details on these two aspects of the capture zone monitoring are presented
below.
3.3.1 Hydraulic capture
As proposed in the Revised Interim Remedial Action Plan Addendum (ARCADIS 2013) and the OCP
(ARCADIS 2014c), and presented in Evaluation of Recovery Well Replacement, Start-up Aquifer Testing for
Recovery System Hydraulic Capture Performance Monitoring (Barr 2013), FHRA will measure groundwater
levels in select monitoring wells and nests to evaluate the horizontal and vertical hydraulic capture of the
groundwater remediation system. The depth to groundwater will be measured and used to generate
water table elevation contour plots and plots of hydraulic heads in cross section. The capture zone extent
at the water table and in cross section will be estimated following the methods presented by Barr (2013)
and in Appendix M of ARCADIS, 2015a.
The hydraulic capture performance monitoring network is summarized in Table 1 and shown on Figure 2.
Groundwater pressure sensors with data recording units are installed in several of the wells listed in
Table 1. The pressure sensors provide continuous groundwater elevation data to evaluate variations in
groundwater elevations between measurement events.
Hydraulic capture data associated with wells pumping to the GAC East treatment system have been
collected and analyzed monthly since August 2013 (except November 2013). Recovery wells R-47 and
R-48 began operation as part of the GAC West system on June 26, 2014. The first hydraulic capture
measurement event with the expanded system in operation occurred on June 30, 2014. Hydraulic capture
data were collected and analyzed monthly for the GAC West system for 12 months, through June 2015.
The hydraulic capture data collection frequency then changed to quarterly beginning in the third quarter
of 2015. It is anticipated that frozen wells may prevent collection of the complete groundwater elevation
data set during some measurement events. Evaluation of hydraulic capture will be presented in the
routine groundwater monitoring reports.

11
3.3.2 Contaminant Capture
FHRA will collect groundwater samples for sulfolane and BTEX to evaluate contaminant capture at the
frequency shown in Table 1. In general, sulfolane monitoring will be conducted quarterly, with the
exception of locations with non-detectable concentrations for at least two consecutive quarters, in which
monitoring will be conducted semi-annually. Likewise, BTEX monitoring will typically be conducted semi-
annually with the exception of locations with non-detectable concentrations for at least two consecutive
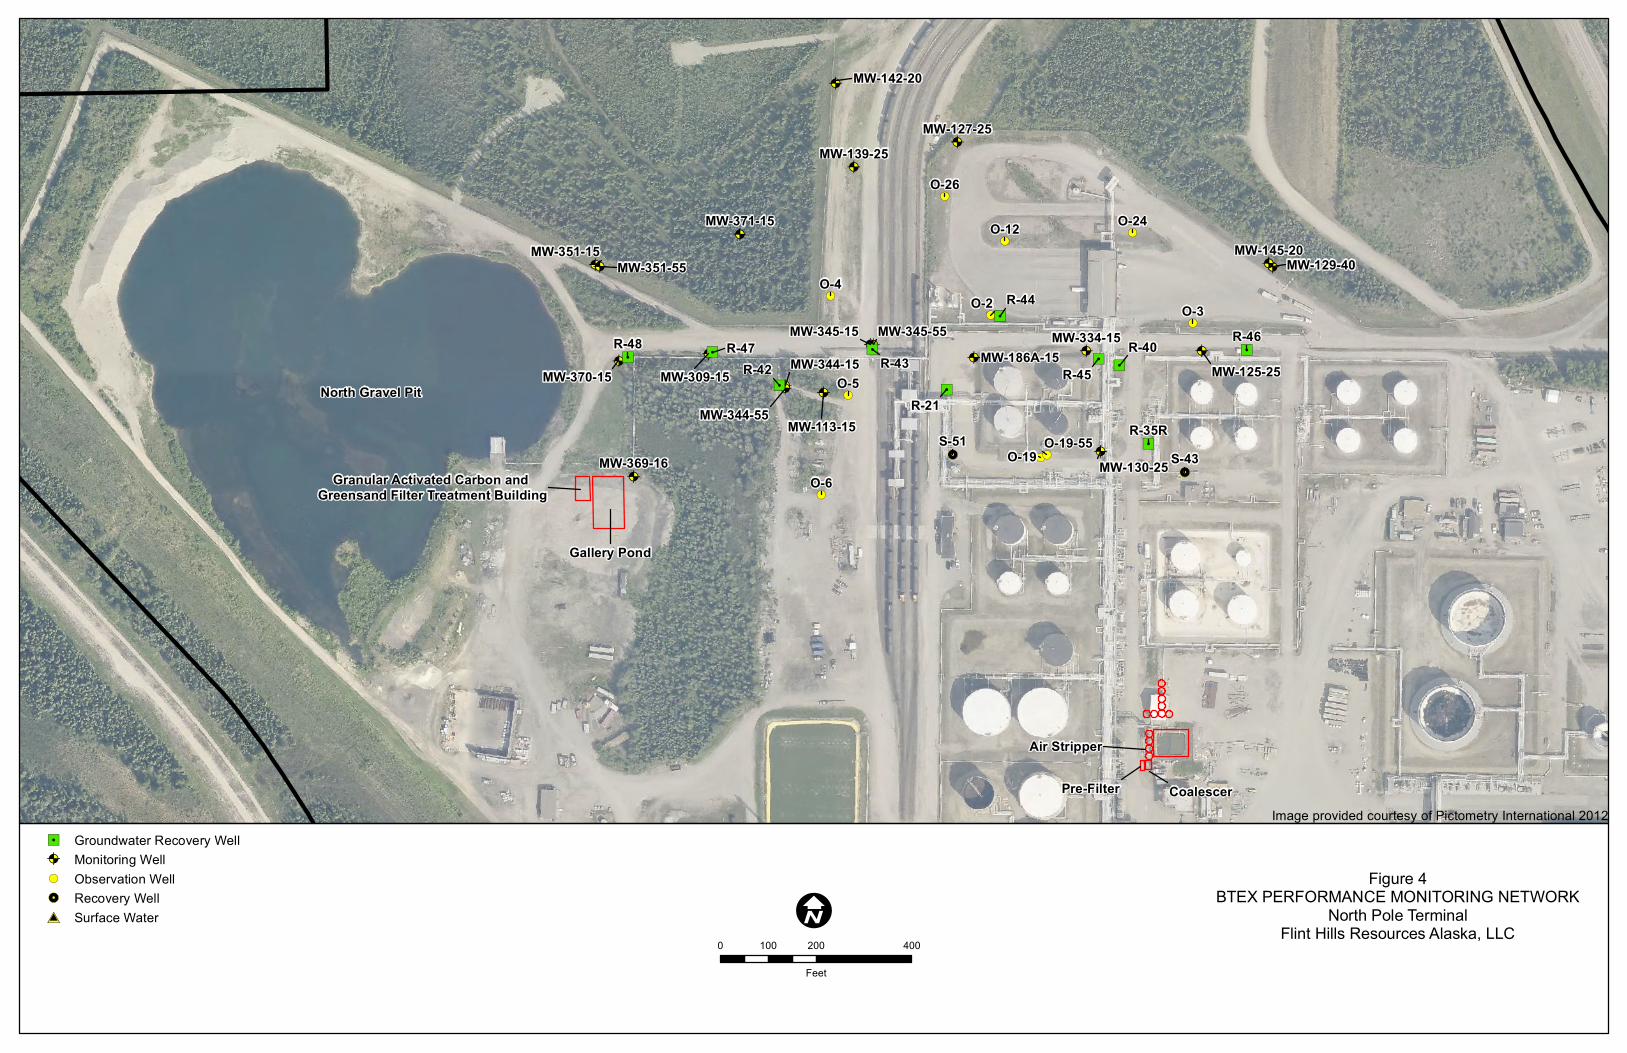
quarters, in which monitoring will be conducted annually. Monitoring well locations are shown on Figures
3 and 4, and are categorized as upgradient, within the treatment zone, and downgradient as shown in
Table 1.
In addition to the groundwater monitoring program above, FHRA will collect groundwater samples
quarterly from all active groundwater recovery wells. Groundwater samples from the recovery wells will be
submitted for BTEX and sulfolane analysis. The groundwater quality data from the recovery wells provides
another line of evidence that the groundwater recovery component of the remediation system is
capturing contaminants.
Evaluation of contaminant capture will be presented in the routine groundwater monitoring reports.
3.4 LNAPL Recovery Performance Monitoring
The OCP (ARCADIS 2014c) specifies that LNAPL transmissivity and LNAPL recovery volumes and rates will
be used as metrics to evaluate the performance and effectiveness of LNAPL recovery operations.
LNAPL monitoring wells and schedules are included in Tables 3-2 and 3-3 and Figures 3-5 and 3-6 of the
LTM Plan – 2015 Update (ARCADIS 2015c). Monitoring results from these networks will identify candidate
wells at which LNAPL transmissivity testing may be completed. Results of transmissivity testing, either
from skimming or baildown testing, are used to select wells for LNAPL recovery. Future modifications to
the LNAPL recovery system are discussed in Section 4.4. Data gathered from the LNAPL migration
monitoring network and LNAPL thickness monitoring will be used to evaluate the locations within the
monitoring network and their respective frequencies. This evaluation and subsequent adjustments to the
network will be completed on an annual basis. Changes to the LNAPL monitoring program will be
documented in future revisions to the LTM Plan.
3.4.1 Light Nonaqueous Phase Liquid Transmissivity
LNAPL transmissivity will be calculated from data collected during baildown testing and manual and
automated skimming in accordance with the RSAP (which includes a detailed description of the data to be
used and relevant definitions). Baildown testing is attempted semi-annually in wells within the LNAPL
monitoring network in which an LNAPL accumulation of 0.5 feet or greater is present. An LNAPL baildown
test is initiated by quickly removing accumulated LNAPL from a well. The rate of LNAPL flow into the well
is a function of the soil and LNAPL properties and the magnitude of the initial hydraulic gradient toward
the well developed during LNAPL removal. The baildown test response is influenced by the prevalent fluid
levels at the time of testing. A routine LNAPL baildown test program has been initiated that will measure
the range of LNAPL transmissivity under different fluid level conditions.

12
Groundwater levels will be recorded during LNAPL transmissivity testing events and compared to seasonal
water levels in the monitoring reports. A representative graph of groundwater table elevation from a
nearby well with a pressure transducer will be provided to show relative water level, if available.
LNAPL transmissivities calculated from baildown test and/or skimming data will inform and determine the
method of LNAPL recovery operations for each well as discussed above. LNAPL transmissivity
measurement and data analysis methods are consistent with the Standard Guide for Estimation of LNAPL
Transmissivity (ASTM International 2012).
3.4.2 Light Nonaqueous Phase Liquid Recovery Volume
LNAPL recovery volumes from individual recovery systems will be used as a performance metric to assess
the effectiveness of LNAPL recovery. Recoverability of LNAPL generally decreases as remediation
progresses and as the volume of recoverable LNAPL decreases. Each recovery system will be monitored to
track the volume of product recovered. The locations of the individual systems are modified, as necessary,
to relocate the systems to wells with the highest recovery potential.

13
4.0 Performance Monitoring Evaluation
Criteria for future modifications to the groundwater remediation system include system components,
sampling frequency, and/or number of sample locations, and are presented in this section.
4.1 Treatment system performance
For the two treatment systems (GAC East and GAC West), FHRA will evaluate the treatment system
performance by evaluating analytical results against the requirements of the applicable discharge permit.
FHRA intends to continue monitoring and reporting in accordance with the discharge permit and DMR
requirements. The frequency of additional sampling and analysis completed by FHRA to evaluate system
performance may be increased or decreased based on the reliability and effectiveness of the treatment
system components.
If the discharge monitoring indicates inadequate treatment, FHRA will resample to determine if the
problem is a short-term deviation or a long-term issue. In the case of a long-term issue, FHRA will
evaluate potential modifications or enhancements to the treatment systems.
FHRA continues to review the system effectiveness, reliability, and ease of operation. FHRA will review
and consider the potential effect operational changes would have towards meeting treatment system
goals.
4.2 Hydraulic capture performance
The methods and current and future frequency of hydraulic capture performance monitoring of the
groundwater water recovery and treatment systems are described in Section 3.3.1. If the hydraulic capture
monitoring continues to indicate consistent capture, the frequency of the evaluation will be reassessed.
Annual hydraulic capture zone evaluations may be adopted in the future.
Maintaining the target pumping rates described in Section 2.0 and meeting the contaminant capture
performance criteria described below (Section 4.3) are also indicators of hydraulic capture. If the target
pumping rates cannot be maintained on a consistent basis or the contaminant capture performance
criteria are not met (considering seasonal variations), the frequency of hydraulic capture zone monitoring
will be reassessed. If hydraulic capture monitoring and contaminant capture monitoring (discussed in
Section 4.3) indicate capture at reduced flow rates, FHRA will evaluate reductions of the target flow rate
ranges as described in Section 2.0.
Prior to any adjustment, a pre-scoping meeting will be held if FHRA deems it necessary. Upon request by
FHRA to modify evaluation frequency, ADEC will act upon the request within thirty days provided the
submittal is complete.
4.3 Contaminant capture performance
The current and future frequency of contaminant capture performance monitoring of the groundwater
water recovery and treatment systems are described in Section 3.3.2. Over time, the number of

14
monitoring locations and the frequency of monitoring will be modified on a well by well basis using the
criteria described below. Recently installed wells were monitored for four quarters before applying these
criteria.
If sulfolane or BTEX concentrations in the downgradient locations continue to decline over time (after
taking seasonal variations into account), a reduction in the number of monitoring locations and the
frequency of monitoring may be proposed for ADEC review. Prior to any adjustment, a pre-scoping
meeting will be held if FHRA deems it necessary. Upon request by FHRA to modify evaluation frequency,
ADEC will act upon the request within thirty days provided the submittal is complete. If sulfolane or BTEX
concentrations in the downgradient locations show consistent increases over time, without indications of
seasonal decreases, a corrective action plan for addressing the situation will be prepared and submitted to
ADEC for review. The scope of corrective action will depend on the conditions at the time. Monitoring
schedule and frequency will be reevaluated on an annual basis and results of the evaluations will be
provided annually in the groundwater monitoring reports or more frequently, if appropriate.
4.4 LNAPL recovery performance
The results of performance monitoring will be used as criteria to evaluate potential future modifications to
the LNAPL recovery system. Modifications may include expansion or reduction in locations with LNAPL
recovery. The LNAPL monitoring network is defined in the most current version of the LTM Plan (LTM
Plan – 2015 Update, ARCADIS 2015c) and will be reviewed annually and changes to the monitoring
locations and their respective frequencies will be made according to the criteria presented in the LTM Plan
– 2015 Update. Proposed changes will be submitted to ADEC for its review if there are any deviations
from the criteria in the LTM Plan - 2015 Update.
In accordance with the RSAP (which includes a detailed description of the data to be used and applicable
definitions), if LNAPL in a well increases to a thickness that is greater than 0.5 feet, transmissivity testing
will be completed. Conversely, if the thickness of LNAPL decreases below 0.5 feet, it will not be tested for
transmissivity. Manual recovery will be initiated in wells with LNAPL thicknesses greater than 0.5 feet.
The results of transmissivity testing and LNAPL recovery volumes will be used to determine which wells
will be added or removed from the LNAPL recovery network. The Interstate Technology and Regulatory
Council (ITRC) suggests as 0.1 to 0.8 square feet per day (ft2/day) as the LNAPL recoverability threshold for
beneficial reduction in overall LNAPL mass. FHRA has evaluated wells in its LNAPL recovery network for
transmissivity and based on site specific characteristics has determined that 0.8 ft2/day, is the appropriate
transmissivity level to initiate mechanical recovery of LNAPL in wells. For a well that has not previously
contained LNAPL, an evaluation of the transmissivity will be undertaken.
Manual LNAPL recovery efforts will be suspended when LNAPL thicknesses decrease to less than 0.5 feet.
Wells that are removed from routine LNAPL recovery operations will be monitored for 3 years. LNAPL
monitoring changes proposed in future OMM Plan updates will consider at least 3 years of monitoring
data.

15
LNAPL recovery rates and volumes will be monitored. The locations and frequency of monitoring of the
individual systems may be modified, if necessary, to relocate the systems to wells with the highest
recovery potential.

16
5.0 Documentation of Changes to OMM Plan
Modifications to the performance monitoring networks, the LNAPL Transmissivity Testing Networks, and
schedules have been documented in this OMM Plan – 2015 Update. The OMM Plan will be updated as
necessary and submitted as a stand-alone document at least annually. The RSAP was updated and
submitted as Appendix A of the Fourth Quarter 2014 Groundwater Monitoring Report (ARCADIS, 2015a).
The RSAP only describes sampling methodologies and procedures; schedules and monitoring networks
pertaining to system performance are presented and updated in the OMM Plan and LTM Plan.

17
6.0 OMM Reporting Schedule
System performance results will continue to be reported in semi-annual groundwater monitoring reports
that will be submitted on or before July 31st and January 31
st of each year and will include an overview and
evaluation of system performance.
18
7.0 References
ARCADIS U.S., Inc. 2013. Revised Interim Remedial Action Plan Addendum. July 31, 2013.
ARCADIS U.S., Inc. 2014b. Flint Hills Resources Alaska, LLC North Pole Refinery, Long-Term Monitoring
Plan. October 2014
ARCADIS U.S., 2014c. Flint Hills Resources Alaska, LLC Final Onsite Cleanup Plan. North Pole Refinery,
North Pole, Alaska. October 2014
ARCADIS, 2015a. Flint Hills Resources Alaska, LLC Fourth Quarter 2014 Onsite Groundwater Monitoring
Report. North Pole Refinery, North Pole, Alaska. DEC File Number: 100.38.090. January 30, 2015.
ARCADIS, 2015b. First Semiannual 2015 Onsite Groundwater Monitoring Report, North Pole Terminal,
North Pole, Alaska. DEC File Number: 100.38.090. July 31, 2015.
ARCADIS, 2015c. Flint Hills Resources Alaska, LLC North Pole Refinery, Long-Term Monitoring Plan – 2015
Update. December 2015.
ASTM International 2012, Standard Guide for Estimation of LNAPL Transmissivity.
Barr Engineering Company. 2013. Evaluation of Recovery Well Replacement, Start-up Aquifer Testing for
Recovery System Hydraulic Capture Performance Monitoring. August 2013.

Tables

O-2
MW-130-25 (quarterly) MW-130-25 (semi-annual) O-3
MW-175-90 (semi-annual) S-43 (semi-annual) O-4
S-43 (quarterly) MW-369-16 (annual) O-5, O-5-65
MW-369-16, MW-369-55, MW-369-75 (quarterly) O-6 (annual) O-6, O-11
O-6 (quarterly)O-19 (semi-annual), O-19-55
(annual)O-12, O-12-65
O-19, O-19-55 (quarterly), O-19-90 (semi-annual) S-51 (semi-annual) O-13, O-17, O-18
S-51 (quarterly) O-19, O-19-55, O-19-90
O-24, O-24-65
O-32
MW-113-15 (quarterly) MW-113-15 (semi-annual) S-32
MW-125-25 (semi-annual) MW-125-25 (semi-annual) S-39
MW-186A-15, MW-186B-60, MW-186E-75 (quarterly) MW-186A-15 (semi-annual) S-43
MW-199-150 (semi-annual) MW-309-15 (annual) S-44
MW-309-15 (quarterly), MW-309-66 (semi-annual) MW-334-15 (semi-annual) S-50
MW-334-15, MW-334-65 (quarterly)MW-344-15 (annual), MW-344-
55 (semi-annual)S-51
MW-344-15, MW-344-55 (quarterly), MW-344-75
(semi-annual)
MW-345-15, MW-345-55
(annual)R-14A
MW-345-15, MW-345-55, MW-345-75 (quarterly) MW-370-15 (annual) R-18
MW-370-15 (semi-annual), MW-370-55 (semi-
annual), MW-370-75 (semi-annual)O-2 (semi-annual) R-22
O-2 (quarterly) O-3 (semi-annual) R-39
O-3 (semi-annual) O-5 (semi-annual) MW-113-15
O-5, O-5-65 (quarterly) MW-125-25
MW-130-25
MW-135-20
MW-127-25 (quarterly) MW-127-25 (annual) MW-136-20
MW-129-40 (semi-annual) MW-129-40 (annual) MW-137-20MW-139-25 (quarterly) MW-139-25 (semi-annual) MW-174-15, MW-174A-50, MW-174B-90MW-142-20 (quarterly) MW-142-20 (annual) MW-175-90
MW-145-20 (semi-annual) MW-145-20 (annual)MW-186A-15, MW-186B-60, MW-186C-
100, MW-186D-135, MW-186E-75
MW-154A-75, MW-154B-95 (quarterly)MW-351-15, MW-351-55
(annual)MW-197A-65, MW-197B-150
MW-351-15 (quarterly), MW-351-55 (semi-annual),
MW-351-75 (semi-annual), MW-351-150 (semi-
annual)
MW-371-15 (annual) MW-199-150
MW-371-15, MW-371-55, MW-371-75 (quarterly),
MW-371-125 (semi-annual)O-4 (semi-annual) MW-301-70
O-4 (quarterly) O-12 (semi-annual) MW-304-15, MW-304-150
O-12 (quarterly), O-12-65 (semi-annual) O-24 (semi-annual) MW-306-15, MW-306-150
O-24 (quarterly), O-24-65 (semi-annual) O-26 (annual) MW-307-150
O-26 (quarterly), O-26-65 (semi-annual) MW-309-15, MW-309-66
MW-310-15, MW-310-110MW-334-15, MW-334-65, MW-334-85MW-369-16, MW-369-55, MW-369-75
MW-370-15, MW-370-55, MW-370-75MW-351-15, MW-351-55, MW-351-75,
MW-351-150MW-344-15, MW-344-55, MW-344-75MW-345-15, MW-345-55, MW-345-75MW-371-15, MW-371-55, MW-371-75,
MW-371-125
Table 1
Performance Monitoring Well Network
Groundwater Remediation System Operations, Maintenance and Monitoring Plan
Flint Hills North Pole Terminal
North Pole, Alaska
Groundwater Extraction System - Sulfolane
Monitoring (frequency)
Groundwater Extraction
System - BTEX Monitoring
(frequency)
Groundwater Extraction System -
Hydraulic Capture (Quarterly)†
Upgradient
Within the Treatment Zone
Downgradient
Page 1 of 2

Table 1
Performance Monitoring Well Network
Groundwater Remediation System Operations, Maintenance and Monitoring Plan
Flint Hills North Pole Terminal
North Pole, Alaska
Groundwater Extraction System - Sulfolane
Monitoring (frequency)
Groundwater Extraction
System - BTEX Monitoring
(frequency)
Groundwater Extraction System -
Hydraulic Capture (Quarterly)†
North Gravel PitNotes:
†Hydraulic capture data were collected and analyzed monthly through June 2015. The hydraulic capture data collection frequency
then changed to quarterly beginning in the third quarter of 2015.
BTEX = benzene, toluene, ethylbenzene, total xylenes
Page 2 of 2

Figures

!
!
!
!!
!
!
!
!
!
!
! !
!
!!
!
!!
!
! !
!
!
!
!!
!.
!.
!.
!.
!.
!.
!A
!A
!. !(
!(
!(!(
!(
!A
!(
!(
!(
!(!.
"/
"/
"/
"/
"/
"/
"/"/"/"/
Gallery Pond
Granular ActivatedCarbon Vessels
Pre-Filter Coalescer
Sand Filters
Granular Activated Carbon and Greensand Filter
Treatment BuildingGallery Pond
North Gravel Pit
OriginalGroundwater
Treatment System
ExpandedGroundwater
Treatment SystemGAC West
GAC East
R-40
O-38
O-34
O-33
O-31
O-21
O-13O-11
O-19
O-10
R-32
S-51S-50
S-44S-39
S-22R-32R
R-20R
MW-334-15
MW-138-20
MW-176A-15
R-48 R-47 R-46
R-44
R-43
R-42 R-21
R-35R
R-45
"/ Groundwater Recovery Well!A Monitoring Well!. Recovery Well!( Observation Well!
Manual Product Recovery Location (ThirdQuarter 2014 - Second Quarter 2015)
!Installed Product Recovery System (or capabilityfor system if sufficient product is present)Remediation System PipingFHRA Property Boundary
Figure 1GROUNDWATER REMEDIATION
SYSTEM LAYOUTNorth Pole Terminal
Flint Hills Resources Alaska, LLC0 200 400100
Feet
I
Image provided courtesy of Pictometry International 2012

!.
!.
!.
!.
!.
!.
!.
!.
!.
!A
!A
!A
!A !A
!A
!A!A
!A
!A!A
!(!(
!(
!A!A
!A!A
!A
!A!(
!(
!(
!(
!(
!(!( !(
!(
!.
!A
!A
!A!A!A
!A
!A
!A
!A!A
!A!A
!A
!A!A!A!A
!(
!(
!(!A!A!A
!A!A!A!A!A!A
!(
!(!(
!A
!A!A!A
!A!A!A!A
"/
"/
"/
"/
"/
"/
"/"/"/"/
#*#
Pre-Filter Coalescer
Air Stripper
Granular Activated Carbon and Greensand Filter Treatment Building
Gallery Pond
North Gravel Pit
MW-304-15
MW-306-15
O-6
O-5
O-4O-3O-2
O-32R-22
O-24O-12O-11
O-19
R-40R-39
R-18
S-51S-50
S-44S-43
S-32
R-14A
O-5-65
MW-307-150MW-199-150
MW-175-90
MW-137-20
MW-136-20
MW-130-25
MW-125-25
O-19-90
O-12-65O-24-65
MW-197A-65
MW-186E-75
MW-186D-135
MW-186C-100
MW-174B-90MW-174A-50
MW-371-75MW-371-55 MW-371-15
MW-369-75 MW-369-55MW-369-16
MW-370-75
MW-370-55MW-370-15
MW-345-75
MW-345-15
MW-344-55
MW-351-75MW-351-15
MW-174-15
MW-310-15
MW-309-15
MW-301-70
MW-351-150
MW-310-110
MW-371-125
MW-334-15MW-334-65
MW-309-66MW-351-55
MW-344-15
MW-344-75
MW-345-55 MW-186B-60
MW-186A-15MW-197B-150
O-19-55MW-113-15
MW-135-20S-39
MW-304-150
MW-306-150
MW-334-85
O-13
O-17
O-18
R-45
R-44
R-21
R-35R
R-42 R-43R-46
R-47R-48
North Gravel Pit
"/ Groundwater Recovery Well!. Recovery Well!( Observation Well!A Monitoring Well#*# Surface Water
Figure 2HYDRAULIC CAPTURE ZONE PERFORMANCE
MONITORING NETWORKNorth Pole Terminal
Flint Hills Resources Alaska, LLC0 250 500125
Feet
I
Image provided courtesy of Pictometry International 2012

!.
!.
!A
!A
!A
!A
!A
!A
!A
!A
!A!A
!A
!A
!(!(
!(
!A
!A!(
!(
!(
!(!(
!(
!A!A!A!A!A
!A!A!A!A
!(
!(
!(!A!A!A
!A!A!A
!A!A!A
!(
!(!(
!A!A!A
!A!A!A!A
"/
"/
"/
"/
"/
"/
"/"/"/"/
Pre-Filter Coalescer
Air Stripper
Granular Activated Carbon and Greensand Filter Treatment Building
Gallery Pond
North Gravel Pit
MW-142-20
R-40R-45
R-44
R-21R-35R
R-42R-43
R-46R-47R-48
O-6
O-5
O-4O-3O-2
O-26O-24O-12
O-19S-51
S-43
O-5-65MW-199-150
MW-175-90
MW-145-20
MW-139-25
MW-130-25
MW-127-25
MW-125-25
O-19-90
O-12-65
O-26-65O-24-65
MW-186E-75
MW-186A-15MW-186B-60
MW-154B-95MW-154A-75
MW-371-75MW-371-55 MW-371-15
MW-369-75 MW-369-55MW-369-16
MW-370-75MW-370-15
MW-345-75MW-345-15
MW-344-55
MW-351-75MW-351-15
MW-334-65
MW-351-150MW-371-125
MW-334-15MW-309-15MW-309-66
MW-351-55
MW-344-15
MW-344-75
MW-345-55MW-370-55
O-19-55
MW-113-15
MW-129-40
"/ Groundwater Recovery Well!A Monitoring Well!( Observation Well!. Recovery Well#*# Surface Water
Figure 3SULFOLANE PERFORMANCE MONITORING NETWORK
North Pole TerminalFlint Hills Resources Alaska, LLC
0 200 400100
Feet
I
Image provided courtesy of Pictometry International 2012
!.
!.
!A
!A
!A
!A
!A
!A
!A
!A
!(!(
!(
!A
!(
!(
!(
!(!(
!(
!A!A
!A!A
!A!A
!A!A
!A
!(
!A
!A
"/
"/
"/
"/
"/
"/
"/"/"/"/
Pre-Filter Coalescer
Air Stripper
Granular Activated Carbon and Greensand Filter Treatment Building
Gallery Pond
North Gravel Pit
MW-142-20
R-45
R-44
R-21R-35R
R-42 R-43R-46R-47R-48
O-6
O-5
O-4O-3O-2
O-26
O-24O-12
O-19S-51
S-43O-19-55
MW-371-15
MW-369-16
MW-370-15
MW-345-55MW-345-15
MW-351-55MW-351-15
MW-309-15
MW-334-15
MW-145-20
MW-139-25
MW-130-25
MW-127-25
MW-125-25
MW-113-15
MW-186A-15
MW-129-40
MW-344-15
MW-344-55
R-40
"/ Groundwater Recovery Well!A Monitoring Well!( Observation Well!. Recovery Well#*# Surface Water
Figure 4BTEX PERFORMANCE MONITORING NETWORK
North Pole TerminalFlint Hills Resources Alaska, LLC
0 200 400100
Feet
I
Image provided courtesy of Pictometry International 2012

Attachment 1
Revisions to the OMM Plan

1-1
Attachment 1
Revisions to the OMM Plan
Flint Hills Resources North Pole Terminal
North Pole, Alaska
Date of
Revisions to the
OMM Plan
Sections
Revised Representative Topic Description of Changes
November 2015 Section 2.0 Addition of R-40 as
active recovery well
and adjustments to
target pumping rates.
Operation of R-40 has been initiated
and the target flow rate at R-45 is
noted to include the combined total
with R-40. The maximum target
pumping rate of well R-44 was
reduced based on actual
performance. Lower pumping rates
have been adopted for wells R-47
and R-48.
November 2015 Section 3.3.1 Hydraulic capture
monitoring network
listed in Table 1 and
shown on Figure 2
Recovery well R-40 is now actively
pumped, therefore nearby well S-39
was added to provide a proxy
groundwater elevation for R-40. Well
MW-301-CMT-10 was dropped from
the list. Water levels in the following
wells not listed in Table 1 of the
OMM-2014 are also measured,
therefore were added to the list: MW
304-150, MW 306-150, MW-334-85,
O-13, O-17, and O-18.
November 2015 Section 3.3.2 Performance
monitoring network
monitoring frequency
In accordance with the evaluation
criteria in Section 4.3, the monitoring
frequency will be reduced in wells
with non-detectable concentrations
from quarterly to semi-annually for
sulfolane, and from semi-annual to
annual for BTEX.
November 2015 Section 3.4 LNAPL Monitoring
Network
Remove Table 2 and indicate that
description of the current LNAPL
monitoring network will be
maintained in the LTM Plan.

Date of
Revisions to the
OMM Plan
Sections
Revised Representative Topic Description of Changes
November 2015 Section 3.4.1 LNAPL Transmissivity
testing
Clarify that LNAPL transmissivity
testing will be completed at
monitoring wells with greater than
0.5 feet for the first time.
November 2015 Section 4.4 LNAPL recovery Clarify process for evaluating if
LNAPL recovery is appropriate is
based on transmissivity testing and
recovery performance.