operations research and simulation models for...
TRANSCRIPT

DEPT. OF STATISTICS AND OPERATIONS RESEARCH PUBLIC UNIVERSITY OF
NAVARRE, SPAIN
ROLLA 2011
Operations Research and Simulation Models for Managing Mixed Renewable Energy Systems
DEPT. OF ENGINEERING
MANAGEMENT AND SYSTEMS ENGINEERING
MISSOURI UNIVERSITY OF SCIENCE AND TECHNOLOGY
FERMÍN MALLOR

FIRST, LET ME INTRODUCE THE PUBLIC UNIVERSITY OF NAVARRE,AND PAMPLONA

OUTLINE PART 1 : INTRODUCTION TO OPERATIONS RESEARCH AND SIMULATION
What Operations Research Is?. Applications of the Operations Research
Steps in an Operations Research study
Valid and credible simulation models
PART 2: CASE STUDY. A SIMULATION MODEL FOR THE ASSESSMENT OF ENERGY PRODUCTION
Renewal sources of energy. A storage system to control the output energy
Determining near-optimal management policies
Building a simulation model
Re-thinking the management policies
Modeling the peaking management strategy
Software and results
PART 3: DISCUSSION

What Operations Research Is?. Concept and origin
Operations research (O.R.) is the discipline of applying advanced analytical methods to help make better decisions.
Operations Research (OR) started during World War II to study the strategic and tactical problems involved in military operations. The objective was to find the most effective utilization of limited military resources by the use of quantitative techniques.
It combines mathematics, statistics, computer science, physics, engineering, economics, and social sciences to solve real-world problems in industry, bussines and administration.
Following the war, numerous peacetime applications emerged, leading to the use of OR in many industries and services.
Operations Research is a discipline sitting at an intersection of mathematics, industrial engineering, statistics and computer science.

What Operations Research Is?. Applications of the Operations Research
Examples of applications in industry and services •Strategic planning and dimensioning •Supply chain management •Logistics and site location. Vehicle routing •Inventory control. Warehouse design •Delivery transport mode selection •Capacity and manpower planning •Production scheduling •Pricing and revenue management •Risk analysis
Working in OR includes both the application of past research results and new research to develop improved solution methods.
Focus on
Real applications
Methodology development
Industrial Engineering Management Science Computer Science Mathematics, Statistics
http://www.scienceofbetter.org/can_do/success_stories.htm
http://www.scienceofbetter.org/Edelman/winners.htm

What Operations Research Is? Real problems addressed by my research team
-Production scheduling in a steel factory (AMPO- Grupo Mondragón) -Quality of service of antennas for mobile telephony (Vodafone) - Logistics for collecting windshields (Reciclauto-Desguaces Santa Olalla) - Capacity planning of the Intensive Care Unit of the Hospital of Navarre - Dimensioning and management of hybrid renewable energy systems
- Planning dams and chanels for the Aragón-Gállego river system (G. Aragón) -Routing for collecting old-tires in Navarre (Cámara de comercio) - Dimensioning a plant for the recycling of out-of-use vehicles (Reciclauto S. A.)
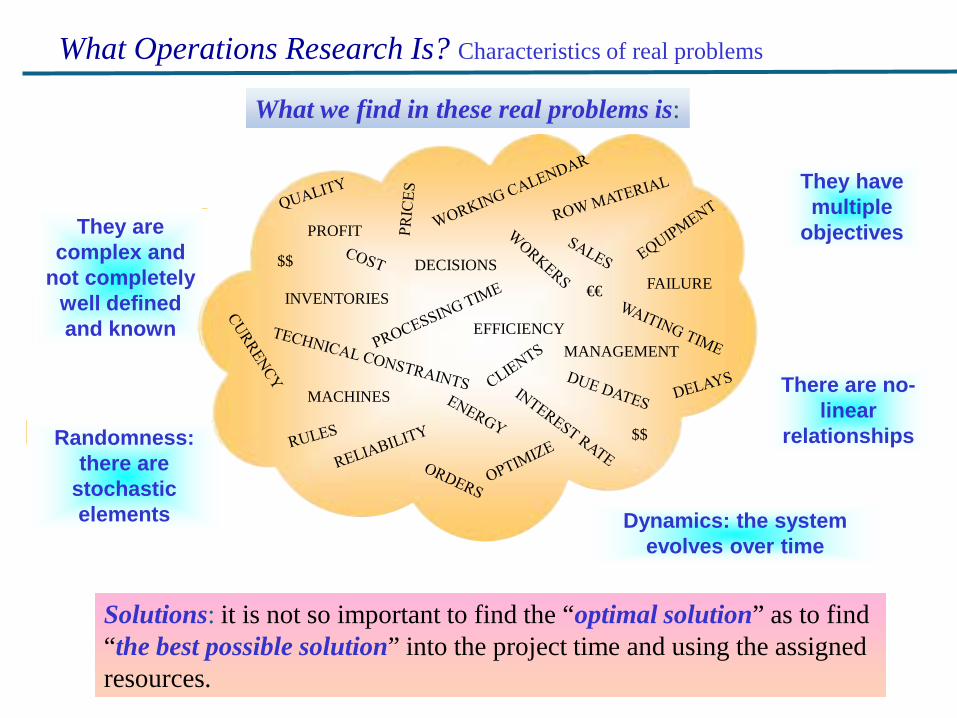
What we find in these real problems is:
Solutions: it is not so important to find the “optimal solution” as to find “the best possible solution” into the project time and using the assigned resources.
What Operations Research Is? Characteristics of real problems
They are complex and
not completely well defined and known
They have multiple
objectives
There are no-linear
relationships Randomness: there are
stochastic elements Dynamics: the system
evolves over time
EFFICIENCY MANAGEMENT
INVENTORIES
MACHINES
PROFIT
DECISIONS FAILURE
$$
€€
$$

Real Problem Real Problem Solution
Real Problem Model
Mathematic Model
Modelling phase
Mathematical Model Solution
Algebraic/numerical solution
Simulation
Implementation
Validation & Verification
Valid
atio
n
A SUCCESSFUL SIMULATION PROJECT IS ONE THAT DELIVERS USEFUL INFORMATION AT THE APPROPRIATE
TIME TO SUPPORT A MEANINGFUL DECISION
Cre
dibi
lity
Steps in an Operations Research study

A simulation model is a representation of a real system that can be implemented on a computer.
The purpose of a simulation model is to experiment with it instead of experimenting with the real system (too expensive, it does not exist, not ethic, etc).
The information obtained by running the simulation model is used to make decisions concerning the real system.
It is necessary a strong resemblance between both, the real system and the
simulation model.
Simulation model
Information Decisions
Real system
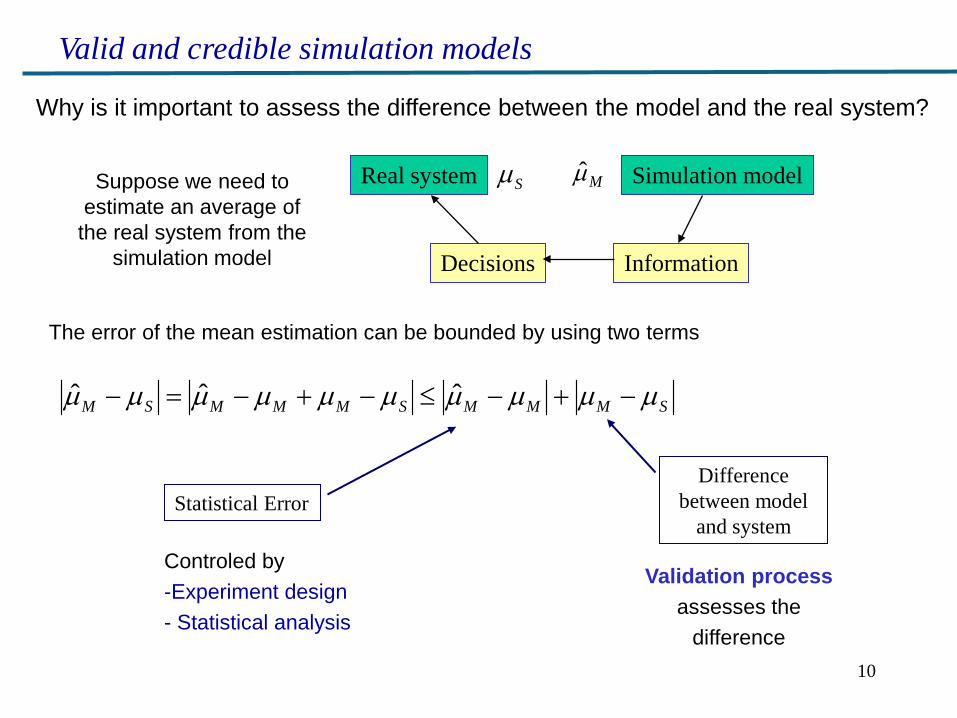
Valid and credible simulation models
10
Mµ̂Sµ
SMMMSMMMSM µµµµµµµµµµ −+−≤−+−=− ˆˆˆ
The error of the mean estimation can be bounded by using two terms
Validation process assesses the
difference
Statistical Error Difference
between model and system
Valid and credible simulation models
Why is it important to assess the difference between the model and the real system?
Simulation model
Information Decisions
Real system Suppose we need to estimate an average of
the real system from the simulation model
Controled by -Experiment design - Statistical analysis

Validation is the process of determining whether a simulation model is an accurate representation of the system, for the particular objectives of the study.
A “valid” model can be used to make decisions similar to those that would be made if it were feasible and cost-effective to experiment with the system itself
A simulation model should always be developed for a particular set of objectives. In fact, a model that is valid for one objective may not be for another.
Valid and credible simulation models

12
Methods to validate simulation models
There exist historical data
- Statistical techniques to compare output simulation data with historical data
With big samples there is a high probability of rejecting the model, although it is a good one, while with small samples the probability of acceptance is high although the model is a bad one.
- Expert assessment of the similarities between historical data and output simulation data (Touring Test)
- Experts make judgements about the assumed hypothesis, logical relationships, results, etc.
Valid and credible simulation models
There exist no historical data
0
2
4
6
8
10
12
14
16
18
Fre
cu
en
cia
1 3 5 7 9 11 13 15 17 19Número de camas ocupadas
Ocupación real
Ocupación modelo base

A simulation model and its results have credibility if the decision-maker accepts them as “correct.”
A credible model is not necessarily valid, and vice-versa.
Elements that provide credibility to a model: • The decision-maker’s understanding of
and agreement with the model’s assumptions
• Demonstration that the model has been validated and verified
• The decision-maker’s ownership of and involvement with the project
• Reputation of the model developers • A compelling animation.
Valid and credible simulation models

Case study Modeling hybrid renewable energy systems
for their economic assessment
OUTLINE Renewal sources of energy. A storage system to control the output energy
Determining near-optimal management policies
Building a simulation model
Re-thinking the management policies
Modeling the peaking management strategy
Software and results

23222120191817161514131211109876543210
HOUR, period 24
14,00
12,00
10,00
8,00
6,00
4,00
2,00p
rice
DAY, not periodic: 332
Energy prices ECONOMIC POINT OF VIEW Prices vary over time, but also depend on whether or not the amount to be sold has been pre-committed (the day before) In the case of a pre-commitment the price is higher If the agreed amount is ultimately not supplied then a penalty has to be paid When more than the agreed amount is supplied then the surplus has a lower price
ENERGY
Randomness in the input (renewal energy source) Random output
Low supply commitment (Sale of energy to lower prices)
Is it possible to control the output?
Is it possible to guarantee, in advance, the supply of energy?
THE PROBLEM
Introduction. Renewal sources of energy
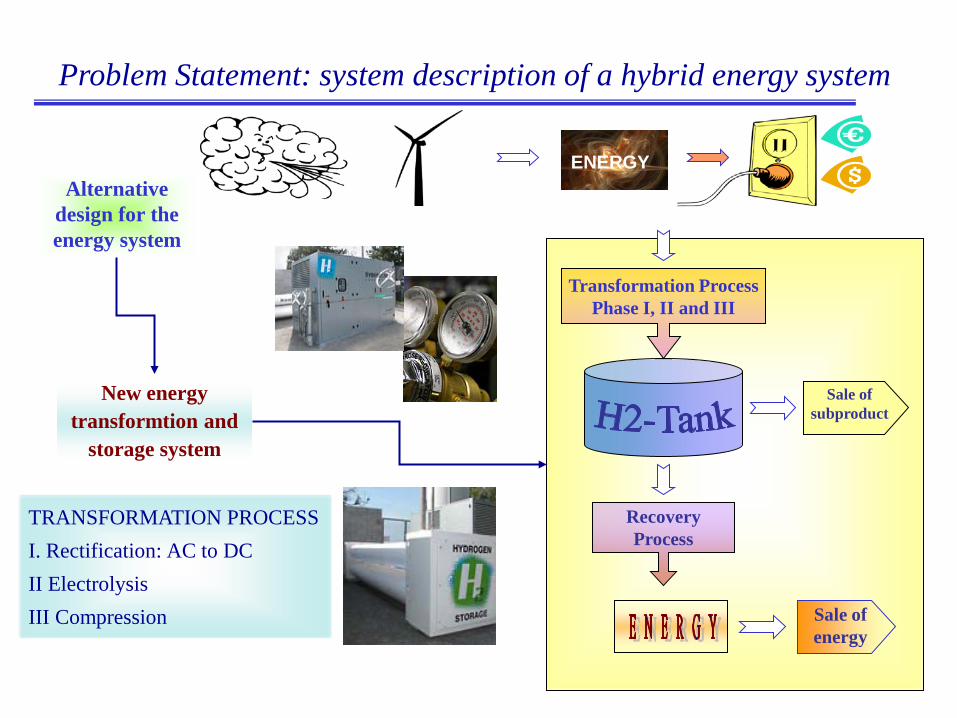
Problem Statement: system description of a hybrid energy system
Alternative design for the energy system
Sale of
subproduct
Recovery Process
Transformation Process Phase I, II and III
Sale of energy
New energy transformtion and
storage system
TRANSFORMATION PROCESS I. Rectification: AC to DC II Electrolysis III Compression
ENERGY

Selling of Subprod. 2
Selling of Subprod. 1
COMPRESSION
ELECTROLYSIS
AC -> DC
Recovery Process
Efficiency loss
Problem Statement: system description (MAIN DRAWBACK)
Sale of energy
MAX_CAP
Ef(C)
Minimum input to start INPUT
c
EFFI
CIE
NC
Y
MAX_INPUT Minimum input
INPUT
c
OU
TPU
T
ENERGY

Problem Statement: OBJECTIVES
MOTIVATION FOR THE ENERGY COMPANY
Randomness in the input (renewal energy source)
Random output
Low supply commitment (Sale of energy to lower prices)
Is it possible to control the output?
Is it possible to guarantee, in advance, the supply of energy?
OBJECTIVES
1. To study the economical viability of the original energy system expanded with a transformation storage system.
2. To dimension the system in an optimal way. To choose model, size and number of units for carrying out each one of the transformation processes as well as the size of the warehouse.
… an extra problem:
To assess the system’s performance
it is necessary to manage it …

Determining the management policies
Managing the system involves deciding the amount of energy that should be pre-committed for sale during the following day.
Furthermore, for each period of time, several decisions must be made: the amount of energy to be sold, the amount of energy to be transformed and sent to the H2-Tank, and the amount of energy to be recovered from the H2-Tank.
The procedure used to calculate these values
constitutes a management policy
Determining the committed energy. Suppose that each day at 11 a.m. the company must decide the amount of energy to be sold during each of the 24 hours of the following day.
The following data are known at 11 a.m. every day: • Input forecast for the next 61 hours. The wind forecast for the rest of the day and for the following two days. • The energy unit prices for each of the next 61 hours for pre-committed and non pre-committed energy. Unitary penalties for energy supply shortfalls. • The characteristics of the transformation storage system, including the size of the H2-tank and the expected efficiencies of both the joint transformation process and the recovery process. • The energy pre-committed the day before for the next 13 hours.
Day 4
Dec1 Dec2 Dec3 Dec4 Dec5
Day 5 Day 3 Day 2 Day 1
Dec1 Dec2 Dec3 Dec4
Time

≥
=≤=≤=×≤
=×≤=×−×+=+
==+−+==−+
+−
+−
binarytIgRtIgTTankVtlosttdtdtgRtgTtNetX
tLimitPowtNetXtTankCaptTankV
ttIgRcCaptgRttIgTTrCaptgT
ttgRREftgTTEftTankVtTankVttgenEntlosttgRtgTtNetX
ttCompEtdtdtNetX
)(),( 0_),(),(),(),(),(),(_
60,...,0 _)(_ )7(60,...,0 _)(_ )6(
60,...,0 )(Re_)( )5(60,...,0 )(_)( )4(
60,...,0 )(_)(_)(_)1(_ )3(60,,0)(_)()()()(_ )2(
12,,0)(_)()()(_ )1(
Decision variables X_Net(t): amount of energy dumped into the grid at time periods t=0,…,60. gT(t): transformed and then stored energy at time periods t=0,…,60. gR(t): recovered energy from the H2-Tank at time periods t=0,…,60.
Constraints
Determining near-optimal management policies
The committed energy is obtained as optimal solution of a integer linear programming problem
To carry out the committed energy for rest of the day
Energy balance equation
Tank update Upper limit for the transformation capacity
Upper limit for the recovery capacity
Upper limit for the warehouse capacity
Upper limit for the released energy

( )
α×××+
+×+
+×××−
−×+
+×−×−
∑
∑
∑
∑∑
=
=
=
+
=
−
=
+
MaxSalePREfTankV
tSalePtNetX
tSalePCompTEftgT
tExcSalePtd
tPenaltdtSalePtdtNetX
t
t
t
tt
___)61(_
)(_)(_
)(__)(
)(__)(
)()()(_)()(_
Maximise
60
13
60
0
12
0
12
0
12
0
Objective function: The decisions are based on a profit-maximizing criterion
Sale of energy the present day
Penalty for failure in the
supply
Sale of energy above the
commitment Sale of
energy the next two
days Running costs of the
transformation system
Assessment of energy stored in
the H2-Tank
Determining near-optimal management policies The committed energy is obtained as optimal solution of a programming linear problem

Time
Ener
gy
Energy generated from the random input
When the simulation clock reaches the time at which the energy supply commitments have to be announced for the next day, the integer linear programming problem is formulated and solved.
Simulation Model Although our energy system is a continuous time system, we develop a discrete simulation model considering the hour as the time unit and moving the simulation clock forward in steps of one hour.
We simulate the wind speed to obtain the energy that is produced by the generators
This energy is compared with the amount of energy that was pre-committed for that hour and the following system management rule is applied: If the energy generated is more than the amount pre-committed, then the surplus is sent to the H2-Tank. If the H2-Tank is full or there is insufficient transforming capacity, then it is sold at a lower price. If the generated energy is less than the amount pre-committed, we then recover energy from the warehouse. If there is insufficient “inventory” or insufficient recovery capacity to cover this deficit, then we incur a penalty.
Sale of Energy
Wind
Aguado, Ayerbe, Azcárate, Blanco, Garde, Mallor, Rivas, “Economical assessment of a wind-hydrogen energy system using WindHyGen® software”, International Journal of Hydrogen Energy, Vol. 34, No. 7, 2845-2854, 2009

Simulation Model: simulation of the wind forecast
Main idea:
Where:
Historical wind speed data are used to simulate meteorological predictions by adding an error to each item of real energy data.
The error is obtained by combining an absolute error and a relative error. The maximum relative error depends on the prediction horizon and is represented
by a set of non-decreasing polynomial functions limited by the initial and final maximum relative errors.
In order to smooth the predicted energy curve, we keep a record of past errors to generate an auto-correlated error series.
The parameters in this error forecast simulation model are used to represent the accuracy of the meteorological forecast.
−+
+=
)1)(_*2(**}_),(_* )(_max{
)(_,0
max)(_
terrorprederrorabsolutetwindtrueterrorrelavive
twindtruetwindforecast
forecast_wind (t) = true_wind (t) + error (t) error (t) = error_band (t) * random_term (t)
error_band (t) = max { relative_error (t) * true_wind (t) , absolute_error } random_term (t) = 2 * pred_error (t) - 1
pred_error (t) = a * pred_error (t-1) + b * unif_error (t), a, b > 0, a + b = 1
set of order-two polynomial non-decreasing functions
relative_error (t) = A + B t + C t 2

Re-thinking the management policies
SIMULATION MODEL
DATA
OBJECTIVES OPTIMIZATION MODEL
ECONOMICAL ASSESSMENT
DIMENSIONING DEVICES
MANAGEMENT POLICY
Free style: management policy unstructured No repetitive pattern Without communalities No interaction with the decision-maker Obtained from a “black box” ( point of view of the manager)
Useful for
Test certain class of management policies by including assumptions in them Keep some freedom degrees for the decision maker
PEAKING MANAGEMENT STRATEGY
DEVICES AND EQUIPMENT: Electrolyzers, Compressors, Tank, Fuel cells, …
More dynamic mngt. policy Smaller size for storage system

Re-thinking the management policies
SIMULATION MODEL DATA
OBJECTIVES
OPTIMIZATION MODEL
ECONOMICAL ASSESSMENT
DIMENSIONING DEVICES
INSIGHT INTO MANAGEMENT POLICY
Useful for
PEAKING MANAGEMENT STRATEGY
DEVICES AND EQUIPMENT: Electrolyzers, Compressors, Tank, Fuel cells, …
The new simulation model contains the peaking management strategy, which consists of a set of characteristics that have to be included in the applied management policy. The management policy is then obtained from the data, the wishes expressed by the manager and the answers given by some optimization procedures that select the best values for some parameters.

Modeling the peacking management strategy
Three different types of periods are considered: H2-storage hours are energy-storage periods, when a proportion of the electricity output from the wind farm is converted into hydrogen and stored in the hydrogen tank. Normal hours are hydrogen-tank non-use periods, when the electricity output from the wind farm is sold and released into the grid. H2-release hours are energy recovery periods, when the energy output from the wind farm is released into the grid together with the energy recovered from the hydrogen tank.
These different periods imply an alternation of tank-load / tank-unload cycles (with desirable frequency of 1 day).
It is desirable (set by the managers) a dynamic system management approach, involving higher loading and unloading frequency, thus reducing required storage capacity.
The strategy is based on the conversion of electricity into hydrogen during price troughs and the use of the stored hydrogen to produce electricity during the day’s demand (thus price) peaks.
Time
Energy Price
H2-storage hours
H2-release hours

Modeling the peacking management strategy
Strategic Decision: Determining H2-Storage and H2-Release Periods
Management of this wind-hydrogen energy system involves decisions with different time horizons.
It depends on both the configuration of the energy system and electricity prices.
Four different possibilities to set the type for the hours
All days are equal Different patterns for days in different months, holidays,…
Completely fixed by the manager
Partially fixed by the manager Manager fixes the number of storage and release hours per day
Automatic determination of storage/release cycles PleaseefficTotalPStore _Re*__ < Using prices and efficiencies
Strategic Decision: Determining H2-Storage and H2-Release Periods One decision valid for the whole simulation horizon
Tactical Decision: Deciding How Much Energy to Commit A decision per simulated day
Operative Decision: Managing the H2-Tank A decision per each simulated hour

The Expected Value Strategy The Cost and Probability Strategy
Modeling the peacking management strategy
Every day, at 10’00 h, the manager has to decide how many kw to sell over the 24 hours of the following day. The amount decided is considered a commitment. The information available at the time of the decision is the volume of H2 stored in the tank, prices of energy (including penalties) and the energy generation forecast for the 24 hours of the following day
Two different strategies for the commitment of energy
Tactical Decision: Deciding How Much Energy to Commit
1. The Expected Value Strategy It uses only the energy generation forecast and the predicted H2 storage profile.
During storage hours the energy delivery commitment is calculated as the surplus over the predicted amount of energy that can be converted into H2 In normal hours the pre-committed amount matches the energy generation forecast During release hours the volume of pre-committed energy is calculated from predicted energy output plus predicted volume of stored H2
2. The Cost and Probability Strategy It uses the energy output probabilistic prediction, F(x), and the profit from the sale of committed energy (Pc) and the cost of energy supply shortfalls (Ppen) or surpluses (PN).
.
)()(*)(
NCPen
NC
PPPPPQF−+
−=
This cost and probability strategy is based on the newsvendor strategy for inventory problems. The value of the predicted energy is replaced in the expected value strategy by Q*, the solution to the equation

Modeling the peacking management strategy
Operative Decision: Managing the H2-Tank
H2-storage hours. If the output generated is below what was predicted, two possibilities are considered: Prioritization of hydrogen generation (thus, storing as much as possible), or Prioritization of delivery commitments.
Normal hours. If the amount of energy pre-committed exceeds the amount generated, three rules to use the tank to make up shortfalls are available:
1. Never 2. Always 3. Only if the amount of H2 stored in the tank is greater than a % of its capacity If the amount of energy generated exceeds the amount pre-committed, three rules for use of the tank for surplus storage are available:
1. Never 2. Always 3. Only if the amount of H2 stored in the tank is below than a % of its capacity H2-release hours. If the amount of energy generated exceeds the amount pre-committed for this period, one of the following strategies is considered:
Release all the energy into the grid, or Convert the surplus into hydrogen.
Short-term strategies to operate the H2 tank to compensate deviations due to wind prediction errors
The simulation model enables the evaluation of several tank management policies, which differ according to tank-usage decisions for normal, storage and release hours
Committed Generated
Committed Generated
? ?
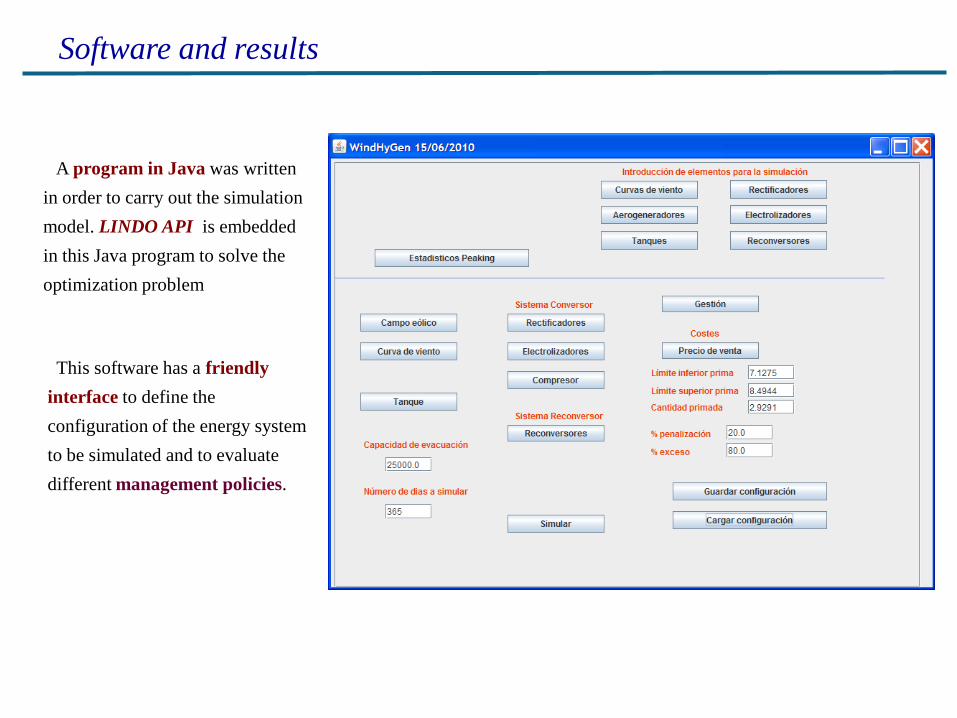
Software and results
A program in Java was written in order to carry out the simulation model. LINDO API is embedded in this Java program to solve the optimization problem
This software has a friendly interface to define the configuration of the energy system to be simulated and to evaluate different management policies.

Numerical results are provided in extended reports: the energy produced, pre-committed, stored and sold in each time period; the profit obtained from sales and running costs in each time period; the efficiency and level of usage of each piece of equipment in the energy system in each time period. …..
Software and results
The software plots all the numerical results mentioned above
Frequencies of Storage (blue), Normal (green) and Release (red) periods

Conclusion
SIMULATION MODELS ARE A VERY USEFUL TOOL, IN COMBINATION WITH OTHER STATISTICAL AND OPTIMIZATION METHODS, TO ANALYSE NEW ENERGY SYSTEMS.
SIMULATION MODELS HELP IN THE SIZING OF THE SYSTEM AND TO FIND THE BEST MANAGEMENT STRATEGIES
MORE RESEARCH IS NEEDED TO DEVELOP NEW AND BETTER SIMULATION METHOS FOR THE RENEWABLE RESOURCE AND FOR THE ERROR IN ITS FORECAST
CURRENTLY I AM COOPERATING WITH RESEARCHERS FROM THIS UNIVERSITY TO SIMULATE ENERGY SYSTEMS APPLIED TO FEED RENEWABLE HOUSES OR RENEWABLE VILLAGES.

DEPT. OF STATISTICS AND OPERATIONS RESEARCH PUBLIC UNIVERSITY OF
NAVARRE, SPAIN
ROLLA 2011
Operations Research and Simulation Models for Managing Mixed Renewable Energy Systems
DEPT. OF ENGINEERING
MANAGEMENT AND SYSTEMS ENGINEERING
MISSOURI UNIVERSITY OF SCIENCE AND TECHNOLOGY
FERMÍN MALLOR
PART 3: DISCUSSION Questions, comments, …