opinions on fish, wildlife, and land use among vermont residents, hunters, and...
TRANSCRIPT

OPINIONS ON FISH, WILDLIFE, AND LAND USE AMONG VERMONT RESIDENTS,
HUNTERS, AND ANGLERS
Conducted for the Vermont Fish and Wildlife Department
by Responsive Management
2015
OPINIONS ON FISH, WILDLIFE, AND LAND USE AMONG VERMONT RESIDENTS,
HUNTERS, AND ANGLERS
2015
Responsive Management National Office Mark Damian Duda, Executive Director
Martin Jones, Senior Research Associate Tom Beppler, Research Associate
Steven J. Bissell, Ph.D., Qualitative Research Associate Amanda Center, Research Associate
Andrea Criscione, Research Associate Patrick Doherty, Research Associate
Gregory L. Hughes, P.E., Research Associate Tristan Kirkman, Research Associate
Claudia Reilly, Survey Center Manager Alison Lanier, Business Manager
130 Franklin Street Harrisonburg, VA 22801
540/432-1888 E-mail: [email protected] Website: www.responsivemanagement.com

Acknowledgments
Responsive Management would like to thank Kim Royar of the Vermont Fish and Wildlife Department for her input, support, and guidance on this project.


Opinions on Fish, Wildlife, and Land Use Among Vermont Residents, Hunters, and Anglers i
EXECUTIVE SUMMARY
INTRODUCTION AND METHODOLOGY
This study was conducted for the Vermont Fish and Wildlife Department (hereinafter referred to
as the Department) to determine the opinions of residents, hunters, and anglers on issues
pertaining to the intersection of land use and the management of fish and wildlife. The study
entailed three scientific telephone surveys of Vermont residents, hunters, and anglers.
For the surveys, telephones were selected as the preferred sampling medium because of the
almost universal ownership of telephones among all three samples in Vermont. Note that both
landlines and cell phones were called in their proper proportions for the sample of Vermont
residents; landlines and cell phones were called for the samples of hunters and anglers depending
on the telephone that was associated with their license. Note that telephone surveys, relative to
mail or Internet surveys, allow for more scientific sampling and data collection, provide higher
quality data, obtain higher response rates, are more timely, and are more cost-effective for
general population surveys such as the survey of residents. Telephone surveys also have fewer
negative effects on the environment than do mail surveys because of reduced use of paper and
reduced energy consumption for delivering and returning the questionnaires.
The telephone survey questionnaire (the same questionnaire was used for all three surveys) was
developed cooperatively by Responsive Management and the Department.
The sample of Vermont residents comprised a random landline sample and a random cell phone
sample. This is called a dual-frame sample of residents because it consists of these two separate
samples. Both the landline sample and the cell phone sample were obtained from SSI, a firm
that specializes in providing scientifically valid samples for survey research. The two parts of
the dual-frame sample were called in their proper proportions to be representative of Vermont
residents, including those with landlines only, those with cell phones only, and those with both.
The samples of hunters and anglers were obtained from the Department; it consisted of those
who held a hunting and/or fishing license.

ii Responsive Management
The surveys were conducted in June and July 2015. The software used for data collection was
Questionnaire Programming Language. Responsive Management obtained a total of 802
completed interviews with residents, 200 completed interviews with hunters, and 203 completed
interviews with anglers.
The analysis of data was performed using Statistical Package for the Social Sciences as well as
proprietary software developed by Responsive Management.
PROBLEMS THAT VERMONT FACES
� The survey asked about the most important issues/factors that negatively affect the quality of
life. This was open-ended and allowed multiple issues/factors to be named.
• Among residents, the top responses relate to pollution/environmental degradation (21%),
financial issues (17%), and poor health/age (14%).
• Among hunters and anglers, the same responses that residents give are prominent:
pollution/environmental degradation (11% of hunters, 15% of anglers), financial issues
(17% and 18%), and poor health/age (14% and 12%)
� The survey presented six potential problems to respondents. For each potential problem,
they were asked to rate it as a big problem, a small problem, or no problem.
• Among residents, the problem of invasive species has the most saying it is a big problem
(71% say it is a big problem), followed by global climate change (64% say it is a big
problem).
o A similar study in 1992 showed only 57% of respondents stating that invasive
species is a big problem; however, note that the 1992 study referred to “nuisance
aquatic plants” rather than “invasive species.”
• Among hunters, two problems are at the top: invasive species (70% say it is a big
problem) and the posting of private land (55%). Among anglers, the top problems are
invasive species (68%) and forest/habitat fragmentation (48%).

Opinions on Fish, Wildlife, and Land Use Among Vermont Residents, Hunters, and Anglers iii
Q24-29: Percent of residents who believe each of
the following is a big problem:
71
64
46
46
41
26
0 20 40 60 80 100
Q25. Invasivespecies
Q24. Globalclimate change
Q26. Forest andhabitat
fragmentation
Q27. Fish and
wildlife habitatloss
Q28. Loss of
Vermont'sscenic
landscape
Q29. Posting ofprivate land
Percent

iv Responsive Management
� The survey directly asked about another potential problem: suburban sprawl. The statement
was made that “suburban sprawl is not yet a problem in Vermont,” and respondents were
asked whether they agree or disagree with the statement.
• A slight majority of residents think this is a problem, with 52% disagreeing with the
statement. On the other hand, 39% agree that it is not yet a problem.
o A similar survey in 1998 showed 29% of respondents agreeing with the statement
that suburban sprawl is not yet a problem.
• Among hunters, 48% disagree (i.e., think suburban sprawl is a problem), while 44%
agree. Among anglers, 49% disagree, while 44% agree.
� The survey directly asked about another potential problem, somewhat related to the above
problem: forest fragmentation and loss. Again, respondents were asked if they agree or
disagree that “forest fragmentation and loss is a problem in Vermont.”
• The large majority of residents agree with this statement (i.e., think it is a problem): 61%
agree, while 18% disagree.
• Hunters and anglers are more likely than the general population to agree. Among
hunters, 68% agree, while 23% disagree. Among anglers, 67% agree, and 21% disagree.
PARTICIPATION IN WILDLIFE-ASSOCIATED RECREATION
� The survey asked about participation in a dozen wildlife-associated activities.
• Very large majorities of residents have participated in the past 12 months in wildlife
viewing (81% did so within 1 mile of home; 74% did so greater than 1 mile from home).
Large majorities also visited a state or national park (63%) or went hiking (61%). A
majority participated in birdwatching (55%).
o The trend graph shows substantial increases in participation, since 2003, in
wildlife viewing more than one mile from home (74% in 2015 compared to 53%
in 2003), visiting state or national parks (63% in 2015 versus 49% in 2003), and
canoeing/kayaking (40% in 2015 versus 27% in 2003).
• Among hunters, top activities are hunting (86%—note that the sample is from licenses, so
the hunter need not have hunted in the past year to be in the sample), viewing wildlife

Opinions on Fish, Wildlife, and Land Use Among Vermont Residents, Hunters, and Anglers v
within a mile of home (86%), viewing wildlife more than a mile from home (79%),
fishing (79%), and hiking (51%).
• Among anglers, top activities are fishing (85%), wildlife viewing within a mile of home
(78%), wildlife viewing more than a mile from home (76%), hiking (60%), hunting
(52%), and camping (50%).
� In follow-up to the above question, the survey asked about the importance that people have
the opportunity in Vermont to participate in wildlife-related outdoor recreation.
• The large majority of residents (91%) say it is very important, and another 8% say it is
somewhat important, which is nearly all the respondents.
o This is an increase compared to a similar study in 2000, in which 80% of
respondents stated it is very important.
• This is even more important for hunters and anglers: 96% (hunters) and 95% (anglers)
say it is very important, and nearly all say it is very or somewhat important.
KNOWLEDGE AND OPINION OF THE VERMONT FISH AND WILDLIFE
DEPARTMENT
� The amount of knowledge that respondents have of the Department was assessed (self-
professed knowledge, no “test” was given). Not surprisingly, hunters and anglers claim more
knowledge of the Department, compared to residents.
• Most commonly, residents say that they know a moderate amount about the Department
(41% give this response) or they know a little (40%). Only 14% claim to know a great
deal.
• Hunters appear to be the most knowledgeable. Half of hunters claim to know a moderate
amount (50%), and another 29% claim to know a great deal. Among anglers, 37% claim
to know a moderate amount, and 28% claim to know a great deal.
� The survey asked about satisfaction or dissatisfaction with the Department as a government
agency.
• The large majority of residents are satisfied with the Department (76%, including 44%
being very satisfied). Only 3% are dissatisfied (the remainder giving a neutral response).

vi Responsive Management
o Those who went fishing in the previous 12 months are most often very satisfied
with the Department (52% stated this), whereas those who did not do any wildlife
viewing or birdwatching in the previous 12 months are least often very satisfied
(37%).
o The percent of residents who are very satisfied with the Department (44%)
increased substantially since 2003 (25%).
• Large majorities of hunters and anglers are satisfied: 76% of hunters and 80% of anglers
are satisfied (40% and 47%, respectively, are very satisfied).
� The survey asked about how the Department does at effectively balancing the interests of
anglers, hunters, conservation groups, and the general public.
• Most residents agree that the Department achieves this balance (76% agree); meanwhile,
a small percentage disagree (7%).
o Residents who most often strongly agree are those with an income less than
$50,000 per year (54% stated this) and those who indicated they are satisfied with
the Department in general (53%).
o Residents who strongly agree that the Department achieves this balance increased
from 33% in 2003 to 42% in 2015.
• While hunters and anglers agree at about the same rate as does the general population,
their rate of disagreement is higher (at the expense of “don’t know” responses): 77% of
hunters and 75% of anglers agree; however, 17% of hunters and 11% of anglers disagree.
IMPORTANCE OF FISH AND WILDLIFE
� One question directly compared wildlife with economic development. Wildlife is favored by
survey respondents by a large amount in these general questions.
• The large majority of Vermont residents (75%) disagree that economic development is
more important than wildlife. Most of that is strong disagreement (49%). Only 12%
agree, the rest being neutral.
• Likewise, the large majority of hunters (81%) and anglers (76%) disagree, with most of
that being strong disagreement (55% of hunters, 57% of anglers). The percentages that
agree are 8% of hunters and 11% of anglers.

Opinions on Fish, Wildlife, and Land Use Among Vermont Residents, Hunters, and Anglers vii
� The survey asked about agreement or disagreement with this statement: Threatened and
endangered species must be protected. Agreement is overwhelming. Agreement is also
overwhelming with this statement: Knowing that Vermont’s native fish and wildlife
populations are healthy and surviving well is very important to me even if I don’t get to see
them.
OPINIONS ON LAND USE IN VERMONT
� The survey asked for opinions on the amount of state-owned land in Vermont: should it be
increased, decreased, or stay the same? It is roughly split between stay the same and
increased; very few want it decreased.
• Most commonly, residents think that the amount of state-owned land should stay the
same (47% give this response). Otherwise, residents are much more likely to say that
they want it increased (39%) than decreased (5%).
o Since 1997, the percent of residents who want the amount of state-owned land to
increase has declined (61% in 1997 compared to 39% in 2015), with more
residents now wanting the amount to stay the same (28% in 1997 versus 47% in
2015).
• Responses are similar among hunters and anglers. The most common response is stay the
same (45% of hunters, 48% of anglers), and those wanting an increase (44% of hunters,
40% of anglers) far outnumber those wanting a decrease (5% of hunters, 6% of anglers).
� Respondents generally think that state ownership of land is important to maintain biological
diversity.
• The overwhelming majority of residents (89%) think that state ownership of land is
important to maintain biological diversity, most of that being in the very important
response.
• Hunters and anglers are similar to residents on this question: 90% of hunters think it is
important (62% thinking it is very important), and 87% of anglers think it is important
(61% saying very important).

viii Responsive Management
� Respondents overwhelmingly think it is important that ecologically important habitats and
land in Vermont are being protected and preserved.
• Among residents, 97% think this is important, including 75% who say it is very
important. There is little change since 2000.
o Residents who most often think this is very important are those who live in a large
city, urban area, or suburban area (87% stated this) and those with an income less
than $50,000 per year (82%).
• Hunters and anglers, as with residents, also overwhelmingly think it is important.
� Finally in this section, the survey presented four statements to respondents that pertain to the
tradeoff between land development and habitat protection. For each, respondents indicated if
they agree or disagree with it. In general, they side with habitat protection over unfettered
use of land.
• Among residents, agreement is high that the use and development of land should be
restricted to protect fish and wildlife (83%) and that wildlife habitat must be protected
even if it reduces the land use options of some landowners and developers (81%), as
shown on the graph. However, statements favoring development are not well received:
disagreement ranges from 74% to 77% on the two statements that favor development
over wildlife. There is little marked change since 2003.
• Hunters and anglers are much the same as residents.

Opinions on Fish, Wildlife, and Land Use Among Vermont Residents, Hunters, and Anglers ix
Q44-47: Percent of residents who strongly or
moderately agree with the following:
83
81
20
12
0 20 40 60 80 100
Q45. The use and development of land
should be restricted to protect fish andwildlife.
Q44. Wildlife habitat must be protected
even if it reduces the land use optionsof some landowners and developers.
Q46. Landowners should be allowed todevelop their land regardless of its
impact on wildlife.
Q47. If it came down to a choice
between preserving wildlife habitat orproviding land for new homes, we
should always side with providing newhomes for the residents of our state.
Percent
x Responsive Management
OPINIONS ON DEPARTMENT ACTIONS AS THEY RELATE TO BOTH LAND USE
AND FISH/WILDLIFE
� Respondents overwhelmingly agree that hunting and fishing are part of scientific
management of healthy fish and wildlife populations.
• Among residents, 91% agree, with 67% strongly agreeing. There is little change since
2003.
• Among recreationists, hunters are almost unanimous (98% agree); with anglers just under
that (93% agree).
� Respondents generally place much importance on protecting endangered species.
• The huge majority of residents (95%) think protecting endangered species is very or
somewhat important (with 76% saying very important). There is little change since 2003.
• Hunters and anglers are like the general population: 95% of hunters and 97% of anglers
place importance on this.
� There is much support for having the Department protect important wildlife habitat by
purchasing land.
• The large majority of residents support (83%); opposition is low (9%). There is little
change since 2003.
• Hunters and anglers generally support (85% and 87%, respectively).
� The survey presented six possible strategies for protecting land for fish and wildlife. For
each strategy, respondents rated their level of support for it or opposition to it.
• Residents most favor the provision of technical assistance/guidance (75% strongly
support) and tax incentives (70%). Furthermore, the purchase of conservation easements
(62%) is favored over outright purchase of land (46%). (Note that when looking at strong
or moderate support, the percentages are very high—from 78% to 95%.) In the middle
are two strategies that entail more regulation.
• Hunters and anglers also show the most support for technical assistance/guidance and tax
incentives. In the middle are requiring developers to provide mitigation actions and the
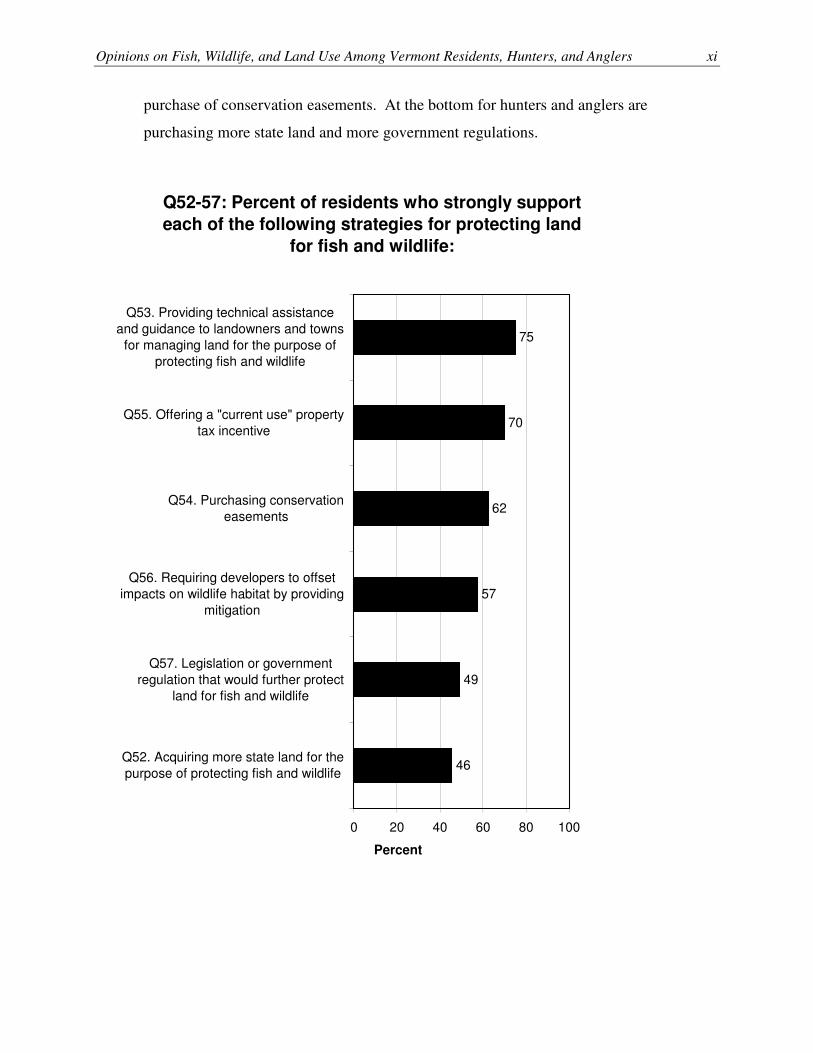
Opinions on Fish, Wildlife, and Land Use Among Vermont Residents, Hunters, and Anglers xi
purchase of conservation easements. At the bottom for hunters and anglers are
purchasing more state land and more government regulations.
Q52-57: Percent of residents who strongly support
each of the following strategies for protecting land
for fish and wildlife:
75
70
62
57
49
46
0 20 40 60 80 100
Q53. Providing technical assistanceand guidance to landowners and towns
for managing land for the purpose ofprotecting fish and wildlife
Q55. Offering a "current use" propertytax incentive
Q54. Purchasing conservationeasements
Q56. Requiring developers to offsetimpacts on wildlife habitat by providing
mitigation
Q57. Legislation or governmentregulation that would further protect
land for fish and wildlife
Q52. Acquiring more state land for thepurpose of protecting fish and wildlife
Percent
xii Responsive Management
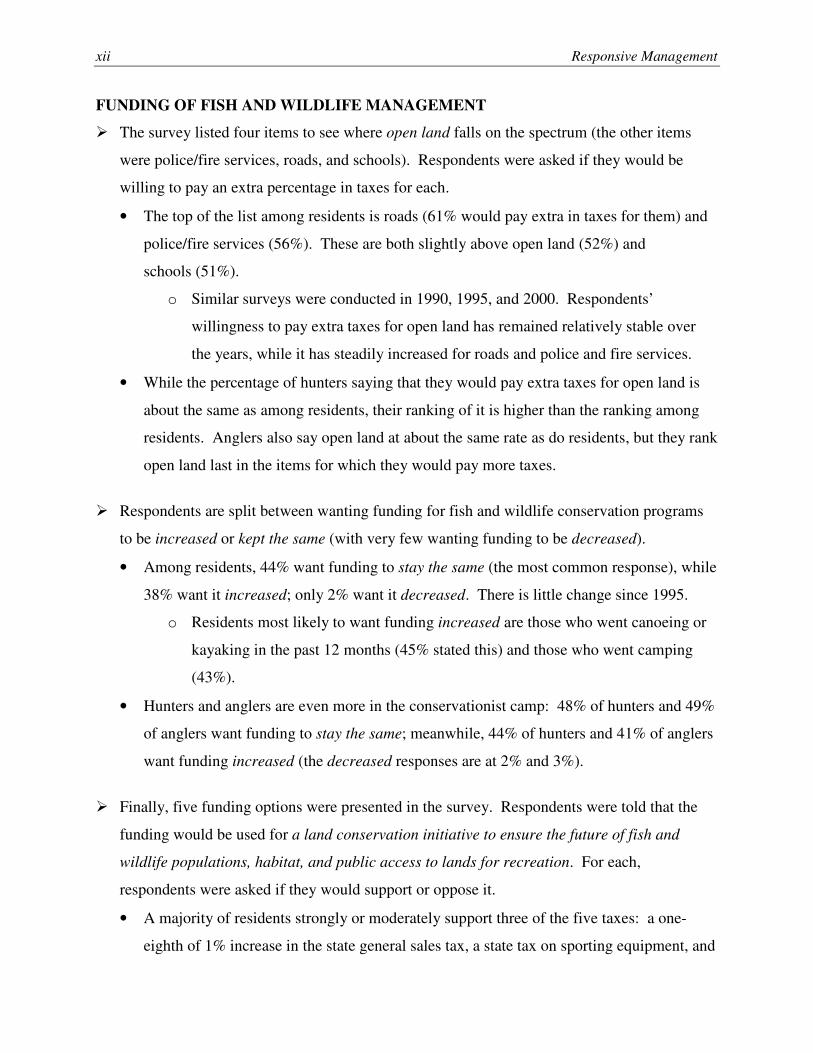
FUNDING OF FISH AND WILDLIFE MANAGEMENT
� The survey listed four items to see where open land falls on the spectrum (the other items
were police/fire services, roads, and schools). Respondents were asked if they would be
willing to pay an extra percentage in taxes for each.
• The top of the list among residents is roads (61% would pay extra in taxes for them) and
police/fire services (56%). These are both slightly above open land (52%) and
schools (51%).
o Similar surveys were conducted in 1990, 1995, and 2000. Respondents’
willingness to pay extra taxes for open land has remained relatively stable over
the years, while it has steadily increased for roads and police and fire services.
• While the percentage of hunters saying that they would pay extra taxes for open land is
about the same as among residents, their ranking of it is higher than the ranking among
residents. Anglers also say open land at about the same rate as do residents, but they rank
open land last in the items for which they would pay more taxes.
� Respondents are split between wanting funding for fish and wildlife conservation programs
to be increased or kept the same (with very few wanting funding to be decreased).
• Among residents, 44% want funding to stay the same (the most common response), while
38% want it increased; only 2% want it decreased. There is little change since 1995.
o Residents most likely to want funding increased are those who went canoeing or
kayaking in the past 12 months (45% stated this) and those who went camping
(43%).
• Hunters and anglers are even more in the conservationist camp: 48% of hunters and 49%
of anglers want funding to stay the same; meanwhile, 44% of hunters and 41% of anglers
want funding increased (the decreased responses are at 2% and 3%).
� Finally, five funding options were presented in the survey. Respondents were told that the
funding would be used for a land conservation initiative to ensure the future of fish and
wildlife populations, habitat, and public access to lands for recreation. For each,
respondents were asked if they would support or oppose it.
• A majority of residents strongly or moderately support three of the five taxes: a one-
eighth of 1% increase in the state general sales tax, a state tax on sporting equipment, and

Opinions on Fish, Wildlife, and Land Use Among Vermont Residents, Hunters, and Anglers xiii
a bond (support ranges from 59% to 61%). There is less than a majority who support a
parking fee on state lands or a registration fee for kayaks and canoes.
• Hunters’ and anglers’ opinions mirror those of residents. At the top is the bond, followed
by the one-eighth of 1% sales tax and the tax on sporting equipment. At the bottom are
the registration fee for kayaks/canoes and the parking fee.
Q70-74: Percent of residents who strongly or
moderately support each of the following to
provide funding for a land conservation initiative:
61
59
59
45
43
0 20 40 60 80 100
Q73. A one-eighthof 1% increase inthe state general
sales tax
Q74. A state tax inVermont on
sporting equipment
Q72. A bond tofund land
acquisition
Q71. A parking fee
on state lands
Q70. A registrationfee for kayaks and
canoes
Percent

xiv Responsive Management
TABLE OF CONTENTS
Introduction and Methodology ..................................................................................................................... 1 Use of Telephones for the Survey........................................................................................................ 1 Questionnaire Design........................................................................................................................... 1 Survey Samples.................................................................................................................................... 2 Telephone Interviewing Facilities........................................................................................................ 2 Interviewing Dates and Times ............................................................................................................. 3 Telephone Survey Data Collection and Quality Control ..................................................................... 3 Data Analysis....................................................................................................................................... 3 Sampling Error..................................................................................................................................... 4 Additional Information About the Presentation of Results in the Report............................................ 5 How to Interpret the Demographic Correlation Graphs....................................................................... 6
Problems That Vermont Faces...................................................................................................................... 7 Participation in Wildlife-Associated Recreation......................................................................................... 28 Knowledge and Opinion of the Vermont Fish and Wildlife Department ................................................... 35 The Intersection of Land Use and Fish/Wildlife Management ................................................................... 50
Importance of Fish and Wildlife ........................................................................................................ 50 Opinions on Land Use in Vermont .................................................................................................... 60 Opinions on Department Actions as They Relate to Both Land Use and Fish/Wildlife.................... 81
Funding of Fish and Wildlife Management .............................................................................................. 101 Demographic Questions............................................................................................................................ 118 About Responsive Management ............................................................................................................... 129

Opinions on Fish, Wildlife, and Land Use Among Vermont Residents, Hunters, and Anglers 1
INTRODUCTION AND METHODOLOGY
This study was conducted for the Vermont Fish and Wildlife Department (hereinafter referred to
as the Department) to determine the opinions of residents, hunters, and anglers on issues
pertaining to the intersection of land use and the management of fish and wildlife. The study
entailed three scientific telephone surveys of Vermont residents, hunters, and anglers. Specific
aspects of the research methodology are discussed below.
USE OF TELEPHONES FOR THE SURVEY
For the surveys, telephones were selected as the preferred sampling medium because of the
almost universal ownership of telephones among all three samples in Vermont. Note that both
landlines and cell phones were called in their proper proportions for the sample of Vermont
residents; landlines and cell phones were called for the samples of hunters and anglers depending
on the telephone that was associated with their license. Note that telephone surveys, relative to
mail or Internet surveys, allow for more scientific sampling and data collection, provide higher
quality data, obtain higher response rates, are more timely, and are more cost-effective for
general population surveys such as the survey of residents. Telephone surveys also have fewer
negative effects on the environment than do mail surveys because of reduced use of paper and
reduced energy consumption for delivering and returning the questionnaires.
QUESTIONNAIRE DESIGN
The telephone survey questionnaire (the same questionnaire was used for all three surveys) was
developed cooperatively by Responsive Management and the Department, based on the research
team’s familiarity with natural resources, land use, and wildlife-associated recreation in general,
as well as hunting and fishing specifically.
The survey included questions that had been asked in previous surveys conducted by various
researchers. These studies are listed further on in the section, “Data Analysis.”
2 Responsive Management
SURVEY SAMPLES
The sample of Vermont residents comprised a random landline sample and a random cell phone
sample. This is called a dual-frame sample of residents because it consists of these two separate
samples. Both the landline sample and the cell phone sample were obtained from SSI, a firm
that specializes in providing scientifically valid samples for survey research. The two parts of
the dual-frame sample were called in their proper proportions to be representative of Vermont
residents, including those with landlines only, those with cell phones only, and those with both.
This dual-frame sample of residents used a probability-based selection process that ensured that
each adult resident had an essentially equal chance of being selected for the survey.
The samples of hunters and anglers were obtained from the Department; it consisted of those
who held a hunting and/or fishing license.
TELEPHONE INTERVIEWING FACILITIES
A central polling site at the Responsive Management office allowed for rigorous quality control
over the interviews and data collection. Responsive Management maintains its own in-house
telephone interviewing facilities. These facilities are staffed by interviewers with experience
conducting computer-assisted telephone interviews on the subjects of outdoor recreation and
natural resources.
To ensure the integrity of the telephone survey data, Responsive Management has interviewers
who have been trained according to the standards established by the Council of American Survey
Research Organizations. Methods of instruction included lecture and role-playing. The Survey
Center Managers and other professional staff conducted a project briefing with the interviewers
prior to the administration of these surveys. Interviewers were instructed on type of study, study
goals and objectives, handling of survey questions, interview length, termination points and
qualifiers for participation, interviewer instructions within the survey questionnaire (one
questionnaire was used for all three surveys), reading of the survey questions, skip patterns, and
probing and clarifying techniques necessary for specific questions on the survey questionnaire.
Opinions on Fish, Wildlife, and Land Use Among Vermont Residents, Hunters, and Anglers 3
INTERVIEWING DATES AND TIMES
Telephone surveying times are Monday through Friday from 9:00 a.m. to 9:00 p.m., Saturday
from noon to 5:00 p.m., and Sunday from 5:00 p.m. to 9:00 p.m., local time. A five-callback
design was used to maintain the representativeness of the sample, to avoid bias toward people
easy to reach by telephone, and to provide an equal opportunity for all to participate. When a
respondent could not be reached on the first call, subsequent calls were placed on different days
of the week and at different times of the day. The surveys were conducted in June and
July 2015.
TELEPHONE SURVEY DATA COLLECTION AND QUALITY CONTROL
The software used for data collection was Questionnaire Programming Language (QPL). The
survey data were entered into the computer as each interview was being conducted, eliminating
manual data entry after the completion of the survey and the concomitant data entry errors that
may occur with manual data entry. The survey questionnaire was programmed so that QPL
branched, coded, and substituted phrases in the survey based on previous responses to ensure the
integrity and consistency of the data collection.
The Survey Center Managers and statisticians monitored the data collection, including
monitoring of the actual telephone interviews without the interviewers’ knowledge, to evaluate
the performance of each interviewer and ensure the integrity of the data. The survey
questionnaire itself contains error checkers and computation statements to ensure quality and
consistent data. After the surveys were obtained by the interviewers, the Survey Center
Managers and/or statisticians checked each completed survey to ensure clarity and completeness.
Responsive Management obtained a total of 802 completed interviews with residents, 200
completed interviews with hunters, and 203 completed interviews with anglers.
DATA ANALYSIS
The analysis of data was performed using Statistical Package for the Social Sciences as well as
proprietary software developed by Responsive Management. Although the respondents from
whom interviews were gathered as a whole fairly closely matched the actual demographic
breakdown of adult residents of Vermont, the general population results were weighted slightly

4 Responsive Management
by age and gender so that the sample was exactly representative of residents of Vermont as a
whole.
Trends were analyzed based on twelve other studies:
• 1990, 1995, 2000: Vermont Business Roundtable. Pulse of Vermont, Quality of Life Study (three studies).
• 1992. Manning, Schmidt, and Wiberg (UVM). Vermont Recreation Survey and Environmental Index.
• 1994. Glass and More. Human Relationships With Wildlife in Vermont. • 1995. Responsive Management (RM). Vermont Residents’ Opinions and Attitudes
Toward Alternative Funding. • 1995. Buck and Williams. Expenditures and Opinions of Vermont Residents
Participating in Non-Consumptive Wildlife-Based Recreation. • 1996. RM. Vermont Residents’ Opinions and Attitudes Toward Species Management. • 1997. ANR. Land Conservation Survey. • 1998. Vermont Population Alliance. Vermont Population Alliance Survey. • 2000. RM. Vermont Residents’ Attitudes Toward Program Priorities and Alternative
Funding Mechanisms for the VFWD. • 2003. RM. Public Opinion on Fish and Wildlife Management Issues and the Reputation
and Credibility of Fish and Wildlife Agencies in the Northeast United States.
SAMPLING ERROR
The sampling errors are shown in the tabulation below, which is followed by the sampling error
equation that was used.
Sample Size Population Size Sampling Error Residents (18 years old and older) 802 504,976 3.46 Hunters 200 118,373 6.92 Anglers 203 184,486 6.87
Sampling Error Equation
( )
( )96.11
25.25.
−
−
=p
s
p
N
N
N
B
Derived from formula: p. 206 in Dillman, D. A. 2000. Mail and Internet Surveys. John Wiley & Sons, NY.
Note: This is a simplified version of the formula that calculates the maximum sampling error using a 50:50 split (the most conservative calculation because a 50:50 split would give maximum variation).
Where: B = maximum sampling error (as decimal) NP = population size (i.e., total number who could be surveyed) NS = sample size (i.e., total number of respondents surveyed)

Opinions on Fish, Wildlife, and Land Use Among Vermont Residents, Hunters, and Anglers 5
ADDITIONAL INFORMATION ABOUT THE PRESENTATION OF RESULTS IN THE REPORT
In examining the results, it is important to be aware that the questionnaire included several types
of questions:
• Open-ended questions are those in which no answer set is read to the respondents; rather, they can respond with anything that comes to mind from the question.
• Closed-ended questions have an answer set from which to choose. • Single or multiple response questions: Some questions allow only a single response,
while other questions allow respondents to give more than one response or choose all that apply. Those that allow more than a single response are indicated on the graphs with the label, “Multiple Responses Allowed.”
• Scaled questions: Many closed-ended questions (but not all) are in a scale, such as excellent-good-fair-poor.
• Series questions: Many questions are part of a series, and the results are primarily intended to be examined relative to the other questions in that series (although results of the questions individually can also be valuable). Typically, results of all questions in a series are shown together.
Most graphs show results rounded to the nearest integer; however, all data are stored in decimal
format, and all calculations are performed on unrounded numbers. For this reason, some results
may not sum to exactly 100% because of this rounding on the graphs. Additionally, rounding
may cause apparent discrepancies of 1 percentage point between the graphs and the reported
results of combined responses (e.g., when “strongly support” and “moderately support” are
summed to determine the total percentage in support).

6 Responsive Management
HOW TO INTERPRET THE DEMOGRAPHIC CORRELATION GRAPHS
Graphs are included for select questions that show how various demographic characteristics
correlate with various opinions on fish and wildlife management. Each graph shows an overall
result, and then it shows the result for that question among various demographic groups. Those
groups at the top of the graph have a greater percentage giving a specific response, compared to
respondents overall; those groups at the bottom of the graph have a lower percentage giving a
specific response, compared to respondents overall. To better differentiate between the
demographic groups, percentages are shown on these graphs to one decimal point. However,
throughout the narrative and on general graphs, results are presented in whole percentages. An
example of a demographic correlation graph is provided below:
Q59. Percent of residents who are very satisfied
with the Vermont Fish and Wildlife Department as a
government agency in Vermont.
44.0
43.5
42.4
42.0
41.8
41.1
40.8
40.1
39.8
36.8
44.3
44.4
44.5
44.8
44.9
45.1
46.1
47.0
48.3
50.8
51.0
51.9
45.7
45.7
45.1
0 20 40 60 80 100
Went fishing
Has an income less than $50,000 per year
Went hunting
Does not have a bachelor's degree
Went canoeing or kayaking
Visited a state or national park
Went hiking
Went camping
Went wildlife viewing or birdwatching
Has an income of $50,000 or more per year
Below the median age (50)
Lives in a small city or town, or rural area
Median age (50) or older
Female
Total
Male
Did not go camping
Did not go canoeing or kayaking
Did not go hunting
Did not go hiking
Did not visit a state or national parkLives in a large city, urban area, or suburban
areaHas a bachelor's degree or higher
Did not go fishing
Did not do any wildlife viewing or birdwatching
Percent
Groups above the dashed bar are more likely to be very satisfied than are residents as a whole. For instance, those who went fishing in the past 12 months (52%) are more likely to be very satisfied than are residents overall (44%). On the other hand, those who live in a large city/urban area/suburban area (41%) are less likely than residents overall to be very satisfied.

Opinions on Fish, Wildlife, and Land Use Among Vermont Residents, Hunters, and Anglers 7
PROBLEMS THAT VERMONT FACES
� The initial question in the survey was not about problems, per se, but led into the discussion
of problems. The question simply asked, in an open-ended format (where no answer set is
presented, instead allowing any response that comes to mind), what first comes to mind when
one hears the expression, “quality of life.” Note that only a single response was allowed.
• The most common responses among residents relate to the general physical environment
(17% give a response related to this), good health (14%), and standard of living (14%).
Other responses run the gamut, as shown in the graph.
o The trend graph shows comparisons to studies conducted in 1990, 1995, and
2000. This survey showed a considerably lower percentage of residents who
stated “pace of life,” compared to the earlier surveys, whereas substantially more
residents stated “good health.”
• The most common responses among hunters and anglers include standard of living (19%
of hunters; 8% of anglers) and general physical environment (12% and 11%,
respectively).
� As indicated, the purpose of the question above was to lead in to the next question that asked
about the most important issues/factors that negatively affect the quality of life. This also
was open-ended, but it allowed multiple issues/factors to be named.
• Among residents, the top responses relate to pollution/environmental degradation (21%),
financial issues (17%), and poor health/age (14%).
• Among hunters and anglers, the same responses that residents give are prominent:
pollution/environmental degradation (11% of hunters, 15% of anglers), financial issues
(17% and 18%), and poor health/age (14% and 12%).

8 Responsive Management
Q11. What first comes to mind when you hear the
expression "quality of life"?
(Vermont residents.)
17
14
14
7
5
5
3
3
3
3
2
2
2
1
1
1
0
4
13
0 20 40 60 80 100
General physical environment
Good health
Standard of living
Freedom and independence
Family, friends, community
Happiness, pleasure, or enjoyment
Vermont
Money or resources
Nature or outdoors environment
Recreational, cultural, educationalopportunities
Pace of life
Social issues, social activism, or
volunteering
Living in accordance with values
Safety, crime-free
Free time
Something negative
Fullness of experience
Other
Don't know
Percent (n=802)

Opinions on Fish, Wildlife, and Land Use Among Vermont Residents, Hunters, and Anglers 9
Q11. What first comes to mind when you hear the expression "quality
of life"?
53
63 4
95
3 47 8
6 7
14
15
4434
27 26
20
57
4
20
2625
8
17
2425
19
7
24
0
20
40
60
80
100
Physical
environment
(air, water,views, land)
Pace of life
(serenity, rural
lifestyle)
Standard of
living
Family,
friends,
community
Freedom and
independence
Safety, crime-
free
Recreational,
cultural,
educationalopportunities
Good health Other
Perc
en
t
1990 VT Business Roundtable
1995 VT Business Roundtable
2000 VT Business Roundtable
2015 RM

10 Responsive Management
Q11. What first comes to mind when you hear the
expression "quality of life"?
(Hunters and anglers.)
19
12
9
9
7
7
7
5
3
3
2
2
2
2
1
1
0
3
11
8
11
8
8
9
7
2
8
2
2
2
3
1
1
0
2
0
5
16
0 20 40 60 80 100
Standard of living
General Physical Environment
Happiness, Pleasure, or Enjoyment
Good health
Recreational, cultural, educationalopportunities
Freedom and independence
Nature or Outdoors Environment
Family, friends, community
Pace of Life
Money or resources
Safety, crime-free
Vermont
Living in accordance with values
Free time
Social issues, social activism or
volunteering
Something negative
Fullness of experience
Other
Don't know
Percent
Hunter (n=200)
Angler (n=203)
Opinions on Fish, Wildlife, and Land Use Among Vermont Residents, Hunters, and Anglers 11
Q13. What are the most important issues or factors
that negatively affect your "quality of life"?
(Vermont residents.)
12
5
5
5
21
17
14
11
6
5
4
4
3
2
2
7
0 20 40 60 80 100
Pollution or environmental degradation
Financial issues
Poor health or age related issues
Negative social interactions / otherindividuals / population growth
Poor weather or natural environment
Work
Nothing
Stress
Lack of free time
Taxes
Governmental interference or political
issues
Traffic
Feeling unsafe / crime
Unemployment
Other
Don't know
Mu
ltip
le R
es
po
ns
es
All
ow
ed
Percent (n=802)
12 Responsive Management
Q13. What are the most important issues or factors
that negatively affect your "quality of life"?
(Vermont residents.)
16
15
9
8
6
2
5
7
3
2
0
1
5
14
5
5
5
17
14
14
11
10
6
4
2
2
1
1
5
12
5
18
0 20 40 60 80 100
Financial issues
Nothing
Poor health or age related issues
Pollution or environmental degradation
Negative social interactions / otherindividuals / population growth
Governmental interference or politicalissues
Work
Stress
Taxes
Lack of free time
Traffic
Poor weather or natural environment
Feeling unsafe / crime
Unemployment
Other
Don't know
Mu
ltip
le R
es
po
ns
es
All
ow
ed
Percent
Hunters (n = 200)
Anglers (n = 203)
Q13. What are the most important issues or factors that negatively affect your “quality of life”?
(Hunters and anglers.)

Opinions on Fish, Wildlife, and Land Use Among Vermont Residents, Hunters, and Anglers 13
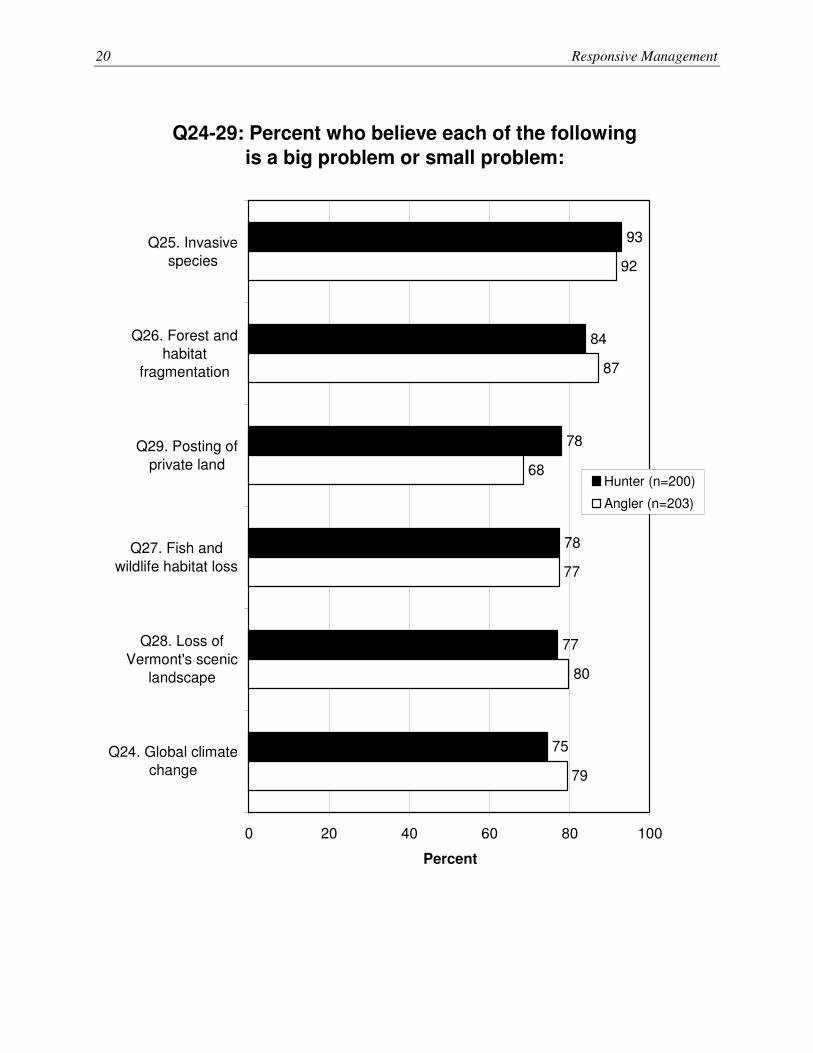
� The survey presented six potential problems to respondents. For each potential problem,
they were asked to rate it as a big problem, a small problem, or no problem.
• Among residents, the problem of invasive species has the most saying it is a big problem
(71% say it is a big problem), followed by global climate change (64% say it is a big
problem).
o A similar study in 1992 showed only 57% of respondents stating that invasive
species is a big problem; however, note that the 1992 study referred to “nuisance
aquatic plants” rather than “invasive species.” Subsequent trend graphs show
little marked change from the 1992 survey responses regarding fish and wildlife
habitat loss, loss of Vermont’s scenic landscape, and posting of private land.
Note that the trend graph for fish and habitat loss is compared to two similar
questions from the 1992 survey: destruction of wildlife habitat and destruction of
habitat for fish.
• Among hunters, two problems are at the top: invasive species (70% say it is a big
problem) and the posting of private land (55%). Among anglers, the top problems are
invasive species (68%) and forest/habitat fragmentation (48%).
o For this series, three graphs are shown for each group: the percentage saying each
is a big problem, the percentage saying each is a big or small problem, and the
percentage saying each is no problem.

14 Responsive Management
Q24-29: Percent of residents who believe each of
the following is a big problem:
71
64
46
46
41
26
0 20 40 60 80 100
Q25. Invasive
species
Q24. Global
climate change
Q26. Forest and
habitatfragmentation
Q27. Fish andwildlife habitat loss
Q28. Loss of
Vermont's sceniclandscape
Q29. Posting ofprivate land
Percent

Opinions on Fish, Wildlife, and Land Use Among Vermont Residents, Hunters, and Anglers 15
Q24-29: Percent of residents who believe each of
the following is a big problem or small problem:
93
86
85
79
78
54
0 20 40 60 80 100
Q25. Invasive
species
Q24. Globalclimate change
Q26. Forest andhabitat
fragmentation
Q27. Fish andwildlife habitat loss
Q28. Loss of
Vermont's sceniclandscape
Q29. Posting ofprivate land
Percent

16 Responsive Management
Q24-29: Percent of residents who believe each of
the following is no problem:
39
20
11
11
8
3
0 20 40 60 80 100
Q29. Posting of
private land
Q28. Loss ofVermont's scenic
landscape
Q24. Globalclimate change
Q27. Fish and
wildlife habitat loss
Q26. Forest andhabitat
fragmentation
Q25. Invasivespecies
Percent

Opinions on Fish, Wildlife, and Land Use Among Vermont Residents, Hunters, and Anglers 17
Q25. Percent of residents who think invasive species are a big
problem, small problem, or no problem at all in Vermont.
4
57
20
4
19
3
22
71
0
20
40
60
80
100
Big problem Small problem No problem Don't know
Perc
en
t
1992 UVM*
2015 RM
*Question asked about "nuisance aquatic plants" in the 1992 survey.
Q27. Percent of residents who think fish and wildlife habitat loss is a
big problem, small problem, or no problem at all in Vermont.
7
49
34
13
5
11
30
52
11
46
33
11
0
20
40
60
80
100
Big problem Small problem No problem Don't know
Perc
en
t
1992 UVM - "destruction of wildlifehabitat"
1992 UVM - "destruction of habitat forfish"
2015 RM

18 Responsive Management
2
41 42
16
1
20
37
41
0
20
40
60
80
100
Big problem Small problem No problem Don't know
Perc
en
t
1992 UVM Vermont Recreation Survey
2015 RM
Q28. Percent of residents who think loss of Vermont's scenic landscape is
a big problem, small problem, or no problem at all in Vermont.
Q29. Percent of residents who think posting of private land is a big
problem, small problem, or no problem at all in Vermont.
6
3032
35
3
39
2826
0
20
40
60
80
100
Big problem Small problem No problem Don't know
Perc
en
t
1992 UVM Vermont Recreation Survey
2015 RM

Opinions on Fish, Wildlife, and Land Use Among Vermont Residents, Hunters, and Anglers 19
Q24-29: Percent who believe each of the following
is a big problem:
48
44
34
70
55
45
45
43
35
68
42
45
0 20 40 60 80 100
Q25. Invasivespecies
Q29. Posting ofprivate land
Q24. Global climatechange
Q26. Forest and
habitatfragmentation
Q27. Fish andwildlife habitat loss
Q28. Loss ofVermont's scenic
landscape
Percent
Hunter (n=200)
Angler (n=203)
20 Responsive Management
Q24-29: Percent who believe each of the following
is a big problem or small problem:
77
80
79
93
84
78
78
77
75
92
87
68
0 20 40 60 80 100
Q25. Invasivespecies
Q26. Forest andhabitat
fragmentation
Q29. Posting of
private land
Q27. Fish and
wildlife habitat loss
Q28. Loss of
Vermont's sceniclandscape
Q24. Global climatechange
Percent
Hunter (n=200)
Angler (n=203)

Opinions on Fish, Wildlife, and Land Use Among Vermont Residents, Hunters, and Anglers 21
Q24-29: Percent who believe each of the following
is no problem:
18
6
3
21
18
17
17
11
4
26
16
14
0 20 40 60 80 100
Q29. Posting ofprivate land
Q27. Fish andwildlife habitat loss
Q24. Global climatechange
Q28. Loss of
Vermont's sceniclandscape
Q26. Forest and
habitatfragmentation
Q25. Invasivespecies
Percent
Hunter (n=200)
Angler (n=203)

22 Responsive Management
� The survey directly asked about another potential problem: suburban sprawl. The statement
was made that “suburban sprawl is not yet a problem in Vermont,” and respondents were
asked whether they agree or disagree with the statement.
• A slight majority of residents think this is a problem, with 52% disagreeing with the
statement. On the other hand, 39% agree that it is not yet a problem.
o A similar survey in 1998 showed 45% of respondents disagreeing that suburban
sprawl is not yet a problem.
• Among hunters, 48% disagree (i.e., think suburban sprawl is a problem), while 44%
agree. Among anglers, 49% disagree, while 44% agree.
� The survey directly asked about another potential problem, somewhat related to the above
problem: forest fragmentation and loss. Again, respondents were asked if they agree or
disagree that “forest fragmentation and loss is a problem in Vermont.”
• The large majority of residents agree with this statement (i.e., think it is a problem): 61%
agree, while 18% disagree.
• Hunters and anglers are more likely than the general population to agree. Among
hunters, 68% agree, while 23% disagree. Among anglers, 67% agree, and 21% disagree.

Opinions on Fish, Wildlife, and Land Use Among Vermont Residents, Hunters, and Anglers 23
Q33. Suburban sprawl is not yet a problem in
Vermont.
(Vermont residents.)
14
25
4
29
23
5
0 20 40 60 80 100
Strongly agree
Moderately agree
Neither agree nor
disagree
Moderately
disagree
Strongly disagree
Don't know
Percent (n=802)
39%
52%

24 Responsive Management
Q33. Percent of residents who believe suburban sprawl is not yet a
problem in Vermont.
29
45
24
9
52
39
0
20
40
60
80
100
Agree Disagree Neither agree nor disagree
Perc
en
t
1998 VT Population Alliance
2015 RM

Opinions on Fish, Wildlife, and Land Use Among Vermont Residents, Hunters, and Anglers 25
Q33. Suburban sprawl is not yet a problem in
Vermont.
(Hunters and anglers.)
13
31
4
25
23
5
19
25
4
31
18
3
0 20 40 60 80 100
Strongly agree
Moderately agree
Neither agree nordisagree
Moderatelydisagree
Strongly disagree
Don't know
Percent
Hunter (n=200)
Angler (n=203)

26 Responsive Management
Q38. Forest fragmentation and loss is a problem in
Vermont.
(Vermont residents.)
33
28
8
13
5
12
0 20 40 60 80 100
Strongly agree
Moderately agree
Neither agree nor
disagree
Moderatelydisagree
Strongly disagree
Don't know
Percent (n=802)
61%
18%

Opinions on Fish, Wildlife, and Land Use Among Vermont Residents, Hunters, and Anglers 27
Q38. Forest fragmentation and loss is a problem in
Vermont.
(Hunters and anglers.)
38
30
4
16
7
6
36
31
5
13
8
7
0 20 40 60 80 100
Strongly agree
Moderately agree
Neither agree nordisagree
Moderatelydisagree
Strongly disagree
Don't know
Percent
Hunter (n=200)
Angler (n=203)

28 Responsive Management
PARTICIPATION IN WILDLIFE-ASSOCIATED RECREATION
� The survey asked about participation in a dozen wildlife-associated activities.
• Very large majorities of residents have participated in the past 12 months in wildlife
viewing (81% did so within 1 mile of home; 74% did so greater than 1 mile from home).
Large majorities also visited a state or national park (63%) or went hiking (61%). A
majority participated in birdwatching (55%).
o The trend graph shows substantial increases in participation, since 2003, in
wildlife viewing greater than 1 mile from home (74% in 2015 compared to 53%
in 2003), visiting state or national parks (63% in 2015 versus 49% in 2003), and
canoeing/kayaking (40% in 2015 versus 27% in 2003).
• Among hunters, top activities are hunting (86%—note that the sample is from licenses, so
the hunter need not have hunted in the past year to be in the sample), viewing wildlife
within 1 mile of home (86%), viewing wildlife greater than 1 mile from home (79%),
fishing (79%), and hiking (51%).
• Among anglers, top activities are fishing (85%), wildlife viewing within 1 mile of home
(78%), wildlife viewing greater than 1 mile from home (76%), hiking (60%), hunting
(52%), and camping (50%).
� In follow-up to the above question, the survey asked about the importance that people have
the opportunity in Vermont to participate in wildlife-related outdoor recreation.
• The large majority of residents (91%) say it is very important, and another 8% say it is
somewhat important, which is nearly all the respondents.
o This is an increase compared to a similar study in 2000, in which 80% of
respondents stated it is very important.
• This is even more important for hunters and anglers: 96% (hunters) and 95% (anglers)
say it is very important, and nearly all say it is very or somewhat important.

Opinions on Fish, Wildlife, and Land Use Among Vermont Residents, Hunters, and Anglers 29
Q16. In the past 12 months, have you participated
in the following activities?
(Vermont residents.)
36
37
37
81
74
63
61
55
40
27
24
2
2
0
0 20 40 60 80 100
Wildlife viewing within 1 mile of home
Wildlife viewing greater than 1 mile fromhome
Visiting state or national park
Hiking
Birdwatching
Canoeing/kayaking
Fishing
Biking
Camping
Motorboating
Hunting
Trapping
None of these
Don't know
Mu
ltip
le R
es
po
ns
es
All
ow
ed
Percent

30 Responsive Management
Q16. In the past 12 months, have you participated in the following
activities?
(Vermont residents.) (Part 1 of 2)
55
63
36 3736
73
54 53 5349
36
74
61
81
0
20
40
60
80
100
Wildlifeviewing within
1 mile of home
Hiking Wildlifeviewing
greater than 1mile from
home
Birdwatching Visiting stateor national
park
Camping Fishing
Perc
en
t
2003 RM
2015 RM
Q16. In the past 12 months, have you participated in the following
activities?
(Vermont residents.) (Part 2 of 2)
24
2 2
34
2725 24
25
27
4037
0
20
40
60
80
100
Biking Canoeing/kayaking Motorboating Hunting Trapping None of these
Perc
en
t
2003 RM
2015 RM

Opinions on Fish, Wildlife, and Land Use Among Vermont Residents, Hunters, and Anglers 31
Q16. In the past 12 months, have you participated
in the following activities?
(Hunters and anglers.)
85
60
41
40
49
36
50
29
8
0
0
37
41
42
86
86
79
79
51
49
36
24
7
1
0
76
78
52
0 20 40 60 80 100
Hunting
Wildlife viewing within 1 mile of home
Wildlife viewing greater than 1 mile
from home
Fishing
Hiking
Birdwatching
Canoeing/kayaking
Visiting state or national park
Motorboating
Camping
Biking
Trapping
None of these
Don't know
Mu
ltip
le R
es
po
ns
es
All
ow
ed
Percent
Hunters (n = 200)
Anglers (n = 203)

32 Responsive Management
Q17. How important is it to you that people have
the opportunity in Vermont to participate in wildlife-
related outdoor recreation, such as hunting,
fishing, and wildlife viewing?
(Vermont residents.)
91
8
1
1
0 20 40 60 80 100
Very important
Somewhatimportant
Not at all
important
Don't know
Percent

Opinions on Fish, Wildlife, and Land Use Among Vermont Residents, Hunters, and Anglers 33
Q17. How important is it to you that people have the opportunity in
Vermont to participate in wildlife-related outdoor recreation, such as
hunting, fishing, and wildlife viewing?
(Vermont residents.)
1
80
17
2 11
8
91
0
20
40
60
80
100
Very important Somewhat important Not at all important Don't know
Perc
en
t
2000 RM
2015 RM

34 Responsive Management
Q17. How important is it to you that people have
the opportunity in Vermont to participate in wildlife-
related outdoor recreation, such as hunting,
fishing, and wildlife viewing?
(Hunters and anglers.)
96
4
1
0
0
95
4
0
0 20 40 60 80 100
Very important
Somewhat
important
Not at all important
Don't know
Percent
Hunter (n=200)
Angler (n=203)

Opinions on Fish, Wildlife, and Land Use Among Vermont Residents, Hunters, and Anglers 35
KNOWLEDGE AND OPINION OF THE VERMONT FISH AND WILDLIFE DEPARTMENT
� Knowledge levels of the Department are fairly high.
• Among residents, 66% can correctly name the Vermont Fish and Wildlife Department
when asked to name the government agency most responsible for managing and
protecting all fish and wildlife in Vermont. Another 11% give an essentially correct
derivative of that name (such as Fish and Wildlife Division, Fish and Game Department,
and so forth). However, 24% do not know or give an incorrect response. (Note that the
name of the agency was said in the introduction of the survey, so the most pertinent
finding is that 24% still did not know.)
• Hunters and anglers are even more knowledgeable: 73% of hunters and 68% of anglers
name the Vermont Fish and Wildlife Department, and another 13% of hunters and 16%
of anglers give an essentially correct derivative of that name. Nonetheless, don’t
know/incorrect responses are given by 15% of hunters and 16% of anglers. (Again, take
note that the agency name was said once in the introduction of the survey.)
� The amount of knowledge that respondents have of the Department was assessed (self-
professed knowledge, no “test” was given). Not surprisingly, hunters and anglers claim more
knowledge of the Department, compared to residents.
• Most commonly, residents say that they know a moderate amount about the Department
(41% give this response) or they know a little (40%). Only 14% claim to know a great
deal.
o Self-professed knowledge levels have increased since 2003, in which only 6% of
respondents said they know a great deal and 31% said they know a moderate
amount.
• Hunters appear to be the most knowledgeable. Half of hunters claim to know a moderate
amount (50%), and another 29% claim to know a great deal. Among anglers, 37% claim
to know a moderate amount, and 28% claim to know a great deal.

36 Responsive Management
� The survey asked about satisfaction or dissatisfaction with the Department as a government
agency.
• The large majority of residents are satisfied with the Department (76%, including 44%
being very satisfied). Only 3% are dissatisfied (the remainder giving a neutral response).
o Those who went fishing in the previous 12 months are most often very satisfied
with the Department (52% stated this), whereas those who did not do any wildlife
viewing or birdwatching in the previous 12 months are least often very satisfied
(37%).
o The percent of residents who are very satisfied with the Department (44%)
increased substantially since 2003 (25%).
• Large majorities of hunters and anglers are satisfied: 76% of hunters and 80% of anglers
are satisfied (40% and 47%, respectively, are very satisfied).
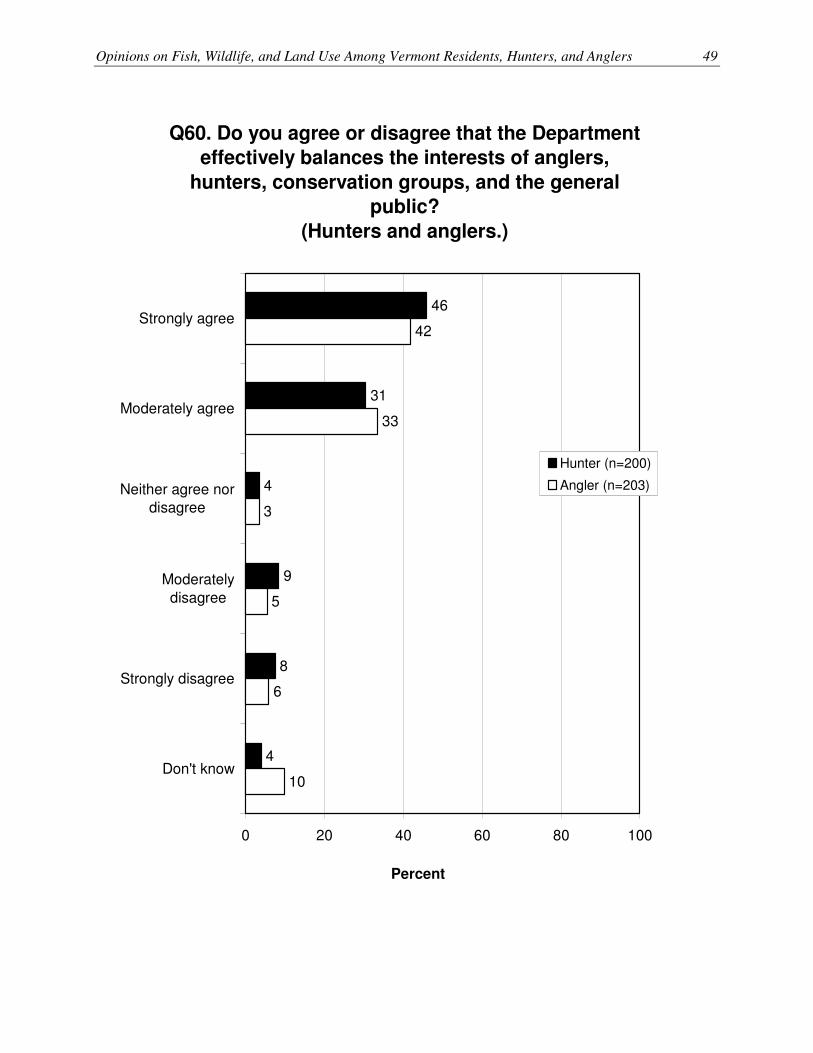
� The survey asked about how the Department does at effectively balancing the interests of
anglers, hunters, conservation groups, and the general public.
• Most residents agree that the Department achieves this balance (76% agree); meanwhile,
a small percentage disagree (7%).
o Residents who most often strongly agree are those with an income less than
$50,000 per year (54% stated this) and those who indicated they are satisfied with
the Department in general (53%).
o Residents who strongly agree that the Department achieves this balance increased
from 33% in 2003 to 42% in 2015.
• While hunters and anglers agree at about the same rate as does the general population,
their rate of disagreement is higher (at the expense of “don’t know” responses): 77% of
hunters and 75% of anglers agree; however, 17% of hunters and 11% of anglers disagree.

Opinions on Fish, Wildlife, and Land Use Among Vermont Residents, Hunters, and Anglers 37
Q18. Which government agency or department
would you say is most responsible for managing
and protecting all fish and wildlife in Vermont, from
the most common to endangered species?
(Vermont residents.)
66
11
6
18
0 20 40 60 80 100
Vermont Fish andWildlife
Department
Essentially correct
derivative of theVermont Fish and
WildlifeDepartment
Incorrect response
Don't know
Percent

38 Responsive Management
Q18. Which government agency or department
would you say is most responsible for managing
and protecting all fish and wildlife in Vermont, from
the most common to endangered species?
(Hunters and anglers.)
73
11
9
8
68
14
6
12
0 20 40 60 80 100
Vermont Fish andWildlife Department
Essentially correct
derivative of stateagency
Incorrect response
Don't know
Percent
Hunter (n=200)
Angler (n=203)

Opinions on Fish, Wildlife, and Land Use Among Vermont Residents, Hunters, and Anglers 39
Q20. Before this survey, would you say you knew a
great deal, a moderate amount, a little, or nothing
about the Vermont Fish and Wildlife Department?
(Vermont residents.)
14
41
40
5
0
0 20 40 60 80 100
A great deal
A moderate amount
A little
Nothing
Don't know
Percent (n=802)

40 Responsive Management
Q20. Before this survey, would you say you knew a great deal, a
moderate amount, a little, or nothing about the Vermont Fish and
Wildlife Department? (Vermont residents.)
50
6
31
45
16
0
4041
14
0
20
40
60
80
100
A great deal A moderate amount A little Nothing Don't know
Perc
en
t
2003 RM
2015 RM
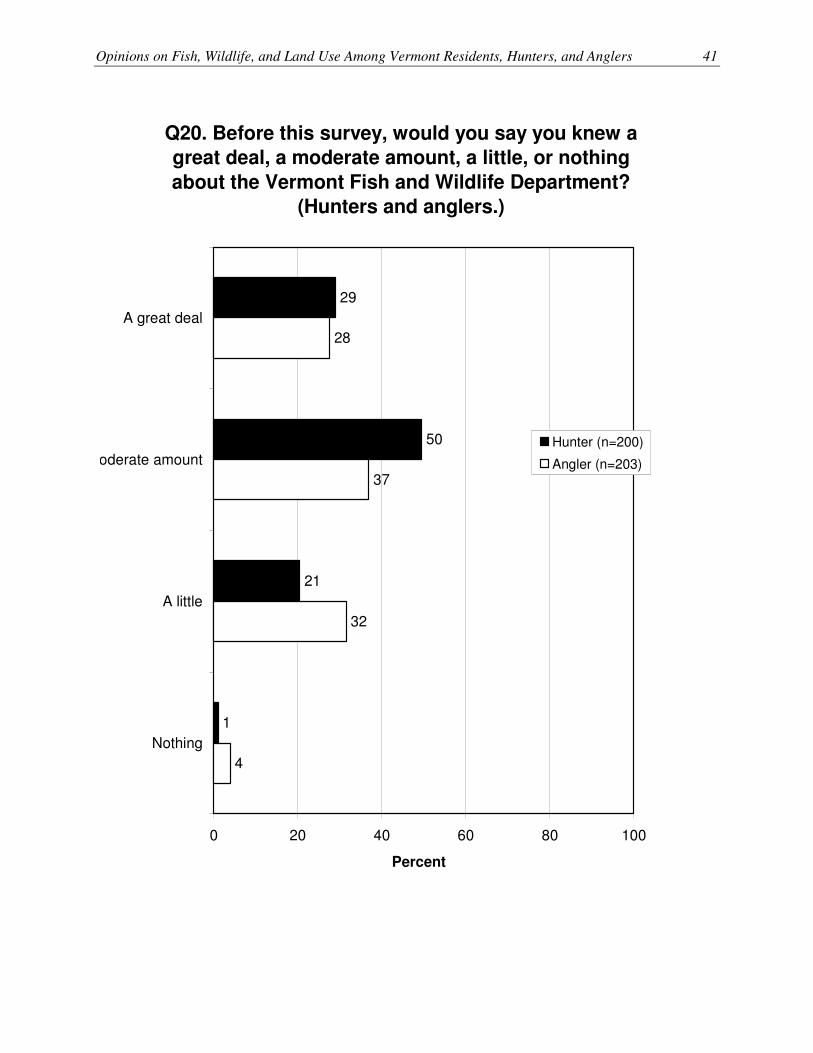
Opinions on Fish, Wildlife, and Land Use Among Vermont Residents, Hunters, and Anglers 41
Q20. Before this survey, would you say you knew a
great deal, a moderate amount, a little, or nothing
about the Vermont Fish and Wildlife Department?
(Hunters and anglers.)
29
50
21
1
28
37
32
4
0 20 40 60 80 100
A great deal
A moderate amount
A little
Nothing
Percent
Hunter (n=200)
Angler (n=203)

42 Responsive Management
Q59. Overall, are you satisfied or dissatisfied with
the Vermont Fish and Wildlife Department as a
government agency in Vermont, or do you not
know?
(Vermont residents.)
44
32
3
2
1
18
0 20 40 60 80 100
Very satisfied
Somewhat satisfied
Neither satisfied nordissatisfied
Somewhatdissatisfied
Very dissatisfied
Don't know
Percent (n=802)

Opinions on Fish, Wildlife, and Land Use Among Vermont Residents, Hunters, and Anglers 43
Q59. Percent of residents who are very satisfied
with the Vermont Fish and Wildlife Department as a
government agency in Vermont.
44.0
43.5
42.4
42.0
41.8
41.1
40.8
40.1
39.8
36.8
44.3
44.4
44.5
44.8
44.9
45.1
46.1
47.0
48.3
50.8
51.0
51.9
45.7
45.7
45.1
0 20 40 60 80 100
Went fishing
Has an income less than $50,000 per year
Went hunting
Does not have a bachelor's degree
Went canoeing or kayaking
Visited a state or national park
Went hiking
Went camping
Went wildlife viewing or birdwatching
Has an income of $50,000 or more per year
Below the median age (50)
Lives in a small city or town, or rural area
Median age (50) or olderr
Female
Total
Male
Did not go camping
Did not go canoeing or kayaking
Did not go hunting
Did not go hiking
Did not visit a state or national parkLives in a large city, urban area, or suburban
areaHas a bachelor's degree or higher
Did not go fishing
Did not do any wildlife viewing or birdwatching
Percent

44 Responsive Management
Q59. Overall, are you satisfied or dissatisfied with the Vermont Fish
and Wildlife Department as a government agency in Vermont, or do
you not know? (Vermont residents.)
2 1
18
25
32
5 6 4
28
3
32
44
0
20
40
60
80
100
Very satisfied Somewhatsatisfied
Neither satisfiednor dissatisfied
Somewhatdissatisfied
Very dissatisfied Don't know
Perc
en
t
2003 RM
2015 RM

Opinions on Fish, Wildlife, and Land Use Among Vermont Residents, Hunters, and Anglers 45
Q59. Overall, are you satisfied or dissatisfied with
the Vermont Fish and Wildlife Department as a
government agency in Vermont, or do you not
know?
(Hunters and anglers.)
40
36
4
6
7
9
47
33
1
3
3
12
0 20 40 60 80 100
Very satisfied
Somewhat satisfied
Neither satisfied nor
dissatisfied
Somewhatdissatisfied
Very dissatisfied
Don't know
Percent
Hunter (n=200)
Angler (n=203)

46 Responsive Management
Q60. Do you agree or disagree that the Department
effectively balances the interests of anglers,
hunters, conservation groups, and the general
public?
(Vermont residents.)
42
34
3
4
3
15
0 20 40 60 80 100
Strongly agree
Moderately agree
Neither agree nordisagree
Moderatelydisagree
Strongly disagree
Don't know
Percent (n=802)

Opinions on Fish, Wildlife, and Land Use Among Vermont Residents, Hunters, and Anglers 47
Q60. Percent of residents who strongly agree that
the Department effectively balances the interests of
anglers, hunters, conservation groups, and the
general public.
42.4
41.8
41.5
40.9
40.5
40.2
39.8
39.5
37.6
35.9
35.4
8.6
42.5
42.5
42.6
42.9
43.1
43.7
46.7
48.8
49.7
51.0
52.8
54.0
45.0
44.8
44.3
0 20 40 60 80 100
Has an income less than $50,000 per yearIndicated they were satisfied with the VT Dept. of
Fish and WildlifeWent fishing
Went hunting
Does not have a bachelor's degree
Went canoeing or kayaking
Did not go hiking
Male
Went camping
Lives in a small city or town, or rural area
Median age (50) or older
Went wildlife viewing or birdwatching
Visited a state or national park
Total
Below the median age (50)
Did not visit a state or national park
Has an income of $50,000 or more per year
Did not go camping
Went hiking
Female
Did not go hunting
Did not go canoeing or kayaking
Did not do any wildlife viewing or birdwatching
Did not go fishing
Lives in a large city, urban area, or suburban area
Has a bachelor's degree or higherDid not indicate they were satisfied with the VT
Dept. of Fish and Wildlife
Percent

48 Responsive Management
Q60. Do you agree or disagree that the Department effectively
balances the interests of anglers, hunters, conservation groups, and
the general public? (Vermont residents.)
4 3
15
33 34
36 5
19
3
34
42
0
20
40
60
80
100
Strongly agree Moderately agree Neither agree nordisagree
Moderatelydisagree
Strongly disagree Don't know
Perc
en
t
2003 RM
2015 RM
Opinions on Fish, Wildlife, and Land Use Among Vermont Residents, Hunters, and Anglers 49
Q60. Do you agree or disagree that the Department
effectively balances the interests of anglers,
hunters, conservation groups, and the general
public?
(Hunters and anglers.)
46
31
4
9
8
4
42
33
3
5
6
10
0 20 40 60 80 100
Strongly agree
Moderately agree
Neither agree nordisagree
Moderately
disagree
Strongly disagree
Don't know
Percent
Hunter (n=200)
Angler (n=203)

50 Responsive Management
THE INTERSECTION OF LAND USE AND FISH/WILDLIFE MANAGEMENT
IMPORTANCE OF FISH AND WILDLIFE
� One question directly compared wildlife with economic development. Wildlife is favored by
survey respondents by a large amount.
• The large majority of Vermont residents (75%) disagree that economic development is
more important than wildlife. Most of that is strong disagreement (49%). Only 12%
agree, the rest being neutral. This reflects little marked change from a 1994 study.
• Likewise, the large majority of hunters (81%) and anglers (76%) disagree, with most of
that being strong disagreement (55% of hunters, 57% of anglers). The percentages that
agree are 8% of hunters and 11% of anglers.
� The survey asked about agreement or disagreement with this statement: Threatened and
endangered species must be protected. Agreement is overwhelming.
• Among residents, 96% agree, with 81% strongly agreeing.
o This strong agreement of 81% is a major increase since 1995 (only 37% in that
survey); most of this movement came from those who moderately agree (42% in
1995 compared to 15% in 2015).
• Among hunters, 97% agree, with 86% strongly agreeing; among anglers, 95% agree, with
86% strongly agreeing.
� Agreement is also overwhelming with this statement: Knowing that Vermont’s native fish
and wildlife populations are healthy and surviving well is very important to me even if I don’t
get to see them.
• Among residents, 98% agree, with 85% strongly agreeing.
o As with the previous question, a major shift occurred since 1995 from those who
moderately agree to those who strongly agree.
• Among hunters, 98% agree, with 90% strongly agreeing; among anglers, 96% agree, with
87% strongly agreeing.

Opinions on Fish, Wildlife, and Land Use Among Vermont Residents, Hunters, and Anglers 51
Q34. Economic development is more important
than wildlife.
(Vermont residents.)
4
8
11
26
49
2
0 20 40 60 80 100
Strongly agree
Moderately agree
Neither agree nor
disagree
Moderatelydisagree
Strongly disagree
Don't know
Percent (n=802)

52 Responsive Management
Q34. Economic development is more important than wildlife.
(Vermont residents.)
6
76
19
13
75
12
0
20
40
60
80
100
Agree Disagree Neither agree nor disagree
Perc
en
t
1994 R.J. Glass and T.A. More
2015 RM

Opinions on Fish, Wildlife, and Land Use Among Vermont Residents, Hunters, and Anglers 53
Q34. Economic development is more important
than wildlife.
(Hunters and anglers.)
3
5
11
26
55
2
1
10
12
19
57
1
0 20 40 60 80 100
Strongly agree
Moderately agree
Neither agree nor
disagree
Moderately
disagree
Strongly disagree
Don't know
Percent
Hunter (n=200)
Angler (n=203)

54 Responsive Management
Q36. Threatened and endangered species must be
protected.
(Vermont residents.)
81
15
1
2
0
1
0 20 40 60 80 100
Strongly agree
Moderately agree
Neither agree nor
disagree
Moderately
disagree
Strongly disagree
Don't know
Percent (n=802)

Opinions on Fish, Wildlife, and Land Use Among Vermont Residents, Hunters, and Anglers 55
Q36. Threatened and endangered species must be protected.
(Vermont residents.)
0 2
37
42
86 7
2
15
81
0
20
40
60
80
100
Strongly agree Moderately agree Moderately disagree Strongly disagree No Opinion
Perc
en
t
1995 J. Buck and B. Williams
2015 RM
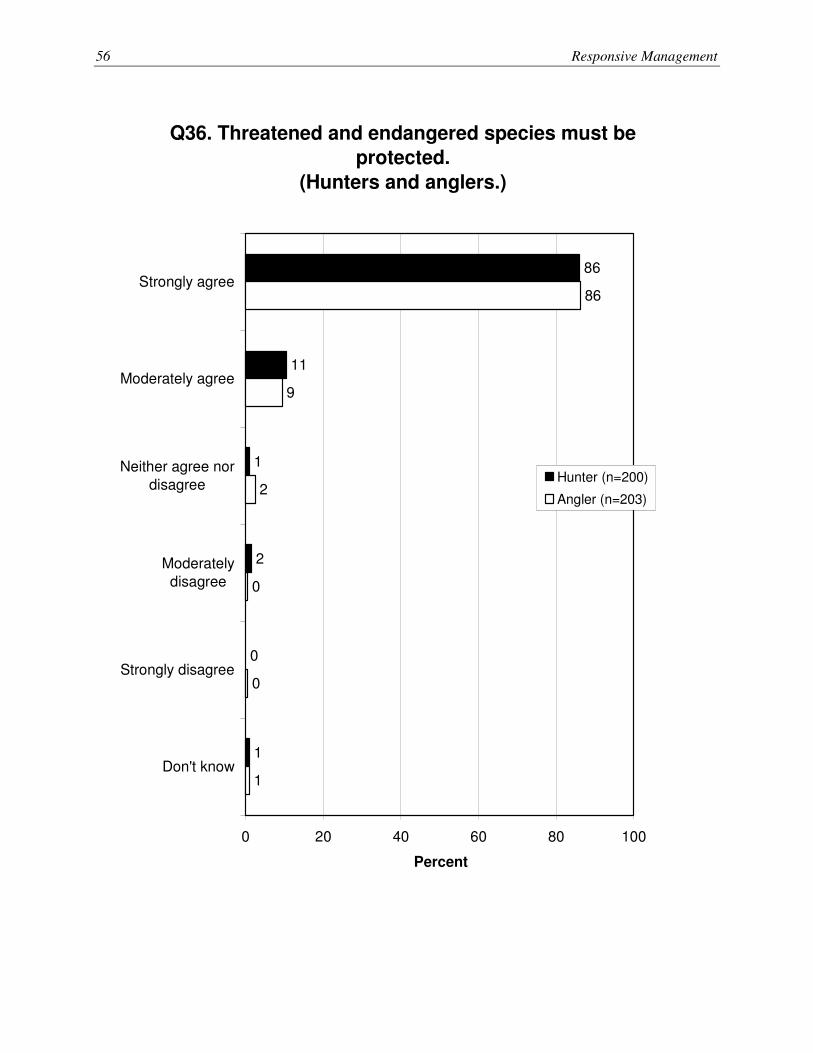
56 Responsive Management
Q36. Threatened and endangered species must be
protected.
(Hunters and anglers.)
86
11
1
2
0
1
86
9
2
0
0
1
0 20 40 60 80 100
Strongly agree
Moderately agree
Neither agree nordisagree
Moderatelydisagree
Strongly disagree
Don't know
Percent
Hunter (n=200)
Angler (n=203)
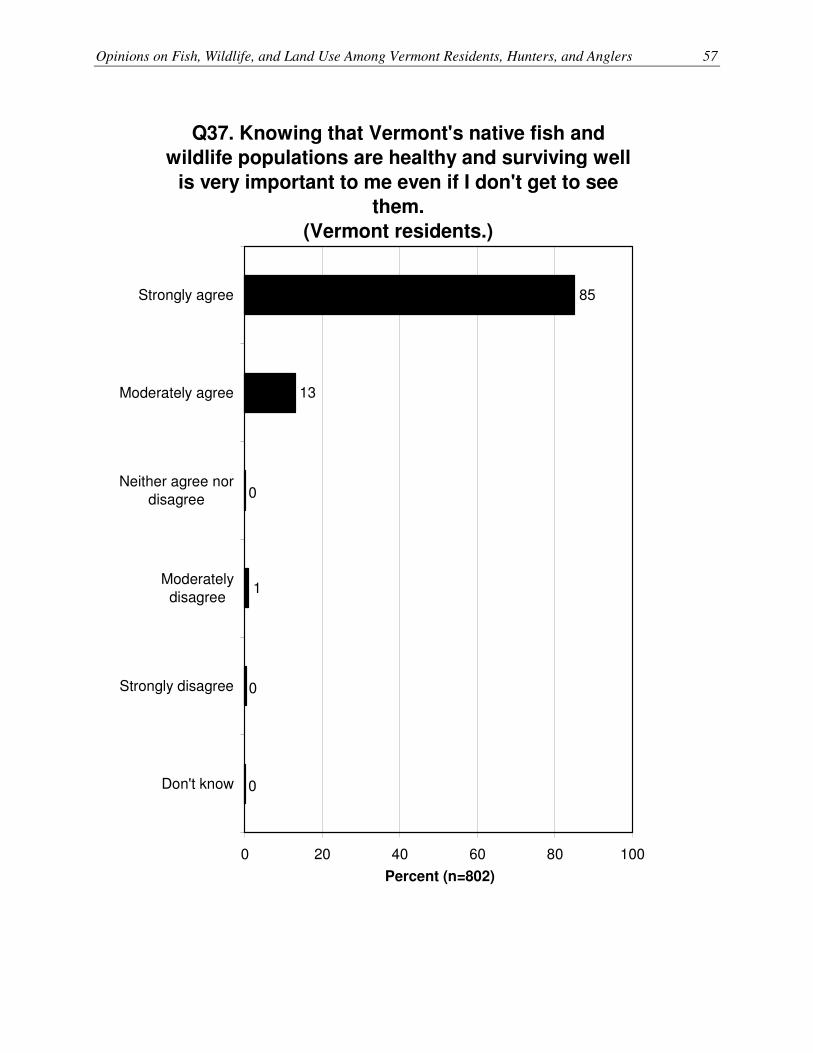
Opinions on Fish, Wildlife, and Land Use Among Vermont Residents, Hunters, and Anglers 57
Q37. Knowing that Vermont's native fish and
wildlife populations are healthy and surviving well
is very important to me even if I don't get to see
them.
(Vermont residents.)
85
13
0
1
0
0
0 20 40 60 80 100
Strongly agree
Moderately agree
Neither agree nordisagree
Moderatelydisagree
Strongly disagree
Don't know
Percent (n=802)

58 Responsive Management
Q37. Knowing that Vermont's native fish and wildlife populations are
healthy and surviving well is very important to me even if I don't get to
see them. (Vermont residents.)
0 0
54
41
1 13
1
13
85
0
20
40
60
80
100
Strongly agree Moderately agree Moderately disagree Strongly disagree No Opinion
Perc
en
t
1995 J. Buck & B. Williams
2015 RM

Opinions on Fish, Wildlife, and Land Use Among Vermont Residents, Hunters, and Anglers 59
Q37. Knowing that Vermont's native fish and
wildlife populations are healthy and surviving well
is very important to me even if I don't get to see
them.
(Hunters and anglers.)
90
8
1
1
1
0
87
9
1
0
1
1
0 20 40 60 80 100
Strongly agree
Moderately agree
Neither agree nordisagree
Moderatelydisagree
Strongly disagree
Don't know
Percent
Hunter (n=200)
Angler (n=203)

60 Responsive Management
OPINIONS ON LAND USE IN VERMONT
� The survey asked for opinions on the amount of state-owned land in Vermont: should it be
increased, decreased, or stay the same? It is roughly split between stay the same and
increased; very few want it decreased.
• Most commonly, residents think that the amount of state-owned land should stay the
same (47% give this response). Otherwise, residents are much more likely to say that
they want it increased (39%) than decreased (5%).
o Since 1997, the percent of residents who want the amount of state-owned land to
increase has declined (61% in 1997 compared to 39% in 2015), with more
residents now wanting the amount to stay the same (28% in 1997 versus 47% in
2015).
• Responses are similar among hunters and anglers. The most common response is stay the
same (45% of hunters, 48% of anglers), and those wanting an increase (44% of hunters,
40% of anglers) far outnumber those wanting a decrease (5% of hunters, 6% of anglers).
� Respondents generally think that state ownership of land is important to maintain biological
diversity. (The survey provided this definition: “Biological diversity is the variety of
organisms, including, but not limited to, plants, animals, fish, insects, and micro-organisms
like bacteria, represented in Vermont and the habitats and processes that support them.”)
• The overwhelming majority of residents (89%) think that state ownership of land is
important to maintain biological diversity, most of that being in the very important
response.
• Hunters and anglers are similar to residents on this question: 90% of hunters think it is
important (62% thinking it is very important), and 87% of anglers think it is important
(61% saying very important).
� Respondents overwhelmingly think it is important that ecologically important habitats and
land in Vermont are being protected and preserved.
• Among residents, 97% think this is important, including 75% who say it is very
important. There is little marked change since 2000.

Opinions on Fish, Wildlife, and Land Use Among Vermont Residents, Hunters, and Anglers 61
o Residents who most often think this is very important are those who live in a large
city, urban area, or suburban area (87% stated this) and those with an income less
than $50,000 per year (82%).
• Among hunters, 98% think this is important, including 74% who say it is very important,
and among anglers, 94% think this is important, including 70% who say it is very
important.
Q40. Do you think the percentage of state-owned
land should increase, decrease, or stay the same?
(Vermont residents.)
39
47
5
10
0 20 40 60 80 100
Increase
Stay the same
Decrease
Don't know
Percent (n=802)

62 Responsive Management
Q40. Do you think the percentage of state-owned land should
increase, decrease, or stay the same? (Vermont residents.)
10
61
28
3
85
47
39
0
20
40
60
80
100
Increase Stay the same Decrease Don't know
Pe
rce
nt
1997 ANR
2015 RM

Opinions on Fish, Wildlife, and Land Use Among Vermont Residents, Hunters, and Anglers 63
Q40. Do you think the percentage of state-owned
land should increase, decrease, or stay the same?
(Hunters and anglers.)
44
45
5
6
40
48
6
6
0 20 40 60 80 100
Increase
Stay the same
Decrease
Don't know
Percent
Hunter (n=200)
Angler (n=203)

64 Responsive Management
Q41. Do you think state ownership of land to
maintain biological diversity is important or
unimportant?
(Vermont residents.)
64
25
2
5
2
3
0 20 40 60 80 100
Very important
Somewhatimportant
Neither importantnor unimportant
Somewhat
unimportant
Very unimportant
Don't know
Percent (n=802)

Opinions on Fish, Wildlife, and Land Use Among Vermont Residents, Hunters, and Anglers 65
Q41. Do you think state ownership of land to
maintain biological diversity is important or
unimportant?
(Hunters and anglers.)
62
28
3
5
1
2
61
26
1
5
2
5
0 20 40 60 80 100
Very important
Somewhat
important
Neither importantnor unimportant
Somewhat
unimportant
Very unimportant
Don't know
Percent
Hunter (n=200)
Angler (n=203)

66 Responsive Management
Q48. How important is it to you that ecologically
important habitats and lands in Vermont are being
protected and preserved?
(Vermont residents.)
75
22
1
1
0
1
0 20 40 60 80 100
Very important
Somewhatimportant
Neither important
nor unimportant
Somewhat
unimportant
Very unimportant
Don't know
Percent (n=802)

Opinions on Fish, Wildlife, and Land Use Among Vermont Residents, Hunters, and Anglers 67
Q48. Percent of residents who think it is very
important that ecologically important habitats and
lands in Vermont are being protected and
preserved.
73.9
73.8
73.5
73.4
73.1
73.0
72.6
72.1
71.6
70.7
67.4
66.8
75.6
75.7
75.7
87.4
81.7
77.3
77.0
76.0
75.8
75.4
75.2
75.2
74.9
74.6
74.1
0 20 40 60 80 100
Lives in a large city, urban area, or suburban area
Has an income less than $50,000 per year
Below the median age (50)
Did not go hunting
Visited a state or national park
Went campingIndicated they were satisfied with the VT Dept. of
Fish and WildlifeMale
Went hiking
Went wildlife viewing or birdwatching
Went canoeing or kayaking
Did not go fishing
Has a bachelor's degree or higher
Total
Did not go canoeing or kayaking
Did not go camping
Does not have a bachelor's degree
Went fishing
Female
Has an income of $50,000 or more per year
Did not go hiking
Lives in a small city or town, or rural area
Did not visit a state or national park
Median age (50) or olderrDid not indicate they were satisfied with the VT
Dept. of Fish and WildlifeDid not do any wildlife viewing or birdwatching
Went hunting
Percent

68 Responsive Management
Q48. How important is it to you that ecologically important habitats
and lands in Vermont are being protected and preserved?
(Vermont residents.)
2
77
20
1 20
23
75
0
20
40
60
80
100
Very important Somewhat important Very unimportant Don't know / no opinion
Perc
en
t
2000 RM
2015 RM

Opinions on Fish, Wildlife, and Land Use Among Vermont Residents, Hunters, and Anglers 69
Q48. How important is it to you that ecologically
important habitats and lands in Vermont are being
protected and preserved?
(Hunters and anglers.)
74
24
1
2
0
1
70
24
4
0
1
0
0 20 40 60 80 100
Very important
Somewhatimportant
Neither importantnor unimportant
Somewhatunimportant
Very unimportant
Don't know
Percent
Hunter (n=200)
Angler (n=203)
70 Responsive Management
� Finally in this section, the survey presented four statements to respondents that pertain to the
tradeoff between land development and habitat protection. For each, respondents indicated if
they agree or disagree with it. In general, they side with habitat protection over unfettered
use of land.
• Among residents, agreement is high that the use and development of land should be
restricted to protect fish and wildlife (83%) and that wildlife habitat must be protected
even if it reduces the land use options of some landowners and developers (81%).
However, statements favoring development are not well received: disagreement ranges
from 74% to 77% on the two statements that favor development over wildlife, as shown
on the graphs. There is little marked change since 2003.
• Hunters and anglers are much the same as residents.

Opinions on Fish, Wildlife, and Land Use Among Vermont Residents, Hunters, and Anglers 71
Q44-47: Percent of residents who strongly agree
with the following:
47
46
5
3
0 20 40 60 80 100
Q44. Wildlife habitat must be protectedeven if it reduces the land use options of
some landowners and developers.
Q45. The use and development of landshould be restricted to protect fish and
wildlife.
Q46. Landowners should be allowed to
develop their land regardless of itsimpact on wildlife.
Q47. If it came down to a choicebetween preserving wildlife habitat or
providing land for new homes, we shouldalways side with providing new homes
for the residents of our state.
Percent
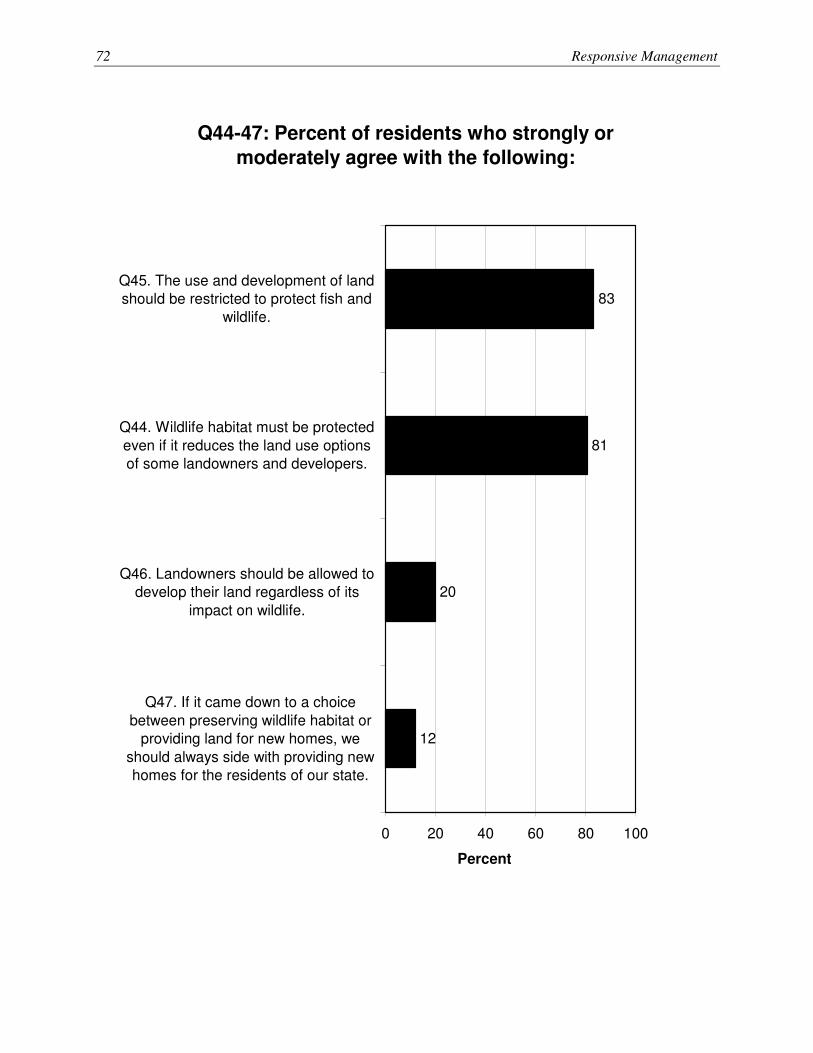
72 Responsive Management
Q44-47: Percent of residents who strongly or
moderately agree with the following:
83
81
20
12
0 20 40 60 80 100
Q45. The use and development of landshould be restricted to protect fish and
wildlife.
Q44. Wildlife habitat must be protected
even if it reduces the land use optionsof some landowners and developers.
Q46. Landowners should be allowed todevelop their land regardless of its
impact on wildlife.
Q47. If it came down to a choice
between preserving wildlife habitat orproviding land for new homes, we
should always side with providing newhomes for the residents of our state.
Percent
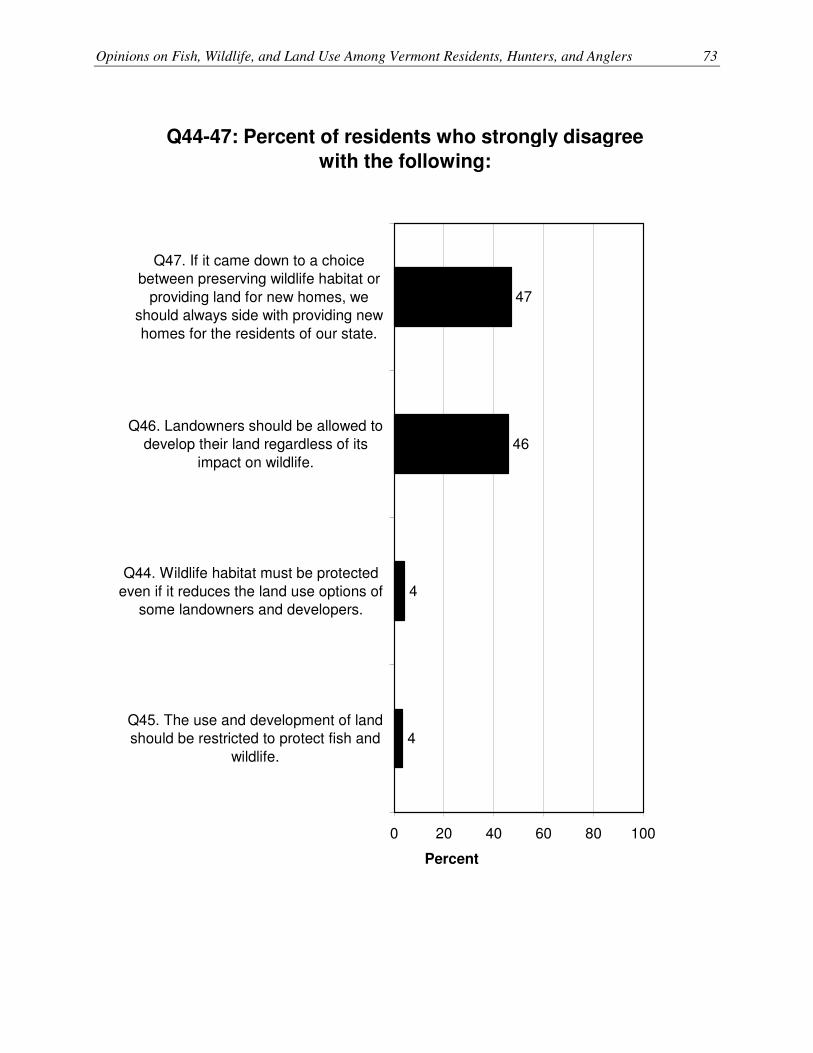
Opinions on Fish, Wildlife, and Land Use Among Vermont Residents, Hunters, and Anglers 73
Q44-47: Percent of residents who strongly disagree
with the following:
47
46
4
4
0 20 40 60 80 100
Q47. If it came down to a choicebetween preserving wildlife habitat or
providing land for new homes, weshould always side with providing new
homes for the residents of our state.
Q46. Landowners should be allowed todevelop their land regardless of its
impact on wildlife.
Q44. Wildlife habitat must be protected
even if it reduces the land use options ofsome landowners and developers.
Q45. The use and development of landshould be restricted to protect fish and
wildlife.
Percent
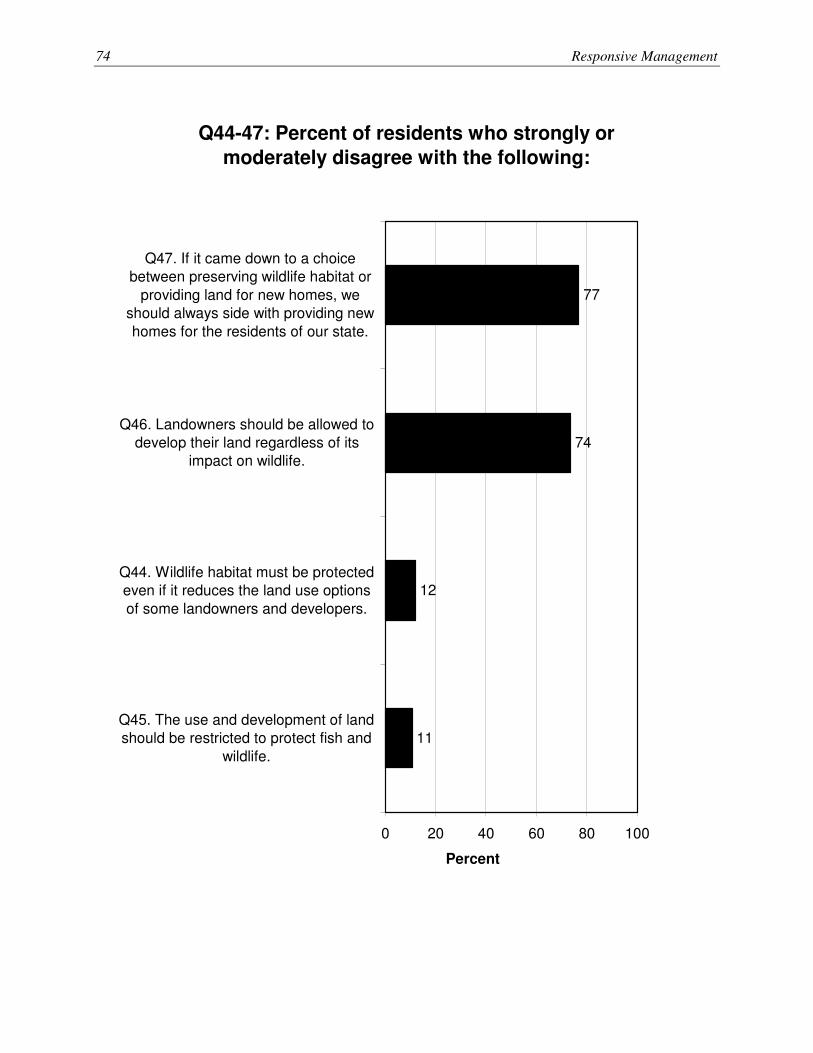
74 Responsive Management
Q44-47: Percent of residents who strongly or
moderately disagree with the following:
77
74
12
11
0 20 40 60 80 100
Q47. If it came down to a choicebetween preserving wildlife habitat or
providing land for new homes, weshould always side with providing new
homes for the residents of our state.
Q46. Landowners should be allowed todevelop their land regardless of its
impact on wildlife.
Q44. Wildlife habitat must be protectedeven if it reduces the land use options
of some landowners and developers.
Q45. The use and development of landshould be restricted to protect fish and
wildlife.
Percent

Opinions on Fish, Wildlife, and Land Use Among Vermont Residents, Hunters, and Anglers 75
Q44. Wildlife habitat must be protected even if it reduces the land use
options of some landowners and developers. (Vermont residents.)
48
34
43
106 78
34
47
0
20
40
60
80
100
Strongly agree Moderately agree Moderately disagree Strongly disagree No opinion
Perc
en
t
1995 J. Buck & B. Williams
2015 RM
Q45. The use and development of land should be restricted to protect
fish and wildlife. (Vermont residents.)
74
48
27
8 855
37
46
0
20
40
60
80
100
Strongly agree Moderately agree Neither agree nordisagree
Moderately disagree Strongly disagree
Perc
en
t
2003 RM
2015 RM

76 Responsive Management
Q46. Landowners should be allowed to develop their land regardless
of its impact on wildlife. (Vermont residents.)
28
46
1
8
14
6
19
47
56
15
5
0
20
40
60
80
100
Strongly agree Moderately agree Neither agree nor
disagree
Moderately
disagree
Strongly disagree Don't know
Perc
en
t
2003 RM
2015 RM
Q47. If it came down to a choice between preserving wildlife habitat or
providing land for new homes, we should always side with providing
new homes for the residents of our state. (Vermont residents.)
30
47
248 8
23
53
599
3
0
20
40
60
80
100
Strongly agree Moderately agree Neither agree nordisagree
Moderatelydisagree
Strongly disagree Don't know
Perc
en
t
2003 RM
2015 RM
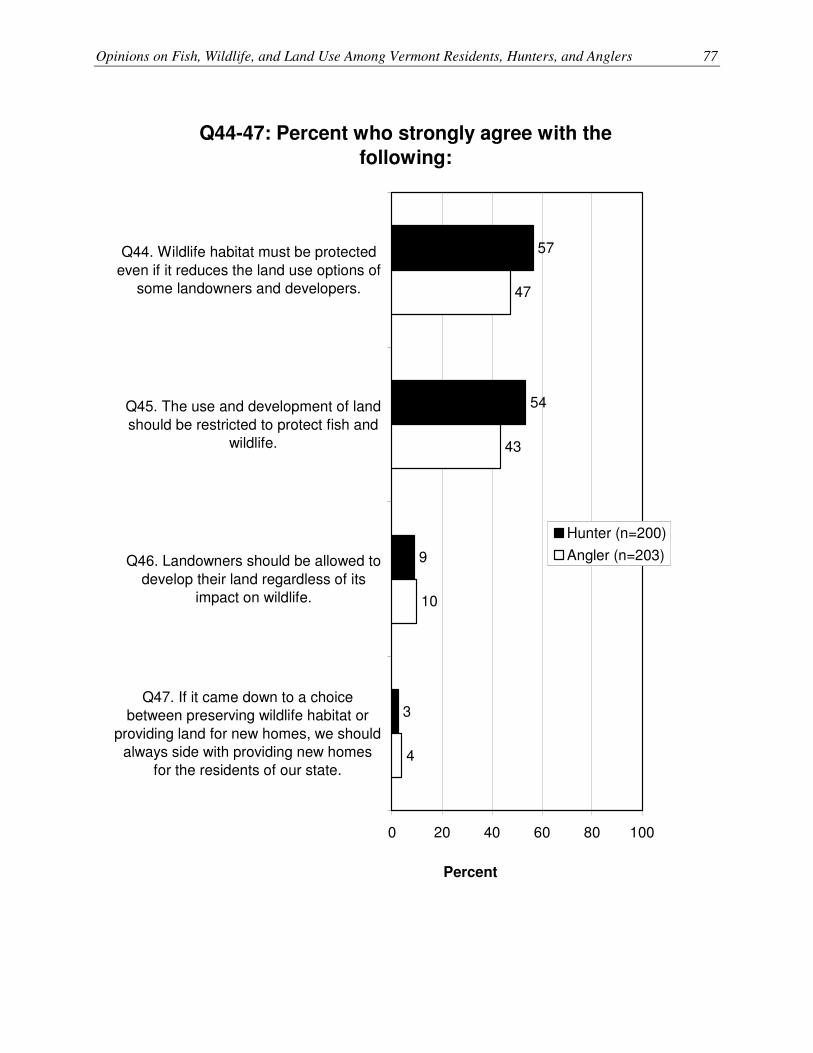
Opinions on Fish, Wildlife, and Land Use Among Vermont Residents, Hunters, and Anglers 77
Q44-47: Percent who strongly agree with the
following:
4
57
54
9
3
47
43
10
0 20 40 60 80 100
Q44. Wildlife habitat must be protected
even if it reduces the land use options ofsome landowners and developers.
Q45. The use and development of land
should be restricted to protect fish andwildlife.
Q46. Landowners should be allowed to
develop their land regardless of itsimpact on wildlife.
Q47. If it came down to a choicebetween preserving wildlife habitat or
providing land for new homes, we shouldalways side with providing new homes
for the residents of our state.
Percent
Hunter (n=200)
Angler (n=203)
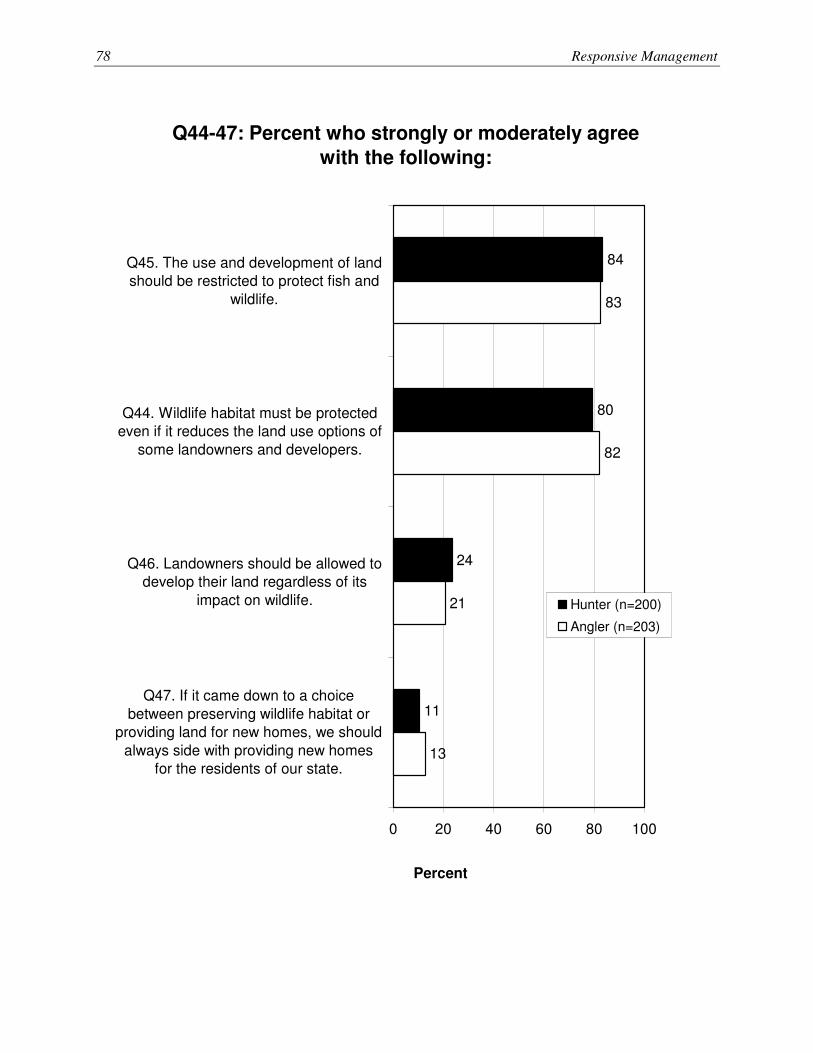
78 Responsive Management
Q44-47: Percent who strongly or moderately agree
with the following:
13
84
80
24
11
83
82
21
0 20 40 60 80 100
Q45. The use and development of landshould be restricted to protect fish and
wildlife.
Q44. Wildlife habitat must be protectedeven if it reduces the land use options of
some landowners and developers.
Q46. Landowners should be allowed todevelop their land regardless of its
impact on wildlife.
Q47. If it came down to a choice
between preserving wildlife habitat orproviding land for new homes, we should
always side with providing new homesfor the residents of our state.
Percent
Hunter (n=200)
Angler (n=203)

Opinions on Fish, Wildlife, and Land Use Among Vermont Residents, Hunters, and Anglers 79
Q44-47: Percent who strongly disagree with the
following:
3
49
37
6
3
44
38
5
0 20 40 60 80 100
Q47. If it came down to a choicebetween preserving wildlife habitat or
providing land for new homes, we shouldalways side with providing new homes
for the residents of our state.
Q46. Landowners should be allowed todevelop their land regardless of its
impact on wildlife.
Q44. Wildlife habitat must be protectedeven if it reduces the land use options of
some landowners and developers.
Q45. The use and development of landshould be restricted to protect fish and
wildlife.
Percent
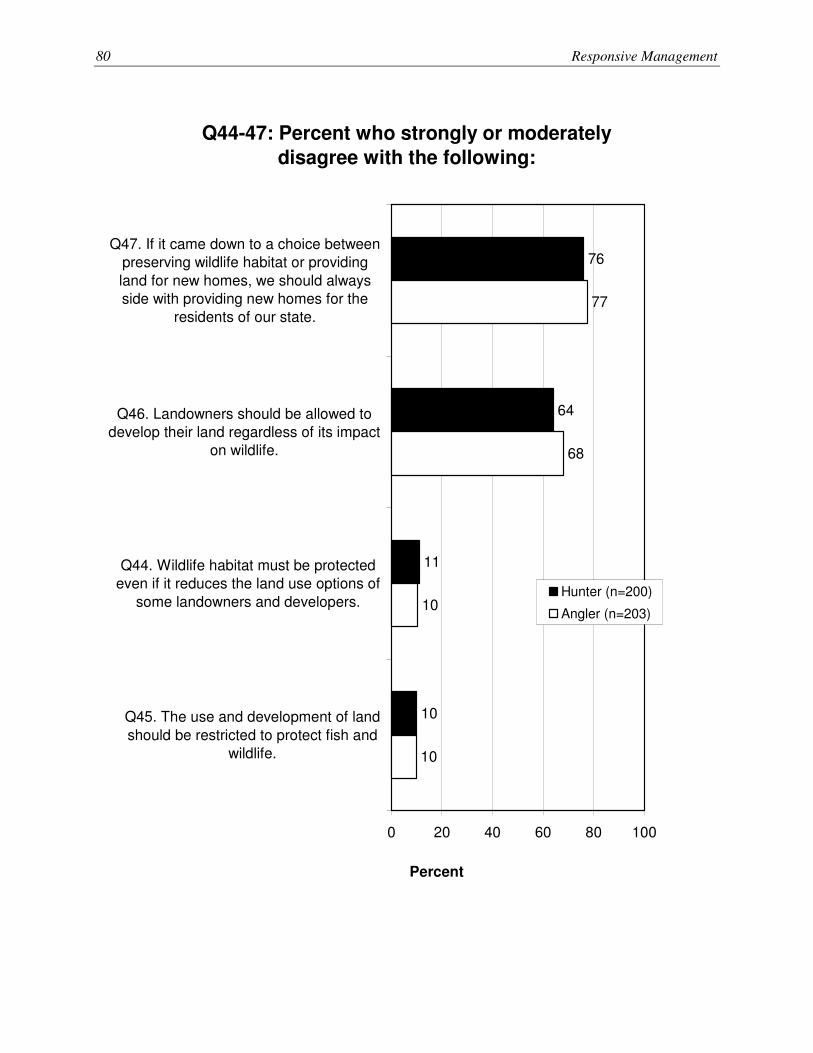
80 Responsive Management
Q44-47: Percent who strongly or moderately
disagree with the following:
10
76
64
11
10
77
68
10
0 20 40 60 80 100
Q47. If it came down to a choice betweenpreserving wildlife habitat or providing
land for new homes, we should alwaysside with providing new homes for the
residents of our state.
Q46. Landowners should be allowed todevelop their land regardless of its impact
on wildlife.
Q44. Wildlife habitat must be protectedeven if it reduces the land use options of
some landowners and developers.
Q45. The use and development of land
should be restricted to protect fish andwildlife.
Percent
Hunter (n=200)
Angler (n=203)
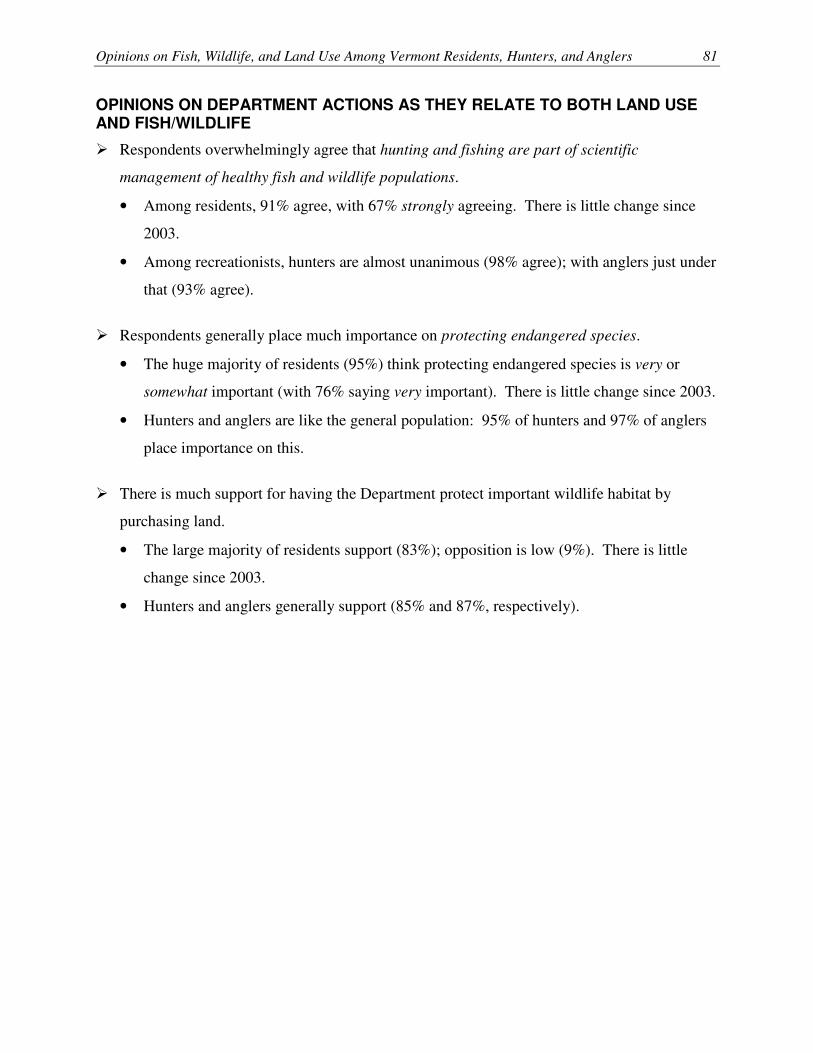
Opinions on Fish, Wildlife, and Land Use Among Vermont Residents, Hunters, and Anglers 81
OPINIONS ON DEPARTMENT ACTIONS AS THEY RELATE TO BOTH LAND USE AND FISH/WILDLIFE
� Respondents overwhelmingly agree that hunting and fishing are part of scientific
management of healthy fish and wildlife populations.
• Among residents, 91% agree, with 67% strongly agreeing. There is little change since
2003.
• Among recreationists, hunters are almost unanimous (98% agree); with anglers just under
that (93% agree).
� Respondents generally place much importance on protecting endangered species.
• The huge majority of residents (95%) think protecting endangered species is very or
somewhat important (with 76% saying very important). There is little change since 2003.
• Hunters and anglers are like the general population: 95% of hunters and 97% of anglers
place importance on this.
� There is much support for having the Department protect important wildlife habitat by
purchasing land.
• The large majority of residents support (83%); opposition is low (9%). There is little
change since 2003.
• Hunters and anglers generally support (85% and 87%, respectively).

82 Responsive Management
Q35. Hunting and fishing are part of scientific
management of healthy fish and wildlife
populations.
(Vermont residents.)
67
24
3
3
3
2
0 20 40 60 80 100
Strongly agree
Moderately agree
Neither agree nor
disagree
Moderately
disagree
Strongly disagree
Don't know
Percent (n=802)

Opinions on Fish, Wildlife, and Land Use Among Vermont Residents, Hunters, and Anglers 83
Q35. Hunting and fishing are part of scientific management of healthy
fish and wildlife populations. (Vermont residents.)
3 3 2
64
24
2 3 26
3
24
67
0
20
40
60
80
100
Strongly agree Moderately agree Neither agree nordisagree
Moderatelydisagree
Strongly disagree Don't know
Perc
en
t
2003 RM
2015 RM

84 Responsive Management
Q35. Hunting and fishing are part of scientific
management of healthy fish and wildlife
populations.
(Hunters and anglers.)
84
14
0
2
1
1
73
20
2
1
2
1
0 20 40 60 80 100
Strongly agree
Moderately agree
Neither agree nordisagree
Moderatelydisagree
Strongly disagree
Don't know
Percent
Hunter (n=200)
Angler (n=203)

Opinions on Fish, Wildlife, and Land Use Among Vermont Residents, Hunters, and Anglers 85
Q39. Do you think protecting endangered species
is an important or unimportant program for the
Department?
(Vermont residents.)
76
19
1
2
1
1
0 20 40 60 80 100
Very important
Somewhatimportant
Neither importantnor unimportant
Somewhatunimportant
Very unimportant
Don't know
Percent (n=802)
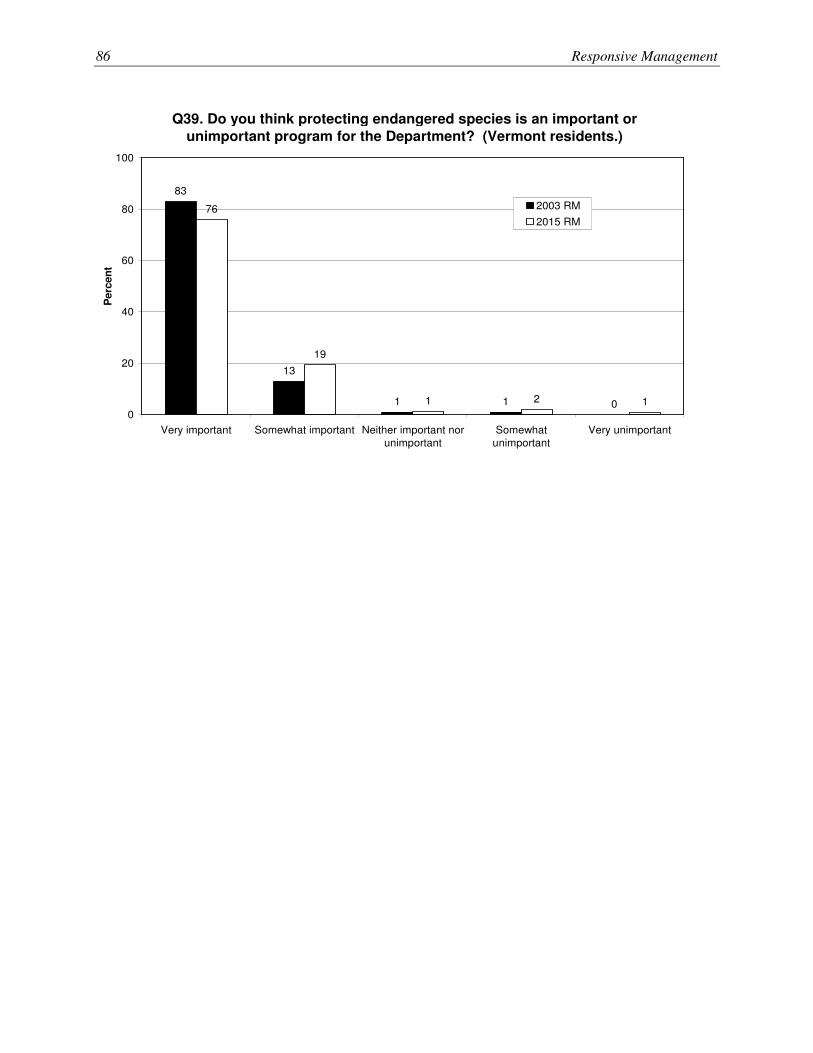
86 Responsive Management
Q39. Do you think protecting endangered species is an important or
unimportant program for the Department? (Vermont residents.)
2 1
83
13
1 1 01
19
76
0
20
40
60
80
100
Very important Somewhat important Neither important norunimportant
Somewhatunimportant
Very unimportant
Perc
en
t
2003 RM
2015 RM

Opinions on Fish, Wildlife, and Land Use Among Vermont Residents, Hunters, and Anglers 87
Q39. Do you think protecting endangered species
is an important or unimportant program for the
Department?
(Hunters and anglers.)
77
18
1
3
1
0
84
13
0
1
0
1
0 20 40 60 80 100
Very important
Somewhatimportant
Neither importantnor unimportant
Somewhatunimportant
Very unimportant
Don't know
Percent
Hunter (n=200)
Angler (n=203)

88 Responsive Management
Q49. Do you support or oppose the Department
protecting important wildlife habitat by purchasing
land?
(Vermont residents.)
50
33
4
5
4
4
0 20 40 60 80 100
Strongly support
Moderately support
Neither support nor
oppose
Moderately oppose
Strongly oppose
Don't know
Percent (n=802)

Opinions on Fish, Wildlife, and Land Use Among Vermont Residents, Hunters, and Anglers 89
Q49. Do you support or oppose the Department protecting important
wildlife habitat by purchasing land? (Vermont residents.)
48
50
35
5 37
5
33
50
0
20
40
60
80
100
Strongly support Moderately support Moderately oppose Strongly oppose Don't know / noopinion
Perc
en
t
RM 1996
RM 2015
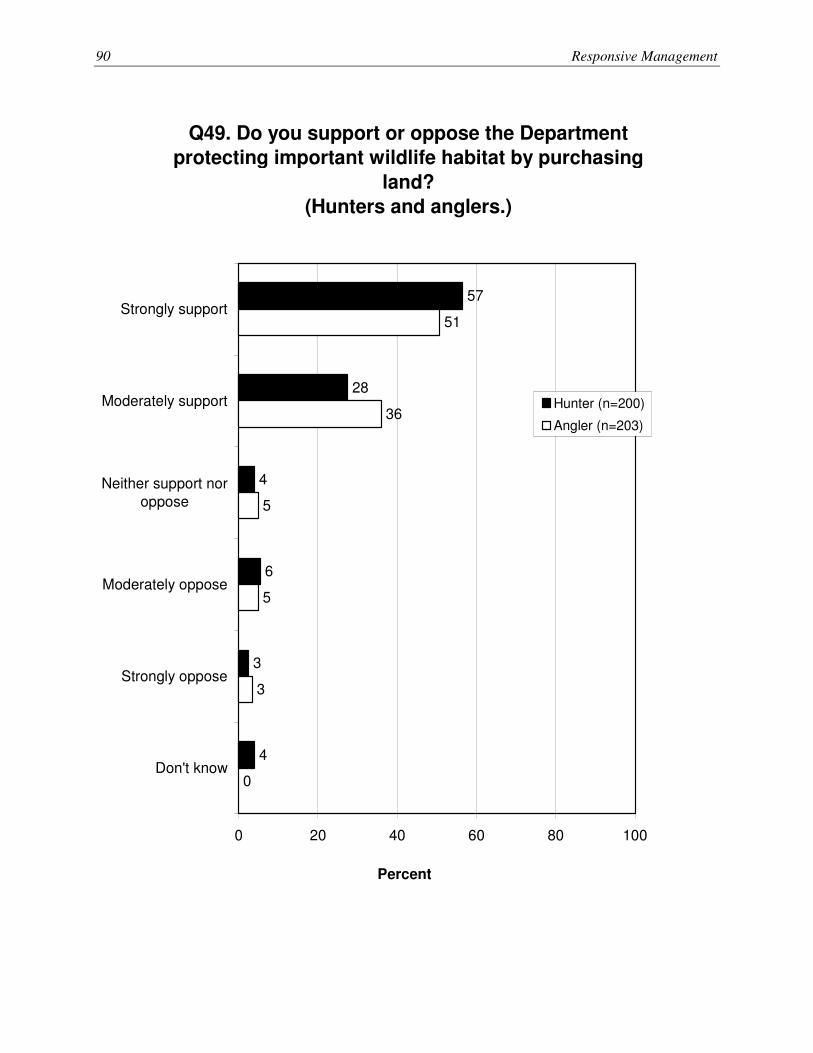
90 Responsive Management
Q49. Do you support or oppose the Department
protecting important wildlife habitat by purchasing
land?
(Hunters and anglers.)
57
28
4
6
3
4
51
36
5
5
3
0
0 20 40 60 80 100
Strongly support
Moderately support
Neither support noroppose
Moderately oppose
Strongly oppose
Don't know
Percent
Hunter (n=200)
Angler (n=203)

Opinions on Fish, Wildlife, and Land Use Among Vermont Residents, Hunters, and Anglers 91
� The survey presented six possible strategies for protecting land for fish and wildlife. For
each strategy, respondents rated their level of support for it or opposition to it. (Prior to the
question, they were given this introduction: The Vermont Fish and Wildlife Department uses
its funding and personnel to support a wide variety of programs, including outdoor
recreation, fish and wildlife management and protection, and land conservation. Having both
enough land and high quality land is important for fish and wildlife management and
protection. Increasing or improving conservation efforts will require additional
expenditures.)
• Residents most favor the provision of technical assistance/guidance (75% strongly
support) and tax incentives (70%). Furthermore, the purchase of conservation easements
(62%) is favored over outright purchase of land (46%). (Note that when looking at strong
or moderate support, the percentages are very high—from 78% to 95%.) In the middle
are two strategies that entail more regulation.
o Support for the Department acquiring more state land has slightly decreased since
1996.
• Hunters and anglers also show the most support for technical assistance/guidance and tax
incentives. In the middle are requiring developers to provide mitigation actions and the
purchase of conservation easements. At the bottom for hunters and anglers are
purchasing more state land and more government regulations.

92 Responsive Management
Q52-57: Percent of residents who strongly support
each of the following strategies for protecting land
for fish and wildlife:
75
70
62
57
49
46
0 20 40 60 80 100
Q53. Providing technical assistanceand guidance to landowners and towns
for managing land for the purpose ofprotecting fish and wildlife
Q55. Offering a "current use" propertytax incentive
Q54. Purchasing conservation
easements
Q56. Requiring developers to offset
impacts on wildlife habitat by providingmitigation
Q57. Legislation or governmentregulation that would further protect
land for fish and wildlife
Q52. Acquiring more state land for the
purpose of protecting fish and wildlife
Percent

Opinions on Fish, Wildlife, and Land Use Among Vermont Residents, Hunters, and Anglers 93
Q52-57: Percent of residents who strongly or
moderately support each of the following
strategies for protecting land for fish and wildlife:
95
90
89
84
79
78
0 20 40 60 80 100
Q53. Providing technical assistance
and guidance to landowners and townsfor managing land for the purpose of
protecting fish and wildlife
Q55. Offering a "current use" propertytax incentive
Q54. Purchasing conservationeasements
Q56. Requiring developers to offsetimpacts on wildlife habitat by providing
mitigation
Q52. Acquiring more state land for thepurpose of protecting fish and wildlife
Q57. Legislation or governmentregulation that would further protect
land for fish and wildlife
Percent
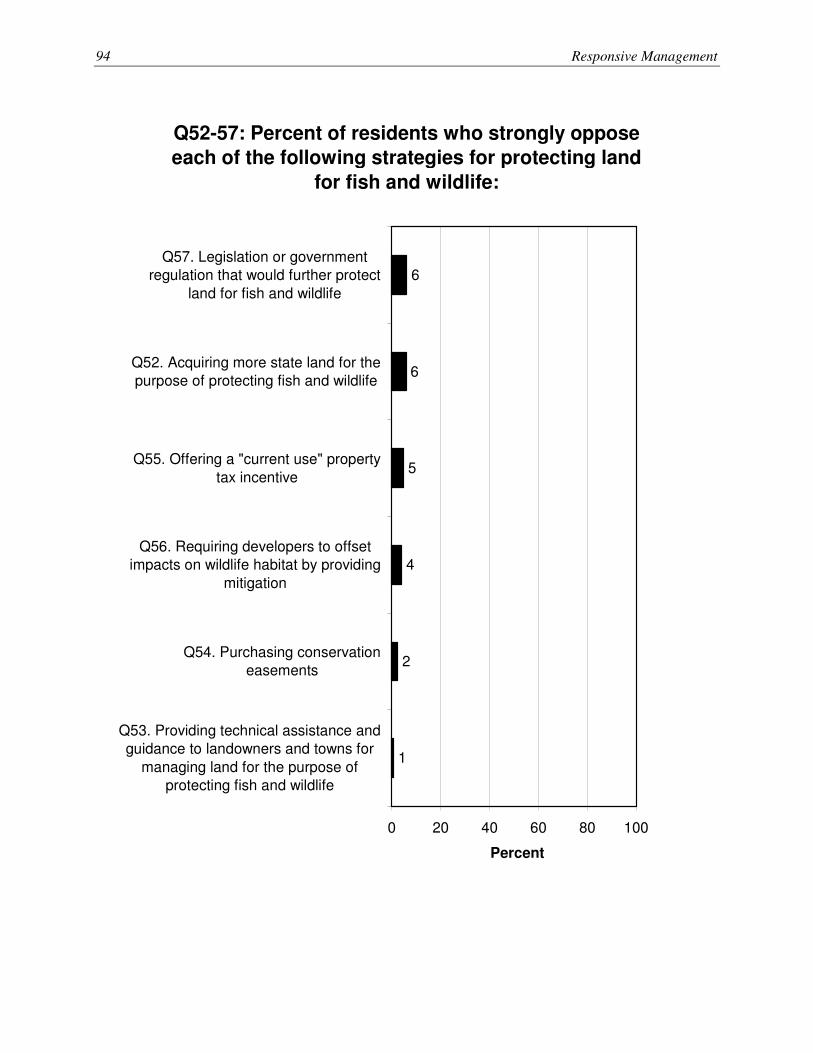
94 Responsive Management
Q52-57: Percent of residents who strongly oppose
each of the following strategies for protecting land
for fish and wildlife:
6
6
5
4
2
1
0 20 40 60 80 100
Q57. Legislation or governmentregulation that would further protect
land for fish and wildlife
Q52. Acquiring more state land for thepurpose of protecting fish and wildlife
Q55. Offering a "current use" property
tax incentive
Q56. Requiring developers to offsetimpacts on wildlife habitat by providing
mitigation
Q54. Purchasing conservationeasements
Q53. Providing technical assistance andguidance to landowners and towns for
managing land for the purpose ofprotecting fish and wildlife
Percent
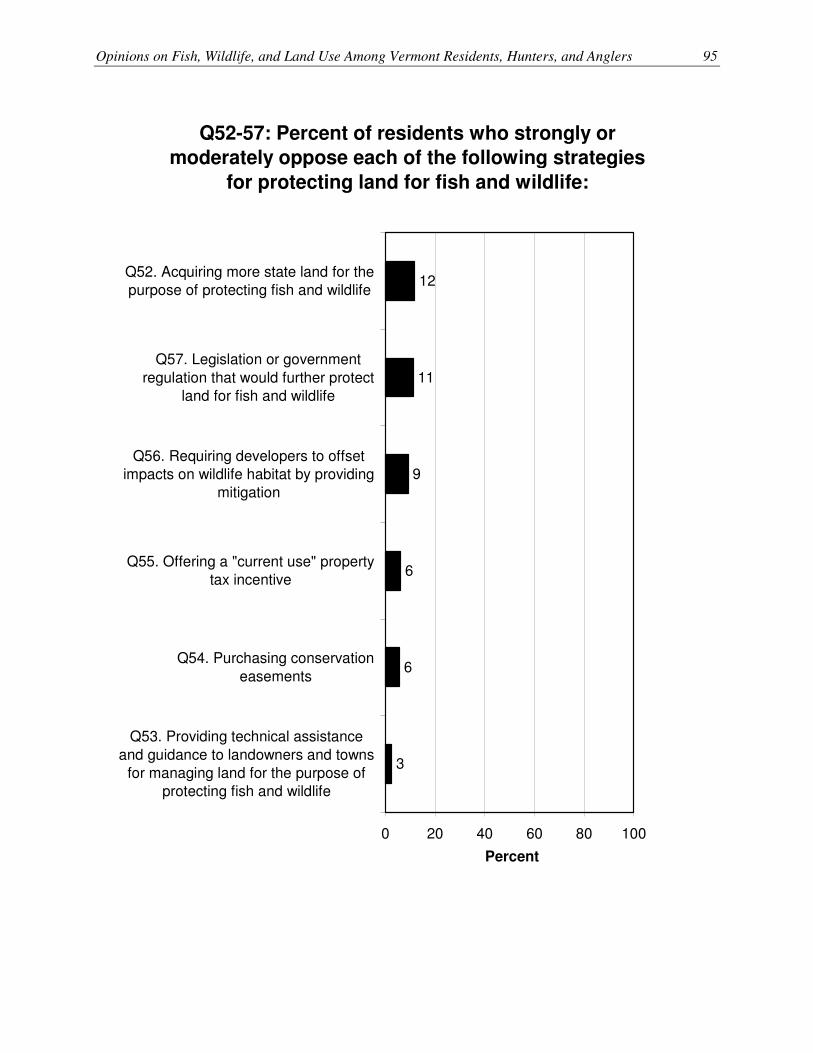
Opinions on Fish, Wildlife, and Land Use Among Vermont Residents, Hunters, and Anglers 95
Q52-57: Percent of residents who strongly or
moderately oppose each of the following strategies
for protecting land for fish and wildlife:
12
11
9
6
6
3
0 20 40 60 80 100
Q52. Acquiring more state land for thepurpose of protecting fish and wildlife
Q57. Legislation or government
regulation that would further protectland for fish and wildlife
Q56. Requiring developers to offsetimpacts on wildlife habitat by providing
mitigation
Q55. Offering a "current use" propertytax incentive
Q54. Purchasing conservation
easements
Q53. Providing technical assistance
and guidance to landowners and townsfor managing land for the purpose of
protecting fish and wildlife
Percent
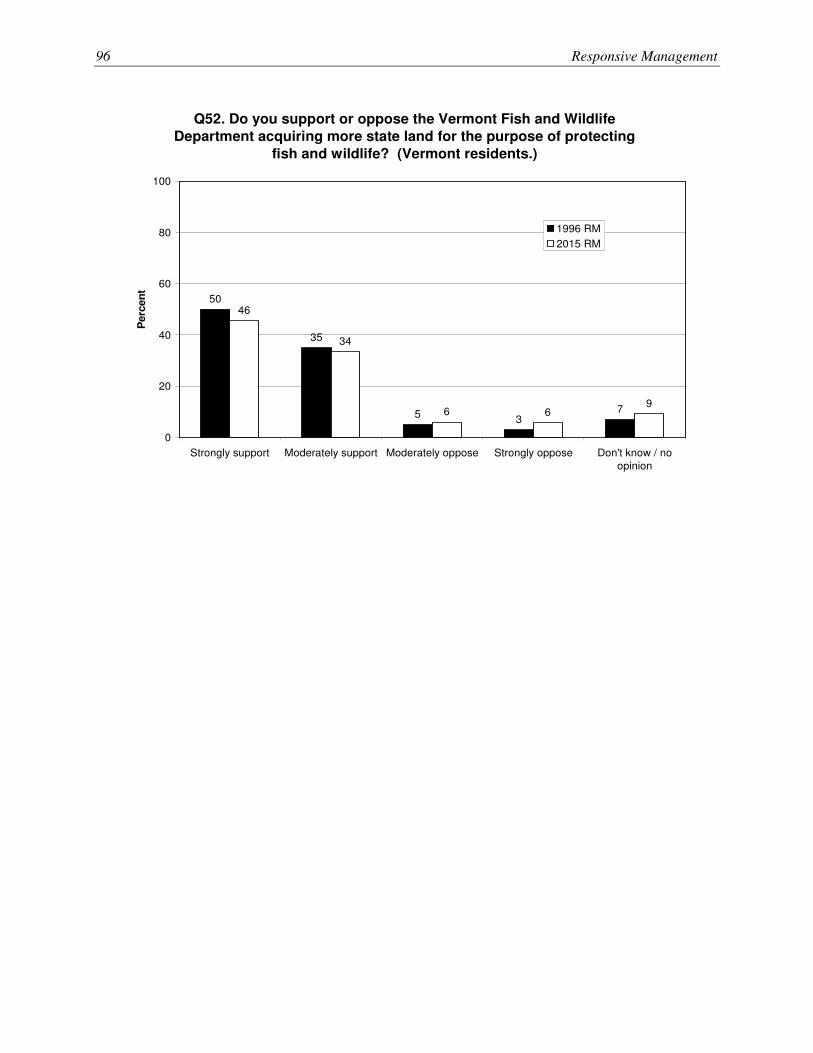
96 Responsive Management
Q52. Do you support or oppose the Vermont Fish and Wildlife
Department acquiring more state land for the purpose of protecting
fish and wildlife? (Vermont residents.)
69
50
35
53
76
34
46
0
20
40
60
80
100
Strongly support Moderately support Moderately oppose Strongly oppose Don't know / no
opinion
Perc
en
t
1996 RM
2015 RM
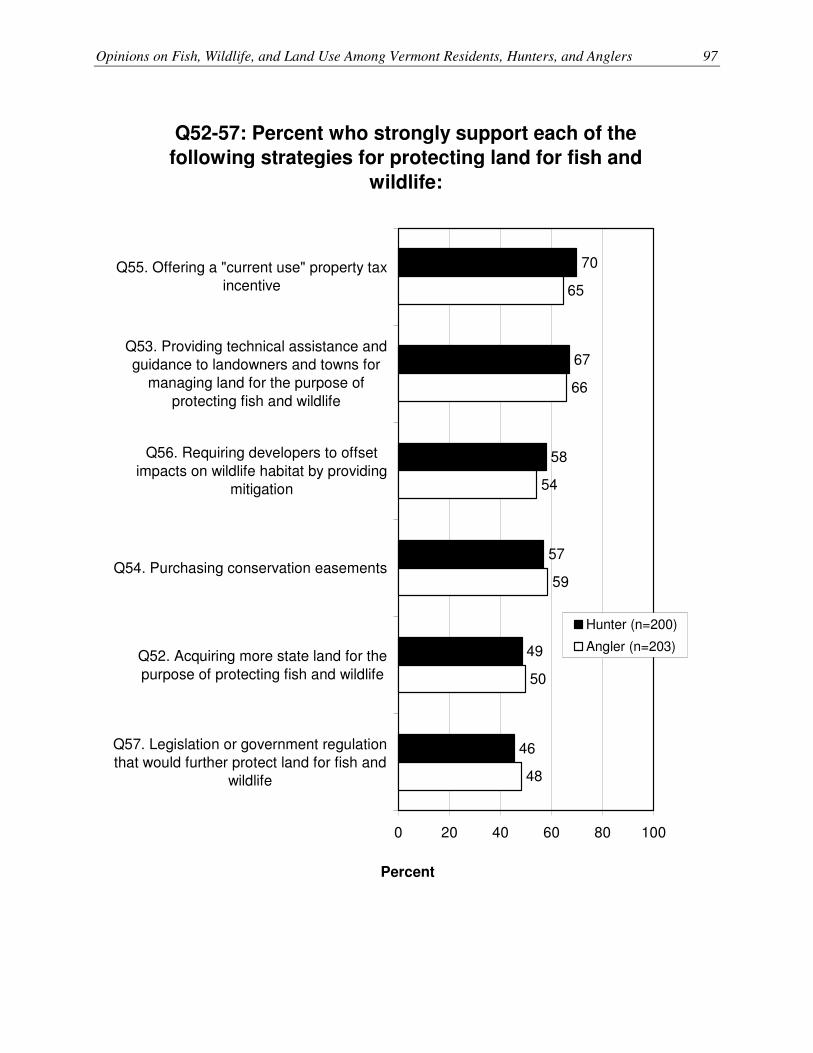
Opinions on Fish, Wildlife, and Land Use Among Vermont Residents, Hunters, and Anglers 97
Q52-57: Percent who strongly support each of the
following strategies for protecting land for fish and
wildlife:
59
50
48
70
67
58
57
49
46
65
66
54
0 20 40 60 80 100
Q55. Offering a "current use" property taxincentive
Q53. Providing technical assistance andguidance to landowners and towns for
managing land for the purpose of
protecting fish and wildlife
Q56. Requiring developers to offset
impacts on wildlife habitat by providingmitigation
Q54. Purchasing conservation easements
Q52. Acquiring more state land for the
purpose of protecting fish and wildlife
Q57. Legislation or government regulationthat would further protect land for fish and
wildlife
Percent
Hunter (n=200)
Angler (n=203)
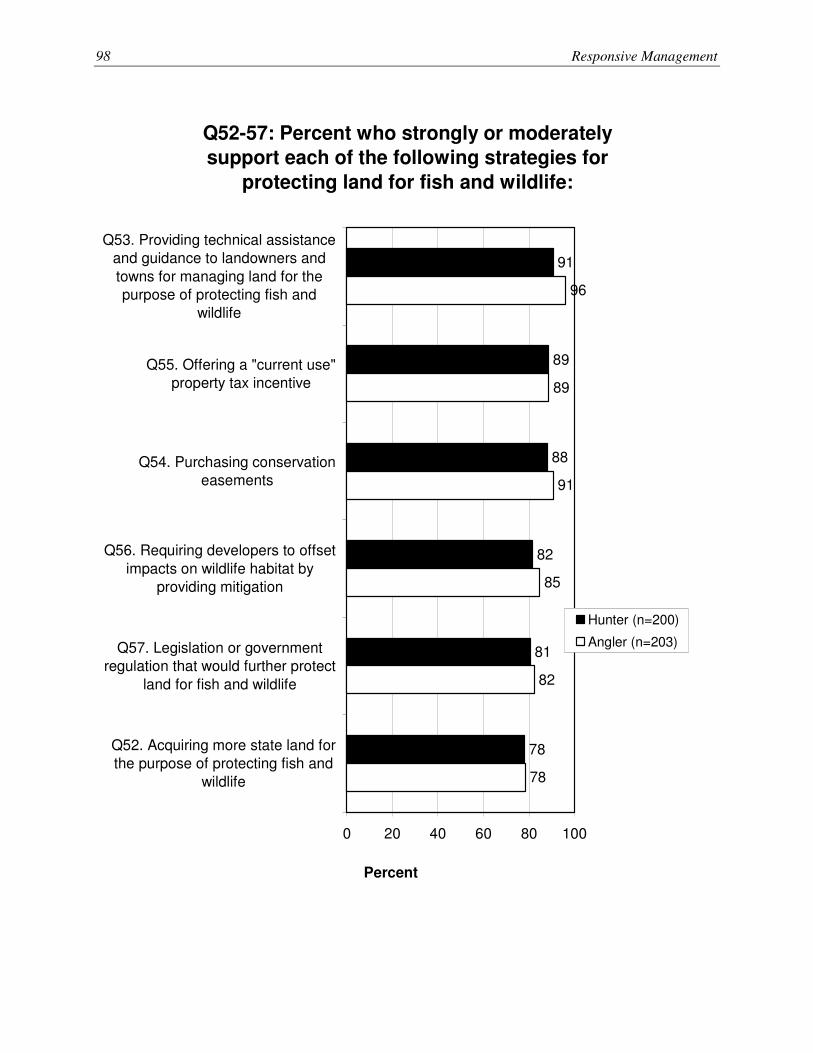
98 Responsive Management
Q52-57: Percent who strongly or moderately
support each of the following strategies for
protecting land for fish and wildlife:
85
82
78
91
89
88
82
81
78
96
89
91
0 20 40 60 80 100
Q53. Providing technical assistanceand guidance to landowners and
towns for managing land for thepurpose of protecting fish and
wildlife
Q55. Offering a "current use"property tax incentive
Q54. Purchasing conservationeasements
Q56. Requiring developers to offset
impacts on wildlife habitat byproviding mitigation
Q57. Legislation or governmentregulation that would further protect
land for fish and wildlife
Q52. Acquiring more state land forthe purpose of protecting fish and
wildlife
Percent
Hunter (n=200)
Angler (n=203)
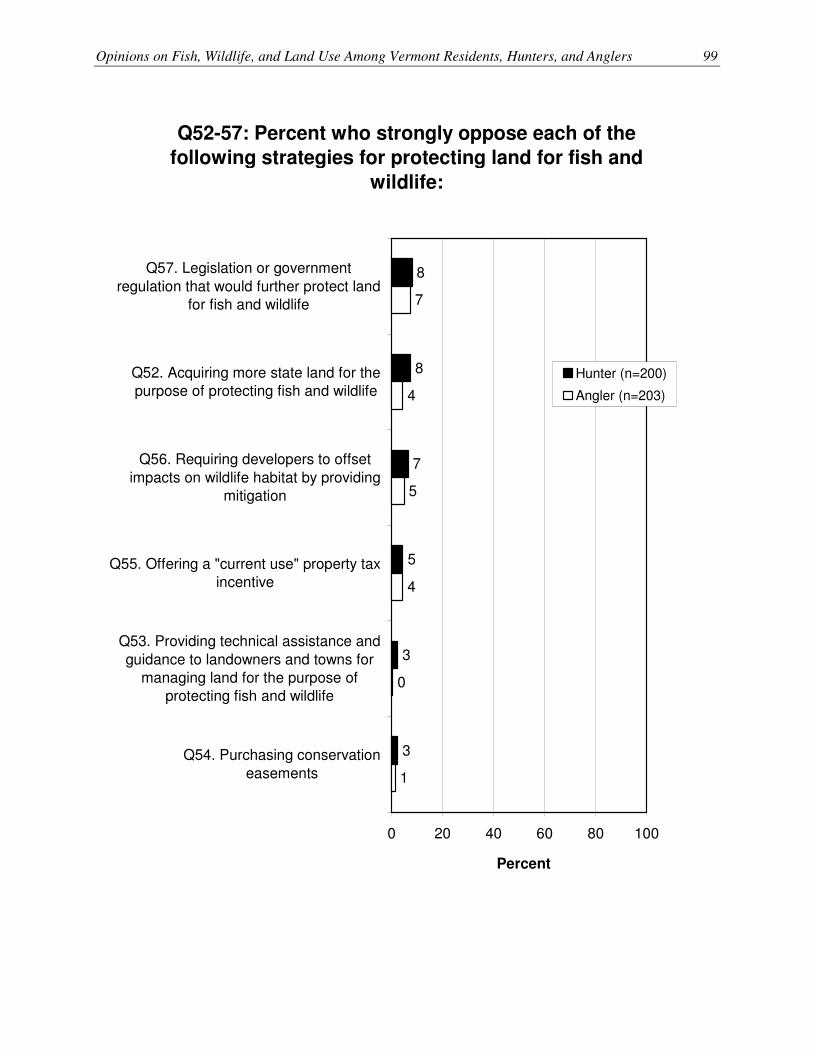
Opinions on Fish, Wildlife, and Land Use Among Vermont Residents, Hunters, and Anglers 99
Q52-57: Percent who strongly oppose each of the
following strategies for protecting land for fish and
wildlife:
4
0
1
8
8
7
5
3
3
7
4
5
0 20 40 60 80 100
Q57. Legislation or government
regulation that would further protect landfor fish and wildlife
Q52. Acquiring more state land for thepurpose of protecting fish and wildlife
Q56. Requiring developers to offset
impacts on wildlife habitat by providingmitigation
Q55. Offering a "current use" property taxincentive
Q53. Providing technical assistance and
guidance to landowners and towns formanaging land for the purpose of
protecting fish and wildlife
Q54. Purchasing conservation
easements
Percent
Hunter (n=200)
Angler (n=203)

100 Responsive Management
Q52-57: Percent who strongly or moderately
oppose each of the following strategies for
protecting land for fish and wildlife:
7
1
3
16
12
10
7
5
5
15
12
10
0 20 40 60 80 100
Q52. Acquiring more state land for thepurpose of protecting fish and wildlife
Q57. Legislation or governmentregulation that would further protect land
for fish and wildlife
Q56. Requiring developers to offsetimpacts on wildlife habitat by providing
mitigation
Q55. Offering a "current use" propertytax incentive
Q53. Providing technical assistance and
guidance to landowners and towns formanaging land for the purpose of
protecting fish and wildlife
Q54. Purchasing conservationeasements
Percent
Hunter (n=200)
Angler (n=203)

Opinions on Fish, Wildlife, and Land Use Among Vermont Residents, Hunters, and Anglers 101
FUNDING OF FISH AND WILDLIFE MANAGEMENT
� The survey listed four items to see where open land falls on the spectrum (the other items
were police/fire services, roads, and schools). Respondents were asked if they would be
willing to pay an extra percentage in taxes for each.
• The top of the list among residents is roads (61% would pay extra in taxes for them) and
police/fire services (56%). These are both slightly above open land (52%) and
schools (51%).
o Similar surveys were conducted in 1990, 1995, and 2000. Respondents’
willingness to pay extra taxes for open land has remained relatively stable over
the years, while it has steadily increased for roads and police/fire services.
• While the percentage of hunters saying that they would pay extra taxes for open land is
about the same as among residents, their ranking of it is higher than the ranking among
residents. Anglers also say open land at about the same rate as do residents, but they rank
open land last in the items for which they would pay more taxes.
� Respondents are split between wanting funding for fish and wildlife conservation programs
to be increased or remain the same (with very few wanting funding to be decreased).
• Among residents, 44% want funding to remain the same (the most common response),
while 38% want it increased; only 2% want it decreased. There is little change since
1995.
o Residents most likely to want funding increased are those who went canoeing or
kayaking in the past 12 months (45% stated this) and those who went camping
(43%).
• Hunters and anglers are even more in the conservationist camp: 48% of hunters and 49%
of anglers want funding to remain the same; meanwhile, 44% of hunters and 41% of
anglers want funding increased (the decreased responses are at 2% and 3%).
� Finally, five funding options were presented in the survey. Respondents were told that the
funding would be used for a land conservation initiative to ensure the future of fish and
wildlife populations, habitat, and public access to lands for recreation. For each,
respondents were asked if they would support or oppose it.

102 Responsive Management
• A majority of residents strongly or moderately support three of the five taxes: a one-
eighth of 1% increase in the state general sales tax, a state tax on sporting equipment, and
a bond (support ranges from 59% to 61%). There is less than a majority who support a
parking fee on state lands or a registration fee for kayaks and canoes.
• Hunters’ and anglers’ opinions mirror those of residents. At the top is the bond, followed
by the one-eighth of 1% sales tax and the tax on sporting equipment. At the bottom are
the registration fee for kayaks/canoes and the parking fee.

Opinions on Fish, Wildlife, and Land Use Among Vermont Residents, Hunters, and Anglers 103
Q63-66: Percent of residents who are willing to pay
an extra percentage in taxes for each of the
following:
61
56
52
51
0 20 40 60 80 100
Q64. Roads
Q65. Police and
fire services
Q66. Open land
Q63. Schools
Percent

104 Responsive Management
Q63-Q66. Percent of residents who are willing to pay an extra
percentage in taxes for each of the following:
46
5251
39 39
53
3942
48 484852
6056
61
51
0
20
40
60
80
100
Schools Roads Police and fire services Open land
Perc
en
t
1990 VT Business Roundtable
1995 VT Business Roundtable
2000 VT Business Rountable
2015 RM

Opinions on Fish, Wildlife, and Land Use Among Vermont Residents, Hunters, and Anglers 105
Q63-66: Percent who are willing to pay an extra
percentage in taxes for each of the following:
51
54
49
48
38
56
50
54
0 20 40 60 80 100
Q65. Police and fire
services
Q66. Open land
Q64. Roads
Q63. Schools
Percent
Hunter (n=200)
Angler (n=203)

106 Responsive Management
Q67. Should funding for fish and wildlife
conservation programs be increased, decreased, or
remain the same?
(Vermont residents.)
38
44
2
16
0 20 40 60 80 100
Increased
Remain the same
Decreased
Don't know
Percent (n=802)

Opinions on Fish, Wildlife, and Land Use Among Vermont Residents, Hunters, and Anglers 107
Q67. Percent of residents who think funding for
fish and wildlife conservation programs should be
increased.
37.3
37.0
36.1
35.0
35.0
34.5
33.7
32.7
32.7
30.3
30.2
29.3
37.5
38.3
38.3
38.4
38.5
38.9
41.8
42.2
42.4
42.4
42.9
44.8
39.7
39.1
39.0
0 20 40 60 80 100
Went canoeing or kayaking
Went camping
Has an income less than $50,000 per year
Visited a state or national park
Below the median age (50)
Went fishing
Indicated they were satisfied with the VT Dept. of
Fish and Wildlife
Went hiking
Has an income of $50,000 or more per year
Male
Lives in a small city or town, or rural area
Does not have a bachelor's degree
Went hunting
Went wildlife viewing or birdwatching
Total
Did not go hunting
Has a bachelor's degree or higher
Female
Did not go hiking
Did not go fishing
Did not go camping
Median age (50) or older
Did not go canoeing or kayaking
Lives in a large city, urban area, or suburban area
Did not indicate they were satisfied with the VT
Dept. of Fish and Wildlife
Did not do any wildlife viewing or birdwatching
Did not visit a state or national park
Percent
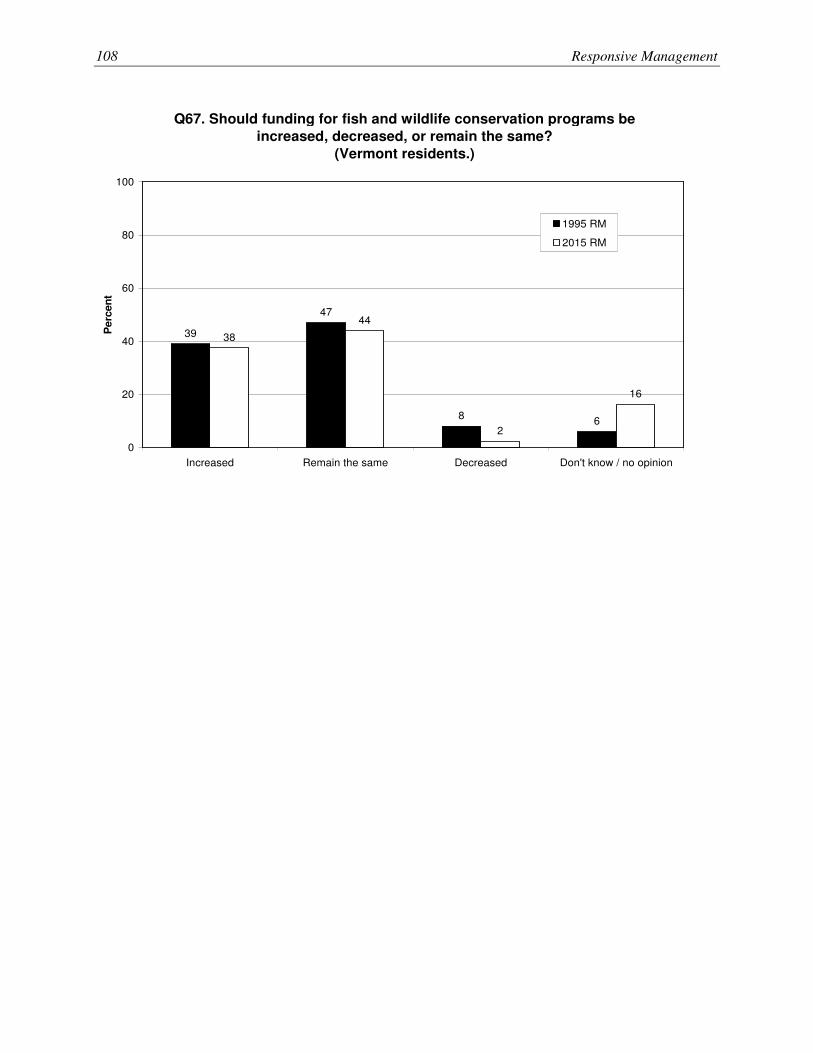
108 Responsive Management
Q67. Should funding for fish and wildlife conservation programs be
increased, decreased, or remain the same?
(Vermont residents.)
16
39
47
86
2
44
38
0
20
40
60
80
100
Increased Remain the same Decreased Don't know / no opinion
Perc
en
t
1995 RM
2015 RM

Opinions on Fish, Wildlife, and Land Use Among Vermont Residents, Hunters, and Anglers 109
Q67. Should funding for fish and wildlife
conservation programs be increased, decreased,
or remain the same?
(Hunters and anglers.)
44
48
2
7
41
49
3
7
0 20 40 60 80 100
Increased
Remain the same
Decreased
Don't know
Percent
Hunter (n=200)
Angler (n=203)

110 Responsive Management
Q70-74: Percent of residents who strongly support
each of the following to provide funding for a land
conservation initiative:
32
28
23
22
17
0 20 40 60 80 100
Q73. A one-eighthof 1% increase inthe state general
sales tax
Q74. A state tax in
Vermont onsporting
equipment
Q72. A bond to
fund landacquisition
Q70. A registrationfee for kayaks and
canoes
Q71. A parking feeon state lands
Percent

Opinions on Fish, Wildlife, and Land Use Among Vermont Residents, Hunters, and Anglers 111
Q70-74: Percent of residents who strongly or
moderately support each of the following to
provide funding for a land conservation initiative:
61
59
59
45
43
0 20 40 60 80 100
Q73. A one-eighth
of 1% increase inthe state general
sales tax
Q74. A state tax inVermont on
sporting equipment
Q72. A bond tofund land
acquisition
Q71. A parking fee
on state lands
Q70. A registration
fee for kayaks andcanoes
Percent
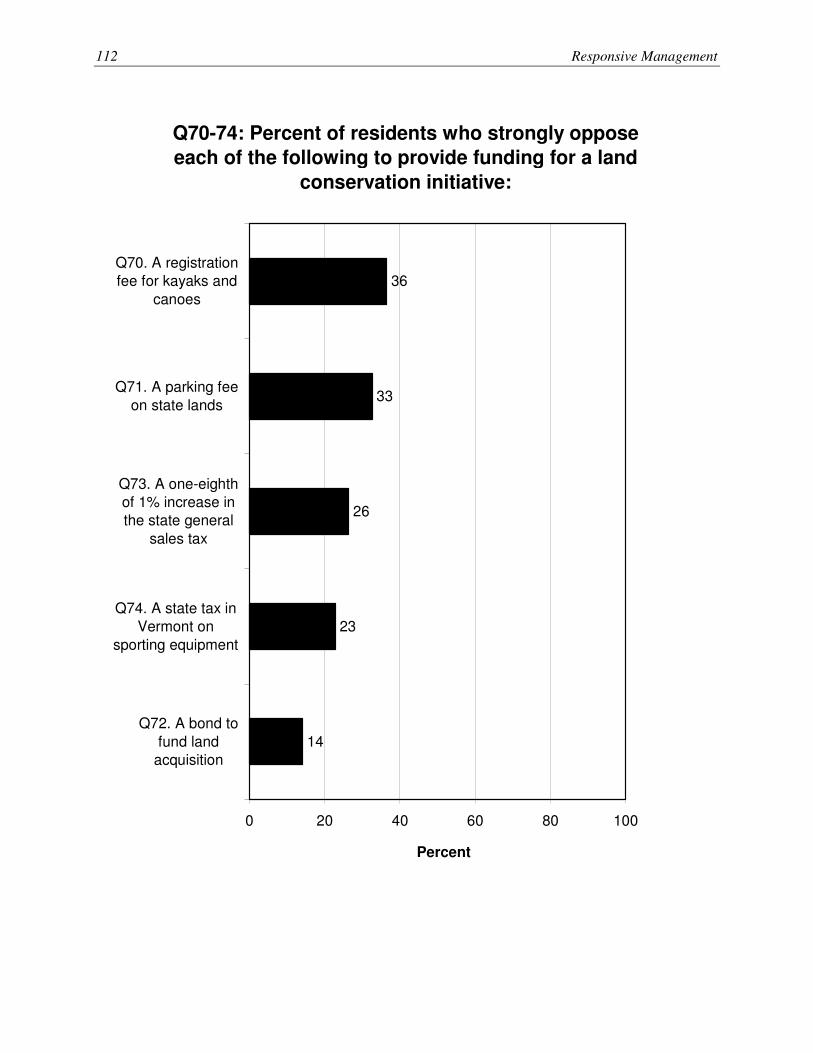
112 Responsive Management
Q70-74: Percent of residents who strongly oppose
each of the following to provide funding for a land
conservation initiative:
36
33
26
23
14
0 20 40 60 80 100
Q70. A registrationfee for kayaks and
canoes
Q71. A parking fee
on state lands
Q73. A one-eighthof 1% increase inthe state general
sales tax
Q74. A state tax inVermont on
sporting equipment
Q72. A bond to
fund landacquisition
Percent

Opinions on Fish, Wildlife, and Land Use Among Vermont Residents, Hunters, and Anglers 113
Q70-74: Percent of residents who strongly or
moderately oppose each of the following to provide
funding for a land conservation initiative:
52
49
35
34
26
0 20 40 60 80 100
Q70. A registration
fee for kayaks andcanoes
Q71. A parking feeon state lands
Q73. A one-eighth
of 1% increase inthe state general
sales tax
Q74. A state tax inVermont on
sporting equipment
Q72. A bond tofund land
acquisition
Percent

114 Responsive Management
Q70-74: Percent who strongly support each of the
following to provide funding for a land
conservation initiative:
27
17
33
31
29
29
18
26
29
22
0 20 40 60 80 100
Q70. A registrationfee for kayaks and
canoes
Q73. A one-eighthof 1% increase inthe state general
sales tax
Q72. A bond tofund land
acquisition
Q74. A state tax inVermont on
sporting equipment
Q71. A parking fee
on state lands
Percent
Hunter (n=200)
Angler (n=203)

Opinions on Fish, Wildlife, and Land Use Among Vermont Residents, Hunters, and Anglers 115
Q70-74: Percent who strongly or moderately
support each of the following to provide funding
for a land conservation initiative:
43
41
60
58
50
48
38
59
59
58
0 20 40 60 80 100
Q72. A bond to
fund landacquisition
Q73. A one-eighth
of 1% increase inthe state general
sales tax
Q74. A state tax in
Vermont onsporting equipment
Q70. A registrationfee for kayaks and
canoes
Q71. A parking feeon state lands
Percent
Hunter (n=200)
Angler (n=203)
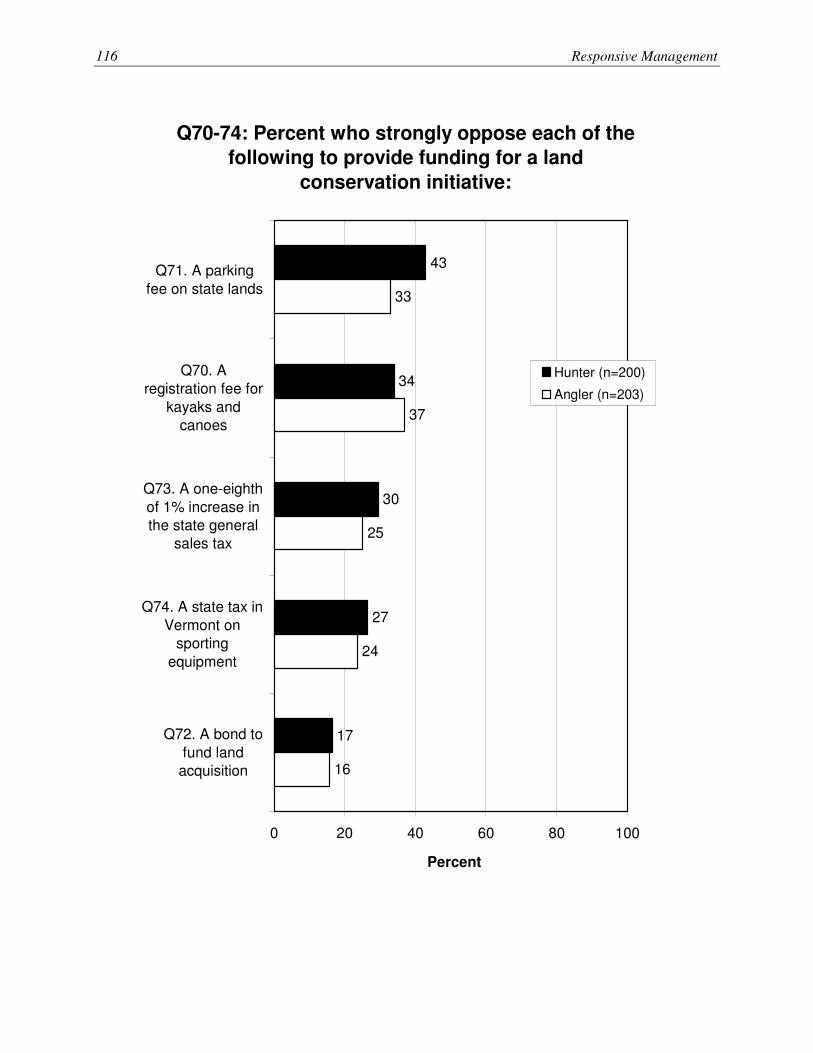
116 Responsive Management
Q70-74: Percent who strongly oppose each of the
following to provide funding for a land
conservation initiative:
24
16
43
34
30
27
17
33
37
25
0 20 40 60 80 100
Q71. A parking
fee on state lands
Q70. Aregistration fee for
kayaks andcanoes
Q73. A one-eighth
of 1% increase inthe state general
sales tax
Q74. A state tax in
Vermont onsporting
equipment
Q72. A bond to
fund landacquisition
Percent
Hunter (n=200)
Angler (n=203)

Opinions on Fish, Wildlife, and Land Use Among Vermont Residents, Hunters, and Anglers 117
Q70-74: Percent who strongly or moderately
oppose each of the following to provide funding for
a land conservation initiative:
34
28
58
47
44
40
27
54
53
38
0 20 40 60 80 100
Q71. A parking
fee on state lands
Q70. Aregistration fee for
kayaks andcanoes
Q74. A state tax inVermont on
sportingequipment
Q73. A one-eighth
of 1% increase inthe state general
sales tax
Q72. A bond tofund land
acquisition
Percent
Hunter (n=200)
Angler (n=203)
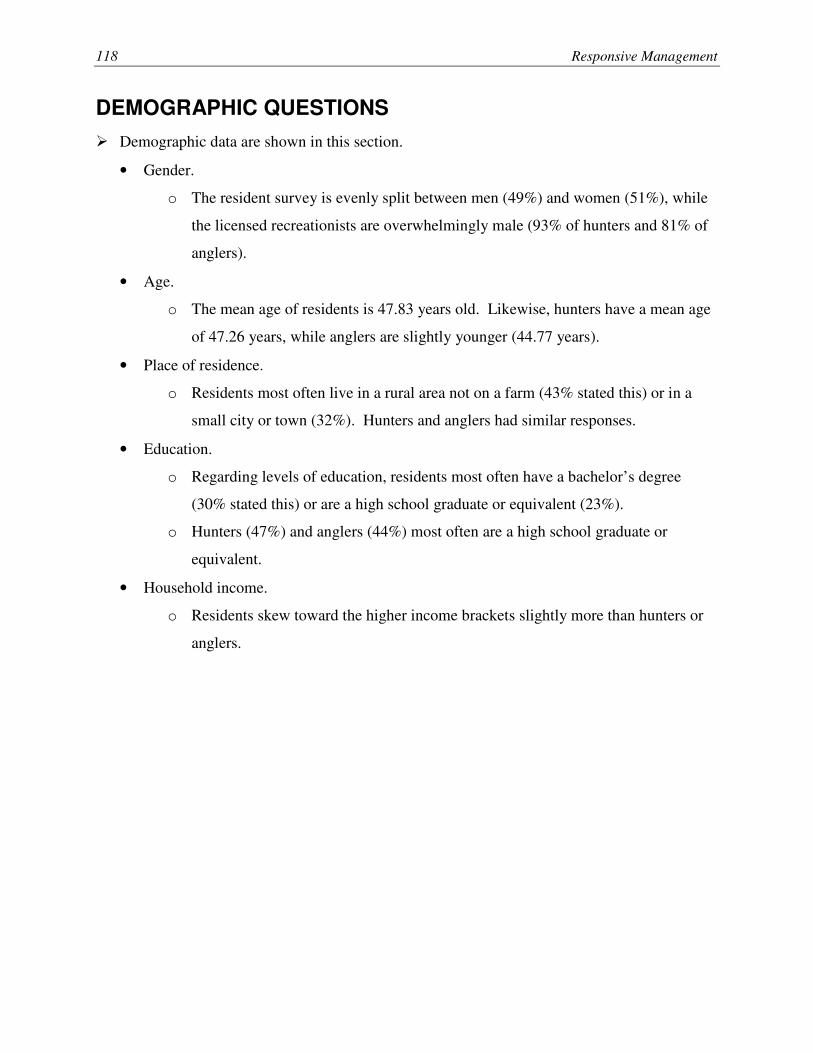
118 Responsive Management
DEMOGRAPHIC QUESTIONS
� Demographic data are shown in this section.
• Gender.
o The resident survey is evenly split between men (49%) and women (51%), while
the licensed recreationists are overwhelmingly male (93% of hunters and 81% of
anglers).
• Age.
o The mean age of residents is 47.83 years old. Likewise, hunters have a mean age
of 47.26 years, while anglers are slightly younger (44.77 years).
• Place of residence.
o Residents most often live in a rural area not on a farm (43% stated this) or in a
small city or town (32%). Hunters and anglers had similar responses.
• Education.
o Regarding levels of education, residents most often have a bachelor’s degree
(30% stated this) or are a high school graduate or equivalent (23%).
o Hunters (47%) and anglers (44%) most often are a high school graduate or
equivalent.
• Household income.
o Residents skew toward the higher income brackets slightly more than hunters or
anglers.

Opinions on Fish, Wildlife, and Land Use Among Vermont Residents, Hunters, and Anglers 119
Q86. Respondent's gender (observed by
interviewer; not asked).
(Vermont residents.)
49
51
0 20 40 60 80 100
Male
Female
Percent (n=802)

120 Responsive Management
Q86. Respondent's gender (observed by
interviewer; not asked).
(Hunters and anglers.)
93
7
81
19
0 20 40 60 80 100
Male
Female
Percent
Hunter (n=200)
Angler (n=203)
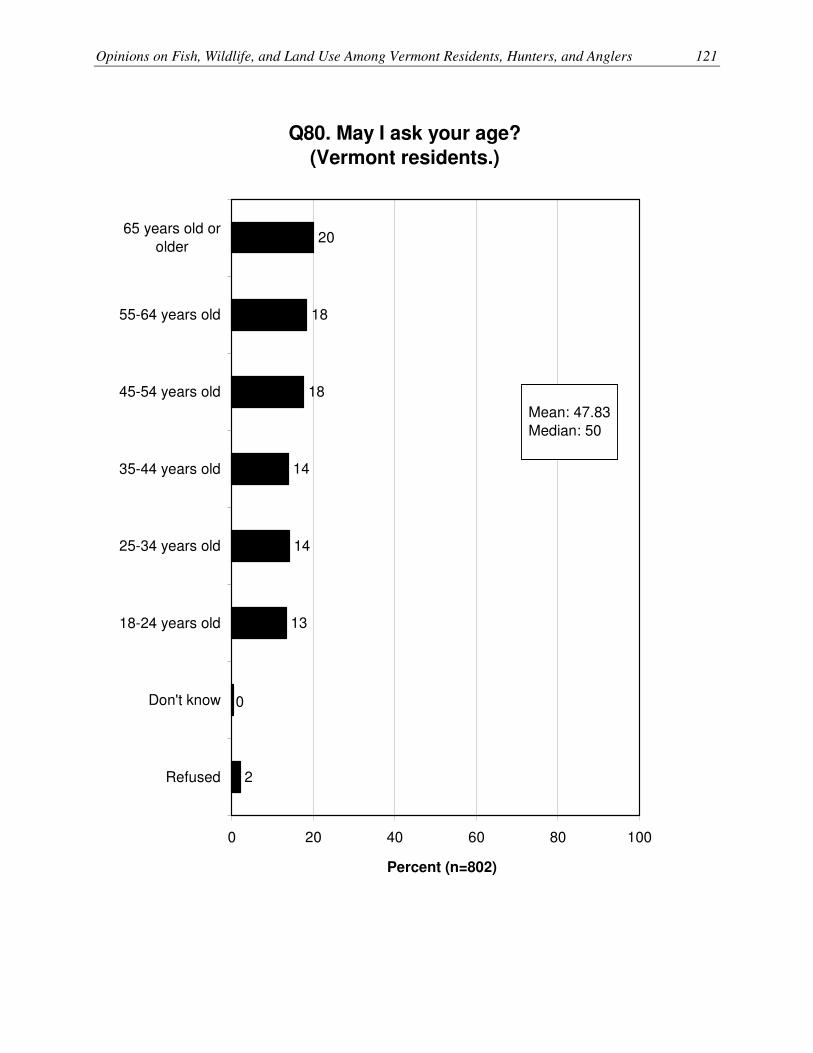
Opinions on Fish, Wildlife, and Land Use Among Vermont Residents, Hunters, and Anglers 121
Q80. May I ask your age?
(Vermont residents.)
20
18
18
14
14
13
0
2
0 20 40 60 80 100
65 years old or
older
55-64 years old
45-54 years old
35-44 years old
25-34 years old
18-24 years old
Don't know
Refused
Percent (n=802)
Mean: 47.83
Median: 50

122 Responsive Management
Q80. May I ask your age?
(Hunters and anglers.)
7
28
23
20
15
6
0
3
5
24
24
17
16
10
1
3
0 20 40 60 80 100
65 years old orolder
55-64 years old
45-54 years old
35-44 years old
25-34 years old
18-24 years old
Don't know
Refused
Percent
Hunter (n=200)
Angler (n=203)
Hunters
Mean: 47.26
Median: 48
Anglers
Mean: 44.77 Median: 47

Opinions on Fish, Wildlife, and Land Use Among Vermont Residents, Hunters, and Anglers 123
Q77. Do you consider your place of residence to be
a large city or urban area, a suburban area, a small
city or town, a rural area on a farm, or a rural area
not on a farm?
(Vermont residents.)
6
7
32
11
43
0
1
0 20 40 60 80 100
Large city or urban
area
Suburban area
Small city or town
Rural area on afarm
Rural area NOT ona farm
Don't know
Refused
Percent (n=802)
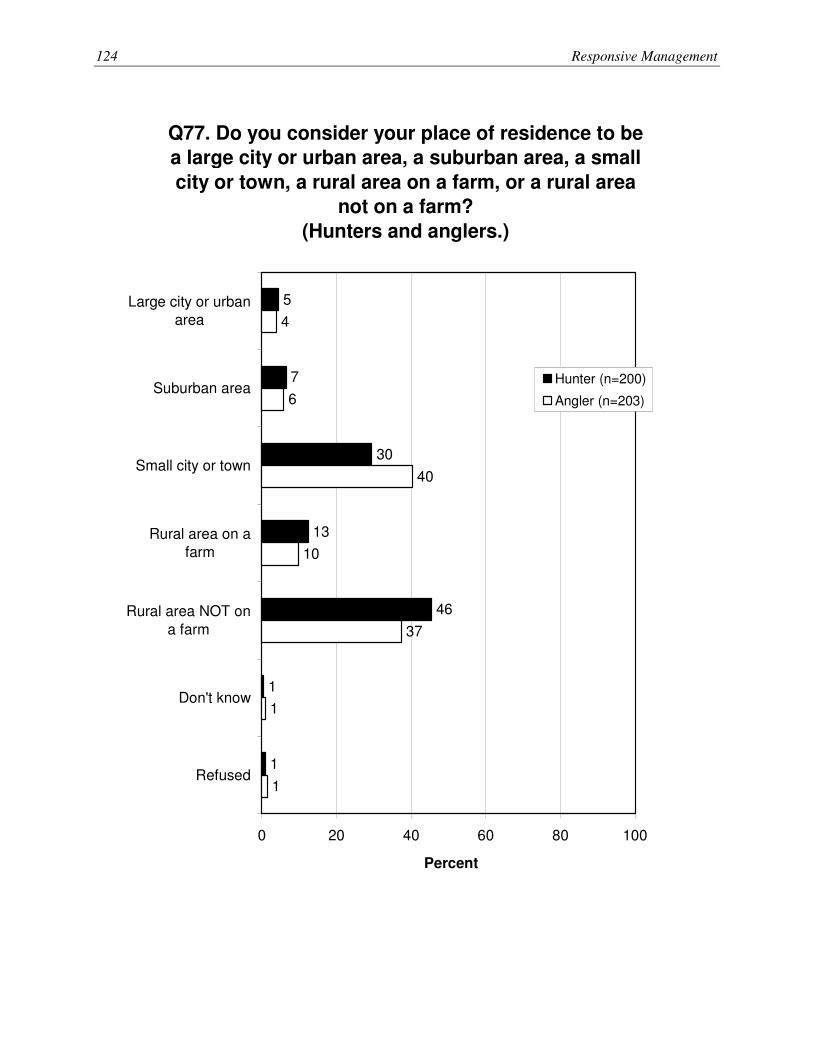
124 Responsive Management
Q77. Do you consider your place of residence to be
a large city or urban area, a suburban area, a small
city or town, a rural area on a farm, or a rural area
not on a farm?
(Hunters and anglers.)
5
7
30
13
46
1
1
4
6
40
10
37
1
1
0 20 40 60 80 100
Large city or urbanarea
Suburban area
Small city or town
Rural area on afarm
Rural area NOT on
a farm
Don't know
Refused
Percent
Hunter (n=200)
Angler (n=203)

Opinions on Fish, Wildlife, and Land Use Among Vermont Residents, Hunters, and Anglers 125
Q78. What is the highest level of education you
have completed?
(Vermont residents.)
3
23
19
9
30
12
3
1
0 20 40 60 80 100
Not a high school
graduate
High schoolgraduate or
equivalent
Some college or
trade school, nodegree
Associate's ortrade school
degree
Bachelor's degree
Master's degree
Professional or
doctorate degree
Refused
Percent (n=802)

126 Responsive Management
Q78. What is the highest level of education you
have completed?
(Hunters and anglers.)
7
47
13
9
18
3
2
0
3
4
44
15
8
16
7
3
1
2
0 20 40 60 80 100
Not a high schoolgraduate
High schoolgraduate orequivalent
Some college or
trade school, nodegree
Associate's or
trade schooldegree
Bachelor's degree
Master's degree
Professional ordoctorate degree
Don't know
Refused
Percent
Hunter (n=200)
Angler (n=203)
Opinions on Fish, Wildlife, and Land Use Among Vermont Residents, Hunters, and Anglers 127
Q79. Which of these categories best describes
your total household income before taxes last
year?
(Vermont residents.)
9
16
22
14
19
5
16
0 20 40 60 80 100
Less than $25,000
$25,000-$49,999
$50,000-$74,999
$75,000-$99,999
$100,000 or more
Don't know
Refused
Percent (n=802)
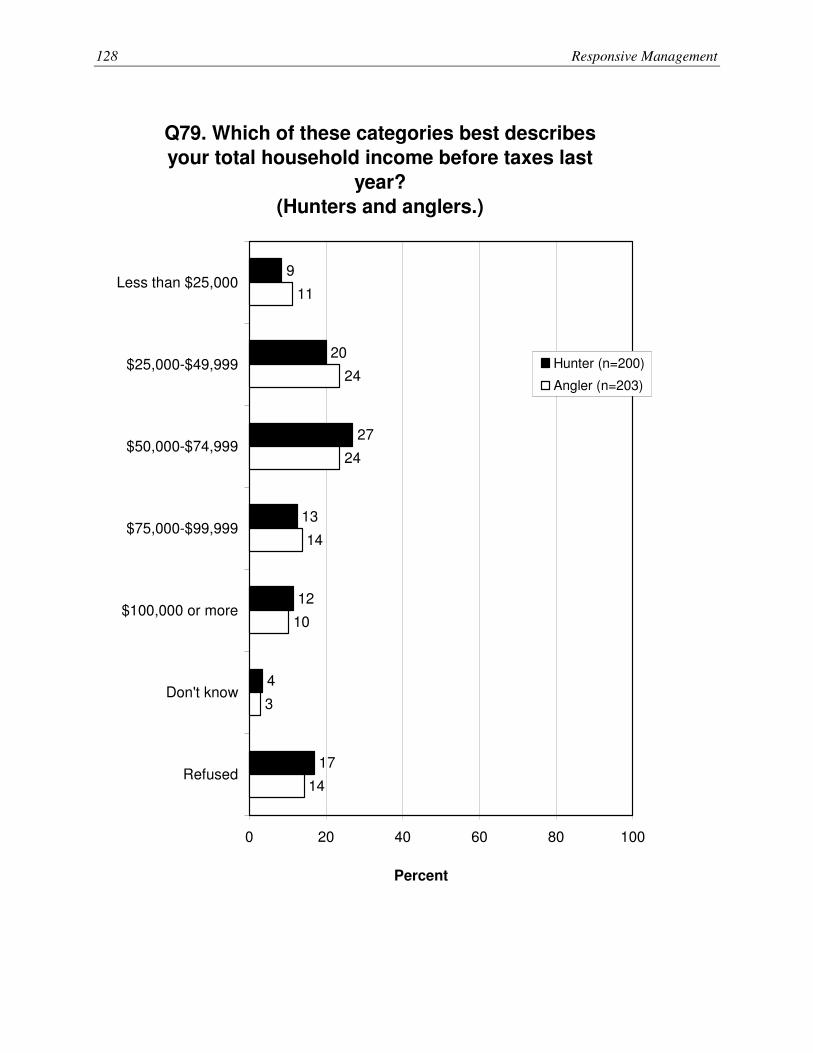
128 Responsive Management
Q79. Which of these categories best describes
your total household income before taxes last
year?
(Hunters and anglers.)
9
20
27
13
12
4
17
11
24
24
14
10
3
14
0 20 40 60 80 100
Less than $25,000
$25,000-$49,999
$50,000-$74,999
$75,000-$99,999
$100,000 or more
Don't know
Refused
Percent
Hunter (n=200)
Angler (n=203)

Opinions on Fish, Wildlife, and Land Use Among Vermont Residents, Hunters, and Anglers 129
ABOUT RESPONSIVE MANAGEMENT
Responsive Management is an internationally recognized public opinion and attitude survey research
firm specializing in natural resource and outdoor recreation issues. Our mission is to help natural
resource and outdoor recreation agencies and organizations better understand and work with their
constituents, customers, and the public.
Utilizing our in-house, full-service telephone, mail, and web-based survey facilities with 50
professional interviewers, we have conducted more than 1,000 telephone surveys, mail surveys,
personal interviews, and focus groups, as well as numerous marketing and communication plans,
needs assessments, and program evaluations.
Clients include the federal natural resource and land management agencies, most state fish and
wildlife agencies, state departments of natural resources, environmental protection agencies, state
park agencies, tourism boards, most of the major conservation and sportsmen’s organizations, and
numerous private businesses. Responsive Management also collects attitude and opinion data for
many of the nation’s top universities.
Specializing in research on public attitudes toward natural resource and outdoor recreation issues,
Responsive Management has completed a wide range of projects during the past 25 years, including
dozens of studies of hunters, anglers, wildlife viewers, boaters, park visitors, historic site visitors,
hikers, birdwatchers, campers, and rock climbers. Responsive Management has conducted studies
on endangered species; waterfowl and wetlands; and the reintroduction of large predators such as
wolves, grizzly bears, and the Florida panther.
Responsive Management has assisted with research on numerous natural resource ballot initiatives
and referenda and has helped agencies and organizations find alternative funding and increase their
membership and donations. Additionally, Responsive Management has conducted major
organizational and programmatic needs assessments to assist natural resource agencies and
organizations in developing more effective programs based on a solid foundation of fact.
130 Responsive Management
Responsive Management has conducted research on public attitudes toward natural resources and
outdoor recreation in almost every state in the United States, as well as in Canada, Australia, the
United Kingdom, France, Germany, and Japan. Responsive Management has also conducted focus
groups and personal interviews with residents of the African countries of Algeria, Cameroon,
Mauritius, Namibia, South Africa, Tanzania, Zambia, and Zimbabwe.
Responsive Management routinely conducts surveys in Spanish and has conducted surveys in
Chinese, Korean, Japanese and Vietnamese and has completed numerous studies with specific target
audiences, including Hispanics; African-Americans; Asians; women; children; senior citizens; urban,
suburban, and rural residents; large landowners; and farmers.
Responsive Management’s research has been upheld in U.S. District Courts; used in peer-reviewed
journals; and presented at major natural resource, fish and wildlife, and outdoor recreation
conferences across the world. Company research has been featured in most of the nation’s major
media, including CNN, The New York Times, The Wall Street Journal, and on the front pages of USA
Today and The Washington Post. Responsive Management’s research has also been highlighted in
Newsweek magazine.
Visit the Responsive Management website at:
www.responsivemanagement.com