opioid-related harms in canadaopioid-related harms in canada 4 acknowledgements the canadian...
TRANSCRIPT


Production of this document is made possible by financial contributions from Health Canada and provincial and territorial governments. The views expressed herein do not necessarily represent the views of Health Canada or any provincial or territorial government.
Unless otherwise indicated, this product uses data provided by Canada’s provinces and territories.
All rights reserved.
The contents of this publication may be reproduced unaltered, in whole or in part and by any means, solely for non-commercial purposes, provided that the Canadian Institute for Health Information is properly and fully acknowledged as the copyright owner. Any reproduction or use of this publication or its contents for any commercial purpose requires the prior written authorization of the Canadian Institute for Health Information. Reproduction or use that suggests endorsement by, or affiliation with, the Canadian Institute for Health Information is prohibited.
For permission or information, please contact CIHI:
Canadian Institute for Health Information495 Richmond Road, Suite 600Ottawa, Ontario K2A 4H6
Phone: 613-241-7860Fax: [email protected]
ISBN 978-1-77109-637-9 (PDF)
© 2017 Canadian Institute for Health Information
How to cite this document:Canadian Institute for Health Information. Opioid-Related Harms in Canada. Ottawa, ON: CIHI; 2017.
Cette publication est aussi disponible en français sous le titre Préjudices liés aux opioïdes au Canada.ISBN 978-1-77109-638-6 (PDF)

Table of contentsAcknowledgements . . . . . . . . . . . . . . . . . . . . . . . . . . . . . . . . . . . . . . . . . . . . . . . . . . . . . . . . . . . . . . . . . 4
About this chartbook . . . . . . . . . . . . . . . . . . . . . . . . . . . . . . . . . . . . . . . . . . . . . . . . . . . . . . . . . . . . . . . . 5
Key findings: Hospitalizations . . . . . . . . . . . . . . . . . . . . . . . . . . . . . . . . . . . . . . . . . . . . . . . . . . . . . . . . . 6
Key findings: ED visits . . . . . . . . . . . . . . . . . . . . . . . . . . . . . . . . . . . . . . . . . . . . . . . . . . . . . . . . . . . . . . . 7
Hospitalizations due to opioid poisoning . . . . . . . . . . . . . . . . . . . . . . . . . . . . . . . . . . . . . . . . . . . . . . . . . 8
ED visits due to opioid poisoning . . . . . . . . . . . . . . . . . . . . . . . . . . . . . . . . . . . . . . . . . . . . . . . . . . . . . . 16
Alberta . . . . . . . . . . . . . . . . . . . . . . . . . . . . . . . . . . . . . . . . . . . . . . . . . . . . . . . . . . . . . . . . . . . . . . . 19
Ontario . . . . . . . . . . . . . . . . . . . . . . . . . . . . . . . . . . . . . . . . . . . . . . . . . . . . . . . . . . . . . . . . . . . . . . . 23
Methodology . . . . . . . . . . . . . . . . . . . . . . . . . . . . . . . . . . . . . . . . . . . . . . . . . . . . . . . . . . . . . . . . . . . . . 27
Data sources . . . . . . . . . . . . . . . . . . . . . . . . . . . . . . . . . . . . . . . . . . . . . . . . . . . . . . . . . . . . . . . . . . 27
Hospitalizations . . . . . . . . . . . . . . . . . . . . . . . . . . . . . . . . . . . . . . . . . . . . . . . . . . . . . . . . . . . . . . . . 29
ED visits . . . . . . . . . . . . . . . . . . . . . . . . . . . . . . . . . . . . . . . . . . . . . . . . . . . . . . . . . . . . . . . . . . . . . . 30
Limitations . . . . . . . . . . . . . . . . . . . . . . . . . . . . . . . . . . . . . . . . . . . . . . . . . . . . . . . . . . . . . . . . . . . . 30
Other methodology notes . . . . . . . . . . . . . . . . . . . . . . . . . . . . . . . . . . . . . . . . . . . . . . . . . . . . . . . . . 30
Appendix: Data tables for figures . . . . . . . . . . . . . . . . . . . . . . . . . . . . . . . . . . . . . . . . . . . . . . . . . . . . . . 31

Opioid-Related Harms in Canada
4
AcknowledgementsThe Canadian Institute for Health Information (CIHI) would like to acknowledge the input and advice of the Canadian Centre on Substance Use and Addiction and of the Public Health Agency of Canada.
Please note that the analyses and conclusions in this chartbook do not necessarily reflect the views of the organizations mentioned above.

5
Opioid-Related Harms in Canada
About this chartbook The rise in opioid-related harms is an issue of increasing public health importance in Canada. Measures that provide a better understanding of the harms associated with opioid use are a high priority.
This chartbook provides an overview of opioid-related harms in Canada, including available data on hospitalizations and emergency department (ED) visits due to opioid poisoning.
The hospitalization analysis includes 2007–2008 to 2016–2017 data from all provinces and territories (except Quebec and Nunavut, where the most recent data available at the time of release was 2015–2016).
The ED analysis is based on available, comparable data. At the time of release, this includes 2012–2013 to 2016–2017 data from Ontario and Alberta. Although ED data was available for Yukon, it was excluded due to small volumes.
Supplementary data tables accompany this chartbook and are available online. The data tables provide more detailed breakdowns and trending information for opioid poisoning hospitalizations and ED visits.
CIHI intends to publish updated analyses as more data becomes available, including ED data for more jurisdictions.

Opioid-Related Harms in Canada
6
Key findings: Hospitalizations
• Opioid poisonings result in an average of 16 hospitalizations a day in Canada.
• Between 2007–2008 and 2016–2017, the rate of hospitalizations due to opioid poisoning increased 53%. Nearly half of the increase occurred over the last 3 years.
• Over the last 10 years, older adults age 45 to 64 and seniors age 65+ had the highest rates of hospitalizations. Hospitalizations increased across all age groups, although youth age 15 to 24 and younger adults age 25 to 44 had the fastest-growing rates.
• Opioid poisoning hospitalization rates varied across the provinces and territories in 2016–2017, with Northern and Western Canada having higher rates than Eastern Canada.
• In 2016–2017, more than half of hospitalizations for opioid poisonings were considered accidental and almost one-third were a result of purposely self-inflicted harm.

7
Opioid-Related Harms in Canada
Key findings: ED visits
• Opioid poisonings result in an average of 13 ED visits in Ontario and 11 ED visits in Alberta every day.
• Between 2012–2013 and 2016–2017, rates of ED visits more than doubled in Alberta and increased by almost 50% in Ontario. The majority of the increase occurred over the past 3 years.
• In Alberta, over the past 5 years, the number of ED visits increased almost 10-fold for heroin poisonings and more than 10-fold for synthetic opioid poisonings (including those related to fentanyl). In Ontario, ED visits increased almost four-fold for heroin poisonings and more than doubled for synthetic opioid poisonings. The majority of the increase in each province occurred over the past 3 years.
• In Alberta, youth age 15 to 24 had the highest and fastest-growing rates of ED visits, tripling over the past 5 years. In Ontario, younger adults age 25 to 44 had the highest and fastest-growing rates of ED visits, increasing by 85%. The majority of the increase in both provinces occurred over the past 3 years.

Opioid-Related Harms in Canada
8
Hospitalizations due to opioid poisoning
In 2016–2017, there were an average of 16 hospitalizations each day for opioid poisoning in Canada.

9
Opioid-Related Harms in Canada
Figure 1: Opioid poisoning hospitalizations in Canada, 2007–2008 to 2016–2017
0
2
4
6
8
10
12
14
16
18
0
1,000
2,000
3,000
4,000
5,000
6,000
Numb
er of
hosp
italiz
ation
s
Crude rate per 100,000 population
2007–2
008
2008–2
009
2009–2
010
2010–2
011
2011–2
012
2012–2
013
2013–2
014
2014–2
015
2015–2
016
2016–2
017*
Number of hospitalizations Crude rate per 100,000 population
Note* Quebec and Nunavut data is from 2015–2016 (the most recent year of data available).SourceHospital Morbidity Database, Canadian Institute for Health Information.
Over the past 10 years, the rate of hospitalizations increased 53% to 15.6 per 100,000 population. Nearly half of the increase occurred over the last 3 years.
By comparison, the hospitalization rate for driver injuries in motor vehicle collisions is 25 per 100,000.i
i. Canadian Institute for Health Information. Injury and Trauma Emergency Department and Hospitalization Statistics, 2015–2016. 2016.

Opioid-Related Harms in Canada
10
Figure 2: Opioid poisoning hospitalization rates by province/territory, 2016–2017
B.C.Alta.
Ont.Que.*
N.L.
N.B.
P.E.I.
N.S.
Man.
Sask.
Terr.†
17.8
34.5
25.023.1
21.7
10.8
13.89.41.6
1.8
1.1
0.2
3.6
1.4
1.3
0.5
3.3
Age-adjusted rate per 100,000 population, 2016–2017
Absolute rate difference, 2015–2016 to 2016–2017
Canada
15.5
11.0
16.6
11.3
Notes* Quebec data is from 2015–2016 (the most recent year of data available); therefore, there is no absolute rate difference shown.† Yukon, Northwest Territories and Nunavut data is grouped due to low volumes. This data should be interpreted with caution.
Nunavut data is from 2015–2016 (the most recent year of data available); therefore, there is no absolute rate difference shown.SourceHospital Morbidity Database, Canadian Institute for Health Information.
Overall, in 2016–2017, Northern and Western Canada had higher rates of hospitalizations than Eastern Canada.

11
Opioid-Related Harms in Canada
Figure 3: Opioid poisoning hospitalization rates by selected census metropolitan areas,* 2016–2017
Vancouver
Edmonton
Regina
Saskatoon
Winnipeg Thunder Bay
Greater Sudbury / Grand Sudbury Hamilton
Toronto
Ottawa
GatineauMontréal
Québec
Saint John
Halifax
Moncton
St. John’s
CalgaryVictoria
Age-adjusted rate per 100,000 population, 2016–2017
5.5–10.010.1–15.015.1–20.020.1–25.0
25.1–28.2
Notes* To be considered a census metropolitan area, the area must have a total population of at least 100,000 of which 50,000 or more
live in the urban core.Quebec data is from 2015–2016 (the most recent year of data available).SourceHospital Morbidity Database, Canadian Institute for Health Information.
Rates of opioid poisoning hospitalizations vary by census metropolitan area (CMA).
Opioid-Related Harms in Canada
12
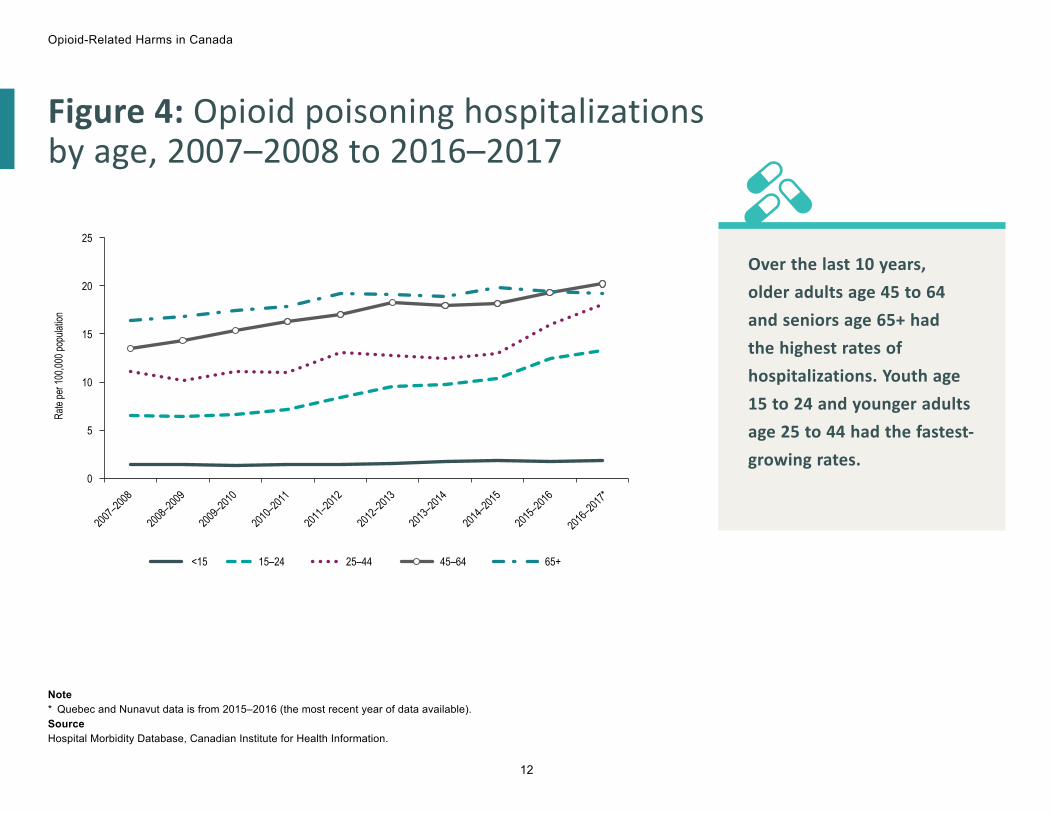
Figure 4: Opioid poisoning hospitalizations by age, 2007–2008 to 2016–2017
2007–2
008
2008–2
009
2009–2
010
2010–2
011
2011–2
012
2012–2
013
2013–2
014
2014–2
015
2015–2
016
2016–2
017*
0
5
10
Rate
per 1
00,00
0 pop
ulatio
n
15
20
25
<15 15–24 25–44 45–64 65+
Note* Quebec and Nunavut data is from 2015–2016 (the most recent year of data available).SourceHospital Morbidity Database, Canadian Institute for Health Information.
Over the last 10 years, older adults age 45 to 64 and seniors age 65+ had the highest rates of hospitalizations. Youth age 15 to 24 and younger adults age 25 to 44 had the fastest-growing rates.

13
Opioid-Related Harms in Canada
Figure 5: Reasons for opioid poisoning hospitalizations, 2007–2008 to 2016–2017
2007–2
008
2008–2
009
2009–2
010
2010–2
011
2011–2
012
2012–2
013
2013–2
014
2014–2
015
2015–2
016
2016–2
017*
0%
10%
20%
30%
40%
50%
60%
Prop
ortio
n of
hos
pitali
zatio
ns
Accidental Intentional Unknown
Note* Quebec and Nunavut data is from 2015–2016 (the most recent year of data available).SourceHospital Morbidity Database, Canadian Institute for Health Information.
In 2016–2017, more than half of opioid poisonings were accidental, 31% were intentional and 17% were of unknown reason.

Opioid-Related Harms in Canada
14
Figure 6: Reasons for opioid poisoning hospitalizations by age, 2016–2017*
0%
10%
20%
30%
40%
50%
60%
70%
Prop
ortio
n of h
ospit
aliza
tions
<15 15–24 25–44 45–64 65+
Age group
Accidental Intentional Unknown
Note* Quebec and Nunavut data is from 2015–2016 (the most recent year of data available).SourceHospital Morbidity Database, Canadian Institute for Health Information.
In 2016–2017, the majority (63%) of opioid poisonings among seniors age 65+ were accidental, while intentional poisonings were most prevalent for youth age 15 to 24, accounting for 44% of hospitalizations.

15
Opioid-Related Harms in Canada
Figure 7: Opioid poisoning hospitalizations by sex, 2007–2008 to 2016–2017
2007–2
008
2008–2
009
2009–2
010
2010–2
011
2011–2
012
2012–2
013
2013–2
014
2014–2
015
2015–2
016
2016–2
017*
0
2
4
6
8
10
12
14
16
18
Rate
per 1
00,00
0 pop
ulatio
n
Female Male
Note* Quebec and Nunavut data is from 2015–2016 (the most recent year of data available).SourceHospital Morbidity Database, Canadian Institute for Health Information.
2016–2017 was the first year in which the rate of hospitalizations was higher among males than among females. Over the past 3 years, the rate increased 24% among males and 10% among females.

Opioid-Related Harms in Canada
16
ED visits due to opioid poisoning
In 2016–2017, there were an average of 11 ED visits in Alberta and 13 ED visits in Ontario each day due to opioid poisoning.
The analysis of ED visits using National Ambulatory Care Reporting System (NACRS) data was limited to Ontario and Alberta. Although CIHI collects data in NACRS from other jurisdictions, these submissions do not yet include the level of detail or coverage required for this analysis.

17
Opioid-Related Harms in Canada
Figure 8: Opioid poisoning ED visits, Ontario and Alberta, 2012–2013 to 2016–2017
Ontario Alberta
0
10
20
30
40
50
60
70
80
90
100
Age-
adjus
ted ra
te pe
r 100
,000 p
opula
tion
2012–2013 2013–2014 2014–2015 2015–2016 2016–2017
NoteED visit analysis is limited to Ontario and Alberta, as other jurisdictions do not submit the level of detail and coverage required for this analysis.SourceNational Ambulatory Care Reporting System, Canadian Institute for Health Information.
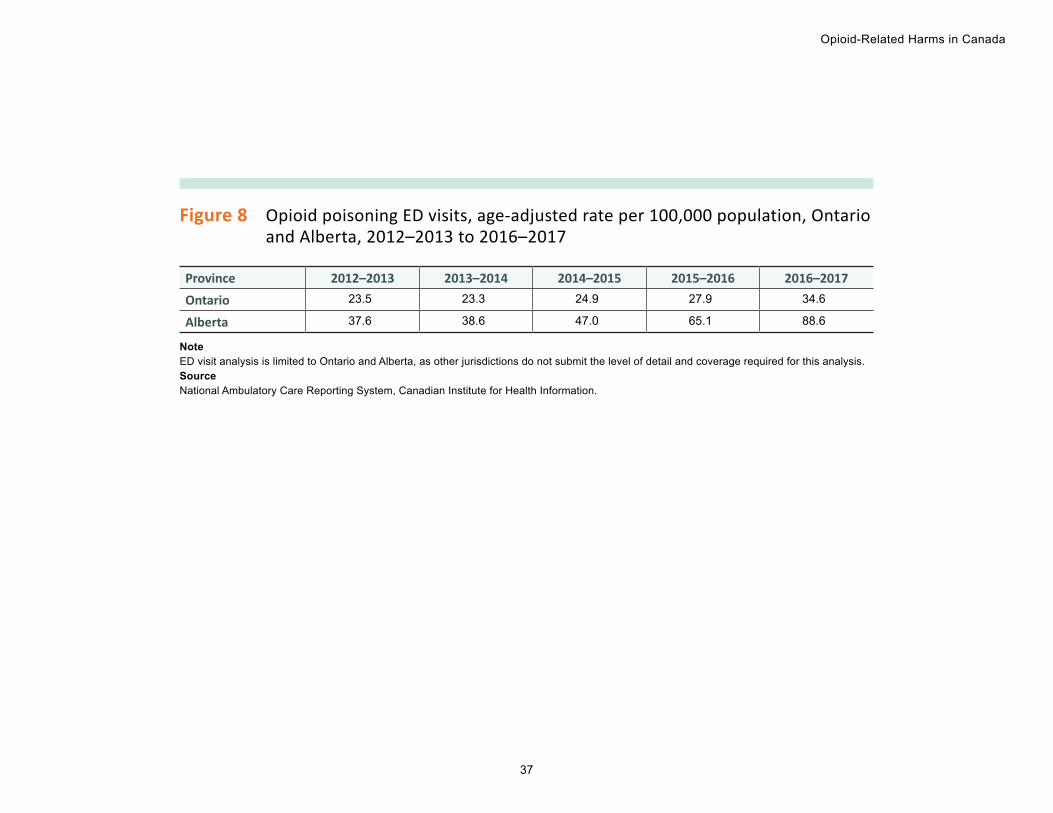
Over the past 5 years, rates of ED visits more than doubled in Alberta and increased by almost 50% in Ontario. The majority of the increase occurred over the past 3 years.

Opioid-Related Harms in Canada
18
Figure 9: Opioid poisoning ED visits by census metropolitan areas,* Ontario and Alberta, 2016–2017
0
20
40
60
80
100
120
Age-
adjus
ted ra
te pe
r 100
,000 p
opula
tion
Ontario
Census metropolitan area
Barrie
Brantfor
d
Greater
Sudbury
/ Gran
d Sudb
uryGuel
ph
Hamilto
n
Kingsto
n
Kitchene
r–Cam
bridge–
Waterloo
London
Oshawa
Ottawa
Peterbo
rough
St. Cath
arines–
Niagara
Thunder
BayToro
nto
Windsor
Calgary
Edmont
on
Alberta
Notes* To be considered a census metropolitan area, the area must have a total population of at least 100,000 of which 50,000 or
more live in the urban core.ED visit analysis is limited to Ontario and Alberta, as other jurisdictions do not submit the level of detail and coverage required for this analysis.SourceNational Ambulatory Care Reporting System, Canadian Institute for Health Information.
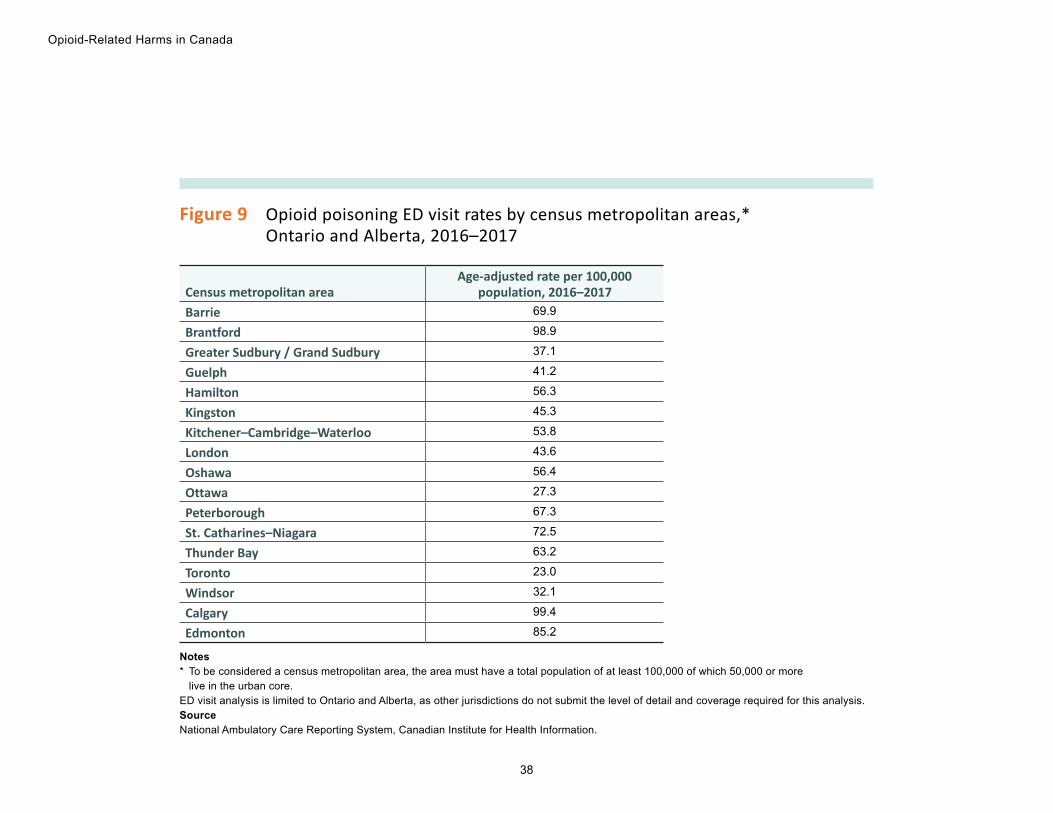
Rates of opioid poisoning ED visits varied by CMA in 2016–2017.

19
Opioid-Related Harms in Canada
Alberta• ED visits due to heroin and synthetic
opioid poisonings • Opioid poisoning ED visits by age• Opioid poisoning ED visits by sex

Opioid-Related Harms in Canada
20
Figure 10: ED visits due to heroin and synthetic opioid poisonings, Alberta, 2012–2013 to 2016–2017
2012–2013 2013–2014 2014–2015 2015–2016 2016–20170
100
200
300
400
500
600
700
800
900
1,000
Numb
er of
ED
visits
Heroin Synthetic
NoteED visit analysis is limited to Ontario and Alberta, as other jurisdictions do not submit the level of detail and coverage required for this analysis.SourceNational Ambulatory Care Reporting System, Canadian Institute for Health Information.
In Alberta, over the past 5 years, the number of ED visits increased almost 10-fold for heroin poisonings and more than 10-fold for synthetic opioid poisonings (including those related to fentanyl). The majority of the increase occurred over the past 3 years.

21
Opioid-Related Harms in Canada
Figure 11: Opioid poisoning ED visits by age, Alberta, 2012–2013 to 2016–2017
2012–2013 2013–2014 2014–2015 2015–2016 2016–20170
20
40
60
80
100
120
140
160
180
Rate
per 1
00,00
0 pop
ulatio
n
<15 15–24 25–44 45–64 65+
NoteED visit analysis is limited to Ontario and Alberta, as other jurisdictions do not submit the level of detail and coverage required for this analysis.SourceNational Ambulatory Care Reporting System, Canadian Institute for Health Information.
In Alberta, youth age 15 to 24 and younger adults age 25 to 44 had the highest and fastest-growing rates of ED visits, tripling over the past 5 years. The majority of the increase occurred over the past 3 years.

Opioid-Related Harms in Canada
22
Figure 12: Opioid poisoning ED visits by sex, Alberta, 2012–2013 to 2016–2017
2012–2013 2013–2014 2014–2015 2015–2016 2016–20170
20
40
Rate
per 1
00,00
0 pop
ulatio
n
60
80
100
120
Female Male
NoteED visit analysis is limited to Ontario and Alberta, as other jurisdictions do not submit the level of detail and coverage required for this analysis.SourceNational Ambulatory Care Reporting System, Canadian Institute for Health Information.
In Alberta, over the past 5 years, rates of ED visits more than tripled among males and increased by almost 80% among females. The majority of the increase occurred over the past 3 years.

23
Opioid-Related Harms in Canada
Ontario• ED visits due to heroin and synthetic
opioid poisonings • Opioid poisoning ED visits by age• Opioid poisoning ED visits by sex
Opioid-Related Harms in Canada
24
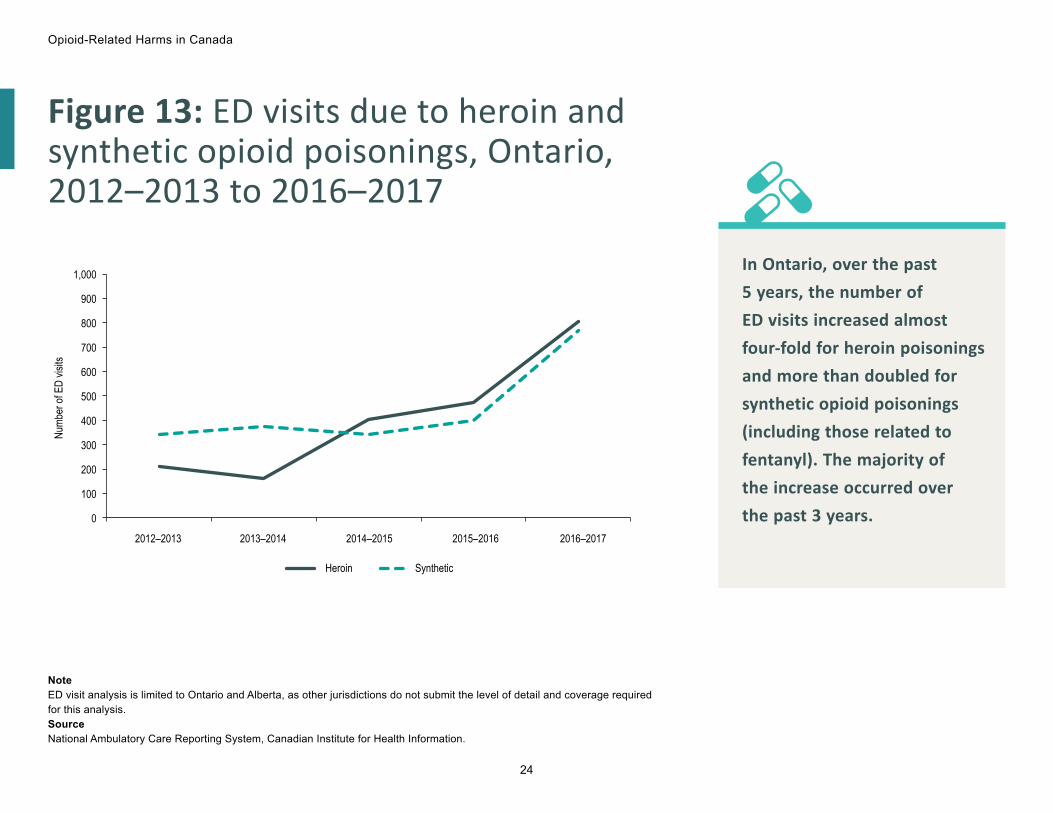
Figure 13: ED visits due to heroin and synthetic opioid poisonings, Ontario, 2012–2013 to 2016–2017
2012–2013 2013–2014 2014–2015 2015–2016 2016–2017
0
100
200
300
400
500
600
700
800
Numb
er of
ED
visits
900
1,000
Heroin Synthetic
NoteED visit analysis is limited to Ontario and Alberta, as other jurisdictions do not submit the level of detail and coverage required for this analysis.SourceNational Ambulatory Care Reporting System, Canadian Institute for Health Information.
In Ontario, over the past 5 years, the number of ED visits increased almost four-fold for heroin poisonings and more than doubled for synthetic opioid poisonings (including those related to fentanyl). The majority of the increase occurred over the past 3 years.

25
Opioid-Related Harms in Canada
Figure 14: Opioid poisoning ED visits by age, Ontario, 2012–2013 to 2016–2017
2012–2013 2013–2014 2014–2015 2015–2016 2016–20170
20
40
60
80
100
120
140
160
180
Rate
per 1
00,00
0 pop
ulatio
n
<15 15–24 25–44 45–64 65+
NoteED visit analysis is limited to Ontario and Alberta, as other jurisdictions do not submit the level of detail and coverage required for this analysis.SourceNational Ambulatory Care Reporting System, Canadian Institute for Health Information.
In Ontario, over the past 5 years, younger adults age 25 to 44 had the highest and fastest-growing rates of ED visits, increasing by 85%. The majority of the increase occurred over the past 3 years.

Opioid-Related Harms in Canada
26
Figure 15: Opioid poisoning ED visits by sex, Ontario, 2012–2013 to 2016–2017
2012–2013 2013–2014 2014–2015 2015–2016 2016–20170
20
40
60
80
100
120
Rate
per 1
00,00
0 pop
ulatio
n
Female Male
NoteED visit analysis is limited to Ontario and Alberta, as other jurisdictions do not submit the level of detail and coverage required for this analysis.SourceNational Ambulatory Care Reporting System, Canadian Institute for Health Information.
In Ontario, over the past 5 years, rates of ED visits increased almost 65% among males and 30% among females. The majority of the increase occurred over the past 3 years.
27
Opioid-Related Harms in Canada
MethodologyData sourcesHospital Morbidity DatabaseThe Hospital Morbidity Database (HMDB) captures administrative, clinical and demographic information on inpatient separations (referred to here as “hospitalizations”) from acute care hospitals. Hospitals in all provinces and territories (except Quebec) submit data directly to CIHI. Quebec data is submitted by the ministère de la Santé et des Services sociaux du Québec.
National Ambulatory Care Reporting SystemThe National Ambulatory Care Reporting System (NACRS) contains data on hospital-based and community-based ambulatory care — including day surgery, outpatient and community-based clinics and EDs — for 64% of the country: all of Ontario, Alberta and Yukon, and some facilities in Prince Edward Island, Nova Scotia, Manitoba, Saskatchewan and British Columbia. CIHI receives data directly from participating facilities or from regional health authorities and ministries of health.

Opioid-Related Harms in Canada
28
ICD-10-CA coding
The following ICD-10-CAii version 2015 codes were used to identify opioid poisonings that resulted in hospitalizations and ED visits:
ICD-10-CA code Description Example of opioids includedT40.0 Poisoning by opium Opium alkaloids
T40.1 Poisoning by heroin Heroin, diacetylmorphine
T40.2 Poisoning by other opioids Codeine, oxycodone, hydromorphone
T40.3 Poisoning by methadone Methadone
T40.4 Poisoning by other synthetic narcotics Fentanyl, tramadol
T40.6 Poisoning by unspecified and other narcotics Opiates not elsewhere classified
Codes with a prefix of Q, indicating a suspected diagnosis, were excluded from this analysis.
Of note, neither the HMDB nor NACRS includes data on how the patient obtained the opioid that led to the poisoning. Therefore, the analysis likely includes poisonings due to prescription opioids as well as those due to illegally produced or obtained opioids.
ii. International Statistical Classification of Diseases and Related Health Problems, 10th Revision, Canada.
29
Opioid-Related Harms in Canada
Opioid poisoning hospitalizations and ED visits were categorized based on the following ICD-10-CA categories:
• Accidental (X42): The poisoning was considered to be non-intentional in nature. Includes accidental poisoning of drug, wrong drug given or taken in error, and drug taken inadvertently.
• Intentional (X62): The poisoning occurred as a result of purposely self-inflicted harm.
• Unknown (Y12): Categorization of the poisoning was not possible due to unclear or insufficient information. In addition, poisonings missing a category (X42, X62 or Y12) were grouped in the unknown category.
Hospitalizations HMDB data was included for 2007–2008 to 2016–2017 across all provinces and territories. The most recent data available for Quebec and Nunavut at the time of release was for 2015–2016. The analysis was limited to “significant opioid poisonings,” that is, cases in which opioid poisoning was considered influential to the time spent in hospital and treatment received by the patient while there. To determine significant opioid poisoning hospitalizations, the following diagnosis types were selected:
(M) = Most responsible diagnosis (MRDx)
(1) = Pre-admit comorbidity
(2) = Post-admit comorbidity
(6) = Proxy MRDx
(W), (X), (Y) = Service transfer diagnosis
(C) = CIHI-assigned value for Quebec

Opioid-Related Harms in Canada
30
ED visitsNACRS data from Ontario and Alberta was included for 2012–2013 to 2016–2017. The analysis includes Level 3 ED abstracts where opioid poisoning was noted as either a “main” or “other” problem.
LimitationsThe coding of diagnoses using ICD-10-CA is based on patients’ chart documentation. Deficiencies in chart documentation and/or failure to provide coders with appropriate documents can affect data quality and lead to under-reporting.
The data in this analysis includes only opioid poisonings for which an individual was admitted to hospital (or to the ED in Ontario and Alberta) and does not capture cases that received treatment in other environments. Therefore, these figures represent an underestimate of the extent of opioid poisonings in Canada; the magnitude of this underestimation is unknown.
Other methodology notesFor some analyses, Yukon, the Northwest Territories and Nunavut are grouped together and reported as “Territories” due to low volumes.
For analysis by age, the following age groups were used: younger than 15 (children); 15 to 24 (youth); 25 to 44 (younger adults); 45 to 64 (older adults); and 65 and older (seniors).
To calculate standardized rates, the direct standardization process was used with the 2011 Canadian population as the reference year.
This analysis uses fiscal year data, from April 1 of one year to March 31 of the next.

31
Opioid-Related Harms in Canada
Appendix: Data tables for figures
Figure 1 Opioid poisoning hospitalizations in Canada, 2007–2008 to 2016–2017
Fiscal yearNumber of
hospitalizationsCrude rate per
100,000 population2007–2008 3,344 10.2
2008–2009 3,399 10.2
2009–2010 3,677 10.9
2010–2011 3,866 11.4
2011–2012 4,307 12.5
2012–2013 4,527 13.0
2013–2014 4,540 12.9
2014–2015 4,761 13.4
2015–2016 5,275 14.7
2016–2017* 5,670 15.6
Note* Quebec and Nunavut data is from 2015–2016 (the most recent year of data available).SourceHospital Morbidity Database, Canadian Institute for Health Information.

Opioid-Related Harms in Canada
32
Figure 2 Opioid poisoning hospitalization rates by province/territory, 2016–2017
Province/territory
Age-adjusted rate per 100,000 population,
2016–2017Absolute rate difference, 2015–2016 to 2016–2017
Newfoundland and Labrador 11.3 +0.2
Prince Edward Island 16.6 +1.4
Nova Scotia 11.0 +1.3
New Brunswick 17.8 +3.6
Quebec* 9.4 n/a
Ontario 13.8 +1.1
Manitoba 10.8 +0.5
Saskatchewan 21.7 -3.3
Alberta 23.1 +1.8
British Columbia 25.0 +1.6
Territories† 34.5 n/a
Canada 15.5 n/a
Notes* Quebec data is from 2015–2016 (the most recent year of data available).† Yukon, Northwest Territories and Nunavut data is grouped due to low volumes. This data should be interpreted with caution.
Nunavut data is from 2015–2016 (the most recent year of data available).n/a: Not available. SourceHospital Morbidity Database, Canadian Institute for Health Information.

33
Opioid-Related Harms in Canada
Figure 3 Opioid poisoning hospitalization rates by selected census metropolitan areas,* 2016–2017
Census metropolitan area Age-adjusted rate per
100,000 population, 2016–2017Calgary 21.1
Edmonton 25.8
Gatineau† 17.6
Greater Sudbury / Grand Sudbury 20.6
Halifax 11.6
Hamilton 21.8
Moncton 24.3
Montréal† 5.5
Ottawa 13.3
Québec† 13.2
Regina 28.2
Saint John 26.3
Saskatoon 26.1
St. John’s 15.7
Thunder Bay 27.4
Toronto 7.9
Vancouver 20.0
Victoria 20.1
Winnipeg 10.2
Notes* To be considered a census metropolitan area, the area must have a total population of at least 100,000 of which 50,000 or more
live in the urban core.† Quebec data is from 2015–2016 (the most recent year of data available).SourceHospital Morbidity Database, Canadian Institute for Health Information.

Opioid-Related Harms in Canada
34
Figure 4 Opioid poisoning hospitalizations by age, rate per 100,000 population, 2007–2008 to 2016–2017
Age group
2007–2008
2008–2009
2009–2010
2010–2011
2011–2012
2012–2013
2013–2014
2014–2015
2015–2016
2016–2017*
<15 1.4 1.4 1.3 1.4 1.4 1.5 1.7 1.8 1.7 1.8
15–24 6.5 6.4 6.6 7.1 8.4 9.5 9.8 10.4 12.4 13.3
25–44 11.1 10.2 11.1 11.0 13.1 12.8 12.4 13.0 16.0 18.1
45–64 13.5 14.3 15.4 16.3 17.0 18.3 18.0 18.2 19.3 20.2
65+ 16.4 16.8 17.4 17.9 19.2 19.1 18.9 19.8 19.4 19.2
Note* Quebec and Nunavut data is from 2015–2016 (the most recent year of data available).SourceHospital Morbidity Database, Canadian Institute for Health Information.

35
Opioid-Related Harms in Canada
Figure 5 Reasons for opioid poisoning hospitalizations, 2007–2008 to 2016–2017
Fiscal year Accidental Intentional Unknown2007–2008 39% 34% 27%
2008–2009 39% 33% 27%
2009–2010 40% 34% 26%
2010–2011 40% 35% 25%
2011–2012 41% 35% 24%
2012–2013 43% 34% 23%
2013–2014 44% 34% 22%
2014–2015 48% 33% 19%
2015–2016 49% 33% 18%
2016–2017* 52% 31% 17%
Note* Quebec and Nunavut data is from 2015–2016 (the most recent year of data available).SourceHospital Morbidity Database, Canadian Institute for Health Information.

Opioid-Related Harms in Canada
36
Figure 6 Reasons for opioid poisoning hospitalizations by age, 2016–2017*
Age group Accidental Intentional Unknown
<15 61% 34% 5%
15–24 44% 44% 12%
25–44 49% 34% 17%
45–64 49% 33% 18%
65+ 63% 16% 21%
Note* Quebec and Nunavut data is from 2015–2016 (the most recent year of data available).SourceHospital Morbidity Database, Canadian Institute for Health Information.
Figure 7 Opioid poisoning hospitalizations by sex, rate per 100,000 population, 2007–2008 to 2016–2017
Sex2007–2008
2008–2009
2009–2010
2010–2011
2011–2012
2012–2013
2013–2014
2014–2015
2015–2016
2016–2017*
Female 11.2 11.3 11.8 12.3 13.5 13.7 13.8 14.1 14.8 15.5
Male 9.1 9.1 10.0 10.4 11.5 12.3 12.0 12.7 14.6 15.8
Note* Quebec and Nunavut data is from 2015–2016 (the most recent year of data available).SourceHospital Morbidity Database, Canadian Institute for Health Information.
37
Opioid-Related Harms in Canada
Figure 8 Opioid poisoning ED visits, age-adjusted rate per 100,000 population, Ontario and Alberta, 2012–2013 to 2016–2017
Province 2012–2013 2013–2014 2014–2015 2015–2016 2016–2017Ontario 23.5 23.3 24.9 27.9 34.6
Alberta 37.6 38.6 47.0 65.1 88.6
NoteED visit analysis is limited to Ontario and Alberta, as other jurisdictions do not submit the level of detail and coverage required for this analysis.SourceNational Ambulatory Care Reporting System, Canadian Institute for Health Information.
Opioid-Related Harms in Canada
38
Figure 9 Opioid poisoning ED visit rates by census metropolitan areas,* Ontario and Alberta, 2016–2017
Census metropolitan area Age-adjusted rate per 100,000
population, 2016–2017Barrie 69.9
Brantford 98.9
Greater Sudbury / Grand Sudbury 37.1
Guelph 41.2
Hamilton 56.3
Kingston 45.3
Kitchener–Cambridge–Waterloo 53.8
London 43.6
Oshawa 56.4
Ottawa 27.3
Peterborough 67.3
St. Catharines–Niagara 72.5
Thunder Bay 63.2
Toronto 23.0
Windsor 32.1
Calgary 99.4
Edmonton 85.2
Notes* To be considered a census metropolitan area, the area must have a total population of at least 100,000 of which 50,000 or more
live in the urban core.ED visit analysis is limited to Ontario and Alberta, as other jurisdictions do not submit the level of detail and coverage required for this analysis.SourceNational Ambulatory Care Reporting System, Canadian Institute for Health Information.

39
Opioid-Related Harms in Canada
Figure 10 Number of ED visits due to heroin and synthetic opioid poisonings, Alberta, 2012–2013 to 2016–2017
Opioid type 2012–2013 2013–2014 2014–2015 2015–2016 2016–2017Heroin 78 110 202 387 766
Synthetic 86 109 175 590 911
NoteED visit analysis is limited to Ontario and Alberta, as other jurisdictions do not submit the level of detail and coverage required for this analysis.SourceNational Ambulatory Care Reporting System, Canadian Institute for Health Information.
Figure 11 Opioid poisoning ED visits by age, rate per 100,000 population, Alberta, 2012–2013 to 2016–2017
Age group 2012–2013 2013–2014 2014–2015 2015–2016 2016–2017<15 6.2 8.5 6.9 6.0 4.8
15–24 50.9 57.9 72.5 115.2 162.1
25–44 49.8 49.6 68.6 100.0 151.0
45–64 41.3 41.1 46.3 58.9 72.5
65+ 30.7 29.7 32.3 36.3 35.1
NoteED visit analysis is limited to Ontario and Alberta, as other jurisdictions do not submit the level of detail and coverage required for this analysis.SourceNational Ambulatory Care Reporting System, Canadian Institute for Health Information.

Opioid-Related Harms in Canada
40
Figure 12 Opioid poisoning ED visits by sex, rate per 100,000 population, Alberta, 2012–2013 to 2016–2017
Sex 2012–2013 2013–2014 2014–2015 2015–2016 2016–2017Female 41.0 41.2 45.7 59.0 72.6
Male 34.4 36.4 50.3 74.3 110.0
NoteED visit analysis is limited to Ontario and Alberta, as other jurisdictions do not submit the level of detail and coverage required for this analysis.SourceNational Ambulatory Care Reporting System, Canadian Institute for Health Information.
Figure 13 Number of ED visits due to heroin and synthetic opioid poisonings, Ontario, 2012–2013 to 2016–2017
Opioid type 2012–2013 2013–2014 2014–2015 2015–2016 2016–2017Heroin 209 163 404 472 804
Synthetic 340 374 341 400 769
NoteED visit analysis is limited to Ontario and Alberta, as other jurisdictions do not submit the level of detail and coverage required for this analysis.SourceNational Ambulatory Care Reporting System, Canadian Institute for Health Information.

41
Opioid-Related Harms in Canada
Figure 14 Opioid poisoning ED visits by age, rate per 100,000 population, Ontario, 2012–2013 to 2016–2017
Age group 2012–2013 2013–2014 2014–2015 2015–2016 2016–2017<15 3.2 3.4 3.1 3.9 3.8
15–24 30.1 29.7 32.4 32.2 41.8
25–44 30.8 29.8 33.6 40.9 56.9
45–64 27.1 27.5 27.8 30.3 34.5
65+ 19.2 19.5 20.6 21.9 22.1
NoteED visit analysis is limited to Ontario and Alberta, as other jurisdictions do not submit the level of detail and coverage required for this analysis.SourceNational Ambulatory Care Reporting System, Canadian Institute for Health Information.
Figure 15 Opioid poisoning ED visits by sex, rate per 100,000 population, Ontario, 2012–2013 to 2016–2017
Sex 2012–2013 2013–2014 2014–2015 2015–2016 2016–2017Female 22.6 22.4 22.7 26.5 29.1
Male 24.4 24.2 27.1 29.2 40.1
NoteED visit analysis is limited to Ontario and Alberta, as other jurisdictions do not submit the level of detail and coverage required for this analysis.SourceNational Ambulatory Care Reporting System, Canadian Institute for Health Information.

[email protected] Ottawa495 Richmond Road
Suite 600
Ottawa, Ont.
K2A 4H6
613-241-7860
CIHI Toronto 4110 Yonge Street
Suite 300
Toronto, Ont.
M2P 2B7
416-481-2002
CIHI Victoria 880 Douglas Street
Suite 600
Victoria, B.C.
V8W 2B7
250-220-4100
CIHI Montréal 1010 Sherbrooke Street West
Suite 602
Montréal, Que.
H3A 2R7
514-842-2226
cihi.ca15874-0817