opportunities for equitable access to quality basic education
TRANSCRIPT
Opportunities for Equitable Access to Quality Basic Education (OPEQ)
Baseline Report: Teacher Survey Results
Prepared by:
Catalina Torrente, John Lawrence Aber, Dirk Witteveen,
Taveeshi Gupta & Brian Johnston
New York University
Anjuli Shivshanker
International Rescue Committee Research, Evaluation & Learning Unit
Evaluation Team:
Jeannie Annan & Tom Bundervoet
International Rescue Committee Research, Evaluation & Learning Unit
August, 2012
This report is made possible by the generous support of the American people through the United States
Agency for International Development (USAID). The contents are the responsibility of the IRC and do
not necessarily reflect the views of USAID or the United States Government.
Edits and comments provided by:
Aissatou Balde, Education Technical Advisor, DRC
Youssouf Diallo, Research Advisor, DRC
With special thanks to:
Anita Anastacio, Julia Frazier, Willy Mpwate, Jennifer Sklar, Nina Weisenhorn, the Democratic
Republic of Congo Ministry of Primary, Secondary, and Professional Education (MEPSP), and
our talented data collection supervisors and enumerators.
Acknowledgments
Thanks to Dr. Edward Seidman for his continued support and to our dedicated research
assistants and volunteers at NYU: Emily Jacobson, Todd Solomon, Mahjabeen Raza, Marissa
McCoy, Alana Gross, Damira Rasheed, Vanessa Paul and Marian Tes.
3
Table of Contents
Executive Summary……………………………………………………………………..….......... 6
Introduction …………………………………………………………………………………........ 12
Teacher Sample Characteristics……………………………………………………………….... 13
Measures………………………………………………………………………………………....... 13
Descriptive Results…………………………………………………………………………......... 15
Teacher Demographic
Characteristics…………………………………………………………….........................
15
Teacher Living Conditions………………………………………………………............ 18
Teacher Work Conditions…………………………………………………………….... 24
Teacher Motivation and Wellbeing…………………………………………………………...... 29
Descriptive
Results……...…………………………………………………………………………......
Motivation, Criticism of School & Job Dissatisfaction……………………... 31
Burnout & Personal Accomplishment……………………………………….. 34
Role in Children's Socio-Emotional Wellbeing (SEW) and Perceptions of
Parent Support……………………………………………………………….....
36
Regression Analyses…………………………………………………………………………….. 39
Main Results………………………………………………………………………......... 42
Conclusions and Recommendations………………………………………………………….... 45
Baseline Report: Teacher Survey Results
4
List of Tables
Table 1. Number of teachers by subdivision & grade……...………………………………..... 13
Table 2. Variability in teachers' age by subdivision………………...……………………….... 15
Table 3. Teachers' highest level of education………………...……………………………........ 16
Table 4. Percentages of who speak each mother tongue across the full sample …………... 16
Table 5. Percentage of teachers who answered yes to household asset and building
material questions …………………………………………..........................................
18
Table 6. Frequency of hunger in the household ………………………………......................... 21
Table 7. Complete list of teacher variables organized by block…………………………….... 40
List of Figures
Figure 1. Distribution of mother tongues across subdivisions………………………….….... 17
Figure 2. Mean teacher wealth by subdivision………………………………………….…...... 19
Figure 3. Variability in teacher wealth by subdivision……………………………………….. 20
Figure 4. Frequency of hunger in the household by subdivision…………………….…….... 22
Figure 5. Percentages of local vs. not local teachers by subdivision………………….…....... 23
Figure 6. Within and between-subdivision variation in teachers' income………………...... 25
Figure 7. Scatter plot of total income by income over household consumption in CDF...... 26
Figure 8. Frequency of late payment ……………………………...………………………........ 27
Figure 9. Percentage of teachers who reported school conditions as obstacles to
teaching………………………...……………………………………………...………......
28
Figure 10. Mean scores for teacher motivation, criticism of school and job
dissatisfaction…………………..........................................................................................
31
Baseline Report: Teacher Survey Results
5
Figure 11. Variability in teacher motivation, criticism of school and job
dissatisfaction…………………………………………………..........................................
32
Figure 12. Mean scores for teacher burnout and personal accomplishment………...……... 33
Figure 13. Variability in teacher burnout and sense of personal accomplishment……....... 35
Figure 14. Mean scores for teacher role in socio-emotional
wellbeing and perception of parent support….…………………………………….....
36
Figure 15. Variability in teacher role in socio-emotional
wellbeing and perception of parent support………...…………………………….......
38
Baseline Report: Teacher Survey Results
6
Executive Summary
1. Introduction
The International Rescue Committee (IRC), in partnership with Research Triangle Institute
(RTI), the Flemish Association for Development Cooperation and Technical Assistance (VVOB)
and the Institute of Human Development and Social Change (IHDSC) at New York University
(NYU), has undertaken an initiative entitled Opportunities for Equitable Access to Quality Basic
Education (OPEQ) with the goal of improving learning conditions, academic performance and
social-emotional wellbeing for more than 480,000 girls and boys in three eastern provinces of
the Democratic Republic of Congo.
With the dual goals of evaluating and enhancing the impact of its interventions and finding
what works to train teachers in post-conflict settings, the IRC and NYU are conducting a
cluster-randomized impact evaluation of OPEQ. The present report uses baseline data from the
province of Katanga to describe the population of teachers to be reached by OPEQ in this
province and to start exploring predictors of teacher motivation and wellbeing. For a
description of the overall design and data collection procedures please refer to the child literacy
and numeracy baseline report (Torrente et al., 20111).
2. Main Descriptive Results
Teachers basic demographic characteristics
The typical teacher in Katanga is a male in his late 30s, has completed secondary school,
expresses a desire to obtain more education, and has taught for an average of 12 to 13 years.
Overall, Kambove was the subdivision with the most experienced teachers, whereas Kongolo
had the least experienced.
Also, the typical teacher speaks Swahili, although there is great variation within and between
subdivisions. Kasenga, for example, stands out for having the least percentage of teachers who
speak Swahili. The dominant language in this subdivision is Bemba.
Most teachers in Katanga are married and live with their partner, and they have an average of 4
to 6 biological children, and at least one additional child they need to take care of, as is
customary in the DRC.
1 Torrente, C., Aber, J.L., Shivshanker, A., Annan, J., & Bundervoet, T. (2011). Opportunities for Equitable
Access to Quality Basic Education (OPEQ). Results from the Early Grade Reading Assessment, the Early
Grade Math Assessment, and children’s demographic data in Katanga Province, Democratic Republic of
Congo. Unpublished Manuscript.
Baseline Report: Teacher Survey Results
7
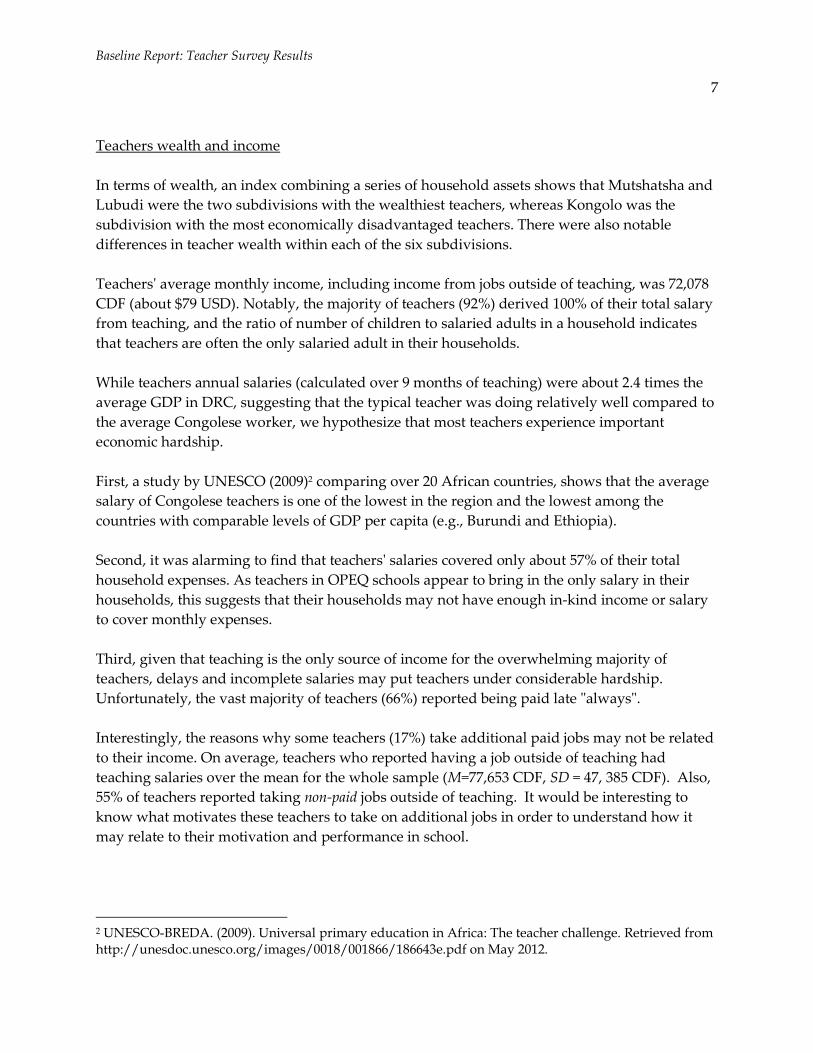
Teachers wealth and income
In terms of wealth, an index combining a series of household assets shows that Mutshatsha and
Lubudi were the two subdivisions with the wealthiest teachers, whereas Kongolo was the
subdivision with the most economically disadvantaged teachers. There were also notable
differences in teacher wealth within each of the six subdivisions.
Teachers' average monthly income, including income from jobs outside of teaching, was 72,078
CDF (about $79 USD). Notably, the majority of teachers (92%) derived 100% of their total salary
from teaching, and the ratio of number of children to salaried adults in a household indicates
that teachers are often the only salaried adult in their households.
While teachers annual salaries (calculated over 9 months of teaching) were about 2.4 times the
average GDP in DRC, suggesting that the typical teacher was doing relatively well compared to
the average Congolese worker, we hypothesize that most teachers experience important
economic hardship.
First, a study by UNESCO (2009)2 comparing over 20 African countries, shows that the average
salary of Congolese teachers is one of the lowest in the region and the lowest among the
countries with comparable levels of GDP per capita (e.g., Burundi and Ethiopia).
Second, it was alarming to find that teachers' salaries covered only about 57% of their total
household expenses. As teachers in OPEQ schools appear to bring in the only salary in their
households, this suggests that their households may not have enough in-kind income or salary
to cover monthly expenses.
Third, given that teaching is the only source of income for the overwhelming majority of
teachers, delays and incomplete salaries may put teachers under considerable hardship.
Unfortunately, the vast majority of teachers (66%) reported being paid late "always".
Interestingly, the reasons why some teachers (17%) take additional paid jobs may not be related
to their income. On average, teachers who reported having a job outside of teaching had
teaching salaries over the mean for the whole sample (M=77,653 CDF, SD = 47, 385 CDF). Also,
55% of teachers reported taking non-paid jobs outside of teaching. It would be interesting to
know what motivates these teachers to take on additional jobs in order to understand how it
may relate to their motivation and performance in school.
2 UNESCO-BREDA. (2009). Universal primary education in Africa: The teacher challenge. Retrieved from http://unesdoc.unesco.org/images/0018/001866/186643e.pdf on May 2012.
Baseline Report: Teacher Survey Results
8
Other living and work conditions
A considerable number of teachers reported their physical health as ‘poor’ (13.8%) or ‘fair’
(36.9%). Moreover, about a fourth of the sample reported that children and adults in their
household went to bed hungry 3 to 10 days in the past month, and 5% reported children and
adults went to bed hungry more than 10 days in the past month.
The typical teacher was not born in the community where he currently works and was not
living in the community when hired as a teacher. However, a large percent of teachers (69.5%)
report that at least some of their family members live nearby and an important percent (71.9%)
report that some or all of their closest friends live nearby. Only four percent of teachers reported
having neither family members nor close friends nearby.
Teachers felt more valued and respected in their local communities than by DRC citizens
outside of their community and government leaders. This points of the potential of local
communities in supporting teachers' role, calls for a better understanding of the factors that
influence teachers' perceptions about how valued and respected they are by DRC citizens and
government leaders, and highlights an area that needs considerable improvement.
In terms of perceived obstacles to teaching, the lack of teaching materials was reported as the
main factor to hinder teachers' ability to teach, followed by textbooks and blackboards. The
OPEQ teacher professional development system emphasizes improving teaching practices and
classroom processes, although it provides guidance and templates for how to make
instructional materials. It will be interesting to track the response to this question over time to
see if perceived barriers continue to be concrete education inputs as there is not strong evidence
that increased resources at the school level lead to improvements in learning outcomes (e.g.
Duflo, Dupas, & Kremer, 2009; Glewwe, Kremer, Moulin, & Zitzewitz, 2004; Glewwe, Kremer,
& Moulin, 2007;
3. Main Results From Regression Analyses
Given teachers' living and work conditions, it was surprising to find overall high levels of
motivation and low levels of job dissatisfaction. However, there was wide variation between
teachers, with some teachers reporting low levels of motivation and high dissatisfaction.
Regression analyses suggest that having more teaching experience, better physical health, and a
lower number of household members who are unwell were associated with more motivation
and less job dissatisfaction. Also, teachers who were born in the community where they teach,
who reported that teachers in their school are held accountable for unacceptable behavior and
who perceived policy environments as less problematic (e.g., school principal does not have
unrealistic expectations, curricula does not change too often, school uses curricula that are not
Baseline Report: Teacher Survey Results
9
too difficult for students, etc.) tended to report higher motivation. As expected, teachers who
are more motivated report fewer absences than less motivated teachers. Job satisfaction,
however, was not associated with teacher absenteeism. Also, teachers who considered the
quality of supervision from their school principal as "good", reported less dissatisfaction with
their job.
Regarding teacher absenteeism in particular, our analyses suggest that female teachers,
teachers who live in households with more people, who need to spend more time traveling to
school, who report poorer physical health, who were born outside the community, and who
perceive the policy environment as problematic, tended to be more absent from school than
male teachers, teachers born in the community and teachers who reported better living and
work conditions. The OPEQ intervention may improve the perception of the school policy
environment as well as the quality of supervision teachers receive from school principals, which
could lead to reduced absenteeism for some teachers.
On average, teachers were highly critical of their school's approach to teaching.
Teachers who reported being required to be at school for more hours and teachers who speak
French were more critical of their school, but teachers who felt safe at school and who had a
non-paid job outside of teaching tended to be less critical. This could be for example because
teachers who are required to stay at school more hours forgo opportunities to recoup the
remaining 40% of household monthly expenses through other salaried or non-salaried work,
whereas teachers with non-salaried work outside of teaching (e.g. farming) may be more able to
cover monthly expenses. Whether this criticism serves to propel teachers to look for alternatives
for the improvement of school conditions or whether it diminishes motivation and performance
remains an open question.
Teachers also reported moderate levels of burnout and moderate to high levels of personal
accomplishment. Again, there was a wide range of variation around the average scores.
Analyses indicate that being a male, having a non-paid job outside of teaching, perceiving
higher levels of support from parents, and speaking French were associated with higher sense
of personal accomplishment. Interestingly, French-speaking teachers also reported higher
levels of burnout, as did teachers with less wealth, more dependent children, more unwell
household members and those who reported poorer physical health. While these associations
merit further exploration, they suggest that empowering parents to support teachers (for
example by visiting school to talk about their children, participating in the parent assembly,
helping children get to school every day) may have positive effects on teachers' sense of
accomplishment.
Overall, teachers reported endorsing their role in children's social-emotional wellbeing. As is
the case with the other constructs, variability between teachers within subdivisions is striking.
Baseline Report: Teacher Survey Results
10
Teachers in higher grades felt more strongly that they play a role in student’s social and
emotional learning. It is possible that school directors chose teachers who are more inclined to
attend to the social-emotional needs of children to teach in the higher grades, where children's
behavior and emotional problems may become more evident. Also, teachers who were born in
the community where they teach tended to report more endorsement of their role in children's
social-emotional wellbeing. These teachers may feel more connected to their students and thus
more responsible for attending all aspects of their development.
4. Conclusions and recommendations
Notwithstanding significant variation between teachers, our results show that on average,
teachers in Katanga report being motivated to help children learn and grow, are fairly satisfied
with their job and feel that their work is meaningful. These positive attitudes can be used to the
advantage of programs like OPEQ, inasmuch as they can serve to engage and maintain teachers'
interest in learning new techniques and contents, both of which take effort and perseverance.
In spite of the overall favorable picture, the wide variation between teachers cannot be
understated. As expected, some of this variation can be explained by teachers' living and work
conditions. Our descriptive analyses corroborate that many teachers in this region may face
considerable hardship as a result of late and insufficient payments. Economic hardship is
associated with a multitude of problems, such as poor health outcomes, household
overcrowding, higher child burden and hunger, all of which can take a toll on teachers' mental
health (e.g., burnout, sense of accomplishment), and as suggested by our results, on teachers'
motivation and job satisfaction.
There were also factors at the school level, such as accountability and the quality of supervision
provided by school directors, which were associated with teachers' motivation and level of job
satisfaction. Our results suggest that improvements in these aspects of school culture and
functioning can result in improvements in teachers' motivation and satisfaction.
Interestingly, whereas teachers report feeling accomplished, motivated and satisfied, they also
report being highly critical of their schools' approach to teaching academics and supporting
children's social-emotional development. Given children's low performance in the EGRA and
EGMA tests (see Torrente et al., 2011), discontent with the current state of affairs may be
positive, in the sense that it may facilitate teachers' receptiveness to initiatives like OPEQ.
Listening to teachers' opinions about practices and policies that are not working is warranted, as
they are closer to children and may have valuable insights about how to improve learning
conditions in this part of the world.
Finally, it is important to keep in mind that while motivation and its correlates favor
performance, they do not guarantee it. Other conditions must be in place for teachers to
translate positive attitudes into effective teaching practices. Impact analysis of the OPEQ
Baseline Report: Teacher Survey Results
11
evaluation will help determine whether the OPEQ revised curricula and in-service teacher
training and coaching system have a positive effect on teacher performance.
Baseline Report: Teacher Survey Results
12
INTRODUCTION
The International Rescue Committee (IRC), in partnership with Research Triangle Institute
(RTI), the Flemish Association for Development Cooperation and Technical Assistance (VVOB)
and the Institute of Human Development and Social Change (IHDSC) at New York University
(NYU), has undertaken an initiative entitled Opportunities for Equitable Access to Quality Basic
Education (OPEQ). The main objective of OPEQ is to improve primary education in North
Kivu, South Kivu and Katanga provinces of the Democratic Republic of Congo (DRC), for more
than 480,000 girls and boys.
As part of the IRC’s commitment to gathering evidence about the impact of its interventions,
the IRC and NYU are conducting a cluster-randomized impact evaluation of the teacher
training and revised curricula components of OPEQ. The impact evaluation will gather
evidence about the impact of OPEQ on teachers' motivation and performance and children’
outcomes; examine whether the impact of OPEQ varies by individuals’ characteristics (e.g.,
gender, grade), schools (e.g., school size) and communities (e.g., access to resources); make
improvements over the life of the project; and inform similar projects and policy efforts in DRC
and internationally.
Baseline data were collected in Katanga province from March to May, 2011, to assess teachers'
personal and family characteristics, teacher accountability, perceptions of safety, vocational
commitment, and working and living conditions, and other factors that may predict teacher
motivation and performance. Data were also collected on children's living conditions, math and
reading performance and socio-emotional wellbeing. Results for these data, with the exception
of children's socio-emotional wellbeing, are summarized in the child baseline report3.
The current report presents descriptive findings and preliminary regression analyses on
teachers' baseline data. Definitive conclusions about the causal impact of the OPEQ initiative on
teachers' motivation and performance cannot be drawn until collection and analysis of follow-
up data in 2012 and 2013.
3 Torrente, C., Aber, J.L., Shivshanker, A., Annan, J., & Bundervoet, T. (2011). Opportunities for Equitable
Access to Quality Basic Education (OPEQ). Results from the Early Grade Reading Assessment, the Early
Grade Math Assessment, and children’s demographic data in Katanga Province, Democratic Republic of
Congo. Unpublished Manuscript.
Baseline Report: Teacher Survey Results
13
Teacher Sample Characteristics
Four hundred fifty-three (453) teachers from the 84 schools participating in OPEQs baseline
data collection were randomly selected and agreed to participate in teacher interviews.
Teachers were selected from all grades in elementary schools (1st to 6th) and were 37.9 years old
on average and had taught for an average of 12.5 years.
For a description of the overall design and data collection procedures please refer to the child
baseline report (Torrente et al., 2011).
Distribution of teachers across subdivisions and grades
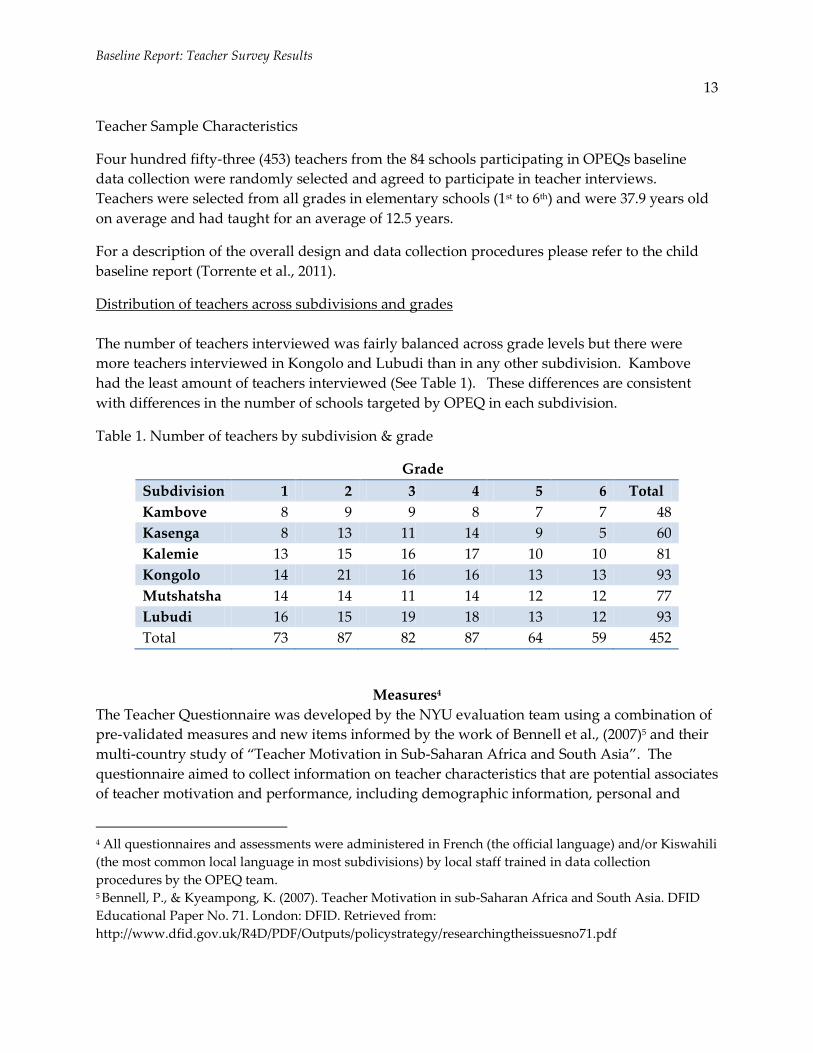
The number of teachers interviewed was fairly balanced across grade levels but there were
more teachers interviewed in Kongolo and Lubudi than in any other subdivision. Kambove
had the least amount of teachers interviewed (See Table 1). These differences are consistent
with differences in the number of schools targeted by OPEQ in each subdivision.
Table 1. Number of teachers by subdivision & grade
Grade
Subdivision 1 2 3 4 5 6 Total
Kambove 8 9 9 8 7 7 48
Kasenga 8 13 11 14 9 5 60
Kalemie 13 15 16 17 10 10 81
Kongolo 14 21 16 16 13 13 93
Mutshatsha 14 14 11 14 12 12 77
Lubudi 16 15 19 18 13 12 93
Total 73 87 82 87 64 59 452
Measures4
The Teacher Questionnaire was developed by the NYU evaluation team using a combination of
pre-validated measures and new items informed by the work of Bennell et al., (2007)5 and their
multi-country study of “Teacher Motivation in Sub-Saharan Africa and South Asia”. The
questionnaire aimed to collect information on teacher characteristics that are potential associates
of teacher motivation and performance, including demographic information, personal and
4 All questionnaires and assessments were administered in French (the official language) and/or Kiswahili
(the most common local language in most subdivisions) by local staff trained in data collection
procedures by the OPEQ team. 5 Bennell, P., & Kyeampong, K. (2007). Teacher Motivation in sub-Saharan Africa and South Asia. DFID
Educational Paper No. 71. London: DFID. Retrieved from:
http://www.dfid.gov.uk/R4D/PDF/Outputs/policystrategy/researchingtheissuesno71.pdf
Baseline Report: Teacher Survey Results
14
family characteristics, living conditions, safety and security, salary, vocational commitment and
teacher burnout, among others.
The baseline questionnaire had a total of 191 items and took on average 57 minutes to complete.
This report first provides an overview of key teacher background characteristics (i.e.,
demographics, living and work conditions) and then focuses on six constructs that we consider
critical to understanding teacher motivation and wellbeing in the DRC, namely: Teachers'
motivation and goals, criticism of school, job dissatisfaction, burnout, sense of personal
accomplishment, and perception of role in children's socio-emotional wellbeing. Also,
highlights of preliminary regression analyses will be presented that examine the association
between teachers' living and work conditions and their motivation and wellbeing.
Baseline Report: Teacher Survey Results
15
DESCRIPTIVE RESULTS
Teacher Demographic Characteristics
Gender: The majority of elementary school teachers interviewed were male. Overall, there were
almost three times as many male teachers (71.1%) as female teachers (27.2%).
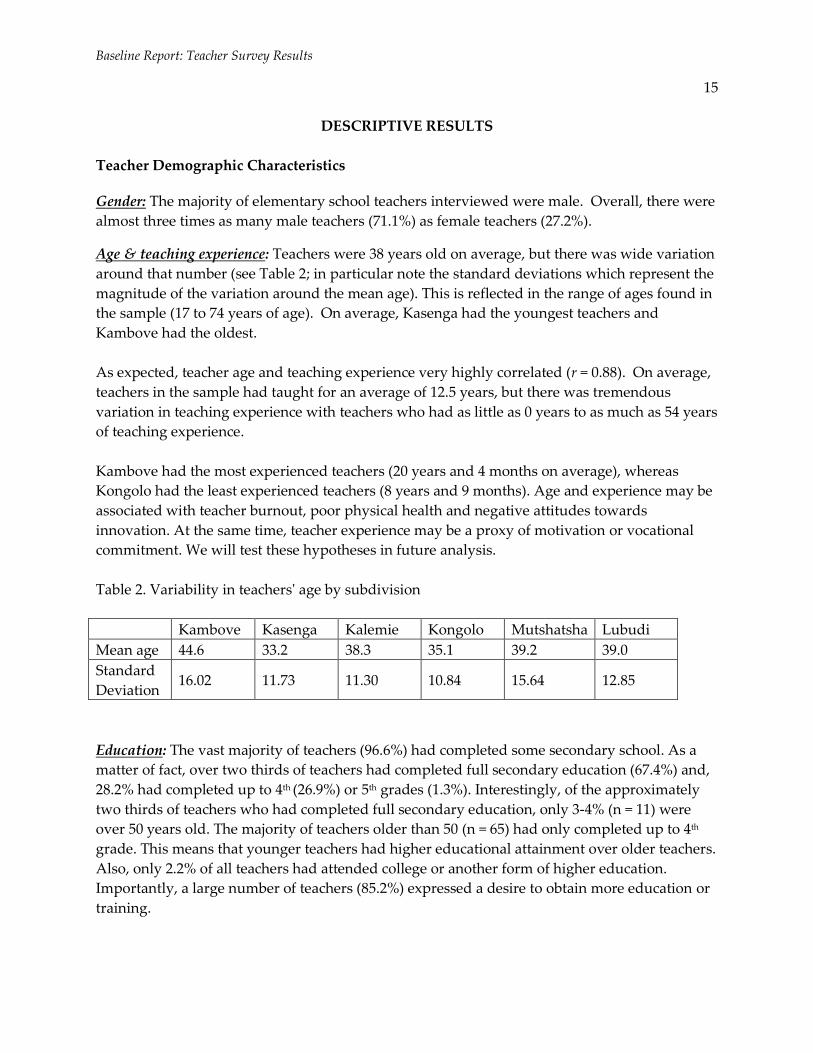
Age & teaching experience: Teachers were 38 years old on average, but there was wide variation
around that number (see Table 2; in particular note the standard deviations which represent the
magnitude of the variation around the mean age). This is reflected in the range of ages found in
the sample (17 to 74 years of age). On average, Kasenga had the youngest teachers and
Kambove had the oldest.
As expected, teacher age and teaching experience very highly correlated (r = 0.88). On average,
teachers in the sample had taught for an average of 12.5 years, but there was tremendous
variation in teaching experience with teachers who had as little as 0 years to as much as 54 years
of teaching experience.
Kambove had the most experienced teachers (20 years and 4 months on average), whereas
Kongolo had the least experienced teachers (8 years and 9 months). Age and experience may be
associated with teacher burnout, poor physical health and negative attitudes towards
innovation. At the same time, teacher experience may be a proxy of motivation or vocational
commitment. We will test these hypotheses in future analysis.
Table 2. Variability in teachers' age by subdivision
Kambove Kasenga Kalemie Kongolo Mutshatsha Lubudi
Mean age 44.6 33.2 38.3 35.1 39.2 39.0
Standard
Deviation 16.02 11.73 11.30 10.84 15.64 12.85
Education: The vast majority of teachers (96.6%) had completed some secondary school. As a
matter of fact, over two thirds of teachers had completed full secondary education (67.4%) and,
28.2% had completed up to 4th (26.9%) or 5th grades (1.3%). Interestingly, of the approximately
two thirds of teachers who had completed full secondary education, only 3-4% (n = 11) were
over 50 years old. The majority of teachers older than 50 (n = 65) had only completed up to 4th
grade. This means that younger teachers had higher educational attainment over older teachers.
Also, only 2.2% of all teachers had attended college or another form of higher education.
Importantly, a large number of teachers (85.2%) expressed a desire to obtain more education or
training.
Baseline Report: Teacher Survey Results
16
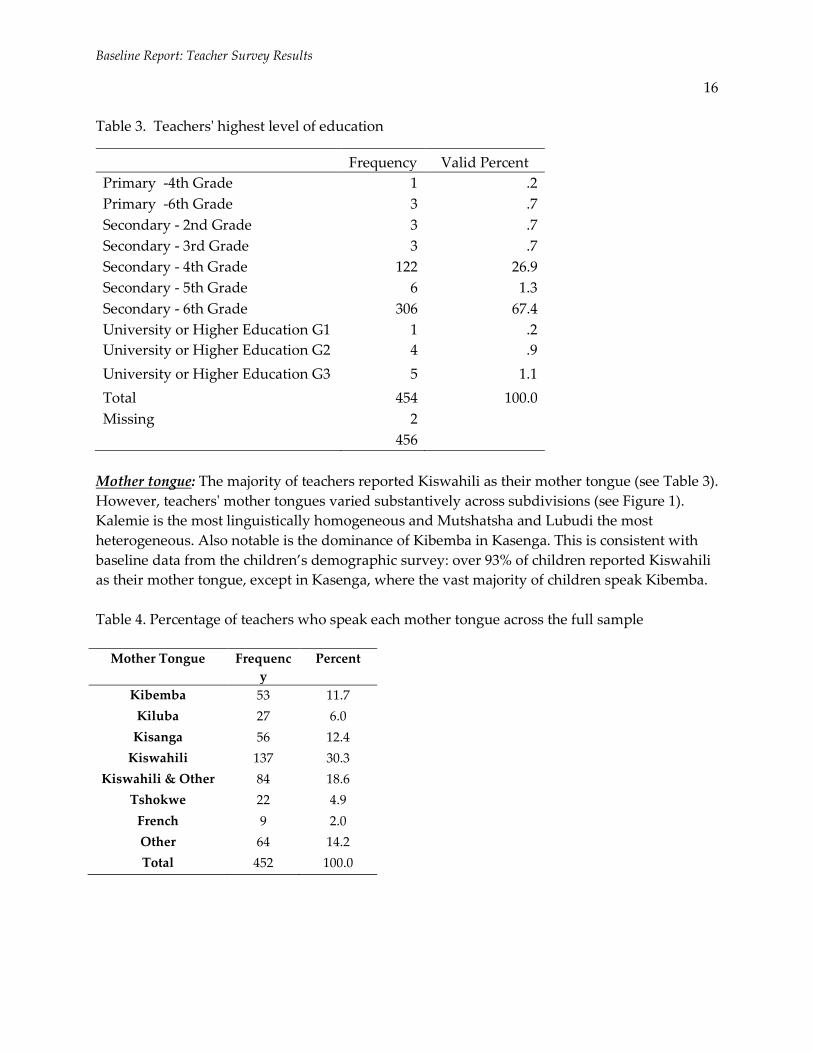
Table 3. Teachers' highest level of education
Frequency Valid Percent
Primary -4th Grade 1 .2
Primary -6th Grade 3 .7
Secondary - 2nd Grade 3 .7
Secondary - 3rd Grade 3 .7
Secondary - 4th Grade 122 26.9
Secondary - 5th Grade 6 1.3
Secondary - 6th Grade 306 67.4
University or Higher Education G1 1 .2
University or Higher Education G2 4 .9
University or Higher Education G3 5 1.1
Total 454 100.0
Missing 2
456
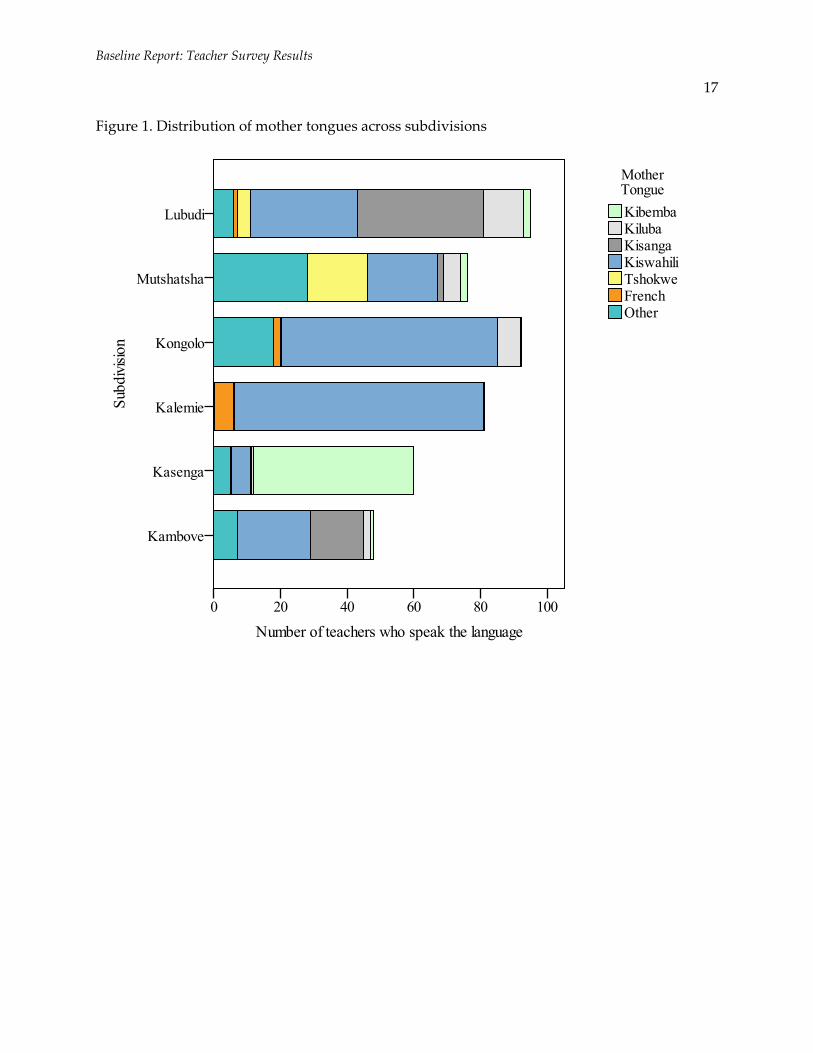
Mother tongue: The majority of teachers reported Kiswahili as their mother tongue (see Table 3).
However, teachers' mother tongues varied substantively across subdivisions (see Figure 1).
Kalemie is the most linguistically homogeneous and Mutshatsha and Lubudi the most
heterogeneous. Also notable is the dominance of Kibemba in Kasenga. This is consistent with
baseline data from the children’s demographic survey: over 93% of children reported Kiswahili
as their mother tongue, except in Kasenga, where the vast majority of children speak Kibemba.
Table 4. Percentage of teachers who speak each mother tongue across the full sample
Mother Tongue Frequenc
y
Percent
Kibemba 53 11.7
Kiluba 27 6.0
Kisanga 56 12.4
Kiswahili 137 30.3
Kiswahili & Other 84 18.6
Tshokwe 22 4.9
French 9 2.0
Other 64 14.2
Total 452 100.0
Baseline Report: Teacher Survey Results
17
Figure 1. Distribution of mother tongues across subdivisions
Baseline Report: Teacher Survey Results
18
Teacher Living Conditions
Marital Status & Family Composition: Most teachers reported being married/partnered (81%),
and of those who were married/partnered, the vast majority (97.5%) reported living with their
spouse/partner. Kambove stood out for having a relatively high percentage of teachers who
reported being widowed (13%). This might be related to the advanced age of teachers in this
subdivision.
Regarding offspring, 86.7% of teachers reported having children and the average number of
biological children was 4.66 (SD = 2.83). Interestingly, teachers reported a higher number of
dependent children (M = 5.77, SD= 3.36). On average, teachers had one non-biological child in
the household– e.g., surrogate child or adopted child. Very often, Congolese adults adopt the
children of relatives or friends due to a range of reasons.
Household wealth: Teachers were asked a series of questions about their household assets and
building materials to get a sense of teachers' wealth. Table 4 below summarizes the percentage
of teachers who answered "yes" to each of these questions.
Table 5. Percentage of teachers who answered "yes" to household assets and building materials
questions
Do you or someone in your house
own:
%
"Yes" Household materials
%
"Yes"
1. Mattress 61.3 1. Aluminum roof 42.2
2. Motorcycle 58.3 2. Burnt brick walls 24.9
3. Goats/sheep/pigs 31.3 3. Cement Floor 15.5
4. Bicycle 1.1
5. Car 0.9
6. Cows 0.9
After conducting an exploratory factor analysis the questions above were summed to create a
summary wealth index. The total index score ranges from 0 to 9, and a higher score represents
higher wealth.
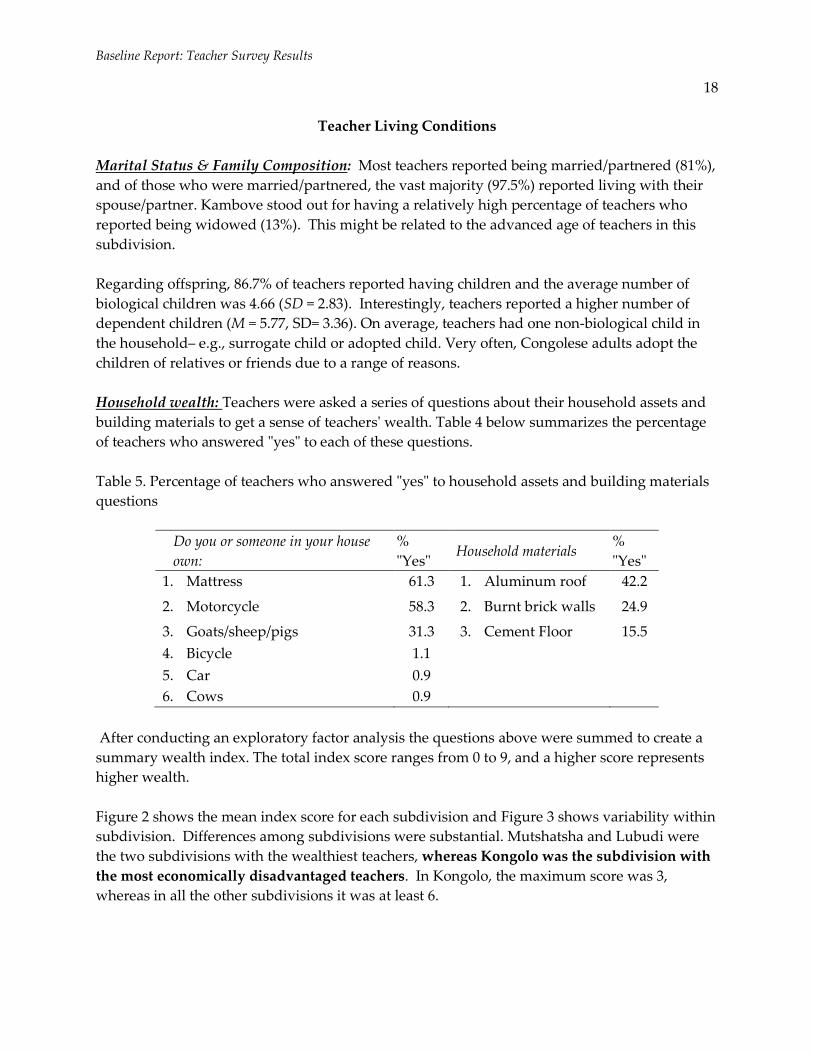
Figure 2 shows the mean index score for each subdivision and Figure 3 shows variability within
subdivision. Differences among subdivisions were substantial. Mutshatsha and Lubudi were
the two subdivisions with the wealthiest teachers, whereas Kongolo was the subdivision with
the most economically disadvantaged teachers. In Kongolo, the maximum score was 3,
whereas in all the other subdivisions it was at least 6.
Baseline Report: Teacher Survey Results
19
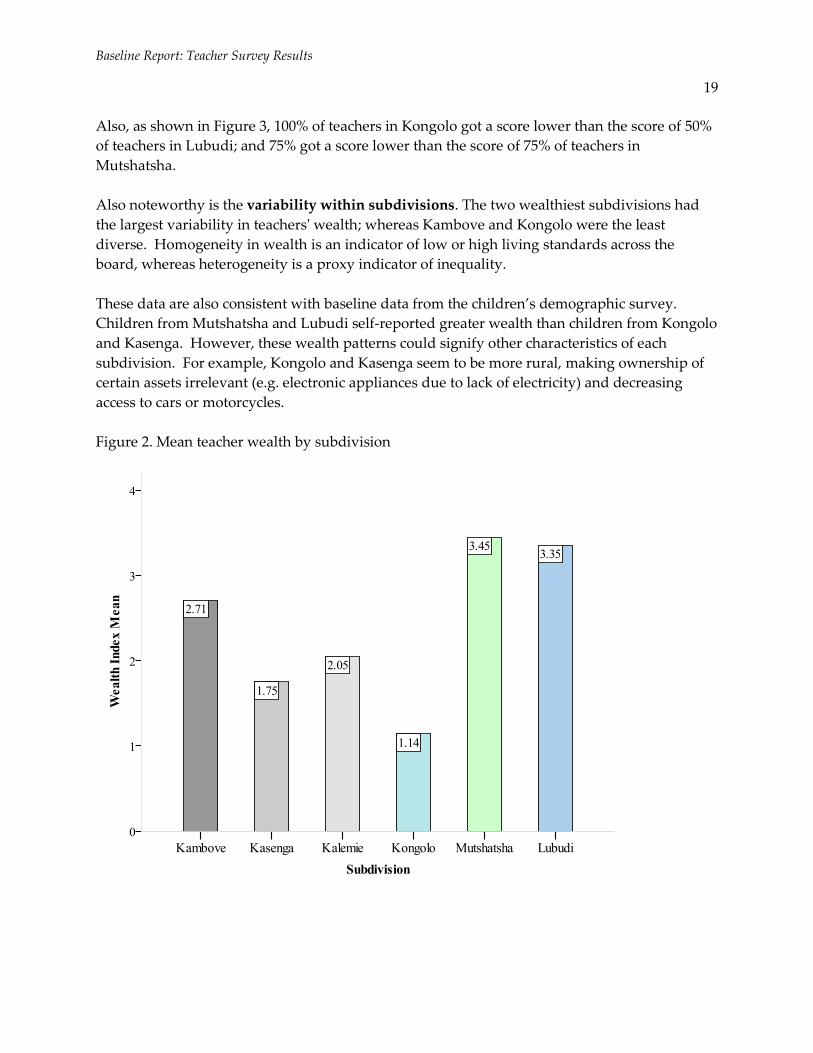
Also, as shown in Figure 3, 100% of teachers in Kongolo got a score lower than the score of 50%
of teachers in Lubudi; and 75% got a score lower than the score of 75% of teachers in
Mutshatsha.
Also noteworthy is the variability within subdivisions. The two wealthiest subdivisions had
the largest variability in teachers' wealth; whereas Kambove and Kongolo were the least
diverse. Homogeneity in wealth is an indicator of low or high living standards across the
board, whereas heterogeneity is a proxy indicator of inequality.
These data are also consistent with baseline data from the children’s demographic survey.
Children from Mutshatsha and Lubudi self-reported greater wealth than children from Kongolo
and Kasenga. However, these wealth patterns could signify other characteristics of each
subdivision. For example, Kongolo and Kasenga seem to be more rural, making ownership of
certain assets irrelevant (e.g. electronic appliances due to lack of electricity) and decreasing
access to cars or motorcycles.
Figure 2. Mean teacher wealth by subdivision
Baseline Report: Teacher Survey Results
20
Figure 3. Variability in teacher wealth by subdivision
How to interpret boxplots:
The box (grey) shows the range of wealth for 50% of teachers.
The horizontal line inside the box is the median wealth (50% of teachers are above this score
and 50% of teachers are below this score).
The lines (or whiskers) coming out of the box on either end show the full range of wealth
scores (the maximum and the minimum).
The line coming from the top of the box represents the top 25%; the line coming from the
bottom of the box represents the bottom 25%.
The “longer” the box and whiskers appear, the more variability is present.
The dots and stars outside of the lines (or whiskers) show outlier scores.
Baseline Report: Teacher Survey Results
21
Salaried employed adults to number of people in the household: The ratio of adults employed to
the total number of people in the household was 0.25, which means that on average there is one
employed adult for every 4 household members. Since the average number of dependent
children was 5.77, it’s likely that the average teacher is the only adult in the house who has
salaried employment.
Physical health: A considerable number of teachers reported their physical health as ‘poor’
(13.8%) or ‘fair’ (36.9%); 41.4% said their health was ‘good’ but only 8% described their physical
health as ‘excellent’. Health problems may affect all aspects of teachers' lives, and may interfere
with their ability to be present at school and perform well in their jobs.
Hunger: Teachers were asked about the frequency with which adults and children in their
household went to bed hungry in the 4 weeks before the survey, an important indicator of
economic deprivation. On average, teachers' answers were nearly identical regarding adults
and children; therefore, this report shows results for children's hunger only.
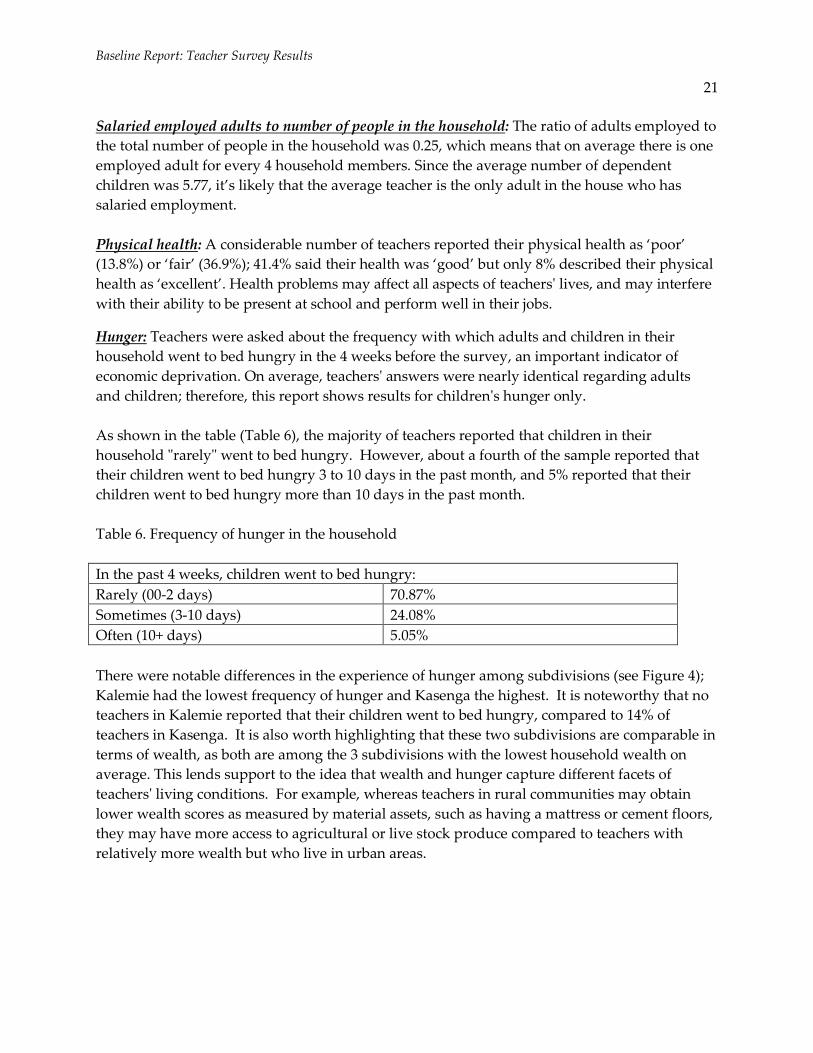
As shown in the table (Table 6), the majority of teachers reported that children in their
household "rarely" went to bed hungry. However, about a fourth of the sample reported that
their children went to bed hungry 3 to 10 days in the past month, and 5% reported that their
children went to bed hungry more than 10 days in the past month.
Table 6. Frequency of hunger in the household
In the past 4 weeks, children went to bed hungry:
Rarely (00-2 days) 70.87%
Sometimes (3-10 days) 24.08%
Often (10+ days) 5.05%
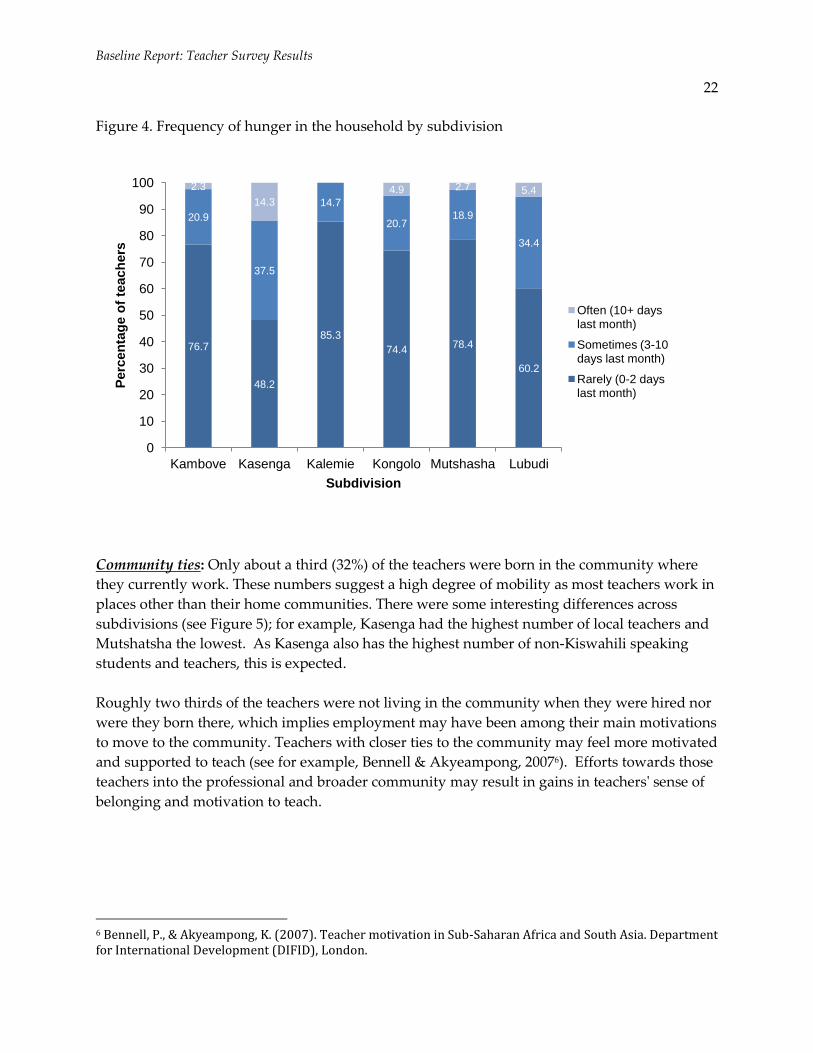
There were notable differences in the experience of hunger among subdivisions (see Figure 4);
Kalemie had the lowest frequency of hunger and Kasenga the highest. It is noteworthy that no
teachers in Kalemie reported that their children went to bed hungry, compared to 14% of
teachers in Kasenga. It is also worth highlighting that these two subdivisions are comparable in
terms of wealth, as both are among the 3 subdivisions with the lowest household wealth on
average. This lends support to the idea that wealth and hunger capture different facets of
teachers' living conditions. For example, whereas teachers in rural communities may obtain
lower wealth scores as measured by material assets, such as having a mattress or cement floors,
they may have more access to agricultural or live stock produce compared to teachers with
relatively more wealth but who live in urban areas.
Baseline Report: Teacher Survey Results
22
Figure 4. Frequency of hunger in the household by subdivision
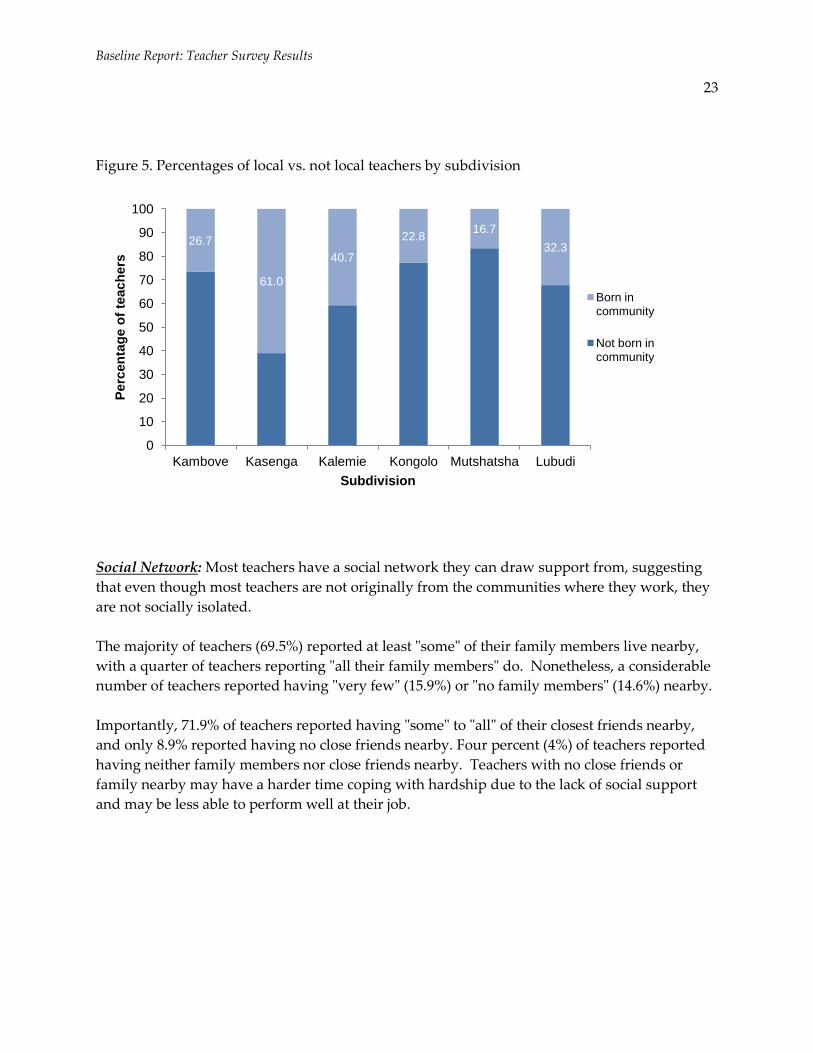
Community ties: Only about a third (32%) of the teachers were born in the community where
they currently work. These numbers suggest a high degree of mobility as most teachers work in
places other than their home communities. There were some interesting differences across
subdivisions (see Figure 5); for example, Kasenga had the highest number of local teachers and
Mutshatsha the lowest. As Kasenga also has the highest number of non-Kiswahili speaking
students and teachers, this is expected.
Roughly two thirds of the teachers were not living in the community when they were hired nor
were they born there, which implies employment may have been among their main motivations
to move to the community. Teachers with closer ties to the community may feel more motivated
and supported to teach (see for example, Bennell & Akyeampong, 20076). Efforts towards those
teachers into the professional and broader community may result in gains in teachers' sense of
belonging and motivation to teach.
6 Bennell, P., & Akyeampong, K. (2007). Teacher motivation in Sub-Saharan Africa and South Asia. Department for International Development (DIFID), London.
76.7
48.2
85.3
74.4 78.4
60.2
20.9
37.5
14.7
20.7 18.9
34.4
2.3
14.3 4.9 2.7 5.4
0
10
20
30
40
50
60
70
80
90
100
Kambove Kasenga Kalemie Kongolo Mutshasha Lubudi
Perc
en
tag
e o
f te
ach
ers
Subdivision
Often (10+ days last month)
Sometimes (3-10 days last month)
Rarely (0-2 days last month)
Baseline Report: Teacher Survey Results
23
Figure 5. Percentages of local vs. not local teachers by subdivision
Social Network: Most teachers have a social network they can draw support from, suggesting
that even though most teachers are not originally from the communities where they work, they
are not socially isolated.
The majority of teachers (69.5%) reported at least "some" of their family members live nearby,
with a quarter of teachers reporting "all their family members" do. Nonetheless, a considerable
number of teachers reported having "very few" (15.9%) or "no family members" (14.6%) nearby.
Importantly, 71.9% of teachers reported having "some" to "all" of their closest friends nearby,
and only 8.9% reported having no close friends nearby. Four percent (4%) of teachers reported
having neither family members nor close friends nearby. Teachers with no close friends or
family nearby may have a harder time coping with hardship due to the lack of social support
and may be less able to perform well at their job.
26.7
61.0
40.7
22.8 16.7
32.3
0
10
20
30
40
50
60
70
80
90
100
Kambove Kasenga Kalemie Kongolo Mutshatsha Lubudi
Perc
en
tag
e o
f te
ach
ers
Subdivision
Born in community
Not born in community
Baseline Report: Teacher Survey Results
24
Teacher Work Conditions
Occupational status: Teachers felt more valued and respected in their local communities than
by DRC citizens outside of their community and government leaders. Almost two thirds of
teachers (59%) felt they were "very" or "fairly" respected by parents and local leaders, while only
35% reported feeling “very” or “fairly” valued by other DRC citizens and leaders. However,
17% of teachers felt "none" to "very little" respect from their own community members; and 40%
of teachers reported feeling they are "very little" or "not" valued by DRC citizens and leaders"
valued.
The positive perceptions about local communities may favor community strategies to influence
teachers' attendance, motivation, and performance. Community engagement strategies to
improve the quality of the school environment may also help increase the degree to which
teachers feel valued by their local community. Nevertheless, these data call for a better
understanding of the factors that influence teachers' perceptions about how valued and
respected they feel. Particularly the perceptions of value and respect from DRC citizens and
government leaders and highlights an area that needs considerable improvement.
Income
Teachers' average monthly income, including income from jobs outside of teaching, was 72,078
CDF (about 79 USD). Given that the annual GDP for the DRC was 300 USD in 2011, the average
teacher annual salary (calculated over 9 months of teaching) is about 2.4 times the average GDP.
In addition, teaching salaries accounted for 97% of teachers’ total income on average. This
percentage remained virtually the same when only teachers who held jobs outside of teaching
were included in the analysis. Only 17% of teachers (about 70 teachers) reported having a paid
job other than teaching in the last year.
The above data suggest that relative to other employment in the DRC, teaching appears to be a
well-paid job. Nonetheless, a study by UNESCO (2009)7 comparing over 20 African countries
shows that the average salary of Congolese teachers is one of the lowest in the region, and it is
the lowest among the countries with comparable levels of GDP per capita (e.g., Burundi and
Ethiopia). In addition, the average monthly household consumption expenditures8 reported by
teachers in our sample was 168,113 CDF (about $182 USD), and the average monthly household
consumption per capita was 27,364 CDF (about $30 USD), indicating that while the average
teachers earns a relatively good income, it covers slightly less than 50% of their monthly
household expenditures.
The implications of these findings are two-fold. On the one hand, since teaching is the only
source of income for most teachers, delays and incomplete salaries may put teachers under
considerable hardship. They may need to pursue non-salaried employment (e.g., farm work) in
7 UNESCO-BREDA. (2009). Universal primary education in Africa: The teacher challenge. Retrieved from
http://unesdoc.unesco.org/images/0018/001866/186643e.pdf on May 2012. 8 Total monthly Household Consumption Expenditures includes questions about rent, food, transportation, etc.
Baseline Report: Teacher Survey Results
25
order to provide for their households, which likely would negatively impact the amount of
time, energy and motivation they have to dedicate to their teaching job as outside salaried
employment would. On the other hand, the reasons why some teachers are taking additional
jobs may not be related to their income. It was interesting to find that on average, teachers who
reported having a job outside of teaching had teaching salaries over the mean for the whole
sample (M=77,653, SD = 47, 385). It would be interesting to know what motivates these teachers
to take on additional jobs.
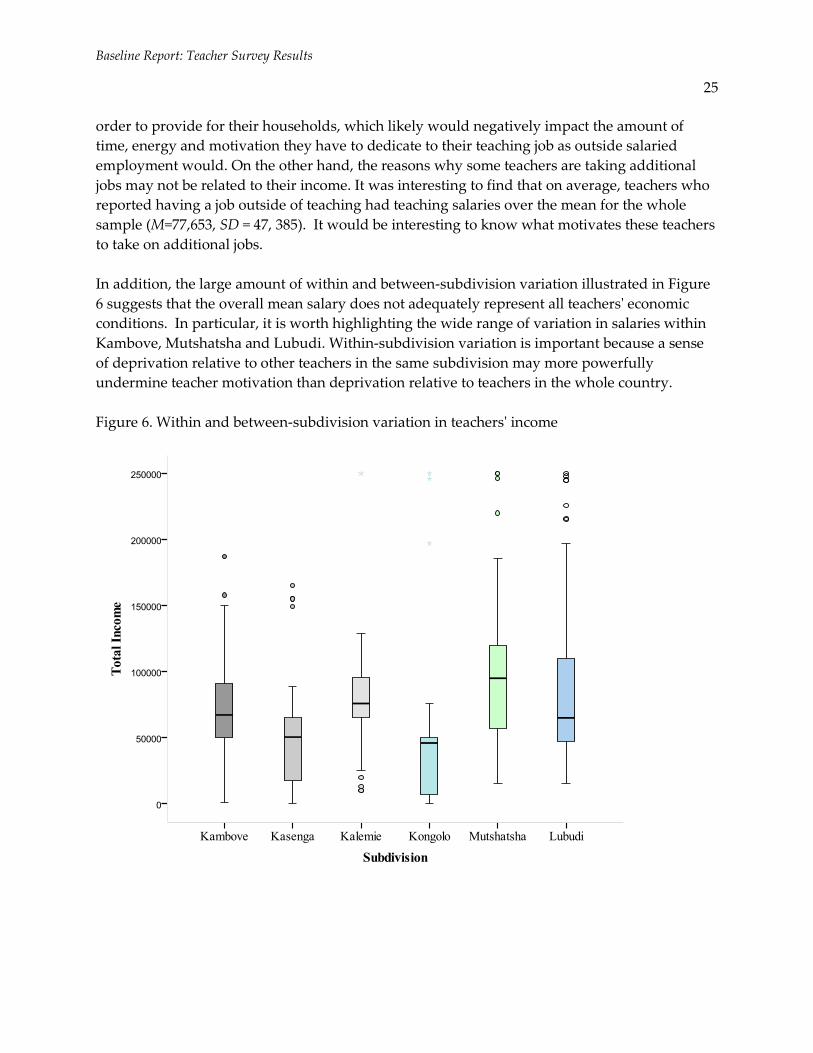
In addition, the large amount of within and between-subdivision variation illustrated in Figure
6 suggests that the overall mean salary does not adequately represent all teachers' economic
conditions. In particular, it is worth highlighting the wide range of variation in salaries within
Kambove, Mutshatsha and Lubudi. Within-subdivision variation is important because a sense
of deprivation relative to other teachers in the same subdivision may more powerfully
undermine teacher motivation than deprivation relative to teachers in the whole country.
Figure 6. Within and between-subdivision variation in teachers' income
Baseline Report: Teacher Survey Results
26
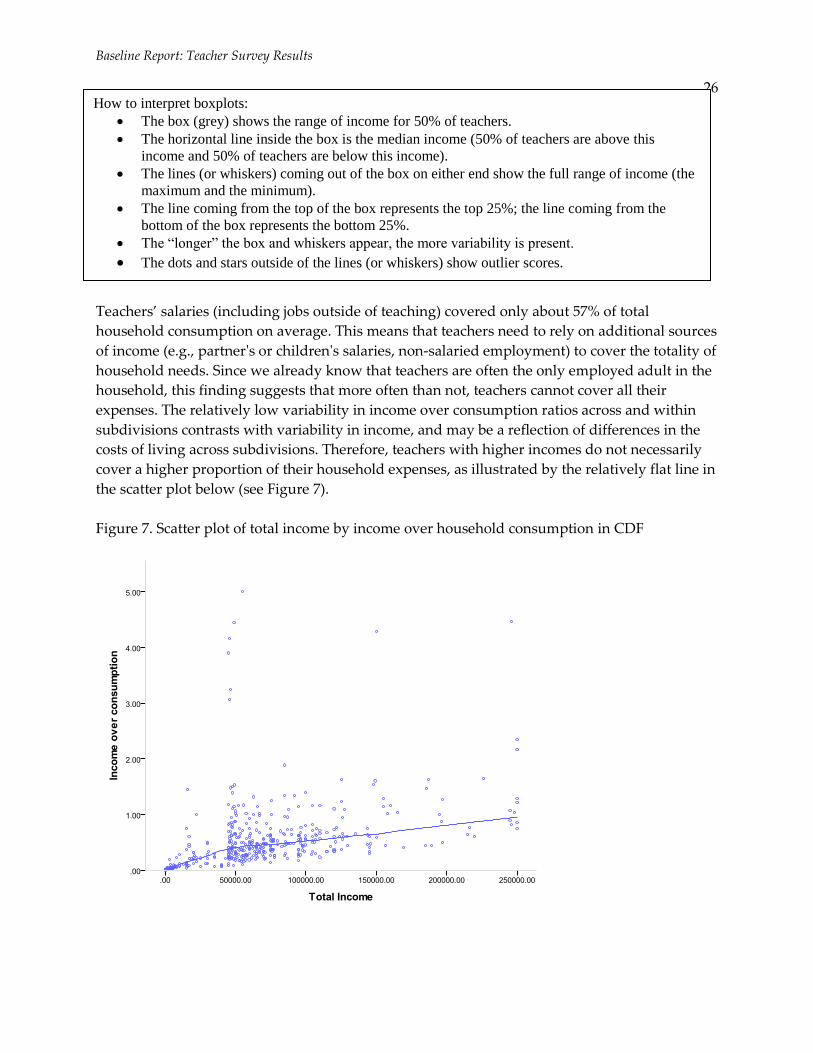
Teachers’ salaries (including jobs outside of teaching) covered only about 57% of total
household consumption on average. This means that teachers need to rely on additional sources
of income (e.g., partner's or children's salaries, non-salaried employment) to cover the totality of
household needs. Since we already know that teachers are often the only employed adult in the
household, this finding suggests that more often than not, teachers cannot cover all their
expenses. The relatively low variability in income over consumption ratios across and within
subdivisions contrasts with variability in income, and may be a reflection of differences in the
costs of living across subdivisions. Therefore, teachers with higher incomes do not necessarily
cover a higher proportion of their household expenses, as illustrated by the relatively flat line in
the scatter plot below (see Figure 7).
Figure 7. Scatter plot of total income by income over household consumption in CDF
How to interpret boxplots:
The box (grey) shows the range of income for 50% of teachers.
The horizontal line inside the box is the median income (50% of teachers are above this
income and 50% of teachers are below this income).
The lines (or whiskers) coming out of the box on either end show the full range of income (the
maximum and the minimum).
The line coming from the top of the box represents the top 25%; the line coming from the
bottom of the box represents the bottom 25%.
The “longer” the box and whiskers appear, the more variability is present.
The dots and stars outside of the lines (or whiskers) show outlier scores.
Baseline Report: Teacher Survey Results
27
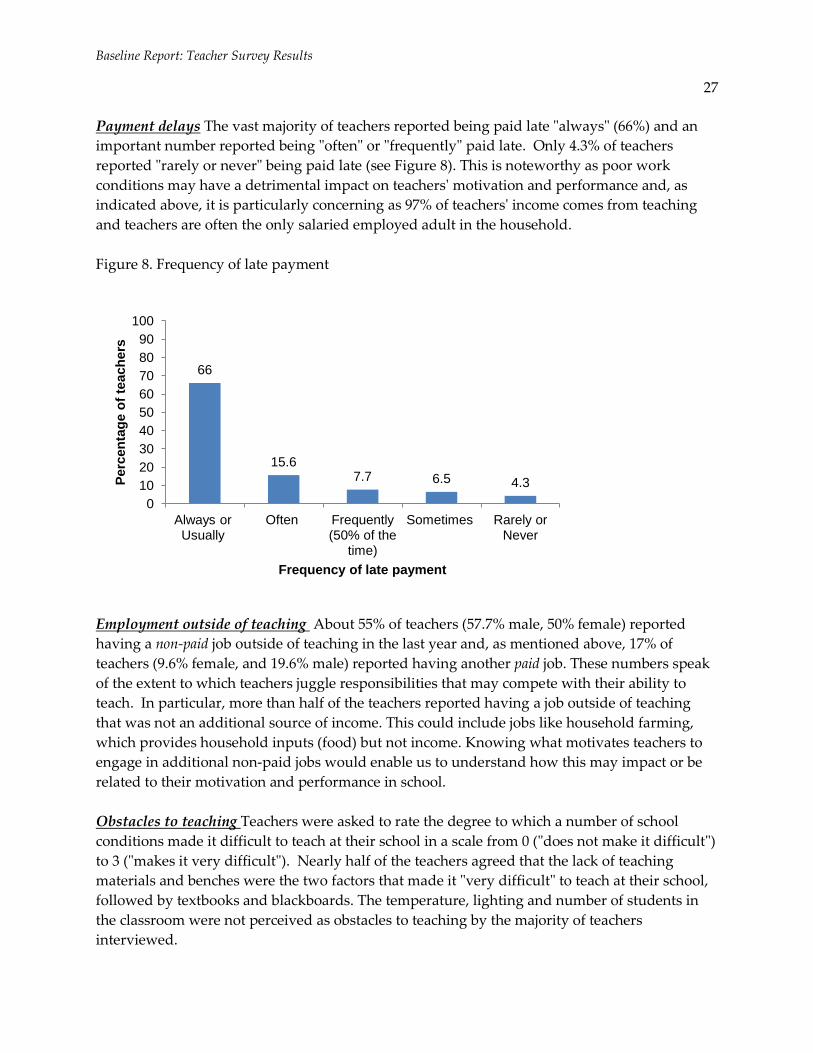
Payment delays The vast majority of teachers reported being paid late "always" (66%) and an
important number reported being "often" or "frequently" paid late. Only 4.3% of teachers
reported "rarely or never" being paid late (see Figure 8). This is noteworthy as poor work
conditions may have a detrimental impact on teachers' motivation and performance and, as
indicated above, it is particularly concerning as 97% of teachers' income comes from teaching
and teachers are often the only salaried employed adult in the household.
Figure 8. Frequency of late payment
Employment outside of teaching About 55% of teachers (57.7% male, 50% female) reported
having a non-paid job outside of teaching in the last year and, as mentioned above, 17% of
teachers (9.6% female, and 19.6% male) reported having another paid job. These numbers speak
of the extent to which teachers juggle responsibilities that may compete with their ability to
teach. In particular, more than half of the teachers reported having a job outside of teaching
that was not an additional source of income. This could include jobs like household farming,
which provides household inputs (food) but not income. Knowing what motivates teachers to
engage in additional non-paid jobs would enable us to understand how this may impact or be
related to their motivation and performance in school.
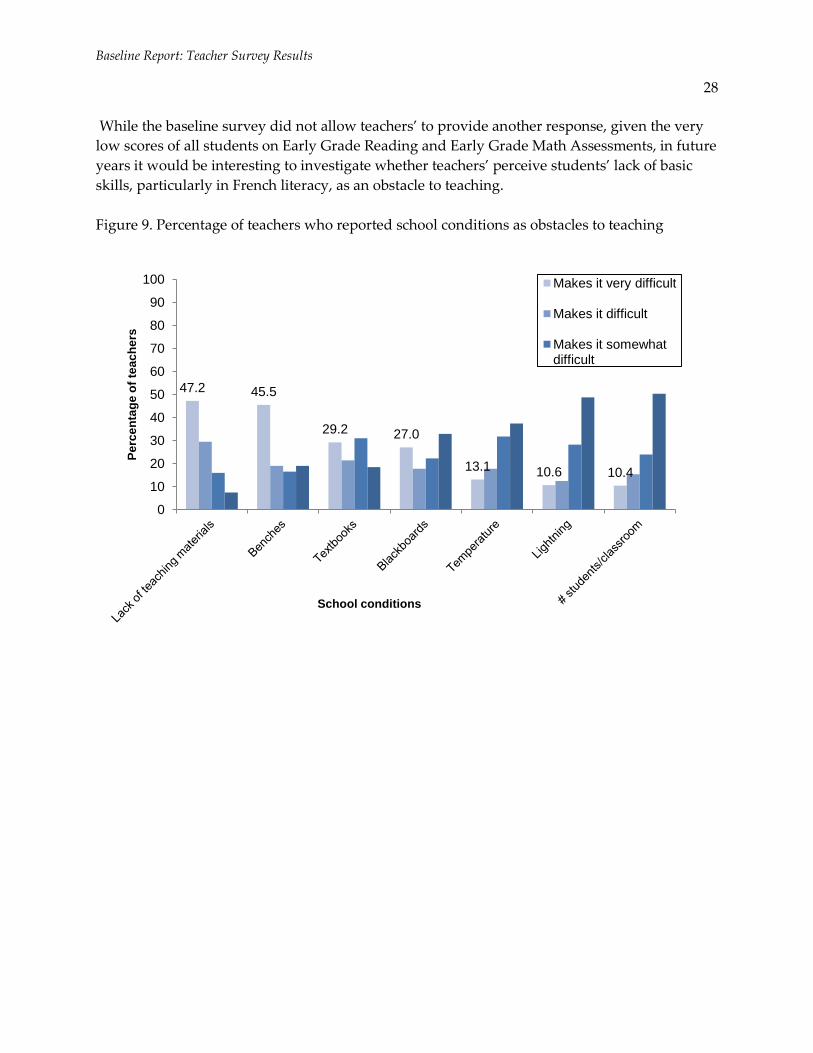
Obstacles to teaching Teachers were asked to rate the degree to which a number of school
conditions made it difficult to teach at their school in a scale from 0 ("does not make it difficult")
to 3 ("makes it very difficult"). Nearly half of the teachers agreed that the lack of teaching
materials and benches were the two factors that made it "very difficult" to teach at their school,
followed by textbooks and blackboards. The temperature, lighting and number of students in
the classroom were not perceived as obstacles to teaching by the majority of teachers
interviewed.
66
15.6 7.7 6.5 4.3
0
10
20
30
40
50
60
70
80
90
100
Always or Usually
Often Frequently (50% of the
time)
Sometimes Rarely or Never
Perc
en
tag
e o
f te
ach
ers
Frequency of late payment
Baseline Report: Teacher Survey Results
28
While the baseline survey did not allow teachers’ to provide another response, given the very
low scores of all students on Early Grade Reading and Early Grade Math Assessments, in future
years it would be interesting to investigate whether teachers’ perceive students’ lack of basic
skills, particularly in French literacy, as an obstacle to teaching.
Figure 9. Percentage of teachers who reported school conditions as obstacles to teaching
47.2 45.5
29.2 27.0
13.1 10.6 10.4
0
10
20
30
40
50
60
70
80
90
100
Pe
rce
nta
ge
of
tea
ch
ers
School conditions
Makes it very difficult
Makes it difficult
Makes it somewhat difficult
Baseline Report: Teacher Survey Results
29
TEACHER MOTIVATION AND WELLBEING
Teachers were asked a series of questions to measure their overall level of motivation and
wellbeing. After preliminary statistical analysis (i.e., Exploratory Factor Analysis, Internal
Reliability), 7 factors were found to be theoretically and statistically sound. These 7 constructs
were measured as follows:
1. Motivation (9 items, α = .80). The questions to measure teachers' motivation and goals were
developed by the NYU team based on the work by Bennell et al., (2007)9, and asked teachers
to rate on a scale of 0 ("completely false") to 3 ("completely true") their level of agreement
with a set of statements such as "I'm highly motivated to help children learn to read and write",
"I'm satisfied with my decision to be a teacher".
2. Criticism of school (4 items, α =.89). Teachers rated on a scale of 0 ("completely false") to 3
("completely true") the extent to which they questioned their school's approach to teaching
and nurturing children's development. For example, they were asked to rate the degree to
which they "Question the school’s approach to teaching reading and writing". The questions were
developed by the NYU team.
3. Job dissatisfaction (4 items, α = .69). This construct was also measured with a series of items
developed by the NYU team. Teachers rated on a scale from 0 ("completely false") to 3
("completely true") the degree to which each of the statements was true for themselves and
for other teachers at their school. The statements were "I want to transfer to another school",
and "I want to leave the teaching profession".
4. Teacher burnout (9 items, α = .73). The nine questions tapping into burnout were taken from
the Maslach Burnout Inventory (1996)10. Teachers used a scale from 0 ("never") to 6 ("every
day") to indicate, for instance, how often they have felt “Mentally drained from their work”, or
“Fatigued when they wake up in the morning”.
5. Personal accomplishment (6 items, α = .67). Teachers were asked about their sense of
personal accomplishment with six questions from Maslach Burnout Inventory (1996)11.
Teachers rated the degree to which they feel that they are "positively influencing other people's
lives" on a scale from 0 ("never") to 6 ("every day").
9 Bennell, P., & Akyeampong, K. (2007). Teacher Motivation in sub-Saharan Africa and South Asia. DFID Educational Paper No. 71. London: DFID. Retrieved from: http://www.dfid.gov.uk/R4D/PDF/Outputs/policystrategy/researchingtheissuesno71.pdf 10 Maslach, C., & Jackson, S.E. (1986). Maslach Burnout Inventory. Palo Alto, CA: Consulting Psychologists Press. 11 Idem.
Baseline Report: Teacher Survey Results
30
6. Teachers' role in children's socio-emotional wellbeing (SEW; 4 items, α = .84). The questions
about teachers’ perception of their role in children's socio-emotional wellbeing come from a
previously validated measure (see Ryan, Gheen, & Midgley, 1998)12, and ask teachers to rate
on a scale of 0 ("strongly disagree") to 4 ("strongly agree") their level of agreement with
statements like “Teachers play an important role not only in their students’ learning, but also in the
way their students feel about themselves and life in general” and “Teachers need to frequently think
about their students’ mental health and wellbeing”.
7. Perceptions of parent support (7 items, α = .74). Questions about teacher’s perceived parent
support were developed by the NYU team and asked teachers to rate on a scale from 0 ("not
at all") to 4 ("quite a lot") the extent to which parents support their work by, for instance,
“Sharing your values about how children should behave in school?” and “Expecting their children to
show respect to you and other teachers?”. Unlike the other 6 constructs, perception of parent
support was used as a predictor instead of an outcome in regression analyses.
12 Ryan, M. A., Gheen, M. H., Midgley, C. (1998) Why do some students avoid asking for help? An examination of the interplay among students'academic efficacy, teachers'social-emotional role, and the classroom goal structure. Journal of Educational Psychology, 90(3), 528-535.
Baseline Report: Teacher Survey Results
31
DESCRIPTIVE RESULTS
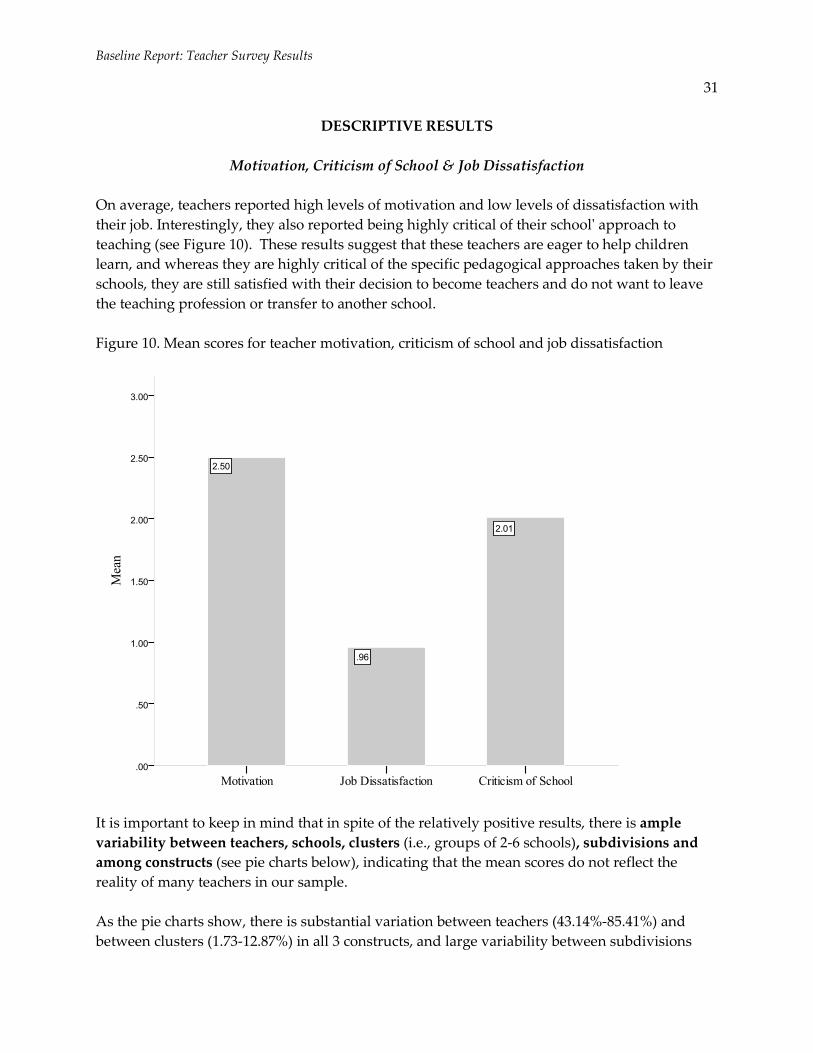
Motivation, Criticism of School & Job Dissatisfaction
On average, teachers reported high levels of motivation and low levels of dissatisfaction with
their job. Interestingly, they also reported being highly critical of their school' approach to
teaching (see Figure 10). These results suggest that these teachers are eager to help children
learn, and whereas they are highly critical of the specific pedagogical approaches taken by their
schools, they are still satisfied with their decision to become teachers and do not want to leave
the teaching profession or transfer to another school.
Figure 10. Mean scores for teacher motivation, criticism of school and job dissatisfaction
It is important to keep in mind that in spite of the relatively positive results, there is ample
variability between teachers, schools, clusters (i.e., groups of 2-6 schools), subdivisions and
among constructs (see pie charts below), indicating that the mean scores do not reflect the
reality of many teachers in our sample.
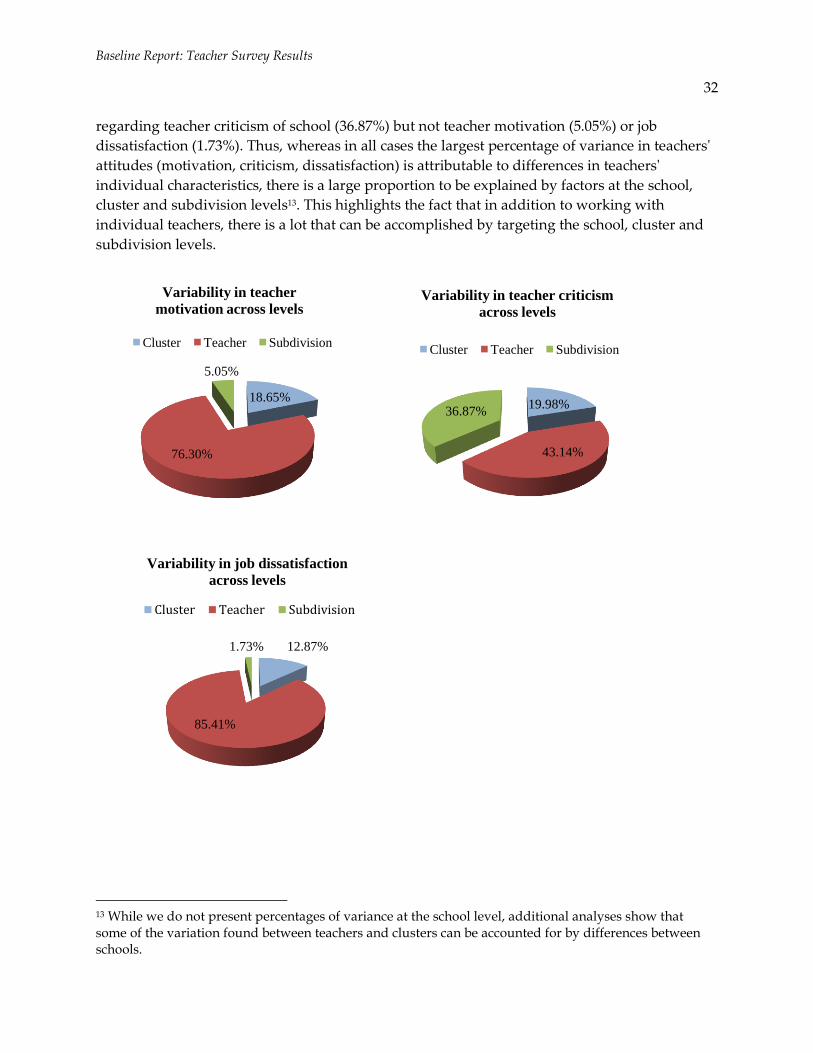
As the pie charts show, there is substantial variation between teachers (43.14%-85.41%) and
between clusters (1.73-12.87%) in all 3 constructs, and large variability between subdivisions
Baseline Report: Teacher Survey Results
32
regarding teacher criticism of school (36.87%) but not teacher motivation (5.05%) or job
dissatisfaction (1.73%). Thus, whereas in all cases the largest percentage of variance in teachers'
attitudes (motivation, criticism, dissatisfaction) is attributable to differences in teachers'
individual characteristics, there is a large proportion to be explained by factors at the school,
cluster and subdivision levels13. This highlights the fact that in addition to working with
individual teachers, there is a lot that can be accomplished by targeting the school, cluster and
subdivision levels.
13 While we do not present percentages of variance at the school level, additional analyses show that some of the variation found between teachers and clusters can be accounted for by differences between schools.
18.65%
76.30%
5.05%
Variability in teacher
motivation across levels
Cluster Teacher Subdivision
19.98%
43.14%
36.87%
Variability in teacher criticism
across levels
Cluster Teacher Subdivision
12.87%
85.41%
1.73%
Variability in job dissatisfaction
across levels
Cluster Teacher Subdivision
Baseline Report: Teacher Survey Results
33
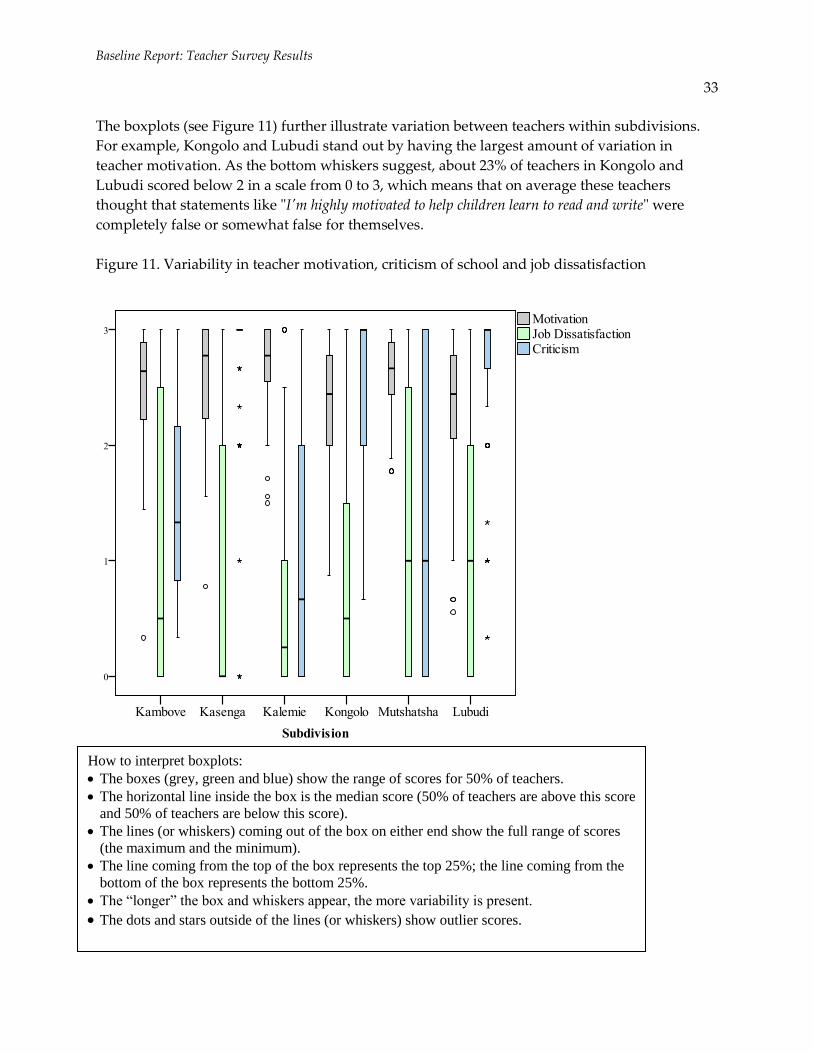
The boxplots (see Figure 11) further illustrate variation between teachers within subdivisions.
For example, Kongolo and Lubudi stand out by having the largest amount of variation in
teacher motivation. As the bottom whiskers suggest, about 23% of teachers in Kongolo and
Lubudi scored below 2 in a scale from 0 to 3, which means that on average these teachers
thought that statements like "I'm highly motivated to help children learn to read and write" were
completely false or somewhat false for themselves.
Figure 11. Variability in teacher motivation, criticism of school and job dissatisfaction
How to interpret boxplots:
The boxes (grey, green and blue) show the range of scores for 50% of teachers.
The horizontal line inside the box is the median score (50% of teachers are above this score
and 50% of teachers are below this score).
The lines (or whiskers) coming out of the box on either end show the full range of scores
(the maximum and the minimum).
The line coming from the top of the box represents the top 25%; the line coming from the
bottom of the box represents the bottom 25%.
The “longer” the box and whiskers appear, the more variability is present.
The dots and stars outside of the lines (or whiskers) show outlier scores.
Baseline Report: Teacher Survey Results
34
Burnout & Personal Accomplishment
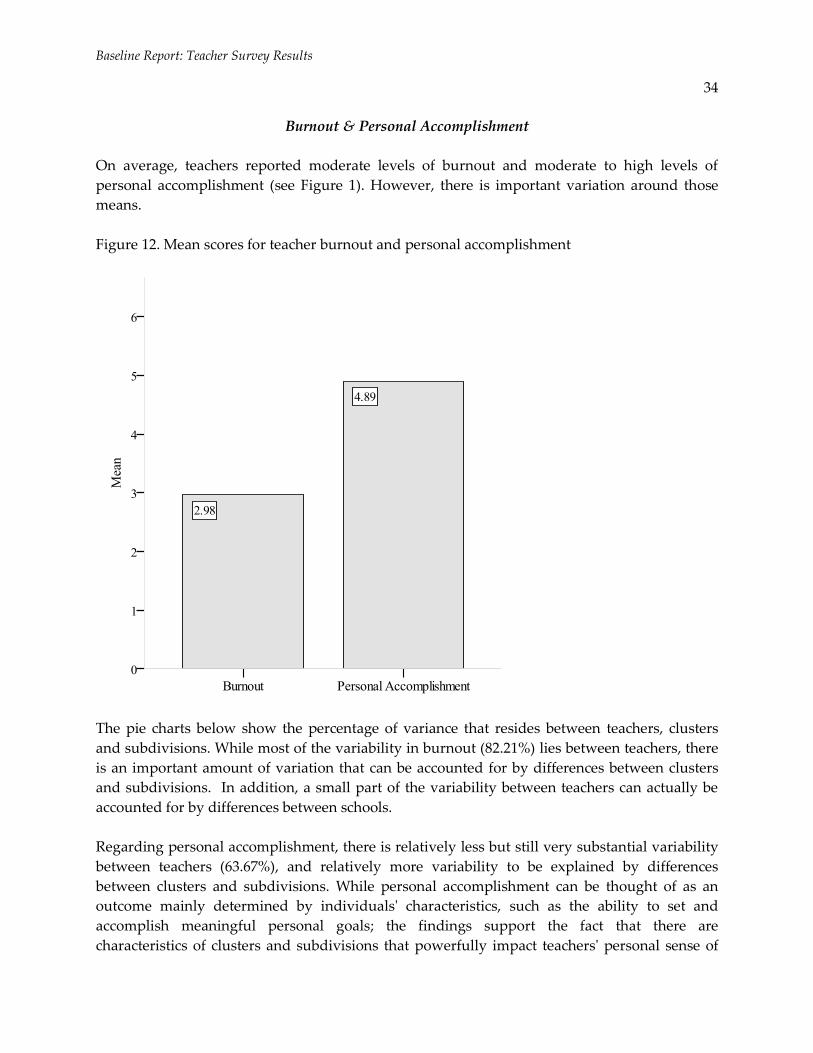
On average, teachers reported moderate levels of burnout and moderate to high levels of
personal accomplishment (see Figure 1). However, there is important variation around those
means.
Figure 12. Mean scores for teacher burnout and personal accomplishment
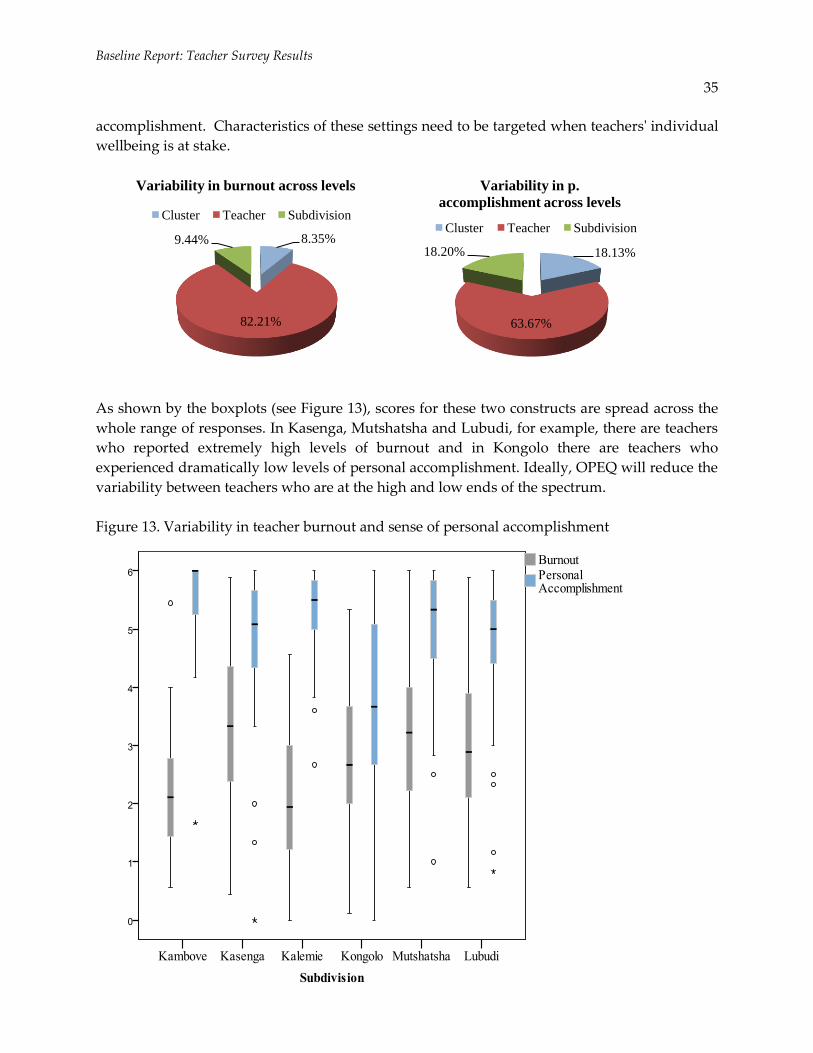
The pie charts below show the percentage of variance that resides between teachers, clusters
and subdivisions. While most of the variability in burnout (82.21%) lies between teachers, there
is an important amount of variation that can be accounted for by differences between clusters
and subdivisions. In addition, a small part of the variability between teachers can actually be
accounted for by differences between schools.
Regarding personal accomplishment, there is relatively less but still very substantial variability
between teachers (63.67%), and relatively more variability to be explained by differences
between clusters and subdivisions. While personal accomplishment can be thought of as an
outcome mainly determined by individuals' characteristics, such as the ability to set and
accomplish meaningful personal goals; the findings support the fact that there are
characteristics of clusters and subdivisions that powerfully impact teachers' personal sense of
Baseline Report: Teacher Survey Results
35
accomplishment. Characteristics of these settings need to be targeted when teachers' individual
wellbeing is at stake.
As shown by the boxplots (see Figure 13), scores for these two constructs are spread across the
whole range of responses. In Kasenga, Mutshatsha and Lubudi, for example, there are teachers
who reported extremely high levels of burnout and in Kongolo there are teachers who
experienced dramatically low levels of personal accomplishment. Ideally, OPEQ will reduce the
variability between teachers who are at the high and low ends of the spectrum.
Figure 13. Variability in teacher burnout and sense of personal accomplishment
8.35%
82.21%
9.44%
Variability in burnout across levels
Cluster Teacher Subdivision
18.13%
63.67%
18.20%
Variability in p.
accomplishment across levels
Cluster Teacher Subdivision
Baseline Report: Teacher Survey Results
36
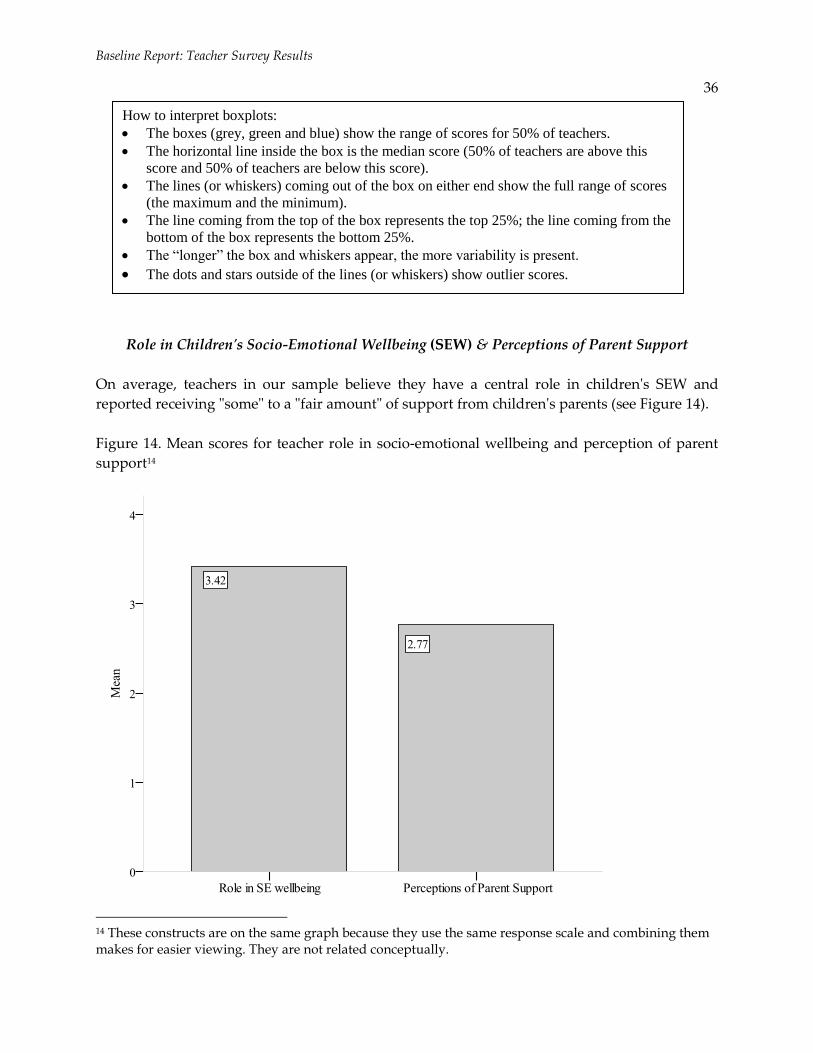
Role in Children's Socio-Emotional Wellbeing (SEW) & Perceptions of Parent Support
On average, teachers in our sample believe they have a central role in children's SEW and
reported receiving "some" to a "fair amount" of support from children's parents (see Figure 14).
Figure 14. Mean scores for teacher role in socio-emotional wellbeing and perception of parent
support14
14 These constructs are on the same graph because they use the same response scale and combining them makes for easier viewing. They are not related conceptually.
How to interpret boxplots:
The boxes (grey, green and blue) show the range of scores for 50% of teachers.
The horizontal line inside the box is the median score (50% of teachers are above this
score and 50% of teachers are below this score).
The lines (or whiskers) coming out of the box on either end show the full range of scores
(the maximum and the minimum).
The line coming from the top of the box represents the top 25%; the line coming from the
bottom of the box represents the bottom 25%.
The “longer” the box and whiskers appear, the more variability is present.
The dots and stars outside of the lines (or whiskers) show outlier scores.
Baseline Report: Teacher Survey Results
37
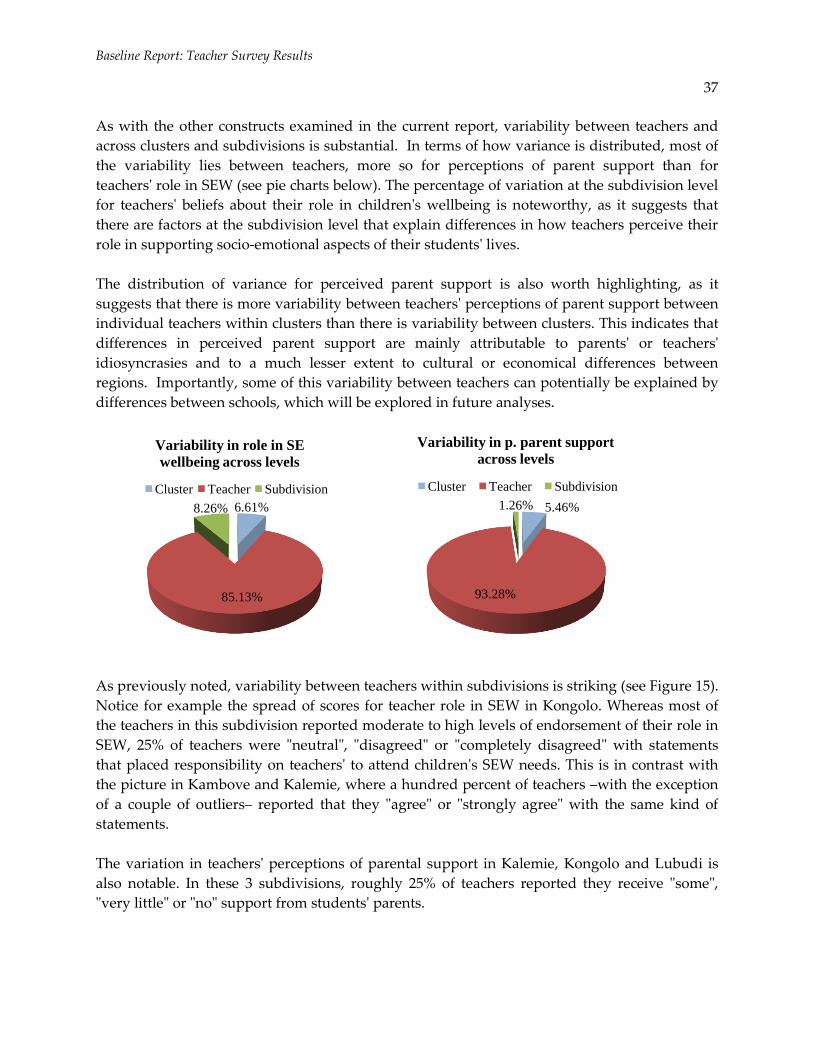
As with the other constructs examined in the current report, variability between teachers and
across clusters and subdivisions is substantial. In terms of how variance is distributed, most of
the variability lies between teachers, more so for perceptions of parent support than for
teachers' role in SEW (see pie charts below). The percentage of variation at the subdivision level
for teachers' beliefs about their role in children's wellbeing is noteworthy, as it suggests that
there are factors at the subdivision level that explain differences in how teachers perceive their
role in supporting socio-emotional aspects of their students' lives.
The distribution of variance for perceived parent support is also worth highlighting, as it
suggests that there is more variability between teachers' perceptions of parent support between
individual teachers within clusters than there is variability between clusters. This indicates that
differences in perceived parent support are mainly attributable to parents' or teachers'
idiosyncrasies and to a much lesser extent to cultural or economical differences between
regions. Importantly, some of this variability between teachers can potentially be explained by
differences between schools, which will be explored in future analyses.
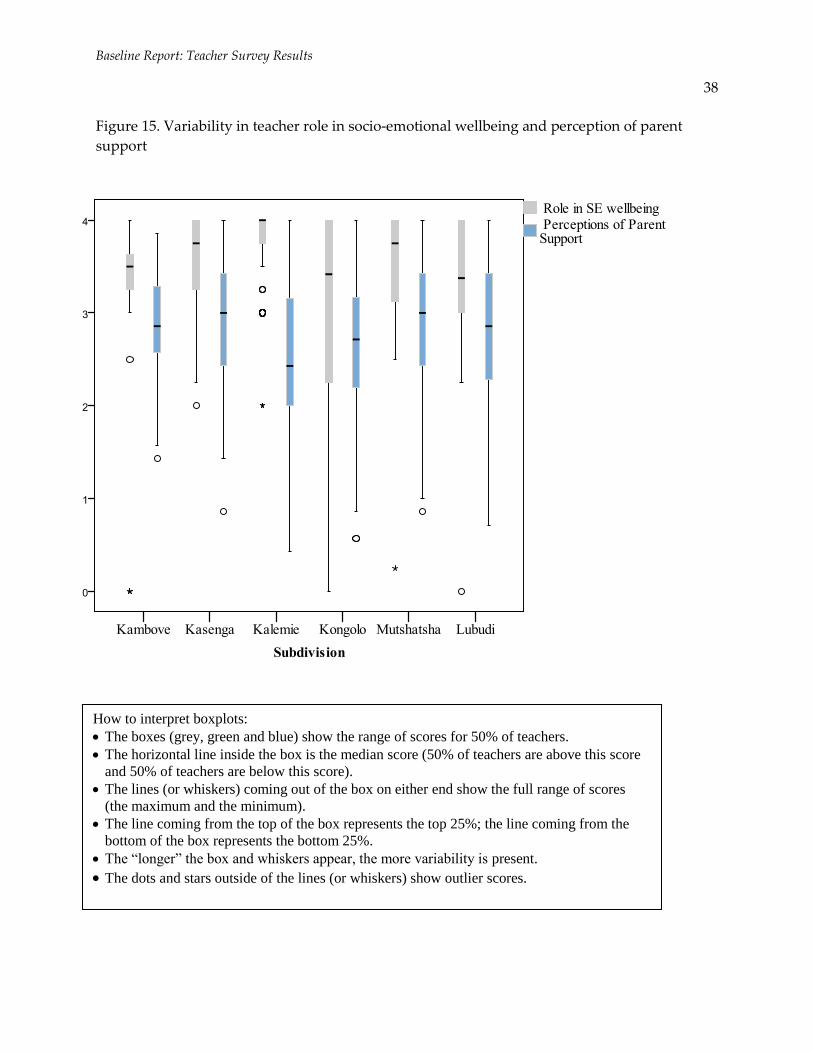
As previously noted, variability between teachers within subdivisions is striking (see Figure 15).
Notice for example the spread of scores for teacher role in SEW in Kongolo. Whereas most of
the teachers in this subdivision reported moderate to high levels of endorsement of their role in
SEW, 25% of teachers were "neutral", "disagreed" or "completely disagreed" with statements
that placed responsibility on teachers' to attend children's SEW needs. This is in contrast with
the picture in Kambove and Kalemie, where a hundred percent of teachers –with the exception
of a couple of outliers– reported that they "agree" or "strongly agree" with the same kind of
statements.
The variation in teachers' perceptions of parental support in Kalemie, Kongolo and Lubudi is
also notable. In these 3 subdivisions, roughly 25% of teachers reported they receive "some",
"very little" or "no" support from students' parents.
6.61%
85.13%
8.26%
Variability in role in SE
wellbeing across levels
Cluster Teacher Subdivision
5.46%
93.28%
1.26%
Variability in p. parent support
across levels
Cluster Teacher Subdivision
Baseline Report: Teacher Survey Results
38
Figure 15. Variability in teacher role in socio-emotional wellbeing and perception of parent
support
How to interpret boxplots:
The boxes (grey, green and blue) show the range of scores for 50% of teachers.
The horizontal line inside the box is the median score (50% of teachers are above this score
and 50% of teachers are below this score).
The lines (or whiskers) coming out of the box on either end show the full range of scores
(the maximum and the minimum).
The line coming from the top of the box represents the top 25%; the line coming from the
bottom of the box represents the bottom 25%.
The “longer” the box and whiskers appear, the more variability is present.
The dots and stars outside of the lines (or whiskers) show outlier scores.
39
REGRESSION ANALYSES
Introduction
Multi-level models were fitted in HLM (V. 6.06, Raudenbush & Bryk, 2002) to explore the
associations between teacher personal characteristics and living conditions and teacher
outcomes (e.g., motivation, burnout, job dissatisfaction).
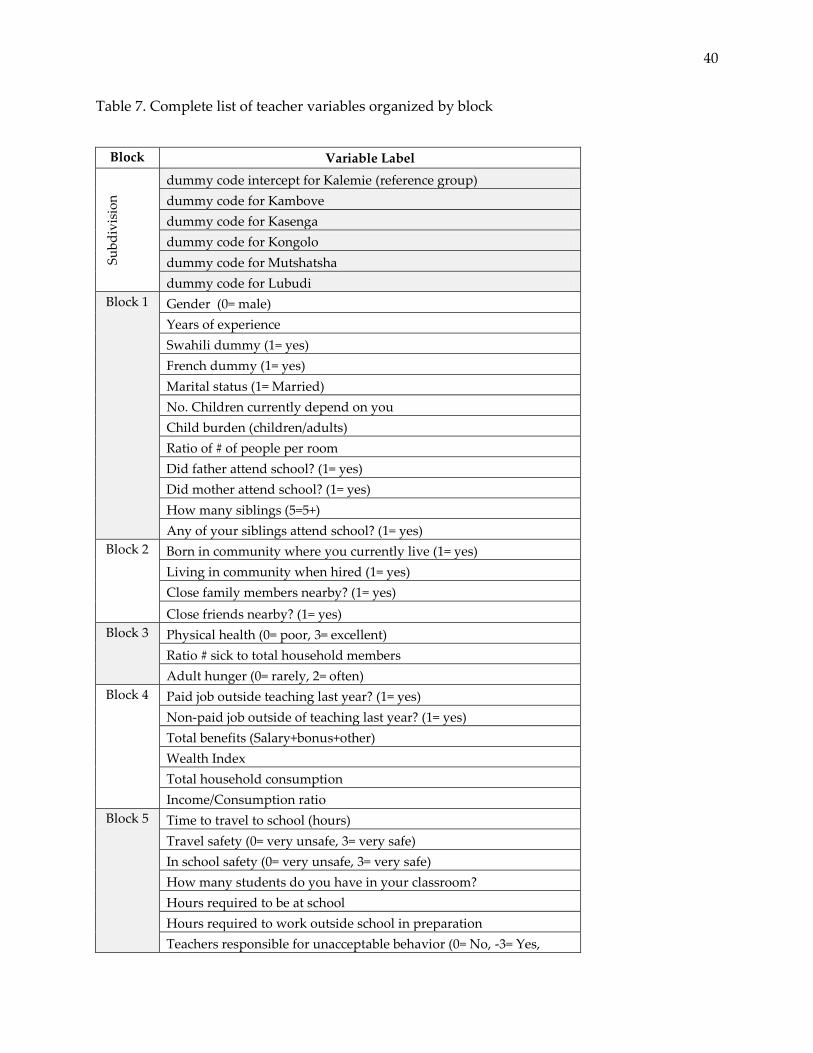
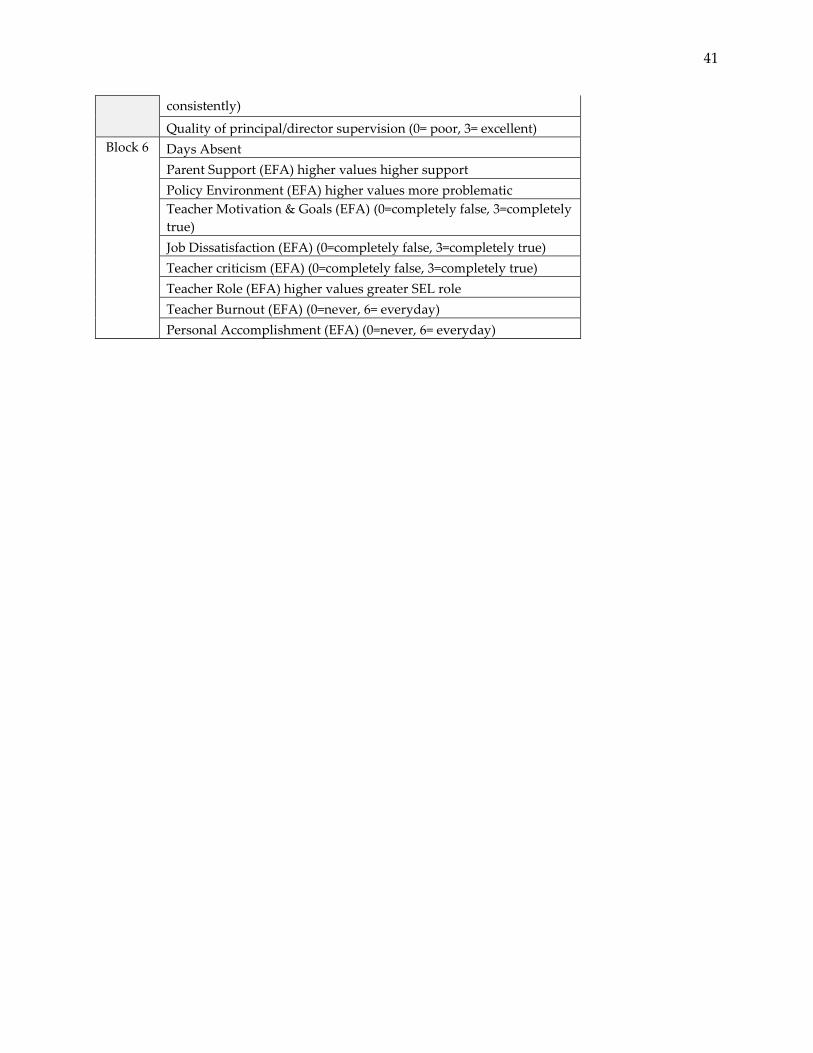
Teacher characteristics, were grouped in blocks of variables (see Table 7) hypothesized to be
conceptually related. Analyses were run entering one block at a time, and then stacking blocks
(1 and 2, 1, 2 and 3 and so on) starting with those thought to be more permanent characteristics
(e.g., gender, age) and ending with those more directly related to teachers' experiences in school
(e.g., time to travel to school and class size). This analytic strategy allows us to get a sense of the
association of each block and the outcome when the variance shared with variables in other
blocks is, or is not, adjusted for.
Dummies15 for all subdivisions (with Kalemie as the reference group) were included at the
cluster level to adjust for differences between these geographical units. This means that all
results should be interpreted net of differences between subdivisions. In other words, since
Kalemie is the reference group, the intercept represents the mean for Kalemie and coefficients
for all predictors represent the estimated increase in the score relative to that mean.
Also, in this report we describe results from models in which the shared variance between all
variables is adjusted for (i.e., all blocks simultaneously entered), but mention results from other
models when needed. That means that for most of the models summarized in this report, the
association between a particular variable and the outcome represents the unique contribution
of that variable to the prediction of the outcome, net of the association between that variable
and other variables included in the model.
15 Dummy variables are commonly used in regression analysis when dealing with categorical or nominal information, of the sort of subdivisions, race or gender. To include information on 3 race groups in a regression analyses, for example, we create 3 dummy variables where (1) Black = 1, Not Black = 0, (2) Asian = 1, Not Asian = 0, and (3) White = 1, Not White = 0. When fitting the model, we exclude one of the three variables to avoid redundancy, and the excluded group becomes the reference. Thus, if we exclude Black, the regression coefficients for Asian and White will represent the increase in the outcome for Asians and Whites relative to Blacks, but if we exclude Asian, the coefficients will represent the increase in the scores for the other two groups compared to Asians.
40
Table 7. Complete list of teacher variables organized by block
Block Variable Label
Su
bd
ivis
ion
dummy code intercept for Kalemie (reference group)
dummy code for Kambove
dummy code for Kasenga
dummy code for Kongolo
dummy code for Mutshatsha
dummy code for Lubudi
Block 1 Gender (0= male)
Years of experience
Swahili dummy (1= yes)
French dummy (1= yes)
Marital status (1= Married)
No. Children currently depend on you
Child burden (children/adults)
Ratio of # of people per room
Did father attend school? (1= yes)
Did mother attend school? (1= yes)
How many siblings (5=5+)
Any of your siblings attend school? (1= yes)
Block 2 Born in community where you currently live (1= yes)
Living in community when hired (1= yes)
Close family members nearby? (1= yes)
Close friends nearby? (1= yes)
Block 3 Physical health (0= poor, 3= excellent)
Ratio # sick to total household members
Adult hunger (0= rarely, 2= often)
Block 4 Paid job outside teaching last year? (1= yes)
Non-paid job outside of teaching last year? (1= yes)
Total benefits (Salary+bonus+other)
Wealth Index
Total household consumption
Income/Consumption ratio
Block 5 Time to travel to school (hours)
Travel safety (0= very unsafe, 3= very safe)
In school safety (0= very unsafe, 3= very safe)
How many students do you have in your classroom?
Hours required to be at school
Hours required to work outside school in preparation
Teachers responsible for unacceptable behavior (0= No, -3= Yes,
41
consistently)
Quality of principal/director supervision (0= poor, 3= excellent)
Block 6 Days Absent
Parent Support (EFA) higher values higher support
Policy Environment (EFA) higher values more problematic
Teacher Motivation & Goals (EFA) (0=completely false, 3=completely
true)
Job Dissatisfaction (EFA) (0=completely false, 3=completely true)
Teacher criticism (EFA) (0=completely false, 3=completely true)
Teacher Role (EFA) higher values greater SEL role
Teacher Burnout (EFA) (0=never, 6= everyday)
Personal Accomplishment (EFA) (0=never, 6= everyday)
42
MAIN RESULTS
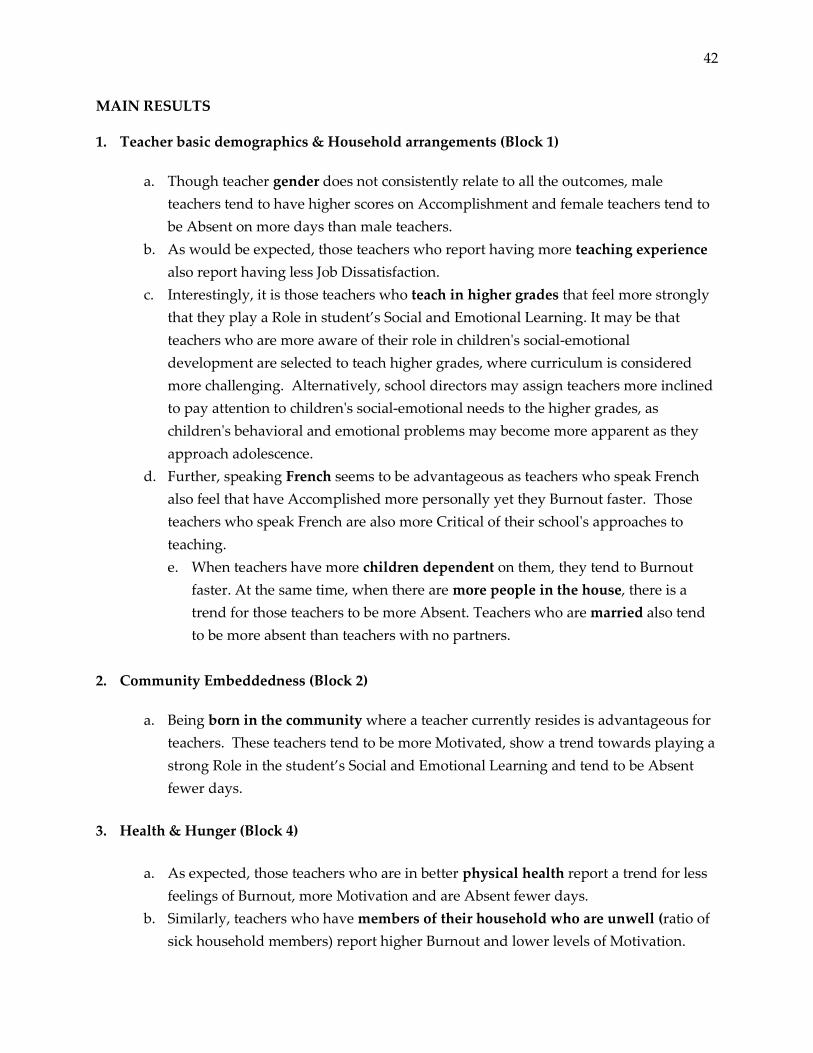
1. Teacher basic demographics & Household arrangements (Block 1)
a. Though teacher gender does not consistently relate to all the outcomes, male
teachers tend to have higher scores on Accomplishment and female teachers tend to
be Absent on more days than male teachers.
b. As would be expected, those teachers who report having more teaching experience
also report having less Job Dissatisfaction.
c. Interestingly, it is those teachers who teach in higher grades that feel more strongly
that they play a Role in student’s Social and Emotional Learning. It may be that
teachers who are more aware of their role in children's social-emotional
development are selected to teach higher grades, where curriculum is considered
more challenging. Alternatively, school directors may assign teachers more inclined
to pay attention to children's social-emotional needs to the higher grades, as
children's behavioral and emotional problems may become more apparent as they
approach adolescence.
d. Further, speaking French seems to be advantageous as teachers who speak French
also feel that have Accomplished more personally yet they Burnout faster. Those
teachers who speak French are also more Critical of their school's approaches to
teaching.
e. When teachers have more children dependent on them, they tend to Burnout
faster. At the same time, when there are more people in the house, there is a
trend for those teachers to be more Absent. Teachers who are married also tend
to be more absent than teachers with no partners.
2. Community Embeddedness (Block 2)
a. Being born in the community where a teacher currently resides is advantageous for
teachers. These teachers tend to be more Motivated, show a trend towards playing a
strong Role in the student’s Social and Emotional Learning and tend to be Absent
fewer days.
3. Health & Hunger (Block 4)
a. As expected, those teachers who are in better physical health report a trend for less
feelings of Burnout, more Motivation and are Absent fewer days.
b. Similarly, teachers who have members of their household who are unwell (ratio of
sick household members) report higher Burnout and lower levels of Motivation.
43
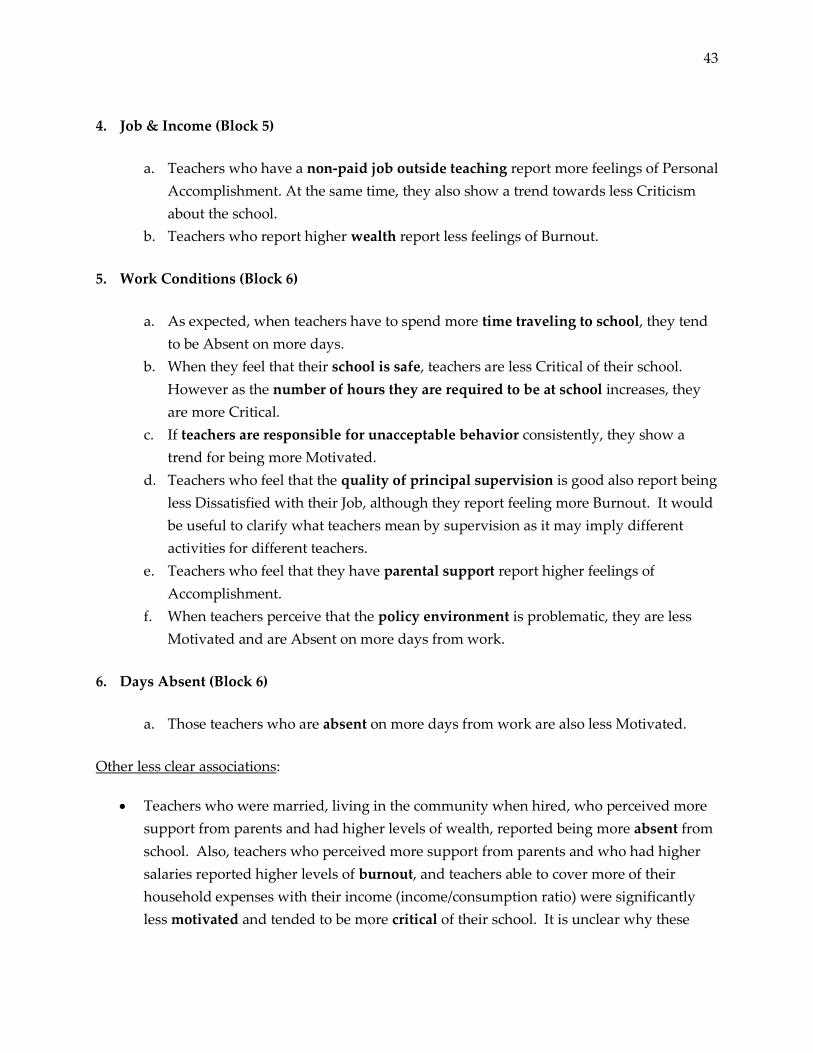
4. Job & Income (Block 5)
a. Teachers who have a non-paid job outside teaching report more feelings of Personal
Accomplishment. At the same time, they also show a trend towards less Criticism
about the school.
b. Teachers who report higher wealth report less feelings of Burnout.
5. Work Conditions (Block 6)
a. As expected, when teachers have to spend more time traveling to school, they tend
to be Absent on more days.
b. When they feel that their school is safe, teachers are less Critical of their school.
However as the number of hours they are required to be at school increases, they
are more Critical.
c. If teachers are responsible for unacceptable behavior consistently, they show a
trend for being more Motivated.
d. Teachers who feel that the quality of principal supervision is good also report being
less Dissatisfied with their Job, although they report feeling more Burnout. It would
be useful to clarify what teachers mean by supervision as it may imply different
activities for different teachers.
e. Teachers who feel that they have parental support report higher feelings of
Accomplishment.
f. When teachers perceive that the policy environment is problematic, they are less
Motivated and are Absent on more days from work.
6. Days Absent (Block 6)
a. Those teachers who are absent on more days from work are also less Motivated.
Other less clear associations:
Teachers who were married, living in the community when hired, who perceived more
support from parents and had higher levels of wealth, reported being more absent from
school. Also, teachers who perceived more support from parents and who had higher
salaries reported higher levels of burnout, and teachers able to cover more of their
household expenses with their income (income/consumption ratio) were significantly
less motivated and tended to be more critical of their school. It is unclear why these
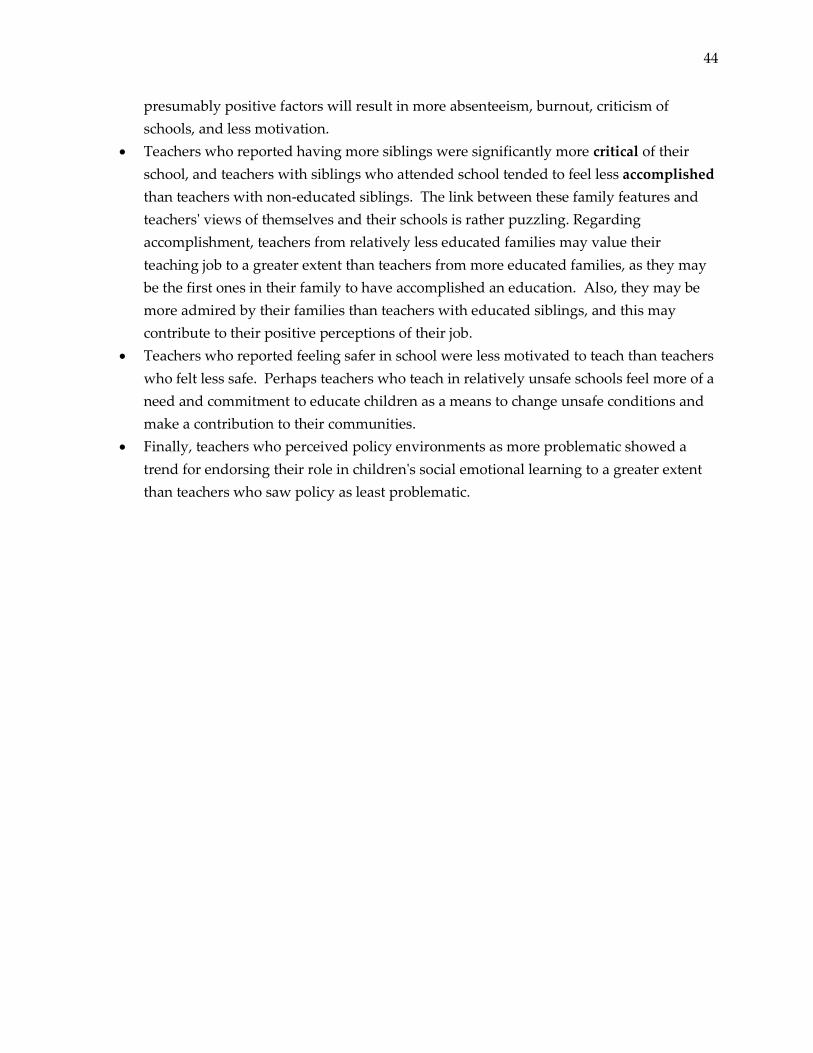
44
presumably positive factors will result in more absenteeism, burnout, criticism of
schools, and less motivation.
Teachers who reported having more siblings were significantly more critical of their
school, and teachers with siblings who attended school tended to feel less accomplished
than teachers with non-educated siblings. The link between these family features and
teachers' views of themselves and their schools is rather puzzling. Regarding
accomplishment, teachers from relatively less educated families may value their
teaching job to a greater extent than teachers from more educated families, as they may
be the first ones in their family to have accomplished an education. Also, they may be
more admired by their families than teachers with educated siblings, and this may
contribute to their positive perceptions of their job.
Teachers who reported feeling safer in school were less motivated to teach than teachers
who felt less safe. Perhaps teachers who teach in relatively unsafe schools feel more of a
need and commitment to educate children as a means to change unsafe conditions and
make a contribution to their communities.
Finally, teachers who perceived policy environments as more problematic showed a
trend for endorsing their role in children's social emotional learning to a greater extent
than teachers who saw policy as least problematic.
45
CONCLUSIONS AND RECOMMENDATIONS
Notwithstanding significant variation between teachers, our results show that on average,
teachers in Katanga report being motivated to help children learn and grow, are fairly satisfied
with their job and feel that their work is meaningful. These positive attitudes can be used to the
advantage of programs like OPEQ, inasmuch as they can serve to engage and maintain teachers'
interest in learning new techniques and contents, both of which take effort and perseverance,
particularly as OPEQ does not provide monetary or in-kind compensation for time spent in
these activities.
In spite of the overall favorable picture, the wide variation between teachers has significant
implications. As expected, some of this variation can be explained by teachers' living and work
conditions. Our descriptive analyses corroborate that many teachers in this region may face
considerable hardship as a result of late and insufficient payments. Economic hardship is
associated with a multitude of problems, such as poor personal and family health, household
overcrowding, higher child burden and hunger, all of which can take a toll on teachers' mental
health (e.g., burnout, sense of accomplishment), and as suggested by our results, on teachers'
motivation and job satisfaction. The OPEQ project does not address any of these factors;
although school improvement plans and COPAs or CGSEs could choose to provide financial
compensation to show teacher appreciation. This could mean that the effect of the OPEQ project
will be muted due to economic hardship.
There were also factors at the school level, such as accountability and the quality of supervision
provided by school directors, that were associated with teachers' motivation and level of job
satisfaction. Our results suggest that improvements in these aspects of school culture can result
in improvements in teachers' motivation and satisfaction. As the OPEQ project specifically aims
to improve the quality of supervision provided by school directors, we could expect to see
improvements in teacher motivation and satisfaction.
Interestingly, whereas teachers report feeling accomplished, motivated and satisfied, they also
report being highly critical of their schools' approach to teaching academics and supporting
children's social-emotional development. Given children's low performance in the EGRA and
EGMA tests (see Torrente et al., 2011), discontent with the current state of affairs may be
positive, in the sense that it may facilitate teachers' receptiveness to programs like OPEQ.
Listening to teachers' opinions about practices and policies that are not working is warranted, as
they are closer to children and may have valuable insights about how to improve learning
conditions that fit the context.
Finally, it is important to keep in mind that while motivation and its correlates favor
performance, they do not guarantee it. Other conditions must be in place for teachers to
translate positive attitudes into effective teaching practices. Impact analysis of the OPEQ
evaluation will help determine whether the OPEQ revised curricula and in-service teacher
training and coaching system have a positive effect on teacher performance.