opportunities for lean enterprise in public regional
TRANSCRIPT
Cleveland State University Cleveland State University
EngagedScholarship@CSU EngagedScholarship@CSU
ETD Archive
2010
Opportunities for Lean Enterprise in Public Regional Opportunities for Lean Enterprise in Public Regional
Transportation Transportation
Levent Baykut Cleveland State University
Follow this and additional works at: https://engagedscholarship.csuohio.edu/etdarchive
Part of the Mechanical Engineering Commons
How does access to this work benefit you? Let us know! How does access to this work benefit you? Let us know!
Recommended Citation Recommended Citation Baykut, Levent, "Opportunities for Lean Enterprise in Public Regional Transportation" (2010). ETD Archive. 757. https://engagedscholarship.csuohio.edu/etdarchive/757
This Thesis is brought to you for free and open access by EngagedScholarship@CSU. It has been accepted for inclusion in ETD Archive by an authorized administrator of EngagedScholarship@CSU. For more information, please contact [email protected].

OPPORTUNITIES FOR LEAN ENTERPRISE IN PUBLIC REGIONAL
TRANSPORTATION
LEVENT BAYKUT
Bachelor of Science in Physics
Kocaeli University, Kocaeli, Turkey
June, 2007
submitted in partial fulfillment of requirements for the degree
MASTER OF SCIENCE IN INDUSTRIAL ENGINEERING
at the
CLEVELAND STATE UNIVERSITY
July, 2010
This Thesis has been approved for the Department of Mechanical Engineering
and the college of Graduate Studies by
____________________________________________________ Thesis Chairperson, Professor M. Brian Thomas, P.E.
Mechanical Engineering /
____________________________________________________
Professor L. Ken Keys
Mechanical Engineering /
____________________________________________________
Professor Taysir H. Nayfeh
Mechanical Engineering /
____________________________________________________
Adjunct Professor John Van Blargan
Mechanical Engineering /

To my parents Kadir Turhan and Gülden Baykut, and my twin brother Mert Baykut.

ACKNOWLEDGEMENT
I am extending my most sincere appreciation to my thesis advisor Dr. M. Brian
Thomas. Without his supervision and assistance, this thesis could never be completed. I
am also thankful for my committee members‟, Dr. Taysir H. Nayfeh, Dr. L. Ken Keys,
and Dr. John Van Blargan, guidance. Their assistance brought this thesis to a very good
level.
RTA personnel were also very helpful throughout the implementation process.
Rick Levi, Jose Clayton, and Kevin Stanley played a significant role at this thesis.
My office mates Dr. Sagar Gadgari and Dr. Renjun Bao were kind enough to let
me benefit from their experience in industrial engineering.
Charles N. Berry guided me with his deep life experience at the frustrated times.
He contributed this thesis in a very unique way.
My twin brother, Mert Baykut, always believed in me and supported me day and
night. He sure is the best brother in the world.
Last but not least, my utmost gratitude goes to my parents. My father, Kadir
Turhan Baykut, and mother, Gülden Baykut, supported me tremendously in every
possible way. I am very thankful and lucky to have such a great family.

v
OPPORTUNITIES FOR LEAN ENTERPRISE IN PUBLIC REGIONAL
TRANSPORTATION
LEVENT BAYKUT
ABSTRACT
This thesis demonstrates the application of Lean Enterprise principles in a
unionized/government-subsidized environment. This study states that Lean cannot be
fully implemented in such an environment. The work environment and organization‟s
culture required a hybrid system to maximize the process efficiency. Lean production is
a manufacturing philosophy that focuses on adding value for the customer. It is
commonly accepted that Lean is applicable to almost any repetitive process in any kind
of organization, including government agencies and unionized work environments.
The objective of this thesis was to research the opportunities and applicability for
Lean Enterprise in public transportation. During the implementation a hybrid production
system, consisting of Lean and systems engineering tools, is realized and integrated
instead of a pure Lean system. This thesis details the implementation of Lean in the
Greater Cleveland Regional Transit Authority‟s bus maintenance facility, and presents
the results of the transformation. The possible future state is proposed by the aid of
Arena simulation software and statistical analysis.

vi
TABLE OF CONTENTS
Page ABSTRACT ........................................................................................................................ v
LIST OF TABLES ............................................................................................................ vii
LIST OF FIGURES ......................................................................................................... viii
CHAPTER
I. INTRODUCTION ...................................................................................................... 1
1.1 Motivation .......................................................................................................... 1
1.2 History of Lean Production System ................................................................... 2
1.3 Lean Philosophy and Culture ............................................................................. 4
1.4 Lean Tools ......................................................................................................... 7
1.5 Lean Metrics .................................................................................................... 13
1.6 Case Studies ..................................................................................................... 14
II. WORK ENVIRONMENT AND PROJECT FOCUS AT RTA‟S
CENTRAL BUS MAINTENANCE FACILITY ..................................................... 16
2.1 Project Focus.................................................................................................... 16
2.2 Work Environment .......................................................................................... 17
III. LEAN IMPLEMENTATION ................................................................................ 23
3.1 Process Observation ......................................................................................... 23
3.2 Lean Implementation to Engine Rebuild Department ..................................... 25
IV. STATISTICAL ANALYSIS AND SIMULATION .............................................. 42
4.1 Statistical Analysis ........................................................................................... 42
4.2 System Simulation ........................................................................................... 45
4.2.1 Simulation Model .................................................................................... 46
V.DISCUSSION AND CONCLUSION ...................................................................... 51
BIBLIOGRAPHY ............................................................................................................. 53
APPENDICES .................................................................................................................. 55
APPENDIX A. Raw Data For Engine Inter-Arrival Time .................................. 56
APPENDIX B. Simulation Model Block Details .................................................. 60

vii
LIST OF TABLES
Table Page
I. Inventory and Probability Correspondence ..................................................................45
II. OptQuest‟s Optimum Solution ....................................................................................50

viii
LIST OF FIGURES
Figure Page
1. TPS house ....................................................................................................................8
2. 5S diagram ..................................................................................................................10
3. RTA’s organization chart ............................................................................................19
4. PICA form ...................................................................................................................20
5. Value Stream Map of engine replacement ..................................................................25
6. Engine rebuild department layout before the implementation ....................................28
7. Spare engine parts storage rack (large) .......................................................................29
8. Standardized work cell ................................................................................................30
9. Color coded rack .........................................................................................................32
10. Portion of Engine rebuild area after 5S.......................................................................34
11. Lean guidelines ...........................................................................................................35
12. Engine rebuild lay out after the 5S implementation ...................................................36
13. Special bolts bins (poka-yoke device) .........................................................................38
14. Screen shot from standard job procedure and checklist ..............................................39
15. Series 50 EGR engine checklist ..................................................................................40
16. Process flow with integrated inspection .....................................................................41
17. Historical distribution of days between engine failure ...............................................43
18. Simulation model .......................................................................................................46
19. OptQuest’s controls component ..................................................................................48
20. OptQuest’s constraints output .....................................................................................48
21. OptQuest’s objectives component ..............................................................................49

1
CHAPTER I
INTRODUCTION
1.1 Motivation
This thesis researches opportunities for lean production system in Greater
Cleveland Regional Transit Authority‟s (RTA) bus maintenance facility. RTA was
founded in 1970 to provide reliable transportation to Cleveland residents. Currently RTA
owns 620 busses and employs 2653 [4]. The Central Bus Maintenance Facility (CBMF),
located in Cleveland, OH, performs major maintenance activities such as engine rebuild
and brake and body overhauls.
The Lean transformation project described here was initiated from the engine
rebuild department at the CBMF. After thorough observation of the engine rebuild
activity, lean principles were implemented. Future implementation is supported by
statistical analysis and simulation tools. Finally, a comparison of the before and after
states is made. Results are discussed in the conclusion section.

2
1.2. History of Lean Production System
A good way to understand Lean Manufacturing‟s evolution, is understanding the
history of car. In 1880s, there were no car dealers but machine-tool companies, which
were operated by pure craftsmanship [13]. In 1887, Emile Lavassor started to
manufacture Daimler‟s new “high speed” gasoline engine and, by the early 1890s, was
manufacturing several hundred cars a year. However, the production system was still
craftsmanship, which resulted in high price tags [13]. The real challenge in that time was
making high quality and affordable cars. In 1908, Henry Ford found a way to overcome
this long lasting problem with his famous car Model T. Ford‟s new technique
dramatically reduced cost while increasing product quality. This new approach made
cars affordable. Ford named this revolutionary system mass production [13].
In 1926, Saikichi Toyoda founded Toyoda Automatic Loom Works, Ltd. and
started to manufacture his uniquely designed automated looms. In the late 1930s, the
Japanese government urged Toyoda family to manufacture trucks for Japanese military.
With government support and the money from selling its patents for looms, the Toyota
Motor Company started truck production. They successfully supplied the Japanese
military for almost twenty years. A big drop in sales at the end of 1949, however, forced
Toyota to terminate a large portion of its workforce. This led to a lengthy strike,
ultimately resulting resignation of President Kiichiro Toyoda [13]. This chain of events
led the Toyoda family to consider better methods to produce goods. Much of the early
work in developing Lean at Toyota was to car engine manufacturing during the 1950s.
In 1950 Eiji Toyoda assigned machine shop manager Taiichi Ohno with the task
of determining how Toyota could match Ford‟s productivity within three years. Ohno‟s

3
first action was to visit Ford‟s and General Motors‟ U.S. assembly plants to observe and
understand their assembly practices. With this information and a study of Henry Ford‟s
book [5], the basis of the Toyota Production System was formalized by Taiichi Ohno [9].
The Toyota Production System (TPS), from which Lean production system is
derived, is a modified version of Ford‟s mass production. It can clearly be seen that mass
production system has a great influence on TPS. In thirteen years of effort, the Toyota
Motor Company had, by 1950, produced 2685 automobiles, compared with the 7000
Ford‟s Rouge was manufacturing in a single day [13]. According to Liker [9], Ford‟s
mass production system in 1955 was designed to make large quantities of a limited
number of models. In contrast, Toyota needed to produce low volumes of different
models using the same assembly line, because consumer demand in the Japanese auto
market was too low to support dedicated assembly lines for one vehicle.
Toyota started its philosophy out of necessity. The company did not have the
space or capital to hold a lot of inventory. They could not afford to vertically integrate
into all of their parts businesses, and they needed to build vehicles for a relatively small
market demanding a large variety of vehicles. Under those conditions, it was simply
impractical to blindly follow the lead of Henry Ford and make large volumes of single
model such as the Model T [8].
This work later spread to vehicle assembly in the 1960s, and the wider supply
chain in the 1970s. It was only at this point that supplier manuals were first produced and
the “secrets” of Toyota‟s TPS approach were shared with companies outside Toyota.
These manuals were written in Japanese; and it took almost another decade before the
first English translations were available [17].
4
In the period of the 1960s through the 1980s, Lean manufacturing continued
evolve and established a strong foundation to sustain the philosophy of continuous
improvement.
In the early 1980s, James P. Womack and his collaborators founded the
International Motor Vehicle Program at Massachusetts Institute of Technology, initiating
a broad research effort focused on the Toyota Production System [9]. This incident was
the first step for Lean production to enter automotive industry in United States of
America. Womack‟s famous book, The Machine That Changed The World, coined the
term Lean Manufacturing and introduced its principles to the American audience.
During 1990s, development of the concept of a value stream was seen to spread
beyond manufacturing, or just a single company. By this evolution, Lean manufacturing
became more visible to the world, and evolved rapidly with numerous academic research
and professional applications, by a large spectrum of organizations varying from family
businesses to publicly traded corporations [19]. Lean manufacturing‟s great success has
impacted almost every sector of the economy including the service industry [17].
Because of the large spectrum of applicability for Lean manufacturing, a new name for
this production system, Lean Enterprise, is starting to be used.
1.3. Lean Philosophy and Culture
Lean is a philosophy that, when implemented, reduces the time from customer
order to delivery by eliminating sources of waste in the production flow [19]. According
to James P. Womack and Daniel T. Jones, the term “Lean” is used for this production
system because it uses less of everything compared with mass production – half the

5
human effort in the factory, half the manufacturing space, half the investment tools, half
the engineering hours to develop a new product in half the time. Also, it can reduce the
necessary on-site inventory in half, result in many fewer defects, and produce a greater
and ever growing variety of products [13].
TPS is not a toolkit, though; it is a sophisticated philosophy of production in
which all of the parts contribute to a whole [9]. Implementing lean tools aggressively is
not the way of true lean implementation. The starting point is, understanding the culture
that forms the foundation for underlying Lean tools. One cultural shift is the active
involvement of all employees in an organization. Traditionally, workers in mass-
production plants were not involved in quality improvements. It was seen as more
effective and expedient to have staff “experts” assigned to quality - workers worked, and
the professional staff did the thinking. This runs counter to the philosophy of Lean
manufacturing [22].
Muda, translated as “waste”, is lean production system‟s main focus, and is
defined as any activity that consumes resources but adds no value to the product or
service for the customer. The recognition and elimination of waste is the heart of
continuous improvement in Lean progress. Muda can be classified in two types. Type 1
muda is any avoidable non-value added activity. Type 2 muda is any activity that is non-
value added, but unavoidable [11]. A good example to type 1 muda can be given as a
machine running when there is no demand; on the other hand, keeping excess inventory
in an ambulance for emergency purposes is an example to type 2 muda. A Lean
philosophy is relentless in eliminating type 1 waste, relentlessly and attacks type 2 waste
when there is no other waste left in the system.

6
Furthermore, Lean cannot be applied using “one size fits all” approach. Every
situation requires a unique approach and determination of wastes present in the system.
Wastes typically fall into one of seven categories first classified by Taiichi Ohno. These
seven wastes are overproduction, waiting, transportation, over-processing, inventories,
moving, and making defective parts and products [21]. Although the categories of waste
are identified, it is often hard to recognize waste in a system due to different culture and
circumstances.
The bottom-line target for Lean Enterprise is eliminating any kind of waste from
the system. However the ultimate focus is providing value for the customer. Every action
in a Lean organization should benefit the customer.
Lean Enterprise is a process-oriented philosophy. Many U.S. companies are
result-oriented and tend to expect immediate gains, which leads them to base their
decisions on short-term goals [22]. In contrast, Lean Enterprise focuses on basing
decisions on a long-term philosophy, even at the expense of short-term financial goals
[9].
There is no one-sentence definition of the lean production system or lean
philosophy in the current literature. Womack et al. [11] defines Lean thinking as a five-
step process: define customer value; define the value stream; making the value stream
“flow”; “pull” material from the customer back, and; strive for excellence. Being a Lean
Enterprise requires a mindset that focuses on making the product flow through value-
adding processes without interruption, a “pull” system that replenishes only what the next
operation takes away at short intervals, and a culture in which everyone strives for
continuous improvement [9]. Relentlessly attacking muda is called kaizen or continuous

7
improvement. Toyota production system‟s mindset is continuously looking for
improvements by eliminating waste.
Muda is sometimes associated with mura (unevenness) and muri (overburdening
people or equipment) in the literature. Overburdening is operating a machine or person
beyond its capacity, leading to safety and quality problems. Unevenness results from an
irregular production schedule and/or fluctuations in volume due to internal production
problems. Both mura and muri can lead to waste in production [9].
1.4. Lean Tools
One of the best ways to understand the essence of the Lean production system is
the “TPS house” (Figure 1). Other sources present different versions of the house, but
the core principles remain same. Quality, low cost, and shorter lead-time – the roof – are
the result of having a good foundation: Toyota Way philosophy (basing management
decisions on a long-term philosophy); level production (heijunka); visual management,
and; stable and standardized processes. Two outer columns, just in time, and jidoka,
support the roof [9].

8
Figure 1: TPS house (The Toyota Way, 2004)
Toyota follows the mindset of machines working for people rather than people
working for machines. Jidoka (built-in quality), or autonomation, refers a designing
equipment and operations so that the operators are not tied to the machines with the
operators being free, they can perform other value-added multiple tasks while a machine
runs, improving their productivity [8].
Another useful tool under the Jidoka umbrella is poka-yoke (mistake proofing).
This concept literally means a device, which prevents errors to from occurring [21]. The
Toyota production system prefers using autonomation, over simple automation. The
concept of autonomation was created by Toyoda Sakichi with the auto-activated loom

9
invention. This invention has a mistake-proofing device that automatically and instantly
stops the machine if the vertical or lateral threads broke or ran out. This concept is
applied to the other equipment throughout the organization [21].
Some simple examples to poka-yoke include:
1) A machine that automatically stops running if a jam occurs.
2) An ATM machine that beeps to alert the user if he doesn‟t retrieve his card.
5S is a visual management tool consisting of elements developed to create a lean
work environment [11]. The 5 “S” are:
1. Seiri (sort); separating needed materials from unneeded.
2. Seiton (set in order); setting the sorted material in order, often by color-coded
storage bins for ease of use.
3. Seiso (shine); keep the workplace clean.
4. Seiketsu (standardize); conducting first three Ss daily intervals to maintain a
workplace in the best condition for improvements.
5. Shitsuke (sustain); sustaining first four Ss all the time [11].

10
Figure 2: 5S diagram
The goal of 5S is to declutter the work environment and make it easier to recognize other
forms of muda. 5S is a simple but effective tool. Even though some companies consider
5S as time-consuming, the potential gains in productivity outweigh its costs. Some U.S.
manufacturers have added safety as a sixth “S”. With proper implementation of 5S,
though, safety is naturally sustained.
Value stream mapping (VSM) is a powerful tool used for seeing the whole
process and identifying value-added and non-value added activities. When implementing
Lean, a VSM should be drawn first to determine the path that a product follows during its
production [9]. VSM is a paper-and- pencil tool that is used to map out not only how a
process currently flows, but also what the process should look in the future after being
improved to eliminate waste [11].
Five why is a problem-solving methodology which embraces asking “why?” until
the root cause of a problem is reached. Repetition leads people to solve the root of a

11
problem, instead of merely treating symptoms [9]. Five is chosen to emphasize the
necessity of repeating inquiry to reach the root cause.
Heijunka is the leveling of production by demand and product mix. In many
industries demand fluctuates, which makes an even production rate difficult to obtain. A
heijunka implementation starts by taking the total demand for a product and dividing it by
the time available for its production [9]. Often manufacturers have long lead times for
orders, long changeover times, and limited capacity, regardless of the production system.
These circumstances require necessity of heijunka. Lean manufacturers have a tendency
for excessive production capacity when they free up resources and space to be fine if
demand peaks up [11]. Even though leveling out sounds easy, it requires creativity and
thorough understanding of demand and sometimes forecasting.
Just in time (JIT) is one of Toyota‟s most important principles. Some mistakenly
consider JIT as a production system, but Toyota defines JIT simply as having the right
parts at the right place and time, and in the right amount [8]. JIT was developed by
Toyota to minimize inventories, but particularly work-in-process (WIP) inventory, which
is one of Taiichi Ohno‟s seven wastes. At Toyota, JIT production extends out to its
suppliers [8]. The following elements are necessary for JIT: a pull production system;
reduced setup and changeover times, and; single-piece production [9]. Without these
elements, JIT cannot be fully implemented.
A pull production system is one in which downstream demand triggers production
in upstream work centers. A push system, on the other hand, produces goods
independent of the demand. To avoid excessive production, order quantities are set with
kanbans (card) [2]. A typical kanban system utilizes a set of standard containers, each

12
having a description of what to produce and how many to produce. Production can only
begin when there is an empty kanban to fill. Total WIP set by number of kanbans [2]. By
implementing a kanban system, departments pull material from the previous sections of
the line. This prevents the overproduction and build-to-stock in typical of push systems.
A pull system and kanban implementation can eliminate much muda (waste) from
production [7].
The second aspect of JIT is setup time reduction. Many times companies produce
a variety of products requiring different machining processes. In this highly competitive
market, companies cannot afford long periods for changeover. It is virtually impossible
to level the production if the changeover time of a single machine is 2 days. In order to
level a production, an organization must implement SMED (Single Minute Exchange of
Dies) system [18]. SMED can be implemented two ways: (1) while machine is running,
and (2) while machine is not running. Every machine requires a different set up time
reduction approach and SMED‟s ultimate goal is reducing the setup time to 0 [20].
The third aspect of JIT is Single piece flow. Companies tend to build inventory to
deal with an unpredictable demand; however this is a pure form of waste. Car dealers,
stock incredible amount of cars and fail to sell them. JIT embraces producing single
piece and on demand, therefore, there will be no inventory on hand. Single piece flow
also incorporates with SMED. To sustain single piece flow and leveled production,
SMED must take place. By establishing one-piece flow most of the waste is reduced. In
essence, single piece flow means producing goods one at a time, through various
operations, without interruptions, backflows or scrap [11].

13
Andon is a visual control system in a production area. It provides the current
status of production, and alerts team members and supervisors when an error occurs [11].
Andon incorporates Total Productivity Maintenance (TPM), because any associate on the
assembly line can interrupt production when there is a problem. Therefore, a quick
response from maintenance is necessary for andon to be implemented throughout a plant.
TPM is a productivity maintenance methodology originally pioneered by Nippondenso, a
member of the Toyota group. TPM strives for zero unplanned down time for equipment
so that production will not be interrupted due to machine failure [11].
Hoshin-Kanri, meaning “policy deployment,” is Toyota‟s process of objective set
up from the top of the company – including the president – down to the worker level [10].
Proper way to deploy the policy is determining what the company should pursue and
establishing commitment to it. After the commitment is established, the objective should
be deployed throughout the firm for sustainability [11].
1.5. Lean Metrics
Many Lean production tools have been presented in this section. However,
metrics are more important than these quality tools. The success of lean can only be
determined by a comparison of meaningful metrics before and after states. Ohno‟s
statement, “don‟t tell me how you will do it, tell me how you will measure it”,
emphasizes that significance of having meaningful capstone metric [20]. RTA‟s current
capstone metric is net cost per passenger, which is currently $3.45 [3]. RTA‟s quality
improvement implementations should result in net cost per passenger reduction. This
14
will satisfy executive level expectations and increase the level of commitment to Lean
Enterprise within RTA.
1.6. Case studies
Lean philosophy has been implemented throughout different industries for over
20 years in USA. Each implementation harvested different but effective results. This
section shows brief examples from Lean transformations.
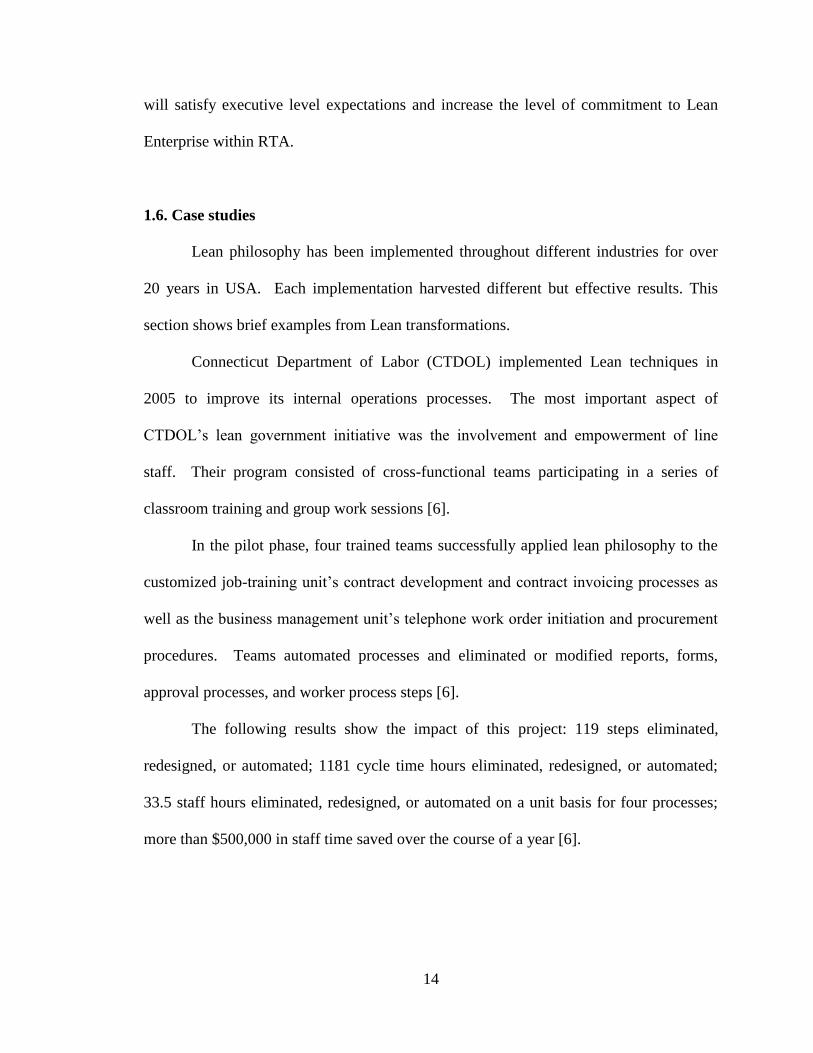
Connecticut Department of Labor (CTDOL) implemented Lean techniques in
2005 to improve its internal operations processes. The most important aspect of
CTDOL‟s lean government initiative was the involvement and empowerment of line
staff. Their program consisted of cross-functional teams participating in a series of
classroom training and group work sessions [6].
In the pilot phase, four trained teams successfully applied lean philosophy to the
customized job-training unit‟s contract development and contract invoicing processes as
well as the business management unit‟s telephone work order initiation and procurement
procedures. Teams automated processes and eliminated or modified reports, forms,
approval processes, and worker process steps [6].
The following results show the impact of this project: 119 steps eliminated,
redesigned, or automated; 1181 cycle time hours eliminated, redesigned, or automated;
33.5 staff hours eliminated, redesigned, or automated on a unit basis for four processes;
more than $500,000 in staff time saved over the course of a year [6].

15
Merida, a Taiwan-based international bicycle manufacturer, implemented TPS in
March 2003. The improvement project consisted of educational training courses, monthly
instruction from a TPS consultant team, interactive learning forum, etc [16].
In three years, required time to input the material to bike frames has reduced
from 6 to 2 days. Material stock has been cut by 1/5, and online stock has been reduced to
1/3. This in turn has been brought up 30% of the production efficiency [16].
Letterkenny Army Depot started to implement Lean philosophy in July 2005,
after a brutal downsizing. Currently, the depot is fabricating HMMWV armor doors in 40
percent less time. Despite the insufficient resources caused by the downsizing, the depot
crew delivered the door kits four weeks early, came in $1 million under budget, and
worked into the process an annual savings of $1.4 million dollars [14].
Aggressive waste elimination and management with Lean process improvements
netted Letterkenny Army Depot big savings in production time, impact on the
environment and dollars. The Lean manufacturing production methods combined with
environmental initiatives save the depot almost $15 million per year [14].
Case studies show that the Lean philosophy can be applied either to
manufacturing or service industry with varying results. Each organization realized
different improvement levels out of the transformation process.

16
CHAPTER II
WORK ENVIRONMENT AND PROJECT FOCUS AT RTA’S CENTRAL BUS
MAINTENANCE FACILITY
2.1. Project Focus
This thesis‟ main focus is to research Lean principles‟ applicability to a
unionized/government-subsidized organization via introducing Lean tools to a transit
agency and observing the progress.
RTA has eight districts, or business units; Central Bus Maintenance Facility
(CBMF) is the district responsible for bus fleet management. CBMF has six
departments: the body shop, the unit rebuild department (repairs broken bus engines), the
brakes department, the engine replacement department, the vehicle inspection
department, and the electronic repair department. RTA‟s CBMF was selected as a pilot
project for a Lean implementation because of its similarity to a manufacturing
environment and performed repetitive processes in the facility. 113 mechanics and
technicians work at the CBMF.

17
In the engine replacement department, a qualified mechanic will remove a failed
engine from a bus and replace it with a new or rebuilt engine. This task is dependent on
the engine rebuild department for its reliability. If a ready-to-install engine is defective,
the engine replacement mechanic must spend extra time remediating the condition. This
is an example of rework, a non-value added activity caused by defects. This relationship
between the Engine Replacement Department and the Engine Rebuild Department is an
example of an internal customer-supplier relationship.
A failed engine‟s journey starts in the field when a bus breaks down. The driver
calls RTA headquarters and informs them about the problem, and the nearest available
mobile repair truck is dispatched to fix the problem. If the field mechanic diagnoses the
problem as an engine failure, the bus is towed to CBMF immediately. Upon arrival the
bus is parked in the outside parking lot until a lift in the Engine Replacement Department
becomes available. After putting the bus on the lift, the replacement mechanic prepares
the engine for pull out. The failed engine is sent it to the engine rebuild department, and
replaced with a rebuilt unit from the on-hand inventory. With this complete, the bus is
ready to return to service.
2.2. Work Environment
CBMF belongs to Fleet Management module in the organization chart. Lean
implementation project was under the equipment manager‟s supervision, who directly
reports to CBMF director. CBMF has a grading system for its mechanics and first-level
supervisors. Junior mechanics are classed as grade four while senior mechanics are
graded as grade five. Assistant supervisors are first level managers with a grade number

18
of six. CBMF performs maintenance tasks, which requires highly skilled labor.
Promotion to upper grades is based on mechanic examinations held by RTA‟s training
department.
RTA‟s managerial structure (Figure 3) is a vertical, top-to-bottom management
system. At CBMF there are no horizontal interactions between the managers. This is in
opposition to Lean manufacturing principles, which encourages more horizontal
connections, both within and between departments.

19
Figure 3: RTA’s organization chart
This concept is called yokoten by Toyota Motor Company, meaning horizontal
transfer of information and knowledge across an organization [12].

20
Figure 4: PICA form

21
RTA uses a workplace suggestion tool called Problem Identification/Corrective
Action (PICA) form (Figure 4) for improvement purposes. A mechanic with an
innovative idea completes and submits out a PICA form. Management reviews and
analyzes his suggestion(s). If the suggestion has merit, management implements it and
the mechanic gets a dinner at a steak house of his choice.
Similar employee rewarding systems are wide spread over the United States.
Honda organizes a lottery at the end of the year to reward three perfect attendees with
brand-new Hondas. Toyota, on the other hand, uses the same suggestion reward system
as RTA. Toyota‟s reward, though, is not as generous as RTA‟s. Workers get one to
three dollars per suggestion at Toyota Motor Company. This is a reflection of cultural
differences. In Japan, the employees take pride when their ideas are implemented by
management. The feeling of being respected is a better prize than a steak dinner for
Japanese workers. This relationship also demonstrates an important principle of Lean
manufacturing: respect to the people.
RTA has a unionized work force. Some U.S. manufacturers believe that Lean
principles cannot be implemented to a unionized job shop because of the union
regulations. This statement however, has been shown to be false [8]. While unions have
a considerable effect on the implementation and management processes, Lean it is still
achievable. Transit Union Workers provide job security to all of the mechanics at RTA.
This fact affects the productivity, improvement, and management decisions significantly.
The mechanic truly believes that he will never lose his job unless there is a major
downfall in the economy. Union regulations imposed various problems during
implementation process, and will be described in the later sections of this thesis.

22
Lean production embraces job security as well. If layoffs occur during the lean
project, Liker recommends that the organization should stop and review their
transformation plan, because layoffs are toxic to the success of Lean [9]. If there is no
way for an organization to survive other than laying off the employees, then it should be
pursued. However, full commitment to the remaining employees should be established.
This survival action is called lean layoff, which was exemplified by Toyota in 1949.
RTA executives and staff have a monthly TransitStat meeting, to discuss the last
month‟s performance and problems. TransitStat is a measurement/evaluation system to
improve RTA processes. Every employee, including the CBMF mechanics, earns raises
based on their TransitStat score. From a Lean viewpoint, TransitStat is a good indicator
for personnel evaluation and will be necessary to sustain continuous improvement within
RTA. As it is determined above, RTA has a unionized work force, which promises job
security. However when the current CEO, Joseph A. Calabrase was hired in February
2000, he laid off couple hundred workers and established full commitment to the
remaining employees.
Part of RTA‟s management policy is striving for excellence. In essence, this
statement corresponds to continuous improvement (kaizen), which is one of the most
important aspects of Lean production system. This statement also determines the policy
deployment (hoshin kanri) in RTA. The importance of policy deployment and
continuous improvement is determined in the first chapter.
Also the union regulations affect the management philosophy and Lean
implementation. Many of the managers at CBMF have difficulties with changes or
process improvements because of the labor relations.

23
CHAPTER III
LEAN IMPLEMENTATION
3.1. Process Observation
The Lean transformation at CBMF started with a thorough observation of the
engine replacement process. The Engine Replacement department had been chosen by
CBMF management before this research was started, as engine replacement job is a
repetitive process, performed by a single mechanic most of the times.
RTA does not use a Material Requirement Planning (MRP) system. They do,
however, utilize the Ultramain Enterprise Resource Planning (ERP) system. This
computer software is designed to track logistics and maintenance activities in the
aerospace industry [23]. Ultramain keeps historical data, and includes separate modules,
which are configurable to the customer‟s production environment.
According to the data gathered from Ultramain, the engine pull-out process takes
between 8 and 12 hours. The entire replacement process takes 16 to 24 hours. As
determined before, the time for engine replacement is largely dependent on the engine
rebuild department. If the rebuild department can not supply the replacement department

24
and deliver ready-to-install engines on time, then busses will be kept waiting on lifts.
Other bus maintenance requiring the lifts will be delayed, ultimately costing RTA more
money and affecting its service to Cleveland area residents.
Another constraint in an engine pull out job is the internal material shipment.
This is a very big concern at every district in RTA, as the delivery performance by the
inventory department is very poor. The engine replacement department is not only
supplied by the engine rebuild department, but also the central warehouse within the
CBMF. Inventory issues will be discussed thoroughly in the following sections of this
chapter.
The three weeks spent at the engine replacement department for process
observation allowed problems to become well-defined. The major problems were lack of
standardization in rebuilt engines, and poor internal supplier performance. Because of
these issues, both the task‟s time and its quality varied a lot from mechanic to mechanic.
The next step was to draw the value stream map for the engine replacement
process. The VSM helps people to see the whole system data and identify non-value
added activities. Combining Ultramain, process observations, and input from CBMF
personnel, the VSM is drawn (Figure 5).

25
Engine
Replace
Radiator
Repair
Chassis
Clean
Outside
Parking
# op: 1
C/T: 2 hr
# op: 1
C/T: 12
hr
# op: 1
C/T: 2 hr
# op: 2
C/T: 85
hrOutside
Parking
2 hr
15 min 3 hr
12 hr
5
min
2 hr 85 hr
3.3 hr NVA
101 hr VA
Excessive
work
Bottleneck
Mura
(unevenness)
Engine
Rebuild
Figure 5: Value Stream Map of engine replacement
In addition to determining NVA activities & times, the VSM also identifies the
process bottleneck and can guide changes to the process [1]. Figure 5 shows very little
travel time, but this in fact is misleading. Mechanics don‟t transfer an engine if the next
station is occupied, which creates an invisible waste. As seen in Figure 5, the time
needed to pull an engine is 12 hours, while the cycle time for an engine rebuild is 85
hours. The tremendous difference between the cycle times creates a bottleneck at the
engine repair department. With this discovery, the implementation area was shifted to
the engine rebuild department from the engine replacement department.
3.2. Lean Implementation to Engine Rebuild Department
Lean production system values the input of the line workers and encourages their
involvement in continuous improvement activities [9]. The engine rebuild process was
observed for two weeks to gain an understanding of the dynamics and determine where

26
waste was occurring. At the time of this project, there were four teams in the rebuild area
each consisting of one grade four and one grade five mechanic. Total staffing in the
engine rebuild department was eight. The layout and the set up was followed a
craftsmanship model, with no form of automation, assembly line, or standard procedures
employed, in the area.
The biggest problem at the engine rebuild department was not the layout nor the
waste, but resistance to change by the work force. It is well known that, without the
management and the mechanics‟ buy-in (Delphi method), Lean transformation can never
be done [15].
Most people have a tendency to resist the idea of things changing. Employees can
feel offended by someone telling them how to do their job in a better and more efficient
way. This mindset is found in any kind of work environment [8]. In this case, the
rebuild mechanics have been doing their jobs in the same way for more than fifteen years.
The challenge here was convincing them to change. To do so, a policy of transparency
was followed by the researcher. A one-hour meeting with the mechanics and
management was arranged to discuss the current situation. In this meeting, information
about this project and the Lean production system were distribution.
At the end of this meeting mechanics still had difficulties about how the
researcher was going to implement Lean principles without any knowledge in bus
maintenance. This argument was made many times during this project. Lean production,
however, is a proven system and can be applied to any kind of repetitive process.
Another challenge faced by this researcher was mechanics seeing him as a threat
and being skeptical about losing their jobs, even though RTA agreed that no job losses

27
would come from this project. Since the mechanics were resistant to the project, they did
not give their best effort towards any process improvement. Some tried to sabotage the
project, and even talked about a minor strike. In this situation, Taiichi Ohno claims that
the best action to take is sending the resistant worker to somewhere he cannot be harmful
[9].
The best way to break resistance is to show positive results to the workers. If the
Lean principles are implemented properly, very convincing and encouraging results will
be gathered. To break the resistance at CBMF, the 5S tool was chosen.
There were two reasons why 5S was chosen as the first Lean tool to implement.
First, the results from a 5S implementation are quick to appear, and will help in getting
the mechanics‟ buy-in for future efforts [9]. Second, 5S address the cluttered, messy
work environment. Figure 6 shows the layout of the engine rebuild department before
the implementation process started. The lack of organization can lead to problems with
quality, safety, and cost. Further, the clutter hides waste behind a veil of excess on-hand
and non-value inventory items.

28
Figure 6: Engine rebuild department layout before the implementation
The first step was to sort the equipment and distinguish between necessary and
unnecessary items. The forklift sat in the middle of the area all the time, but was only
needed 10% of the time. It was moved to a designated parking place just outside of the
work area. The second step was to separate the necessary equipment from the
unnecessary. The Engine Rebuild department had five racks full of clutter and junk.
Among those five were two larger racks for storing spare, used engine parts (Figure 7).
While the racks were labeled, some labels did not match the material on the shelf.
Another problem was the racks being blocked by ladders and carts. Mechanics had a
hard time reaching and finding the parts that they were looking for. Each rebuild team
had two mechanics, one grade four and one grade five, and RTA pushes hard to fully

29
utilize their time. However, the mechanics were spending too much time for looking for
the parts or walking around, which is a good example to waste classified as underutilized
people.
Figure 7: Spare engine parts storage rack (large)
Removing unneeded inventory allowed CBMF to remove one of the two large
five-shelf racks from the Engine Rebuild area. That rack was sent to the Central Rail
Maintenance Facility (CRMF). This incident is a perfect example of synergistic Lean
results. While there was no intention to help CRMF through this research project, CRMF
had been waiting for such a rack to store its parts for over five months.

30
Initially, each team‟s work area was unique and there was no standardization.
The excuse for a not-standardized work place was the variety in work. Mechanics simply
thought that they should have their own personal system in order to repair the failed
engines. The obvious action was taken and work place standardization was initiated as a
part of the sorting phase. A complete engine repair job was studied and the mechanic‟s
needs were determined. According to this study, an engine rebuild mechanic needs two
carts, one multiple-shelf disassembly cart, and an organized peg board. The final state of
the work cell is shown at Figure 8.
Figure 8: Standardized work cell

31
Before the 5S integration, mechanics‟ carts were often “jacked”, or stolen, by
mechanics from other departments in the CBMF, or even from other facilities. To solve
this issue, two carts, painted red and identified with a number corresponding to the work
cell, were assigned to each work cell. This discourages jacking because all CBMF
personnel would see that a cart was being used without authorization.
After completing the sorting step, the next phase was straightening. The
remaining inventory rack was color coded to match the frequency of the part usage: red
for rarely used parts; yellow for sometimes used parts; and green for frequently used
parts. In addition, containers on the shelves were labeled properly for the ease of use
(Figure 9).

32
Figure 9: Color coded rack
The mechanics did not like the color-coding idea, and believed that color-coding
the rack was unnecessary. Furthermore, they felt offended by this implementation. The
mechanics said the following about the 5S implementation:
“This is unnecessary; I know exactly where everything is.”
“Why are we sending these parts away, we may need it.”
“It sure looks clean and organized, hope it will help us too.”
“Why are you doing this, how will we benefit from housekeeping?”
“This must be a joke, everything will stay same, nothing will change!”
As it is understood from the quotations, mechanics resisted to the Lean
transformation project and ignored the results. Using 5S is not only for housekeeping but

33
also for equipment separation and making the waste visible. Lean production system‟s
one of the most important principles is kaizen which promotes continuous improvement,
the Lean champion should never be discouraged by the workers attitude.
The following step was shine. This stage of 5S is the simplest but yet most
effective one. Because of union regulations, regular mechanics were not allowed to do
cleaning and painting. Thus, the facilities maintenance mechanics were assigned to this
task. Because of a backlog of work orders, the facilities maintenance department was
unable to start cleaning or painting for two weeks. Shining stage was eventually
completed with good feedback and results (Figure 10). This helped bring a full
consensus to enable more rapid Lean improvements within the engine rebuild
department.

34
Figure 10: Portion of Engine rebuild area after 5S
The fourth step of 5S is standardization. It is easy to mistake standardized work
with standardization in 5S. They are two different aspects of Lean production system.
Standardization in 5S embraces integrates a system of standardizing the workplace to
sustain the implementation. To some extent, standardization is part of the sustaining
stage. To implement this step, a standardization form and list of obligations were
provided to CBMF (Figure 11). As it is seen from Figure 11, standardization step was
completed successfully with the standard task handout.

35
To maintain the improvements made by incorporating some LEAN processes into the Engine
Rebuild area, the following processes shall be enforced by the Assistant Section Supervisor.
• PPE should be worn at all times.
• 2 red carts and 1 blue “stacked cart” per area (no exceptions).
• No other cart allowed in the area.
• Metal Dumpster shall remain in its designated location.
• Used oil drum shall remain in its designated area (when not in use).
• Wall lights will be turned on everyday and turned off at the end of the shift.
• No engine stands used to transport the engines via fork lift shall be left in the
area.
• Forklift shall always be parked in its designated area (when not in use).
• Designated employee toolbox locations shall not be changed. Should an employee wish to
permanently relocate his toolbox, he/she shall consult with the Performance Supervisor.
• When processing cores, Batch core processing shall continue, however; no core parts shall be
left out by the supervisor‟s work area. (cores will be processed immediately).
• Only use 1 red cart (1 per work station) for cores.
• All wash vat lids shall be closed nightly and radios, fans, and lights turned off.
• Non-work related books and magazines shall be removed from the area or kept in employee
toolboxes during work hours.
• When it‟s necessary to discuss changes in work process, employees should bring their
ideas/concerns to the Assistant Section Supervisor. The Assistant Section Supervisor should
document the idea/concern and bring it to the Performance Supervisor for action or address
the concern and inform the Performance Supervisor of the issue and resolution. This will
eliminate unproductive time and, at the same time, provide a way for employees to submit
valuable ideas for continuous improvement.
Figure 11: Lean guidelines

36
The most challenging stage of the 5S procedure was to sustain the new work
environment and Lean philosophy. At first, mechanics were not willing to pursue 5S and
other Lean tools. After seeing the dramatic results from the first steps, most of the
mechanics started to commit to Lean philosophy and continuous improvement. At this
point, ownership for this project can be sustained.
The final state of the engine rebuild department is shown in Figure 12. The
number of engine stands was increased to 5 from 4. This capacity increase was not
planned before the 5S implementation, but became possible as a side effect of it.
Figure 12: Engine rebuild lay out after the 5S implementation

37
An engine rebuild job requires removing and installing more than 400 bolts.
Many of these are custom-designed for the engine and are not now manufactured by the
vendors. A lost bolt forces RTA to order its replacement from a third-party vendor if
they are lost. To prevent this from happening, the engine repair mechanics amassed their
own private bolt inventories and held on to them. The informal, unwritten code between
mechanics prevented one from asking for a replacement bolt from another‟s stash.
To overcome this issue and sustain reliable and quality engine repairs, Scott, an
assistant supervisor, recommended having a common-access bolt stock. This could
combine every mechanic‟s bolt inventory and make them accessible to everybody in the
engine rebuild department. By combining every mechanic‟s inventory, the bolt bins on
the five-shelf disassembly cart were emptied. This was a perfect opportunity to improve
upon the bolt inventory idea by labeling all of the bolt bins and assigning specific places
to them on the disassembly cart. The idea was to establish a method to avoid missing
bolts when the engine rebuild job was complete. The bins would be empty before the
job, and should be empty when the job is completed. If not, a label on the bin would
guide the mechanic towards where that bolt should go on the engine (Figure 13). With
help of this poka-yoke implementation, number of missing bolts and running out of bolts
decreased to zero.

38
Figure 13: Special bolts bins (poka-yoke device)
RTA uses standard operation procedures (SOP) in many tasks. However, engine
rebuild department did not have one, with the excuse was the job‟s unpredictable nature.
Sometimes an engine rebuild is as simple as an engine head replacement, and sometimes
as complicated as an overhaul of the entire engine. Hence, the common thinking was
that, it was impossible to implement a standard procedure to the engine rebuild
department.
The Lean production system, in contrast, embraces job standardization and
recommends everybody‟s participation in the standardization [8]. Robert, an assistant
supervisor at engine replacement department, took the initiative to develop a standard job
procedure checklist showing the department‟s expectations from the engine rebuild
department. Figure 14 shows a section of Engine Replacement Department‟s inspection
sheet.

39
Figure 14: Screen shot from standard job procedure and checklist
Before Lean integration, engine replacement mechanics were fixing the defects
created by the engine rebuild mechanics. This was taking a significant amount of time,
resulting in long queues in the engine replacement department. To prevent those defects
and maintain zero defects, a checklist was prepared and integrated into the engine rebuild
activity. The engine rebuild assistant supervisor started to inspect the repaired engines by
the checklist shown in Figure 15. This action dramatically reduced the defects reaching
the engine replacement area. It is a good example of the Lean philosophy, in that it did
not require a large cash investment yet yielded a satisfactory result was.

40
Figure 15: Series 50 EGR engine checklist

41
Both the procedure and final inspection checklists are integrated to the system to
establish a better customer – supplier relationship within the CBMF, and more reliable
product. Figure 16 shows the final process flow chart.
Figure 16: Process flow with integrated inspection
According to Taiichi Ohno, inspection is one of the seven forms of waste and
should be eliminated from the system. However, in order to sustain reliability and better
quality, integrating two steps of inspection was necessary. It is expected that after future
improvements to the training and the process, these inspections may be eliminated.
Engine pull-out
Engine repair
Engine rebuild supervisor inspection
Engine replacement supervisor inspection
Engine installment

42
CHAPTER IV
STATISTICAL ANALYSIS AND SIMULATION
The initial roadmap for this thesis did not have a statistical analysis nor a
simulation component, but both contributed to the project tremendously. The purpose of
this chapter is, to use these tools to determine the takt time and optimize the flow and
resources. Many corporations such as, General Electric, Ford, and Boeing use statistical
analysis tools to increase their productivity, reduce operation cost, and improve quality.
Ultramain, RTA‟s ERP system, has a module for statistical analysis, but RTA staff does
not use it.
4.1. Statistical Analysis
RTA‟s Engine Rebuild department used to follow an FIFO model, without any
production scheduling. As a result, the Engine Rebuild Department either overproduced
or was not able to meet the demand. Statistical analysis was used to determine the failed
engine arrival rate, which in turn would determine the takt time for an engine rebuild.
Takt time is the optimum production pace given by dividing total available work hour by

43
the demand. Statistical tools were used in lieu of time studies as the latter was prohibited
by the mechanics‟ union. Historical data for 313 engine failures, covering a span of 40
months, was obtained from Ultramain (Appendix A). Minitab was used to identify the
statistical distribution of time-between-arrivals for this data. The best-fit distribution was
found to be an exponential distribution having a mean of 3.88 days between arrival dates
with a variance of 0.066 days (Figure 17).
Figure 17. Historical distribution of days between engine failure
Because engine breakdowns are not scheduled events, RTA is required to have
some number of engines on-hand for replacement; otherwise, busses will be kept waiting
in the Engine Replacement area. It was proposed that RTA keep a specific number of
ready-to-install engines for immediate use by the Engine Replacement, while matching
the engine rebuild takt time of 3.88 days. The underlying goal was to prevent over-
production and unnecessary inventory in the bottleneck operation, while at the same time
preventing excessive waiting in the Engine Replacement area. Having the right number

44
of engines on-hand and maintaining a steady repair pace will assist RTA in eliminating
waste.
Another problem with the system is material flow. The Engine Rebuild
Department‟s current production system follows craftsmanship model, in which an
engine is serviced by a single mechanic, working at his own pace and his own
procedures. In order to sustain single-piece flow, an assembly line idea was proposed to
RTA. At this time, management is skeptical to implement a flow system because of the
problematic inventory department (poor delivery performance), but yet excited to create
the foundation to proceed to the single-piece implementation.
The Inventory Department contributes to problems in the Engine Rebuild
Department caused by Ultramain. Ultramain software crashes very frequently and some
of the software modules are not configured properly, which ultimately results in internal
quality issues such as long lead times, reuse of worn parts rather than new ones, and jury-
rigging of components to return busses to service. The author knows of one instance
where duct tape was used to repair a leaking hose. This research‟s focus, however, did
not include RTA‟s supply chain systems. Thus, inventory problems were not considered
in the model.
Assuming an exponential distribution of engine arrival times, Arena software‟s
process analyzer is used to simulate the process to determine the optimum on-hand
inventory level. Table 1 lists the probability of meeting engine demand as a function of
the on-hand inventory. After seeing these results, RTA executives decided to adopt a 6-
engine inventory policy. With this, the Engine Replacement department will have an

45
engine available 49% of the time, thus eliminating the bottleneck identified in the value
stream map.
Number of
Engines
Probability of Meeting
Demand
1 0.073
2 0.178
3 0.272
4 0.358
5 0.440
6 0.494
7 0.526
8 0.564
Table I. Inventory and probability Correspondence
4.2. System Simulation
Beyond the Lean implementation discussed in Chapter 3, and the on-hand engine
inventory optimization discussed in Section 4.1, it is hypothesized that a reorganization
of how engines are processed in the Engine Rebuild area can improve engine availability
and lower costs for RTA. Currently, an engine is serviced by a single mechanic as it is
rebuilt. The proposed layout would consist of five work stations, in which each mechanic
performs a portion of the work needed to rebuild an engine. It is thought that, by
introducing flow, RTA would be able to avoid the overproduction of rebuilt engines.
At this time, RTA is unwilling to implement such a drastic change to the work
environment. Instead, the proposed change is modeled in Arena. Arena is a simulation
software for designing and optimizing any kind of system. The simulation found that

46
three rebuild mechanics, instead of the five originally considered, would be able to meet
the expected demand for rebuilt engines.
4.2.1. Simulation Model
The simulation model is based on the value stream map from Figure 5 and
statistical analysis discussed in Section 3. The model consists of a five-station engine
assembly line and the proposed safety buffer of five engines. Currently, the average time
to rebuild an engine is 85 hours. Separating an engine rebuild into five workstations with
balanced times allows the predicted rate of engine production (0.058 engine/hr) to match
the time needed to reinstall an engine in Engine Replacement (12-16 hours).
Figure 18. Simulation model (Appendix B)
Figure 18 shows the Arena model used in the simulation. The model uses the
exponential distribution for failed engine arrivals; triangular time distributions for
workstation processes, and; exponential time distributions for transportation of engines
between workstations. The model accounts for the fact that RTA busses operate, and

47
break down, seven days a week, while the mechanics only work five days a week. The
model does not weight breakdowns by day, instead an average arrival rate was derived
from the historical data (Appendix A). The number of workstations was treated as a
variable, as was the number of mechanics in the Engine Replacement area. Both
numbers were bounded between one and twenty with a suggested value of five. Details
of the model are listed in Appendix B. Arena‟s OptQuest module was used to minimize
cost, using the constraint that no more than three busses should wait on an engine at any
given time. The simulation covers a three-year period of operations.
OptQuest is used to simulate various scenarios and select the optimum solution.
There are three main components of the optimization program: constraints, controls, and
the objective. A simulation can have several constraints and controls, but there can be
only one objective.
Figure 19 shows the controls for number of install mechanics (NIM), number of
repair mechanics (NRM), and on-hand engine inventory (OHE). In the main Arena
model, these controls are assigned as variables so that OptQuest can recognize and
change their values, within the established limits, in order to achieve the optimal solution.

48
Figure 19. OptQuest’s controls component
The number of idle busses is specified as the constraint. No more than three
busses can be idle at any given time (Figure 20).
Figure 20. OptQuest’s constraints output

49
The objective of the optimization is to minimize the cost while meeting the
demand and sustaining quality. Cost was calculated by using two factors: mechanics
wages, and RTA‟s assigned cost for a rebuilt engine. It is recognized that the cost
function is not perfect, as it does not include benefits or overhead costs, and may double-
count labor (Figure 21).
Figure 21. OptQuest’s objectives component
The optimization shows that three Engine Rebuild workstations and one Engine
Replacement mechanic will minimize RTA‟s operating cost. Using the numbers in the
model, the proposed layout will result in annual savings of $213,000, which is calculated

50
by subtracting the optimized cost given by the expression in Figure 20 from the current
operating cost. Labor cost is based on $25/hr wage. The proposed model will sustain
one-piece flow and level out the production, avoiding an excess of rebuild (heijunka).
# of busses waiting for an engine ≤ 3
# of install mechanics 1
# of repair mechanics 3
# of on-hand engines 5
Total annual cost: $930,000
(previous state: $1.6M)
Table II. OptQuest’s optimum solution
Table 2 shows the optimum solution for the engine rebuild process. The proposed
state consisted of 5 workstations, however, after the simulation it is found that 5-
workstation process is not optimal. Thereby, OptQuest reduced the number to 3-
workstations. The optimized model has a takt time of 26.7 hours, which is comparable to
the engine arrival rate of 3.88 days (27.2 hours, using 7.5-hour shifts).

51
CHAPTER V
DISCUSSION & CONCLUSION
This study yielded both expected and unexpected findings. It was anticipated that
Lean production principles would be applicable to a unionized, semi-governmental work
environment. It was discussed by previous authors [8,11] that a Lean production system
can be implemented, but the impact may not be as dramatic as possible in a non-union
environment. In this project at RTA, the implementation results were relatively dramatic,
including:
Increasing in available space by 30%;
Increasing capacity by 25%;
Reducing the required staffing from 8 to 5;
Eliminating of overprocessing and overproduction, and;
Realizing annual costs savings of $150,000 by staff reduction.
The unexpected finding is the requirement of statistical and scientific skills to
maximize the benefits of a Lean implementation. In the literature, Lean is discussed from
a business perspective [11]. In many cases, though, scientific tools are required to better
implement Lean tools. This study demonstrates that statistical analysis and simulation

52
tools are necessary complements to Lean principles in providing tangible benefits to an
organization. This was demonstrated by the simulation of flow in the Engine Rebuild
Department, which identified the potential for RTA to increase its annual cost savings
from $150,000 to $213,000.
This thesis‟ research methodology started out as a pure Lean philosophy
integration, however, the constraints found in the environment at RTA required an
adjustment to maximize the outcome. As demonstrated in Chapter 3 and 4, a hybrid
production system, consisting of the necessary Lean and systems engineering tools, is
realized.
This thesis‟ implementation results and process findings show that a pure Lean
system is not possible to implement to a unionized/government-subsidized organization.
The further study on the selection of production system tools in the literature may be
conducted to create different hybrid systems for companies with various work
environments.

53
BIBLIOGRAPHY [1]. A. Zwas, Lean Manufacturing Techniques in Bus and Rail Maintenance. Transportation
Research Board Annual Meeting, 2006.
[2]. Association, Japan Management. Kanban, Just-In-Time at Toyota. Cambridge, MA :
Productivity Press, 1989.
[3]. Greater Cleveland Regional Transit Authority. „Quarterly Management Report First Quarter
2008,” Cleveland : RTA, 2008.
[4]. Greater Cleveland Regional Transit Authority. About RTA: RTA facts. RideRTA. [Online],
06 10, 2009. Available: http://www.riderta.com/ar_RTAfacts.asp. [Cited: 06 10, 2010.]
[5]. H. Ford, S. Crowther. Today and Tomorrow. New York: Productivity Press, 1988.
[6]. J. Hasenjager, “Lean government (is not an oxymoron),” Industrial Engineer, pp.43-
47, July 2006.
[7]. J. J.Dahlgaard, “Lean production, six sigma quality, TQM and company culture,” The TQM
Magazine, pp. 263-281, 2006.
[8]. J. K. Liker. Becoming Lean: Inside Stories of U.S. Manufacturers. New York : Productivity
Press, 1998.
[9]. J. K. Liker. The Toyota Way. New York: The McGraw-Hill Companies, 2004.
[10]. J. P. - - ,” J. P. Womack 's monthly e-letters,
2009.
[11]. J. P. Womack and D. T. Jones. Lean Thinking. New York : Free Press, 2003.
[12]. J. P.Womack, “Yokoten Across the World,” Lean Enterprise Institute, 2008.
[13]. J. P. Womack, D. T. Jones, Daniel Roos. The Machine That Changed The World. New
York: Free Press, 1990.
[14]. Lean Manufacturing at Letterkenny Produces Real World Results, Deborah Elliot.
[Online] 2010. http://aec.army.mil/usaec/newsroom/news/news28.html. [Cited: 06 20,
2010].
[15]. M. P. Groover, Automation, Production Systems, and Computer-Integrated
Manufacturing. Upper Saddle River, NJ : Pearson Education Inc., 2008.
[16]. M. Won, “The Role of Culture in Implementing Lean Production System,” IFIP
International Federation for Information Processing, pp. 413-422, 2007.
[17]. P. Hines, M. Holwe, and N. Rich, “Learning to evolve, A review of contemporary lean
thinking,” International Journal of Operations & Production Management, pp. 994-1011,
2004.

54
[18]. S. A. Rooney and J. J. Rooney, “Lean Glossary,” Quality Progress, pp. 41-47, 2005.
[19]. S. Bhasin and P. Burcher, “Lean viewed as a philosophy,” Journal of Manufacturing
Technology Management, pp. 56-72, 2006.
[20]. T. Creasy, “Pyramid: Get bottom-line results by combining LSS and the theory of
constraints,” Quality Progress, pp. 40-45, 2009.
[21]. T. Ohno. Toyota Production System - Beyond Large-Scale Production. Cambridge :
Productivity Press, 1988.
[22]. T. Y. Choi, “Bringing Japanese continuous improvement approaches to U.S.
manufacturing: The roles of process orientation and communications.” Decision Sciences,
pp. xx-xx, 1995.
[23]. Ultramain Systems, Inc. About Ultramain Systems, Inc. Ultramain Sysems, Inc. [Online]
2009. http://www.ultramain.com/about. [Cited: 06 18, 2009.]

55
APPENDICES

56
APPENDIX A – Raw Data for Engine Inter-Arrival Time
Opened # Inter-arrival
time
12/13/2005 1
1/9/2006 2 27
1/9/2006 3 0
1/24/2006 4 15
1/24/2006 5 0
2/2/2006 6 9
2/2/2006 7 0
2/13/2006 8 11
2/14/2006 9 1
2/21/2006 10 7
3/2/2006 11 9
3/13/2006 12 11
3/13/2006 13 0
3/17/2006 14 4
3/23/2006 15 6
3/23/2006 16 0
3/27/2006 17 4
3/27/2006 18 0
3/27/2006 19 0
3/29/2006 20 2
3/31/2006 21 2
4/4/2006 22 4
4/21/2006 23 17
4/21/2006 24 0
4/25/2006 25 4
4/25/2006 26 0
4/26/2006 27 1
4/28/2006 28 2
5/4/2006 29 6
5/4/2006 30 0
5/4/2006 31 0
5/10/2006 32 6
5/19/2006 33 9
5/22/2006 34 3
5/23/2006 35 1
5/25/2006 36 2
5/25/2006 37 0
5/30/2006 38 5
5/31/2006 39 1
5/31/2006 40 0
6/2/2006 41 2
6/2/2006 42 0
6/7/2006 43 5
6/9/2006 44 2
6/9/2006 45 0
6/14/2006 46 5
6/14/2006 47 0
6/21/2006 48 7
6/22/2006 49 1
6/22/2006 50 0
6/23/2006 51 1
6/28/2006 52 5
7/5/2006 53 7
7/6/2006 54 1
7/6/2006 55 0
7/11/2006 56 5
7/17/2006 57 6
7/18/2006 58 1
7/20/2006 59 2
7/20/2006 60 0
7/28/2006 61 8
7/31/2006 62 3
8/2/2006 63 2
8/4/2006 64 2
8/4/2006 65 0
8/11/2006 66 7
8/17/2006 67 6
8/24/2006 68 7
8/30/2006 69 6
8/30/2006 70 0
8/31/2006 71 1
9/6/2006 72 6
9/7/2006 73 1
9/18/2006 74 11
9/20/2006 75 2
9/20/2006 76 0
9/29/2006 77 9
10/5/2006 78 6
10/9/2006 79 4
10/18/2006 80 9
10/21/2006 81 3
10/21/2006 82 0
11/10/2006 83 20
11/10/2006 84 0
11/21/2006 85 11
11/25/2006 86 4
11/25/2006 87 0
11/30/2006 88 5
12/1/2006 89 1
12/7/2006 90 6

57
12/8/2006 91 1
12/12/2006 92 4
12/15/2006 93 3
12/20/2006 94 5
12/26/2006 95 6
12/27/2006 96 1
1/3/2007 97 7
1/6/2007 98 3
1/6/2007 99 0
1/17/2007 100 11
1/19/2007 101 2
1/23/2007 102 4
1/29/2007 103 6
1/29/2007 104 0
2/5/2007 105 7
2/13/2007 106 8
2/13/2007 107 0
2/14/2007 108 1
2/22/2007 109 8
2/23/2007 110 1
3/2/2007 111 7
3/5/2007 112 3
3/6/2007 113 1
3/9/2007 114 3
3/12/2007 115 3
3/15/2007 116 3
3/16/2007 117 1
3/19/2007 118 3
3/21/2007 119 2
3/21/2007 120 0
3/23/2007 121 2
3/26/2007 122 3
3/30/2007 123 4
3/30/2007 124 0
4/2/2007 125 3
4/6/2007 126 4
4/9/2007 127 3
4/9/2007 128 0
4/13/2007 129 4
4/13/2007 130 0
4/19/2007 131 6
4/21/2007 132 2
4/21/2007 133 0
4/26/2007 134 5
4/27/2007 135 1
5/5/2007 136 8
5/5/2007 137 0
5/7/2007 138 2
5/16/2007 139 9
5/16/2007 140 0
5/22/2007 141 6
5/23/2007 142 1
5/23/2007 143 0
6/1/2007 144 9
6/1/2007 145 0
6/6/2007 146 5
6/8/2007 147 2
6/12/2007 148 4
6/18/2007 149 6
6/19/2007 150 1
6/25/2007 151 6
6/27/2007 152 2
7/6/2007 153 9
7/6/2007 154 0
7/8/2007 155 2
7/11/2007 156 3
7/11/2007 157 0
7/16/2007 158 5
7/17/2007 159 1
7/17/2007 160 0
7/23/2007 161 6
7/24/2007 162 1
7/25/2007 163 1
7/27/2007 164 2
7/27/2007 165 0
7/30/2007 166 3
7/30/2007 167 0
8/3/2007 168 4
8/4/2007 169 1
8/4/2007 170 0
8/6/2007 171 2
8/10/2007 172 4
8/10/2007 173 0
8/10/2007 174 0
8/22/2007 175 12
8/28/2007 176 6
8/31/2007 177 3
9/4/2007 178 4
9/4/2007 179 0
9/6/2007 180 2
9/11/2007 181 5
9/13/2007 182 2
9/14/2007 183 1
9/14/2007 184 0
9/17/2007 185 3
9/20/2007 186 3

58
9/24/2007 187 4
9/26/2007 188 2
9/27/2007 189 1
9/29/2007 190 2
10/8/2007 191 9
10/9/2007 192 1
10/10/2007 193 1
10/11/2007 194 1
10/23/2007 195 12
11/5/2007 196 13
11/5/2007 197 0
11/6/2007 198 1
11/15/2007 199 9
11/19/2007 200 4
12/6/2007 201 17
12/6/2007 202 0
12/13/2007 203 7
12/13/2007 204 0
12/14/2007 205 1
12/14/2007 206 0
12/26/2007 207 12
12/27/2007 208 1
1/2/2008 209 6
1/10/2008 210 8
1/10/2008 211 0
1/18/2008 212 8
1/18/2008 213 0
1/30/2008 214 12
2/12/2008 215 13
2/15/2008 216 3
2/19/2008 217 4
2/22/2008 218 3
3/3/2008 219 10
3/3/2008 220 0
3/7/2008 221 4
3/7/2008 222 0
3/10/2008 223 3
3/14/2008 224 4
3/14/2008 225 0
3/25/2008 226 11
3/25/2008 227 0
3/25/2008 228 0
3/25/2008 229 0
3/31/2008 230 6
4/4/2008 231 4
4/7/2008 232 3
4/7/2008 233 0
4/14/2008 234 7
4/16/2008 235 2
4/17/2008 236 1
4/22/2008 237 5
4/24/2008 238 2
4/24/2008 239 0
5/7/2008 240 13
5/8/2008 241 1
5/20/2008 242 12
5/20/2008 243 0
5/27/2008 244 7
6/2/2008 245 6
6/4/2008 246 2
6/4/2008 247 0
6/11/2008 248 7
6/12/2008 249 1
6/20/2008 250 8
6/27/2008 251 7
7/2/2008 252 5
7/7/2008 253 5
7/10/2008 254 3
7/16/2008 255 6
7/22/2008 256 6
7/23/2008 257 1
7/24/2008 258 1
8/1/2008 259 8
8/6/2008 260 5
8/6/2008 261 0
8/7/2008 262 1
8/19/2008 263 12
8/20/2008 264 1
8/21/2008 265 1
9/3/2008 266 13
9/5/2008 267 2
9/9/2008 268 4
9/22/2008 269 13
9/22/2008 270 0
9/25/2008 271 3
10/1/2008 272 6
10/3/2008 273 2
10/3/2008 274 0
10/8/2008 275 5
10/16/2008 276 8
10/16/2008 277 0
10/22/2008 278 6
10/22/2008 279 0
10/30/2008 280 8
11/3/2008 281 4
11/12/2008 282 9

59
11/17/2008 283 5
11/17/2008 284 0
11/24/2008 285 7
11/25/2008 286 1
11/25/2008 287 0
11/28/2008 288 3
12/9/2008 289 11
12/12/2008 290 3
12/12/2008 291 0
12/15/2008 292 3
12/22/2008 293 7
12/31/2008 294 9
1/5/2009 295 5
1/5/2009 296 0
1/7/2009 297 2
1/8/2009 298 1
1/8/2009 299 0
1/14/2009 300 6
1/20/2009 301 6
1/22/2009 302 2
1/30/2009 303 8
2/3/2009 304 4
2/10/2009 305 7
2/25/2009 306 15
3/10/2009 307 13
3/16/2009 308 6
3/16/2009 309 0
3/26/2009 310 10
4/2/2009 311 7
4/15/2009 312 13

60
APPENDIX B – Simulation Model Block Details
Blocks Description Block type Distribution Parameters
FBA Failed bus arrives Create Exponential 3 days
ISC Initial stock created Create Constant 9999999
REI Repaired engine inventory Hold N/A N/A
SEP Separate Separate N/A N/A
BW Bus waiting for engine Hold N/A N/A
EA Engine becomes available Pick up N/A N/A
EI Engine install Process Triangular 8,12,14 min
SEP Separate Separate N/A N/A
BL Bus leaves Dispose N/A N/A
EPS Engine parameter set Assign N/A N/A
ER 1 Engine repair 1 Process Triangular 12,15,18 hr
ER 2 Engine repair 2 Process Triangular 12,15,18 hr
ER 3 Engine repair 3 Process Triangular 12,15,18 hr
ER 4 Engine repair 4 Process Triangular 12,15,18 hr
ER 5 Engine repair 5 Process Triangular 12,15,18 hr
S 0 Station 0 Station N/A N/A
S 1 Station 1 Station N/A N/A
S 2 Station 2 Station N/A N/A
S 3 Station 3 Station N/A N/A
S 4 Station 4 Station N/A N/A
S 5 Station 5 Station N/A N/A
L 1 Leave 1 Leave Exponential 5 min
L 2 Leave 2 Leave Exponential 5 min
L 3 Leave 3 Leave Exponential 5 min
L 4 Leave 4 Leave Exponential 5 min
L 5 Leave 5 Leave Exponential 5 min