opportunities for regulatory relief via in vitro … · topics •current issues with in vitro...
TRANSCRIPT
Opportunities for Regulatory Relief via In Vitro Dissolution
James E. Polli
June 10, 2015

Topics
• Current issues with in vitro dissolution
• IVIVC, IVIVR, and biopharmaceutic risk
• Deconvolution IVIVR method
• BCS Class 2 (for weakly basic drugs)
• BCS Class 3 excipient considerations
Two of the Most Common Complaints about In Vitro Dissolution
• Too sensitive (i.e. over discrimination)
• Not sensitive enough (i.e. not discriminating enough)
• Opportunities – Regulatory relief
– Methods development/validation/standardization of more challenging dissolution problems (e.g. BCS class 2)
Complications
• Attaining complete dissolution and sink conditions – Enhanced drug solubility (e.g. via additional
surfactant) tends to reduce dissolution test sensitivity.
• Same EVERYTHING across dose strengths – Historical tendency to prefer the same test
methods and same specs, even though different doses can result in a fundamental change in the dissolution problem. • A higher dose may dissolve slower or to a lesser
extent, than lower dose.
Roles of In Vitro Dissolution
• Product development tool
• QC test
• Clinically relevant assessment tool [a/k/a in vivo performance test] – Meaning?
• A measure of in vivo dissolution
–As assessed by deconvolution of PK profile when absorption is dissolution-limited?
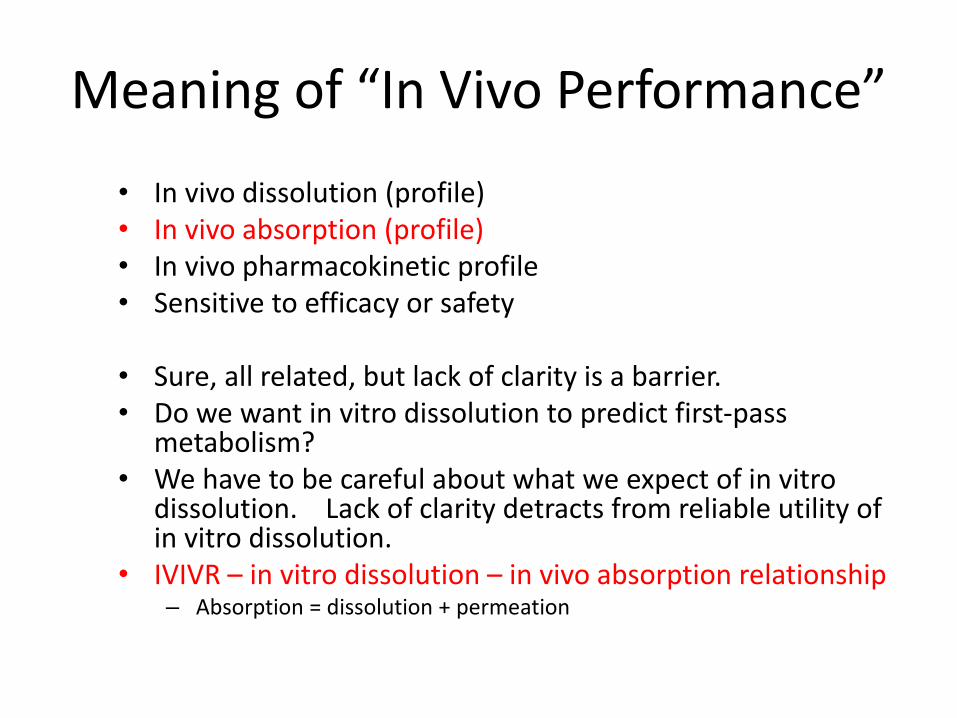
Meaning of “In Vivo Performance”
• In vivo dissolution (profile) • In vivo absorption (profile) • In vivo pharmacokinetic profile • Sensitive to efficacy or safety
• Sure, all related, but lack of clarity is a barrier. • Do we want in vitro dissolution to predict first-pass
metabolism? • We have to be careful about what we expect of in vitro
dissolution. Lack of clarity detracts from reliable utility of in vitro dissolution.
• IVIVR – in vitro dissolution – in vivo absorption relationship – Absorption = dissolution + permeation
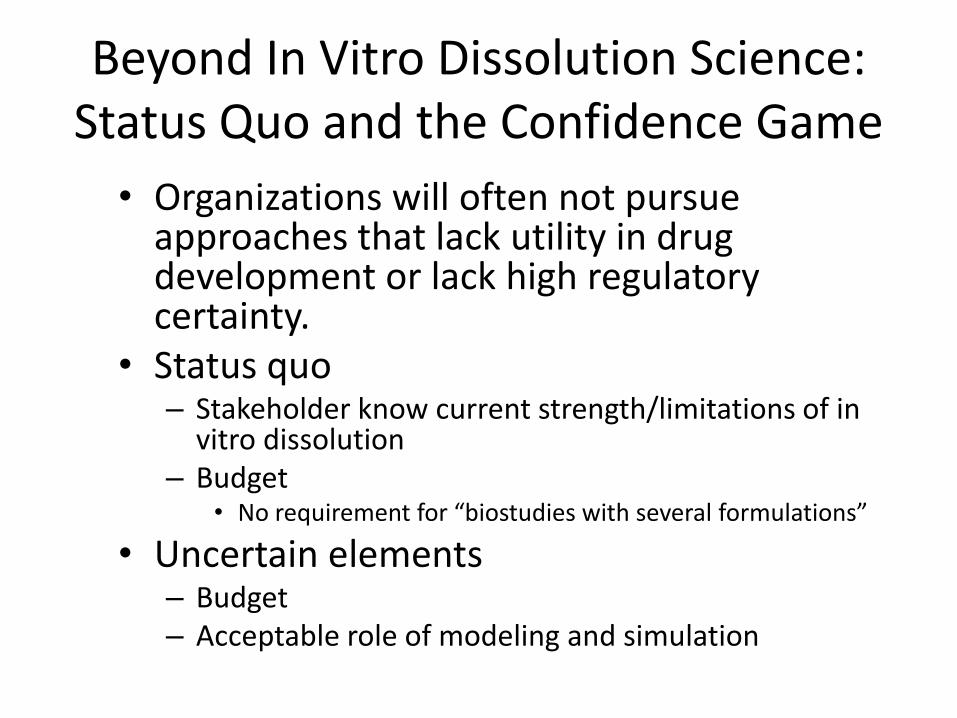
Beyond In Vitro Dissolution Science: Status Quo and the Confidence Game
• Organizations will often not pursue approaches that lack utility in drug development or lack high regulatory certainty.
• Status quo – Stakeholder know current strength/limitations of in
vitro dissolution – Budget
• No requirement for “biostudies with several formulations”
• Uncertain elements – Budget – Acceptable role of modeling and simulation
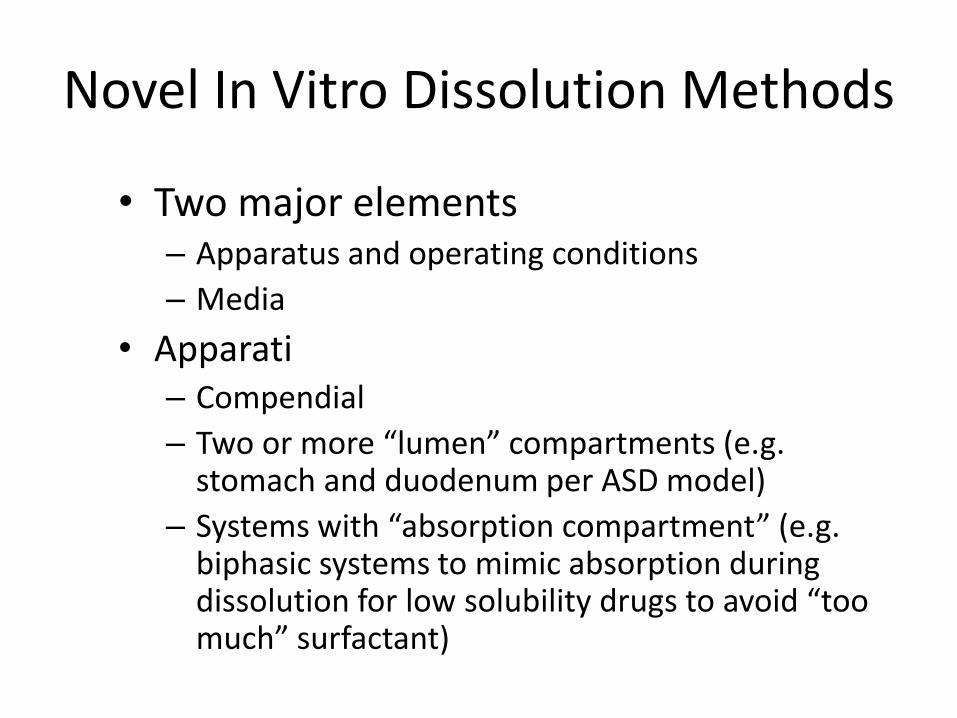
Novel In Vitro Dissolution Methods
• Two major elements – Apparatus and operating conditions
– Media
• Apparati – Compendial
– Two or more “lumen” compartments (e.g. stomach and duodenum per ASD model)
– Systems with “absorption compartment” (e.g. biphasic systems to mimic absorption during dissolution for low solubility drugs to avoid “too much” surfactant)
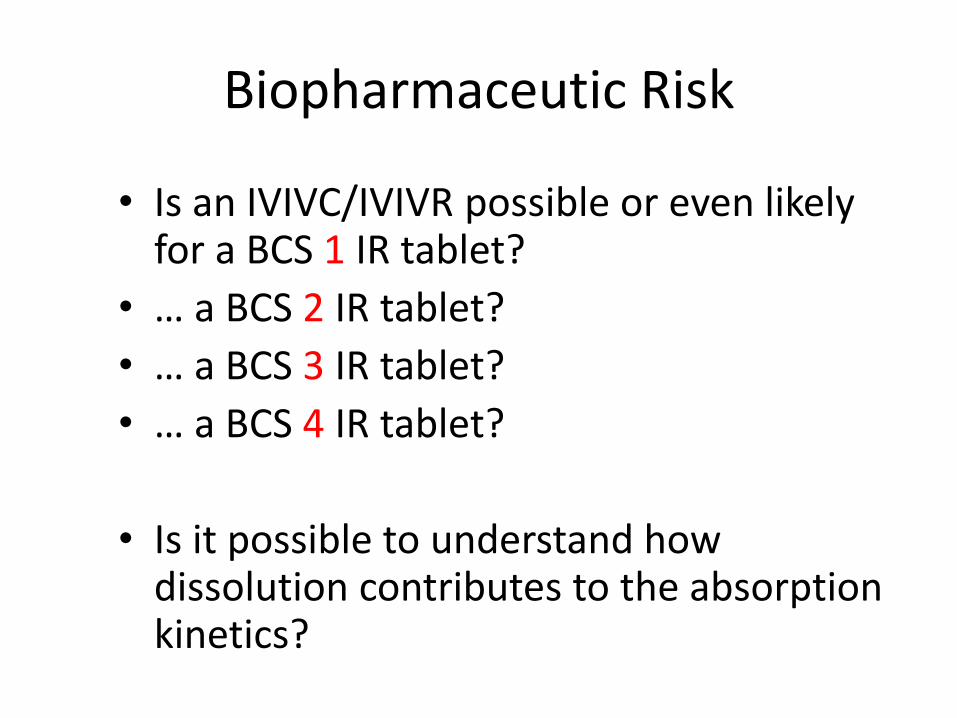
Biopharmaceutic Risk
• Is an IVIVC/IVIVR possible or even likely for a BCS 1 IR tablet?
• … a BCS 2 IR tablet?
• … a BCS 3 IR tablet?
• … a BCS 4 IR tablet?
• Is it possible to understand how dissolution contributes to the absorption kinetics?
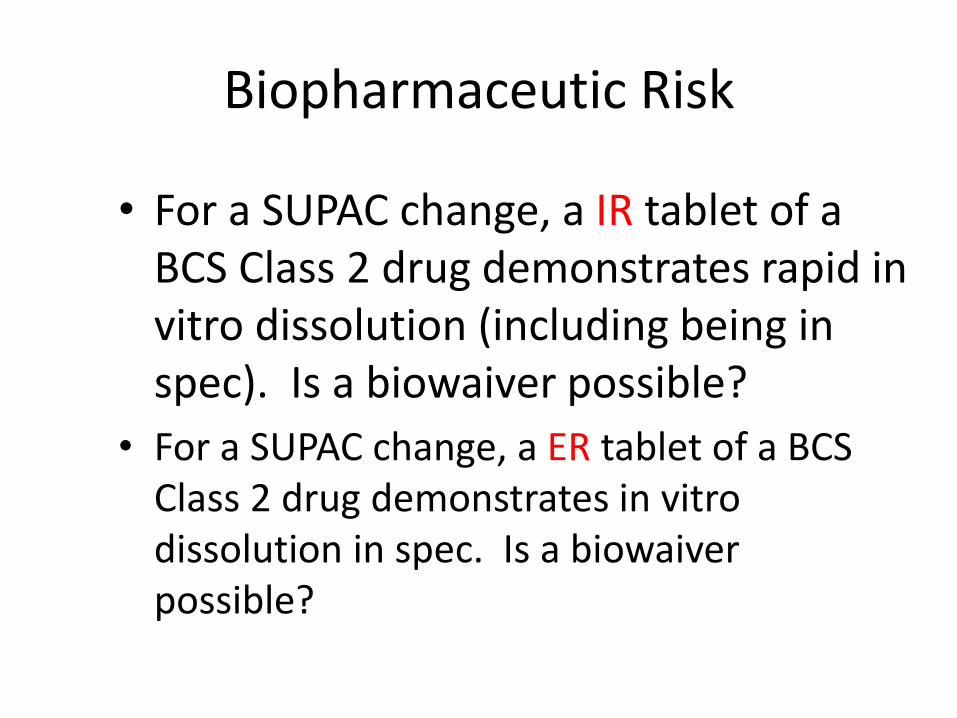
Biopharmaceutic Risk
• For a SUPAC change, a IR tablet of a BCS Class 2 drug demonstrates rapid in vitro dissolution (including being in spec). Is a biowaiver possible?
• For a SUPAC change, a ER tablet of a BCS Class 2 drug demonstrates in vitro dissolution in spec. Is a biowaiver possible?
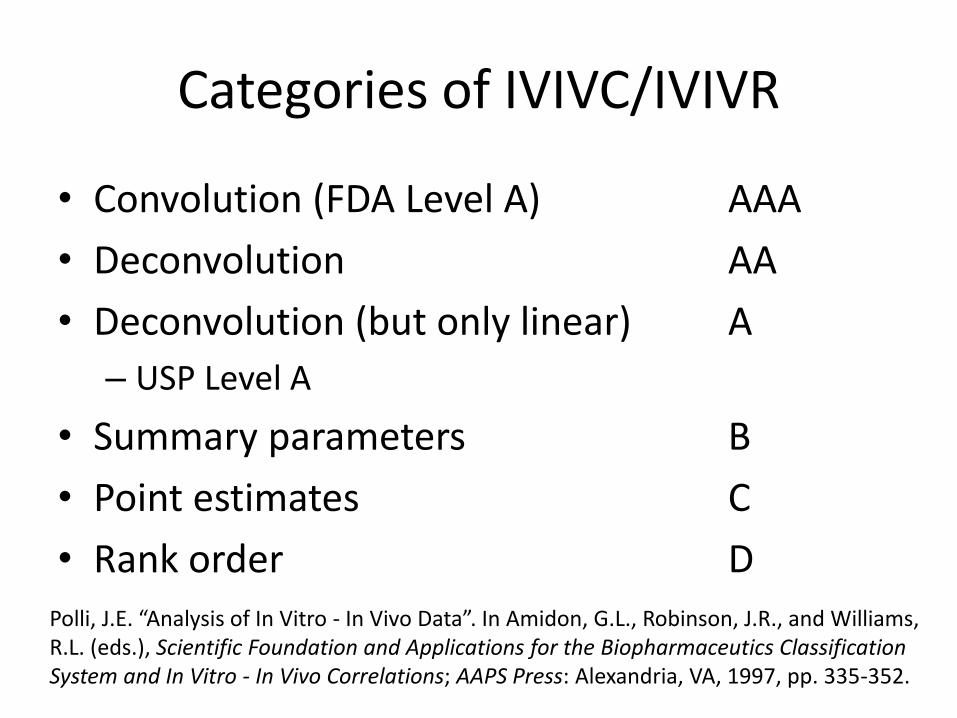
Categories of IVIVC/IVIVR
• Convolution (FDA Level A) AAA
• Deconvolution AA
• Deconvolution (but only linear) A
– USP Level A
• Summary parameters B
• Point estimates C
• Rank order D
Polli, J.E. “Analysis of In Vitro - In Vivo Data”. In Amidon, G.L., Robinson, J.R., and Williams, R.L. (eds.), Scientific Foundation and Applications for the Biopharmaceutics Classification System and In Vitro - In Vivo Correlations; AAPS Press: Alexandria, VA, 1997, pp. 335-352.

Selection of IVIVC Approach
interested in drug absorption
interested in overall pharmacokinetics
Level AA (deconvolution-based)
Level AAA (convolution-based)
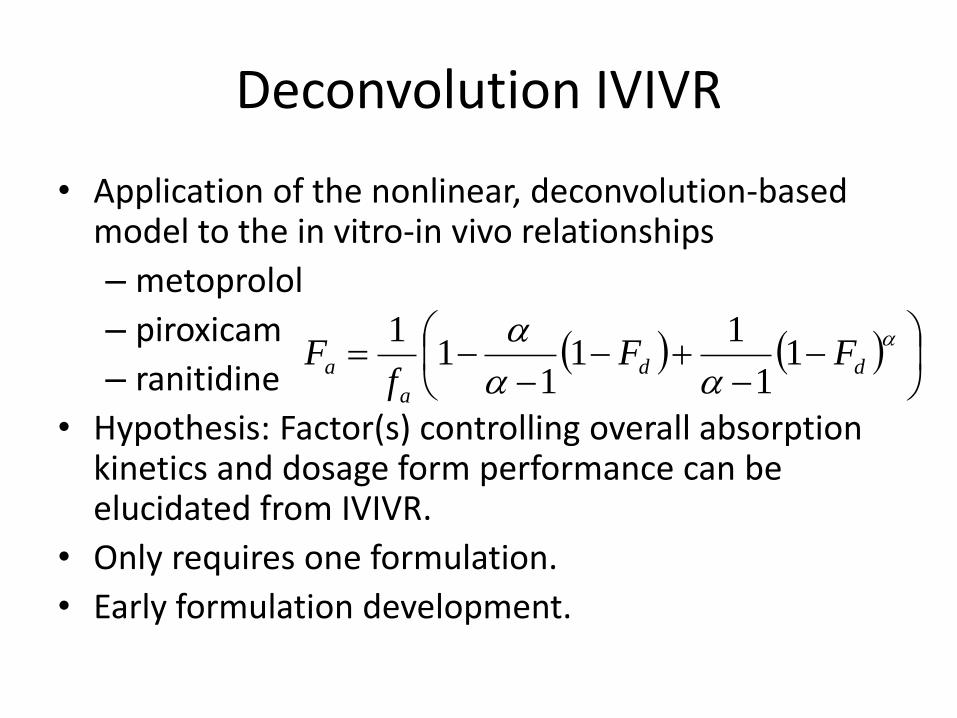
Deconvolution IVIVR
• Application of the nonlinear, deconvolution-based model to the in vitro-in vivo relationships
– metoprolol
– piroxicam
– ranitidine
• Hypothesis: Factor(s) controlling overall absorption kinetics and dosage form performance can be elucidated from IVIVR.
• Only requires one formulation.
• Early formulation development.
dd
a
a FFf
F 11
11
11
1
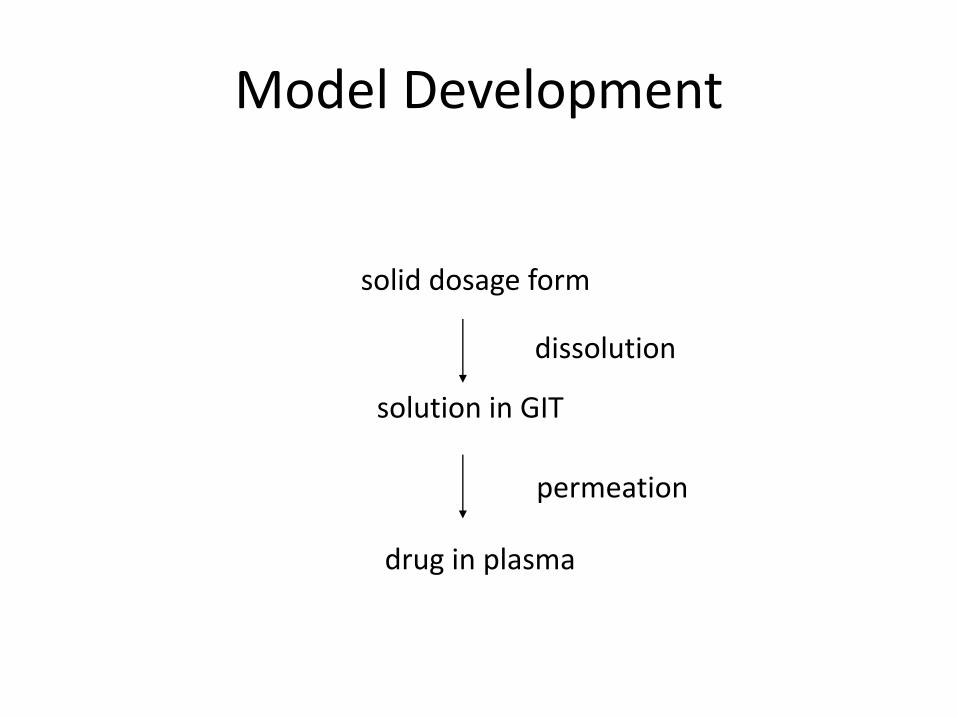
Model Development
solid dosage form
solution in GIT
drug in plasma
dissolution
permeation
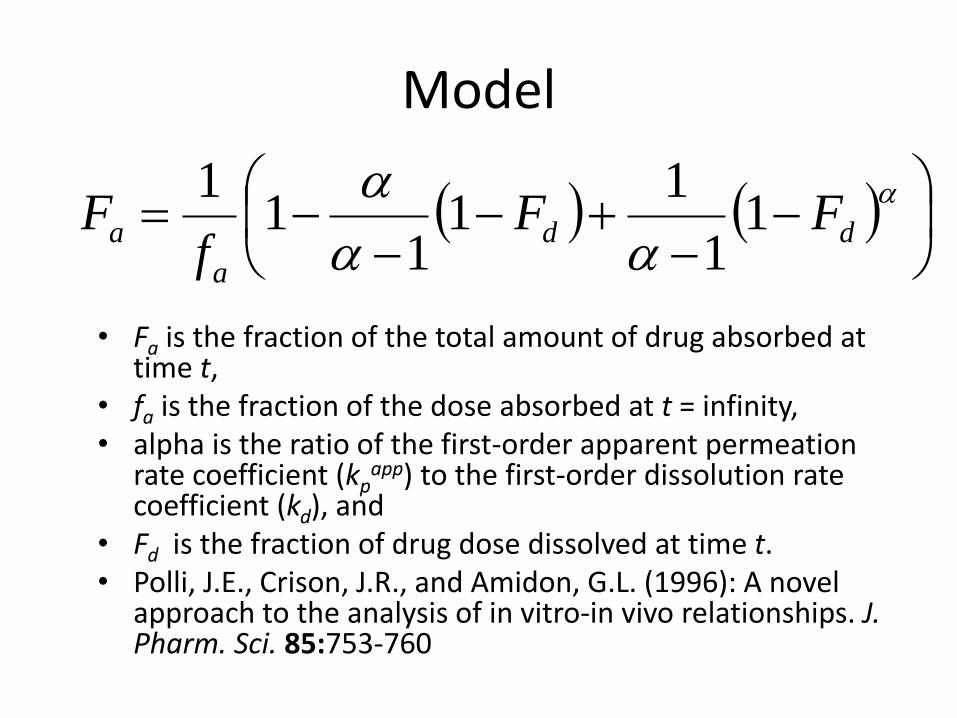
Model
• Fa is the fraction of the total amount of drug absorbed at time t,
• fa is the fraction of the dose absorbed at t = infinity, • alpha is the ratio of the first-order apparent permeation
rate coefficient (kpapp) to the first-order dissolution rate
coefficient (kd), and • Fd is the fraction of drug dose dissolved at time t. • Polli, J.E., Crison, J.R., and Amidon, G.L. (1996): A novel
approach to the analysis of in vitro-in vivo relationships. J. Pharm. Sci. 85:753-760
dd
a
a FFf
F 11
11
11
1

Model Assumptions
• Only dissolution and permeation
– first-order dissolution (kd)
• Fdin vitro = Fd
in vivo = Fd
– first-order permeation (kp)
• Assumptions in the determination of Fa
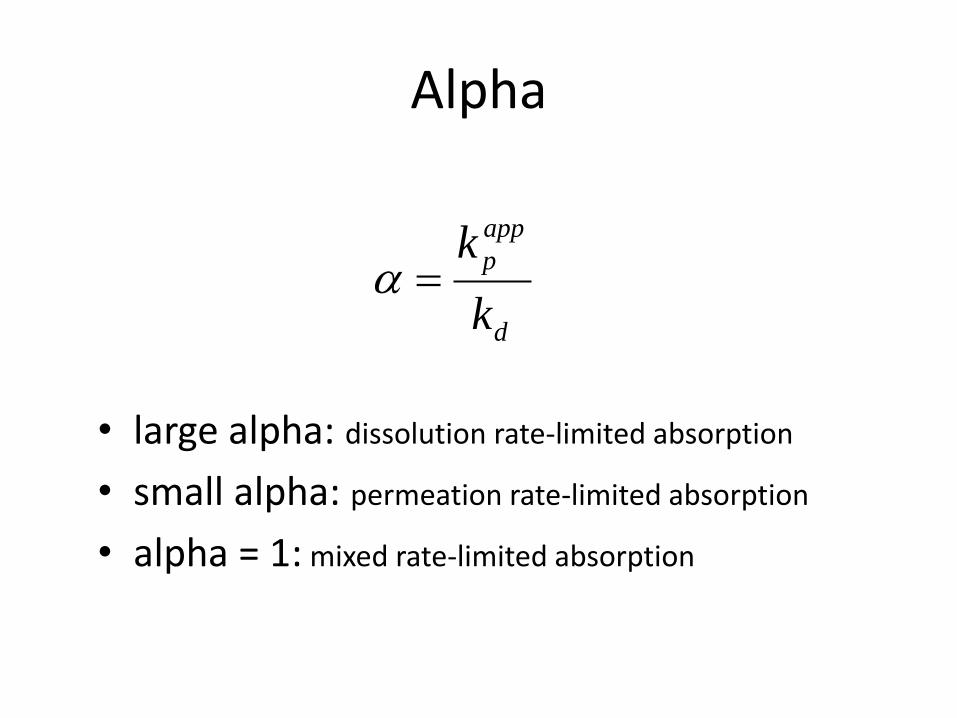
Alpha
• large alpha: dissolution rate-limited absorption
• small alpha: permeation rate-limited absorption
• alpha = 1: mixed rate-limited absorption
d
app
p
k
k
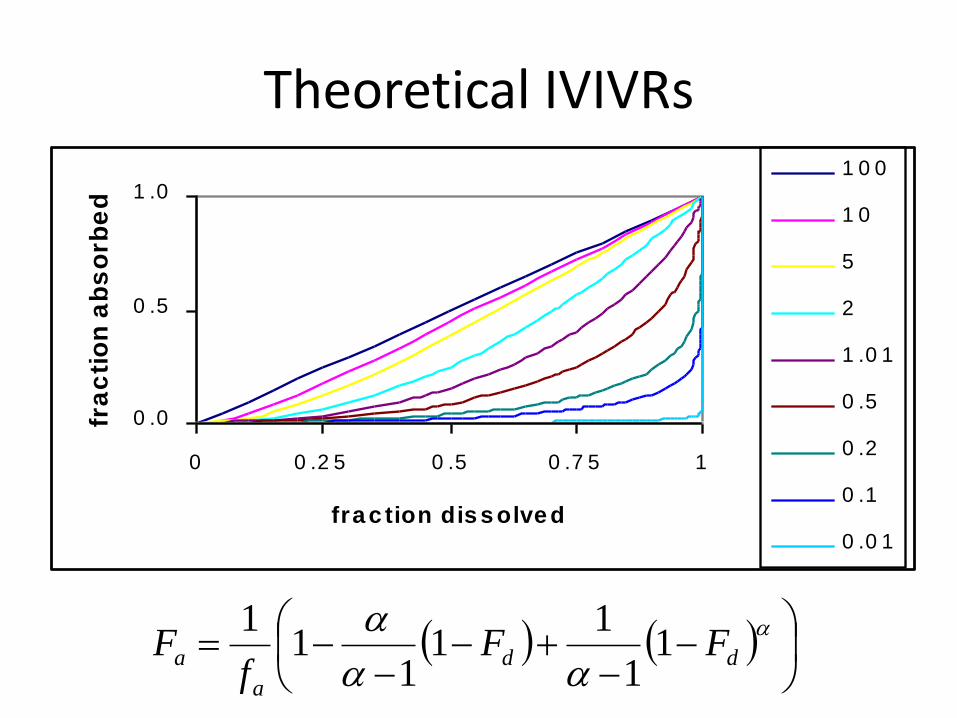
Theoretical IVIVRs
dd
a
a FFf
F 11
11
11
1
0 .0
0 .5
1 .0
0 0 .2 5 0 .5 0 .7 5 1
fra c tion dis s olve d
fra
cti
on
ab
so
rbe
d
1 0 0
1 0
5
2
1 .0 1
0 .5
0 .2
0 .1
0 .0 1
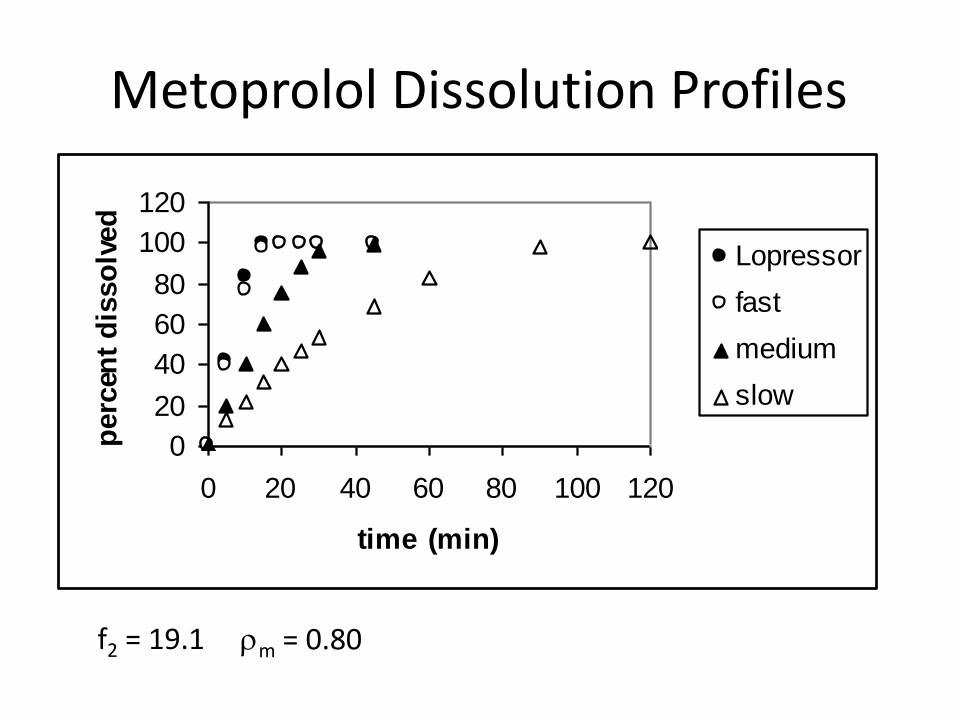
Metoprolol Dissolution Profiles
f2 = 19.1
rm = 0.80
0
20
40
60
80
100
120
0 20 40 60 80 100 120
time (min)
perc
ent
dis
so
lved
Lopressor
fast
medium
slow
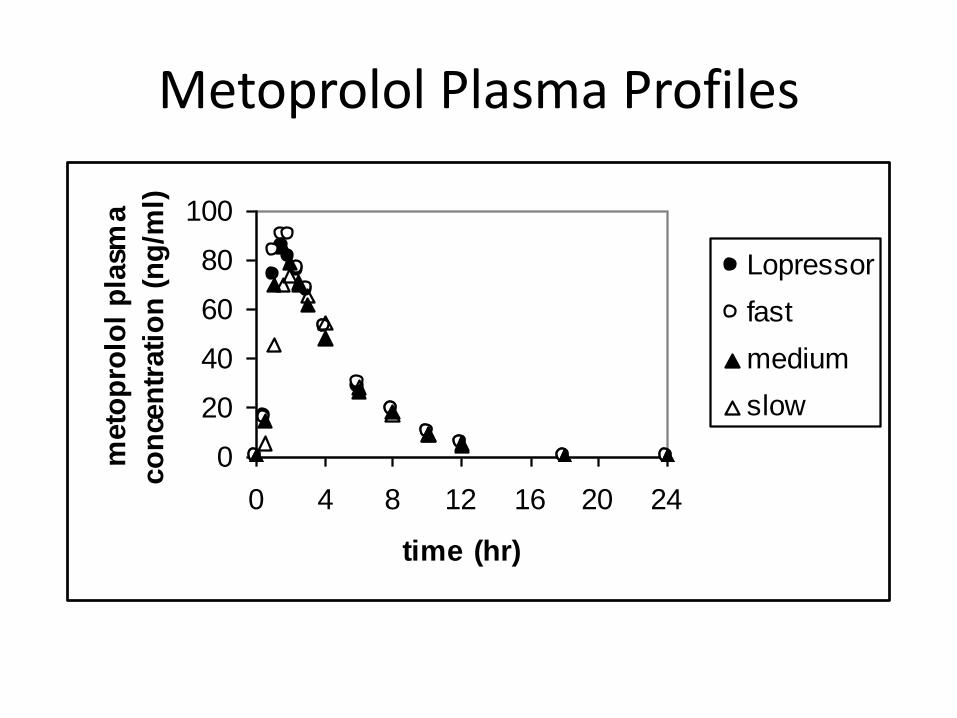
Metoprolol Plasma Profiles
0
20
40
60
80
100
0 4 8 12 16 20 24
time (hr)
meto
pro
lol
pla
sma
co
nce
ntr
ati
on
(n
g/m
l)
Lopressor
fast
medium
slow

Metoprolol IVIVRs
0
0.2
0.4
0.6
0.8
1
0 0.2 0.4 0.6 0.8 1
fraction metoprolol dissolved
fracti
on
met
op
rolo
l
ab
sorb
ed
Lopressor
fast
medium
slow
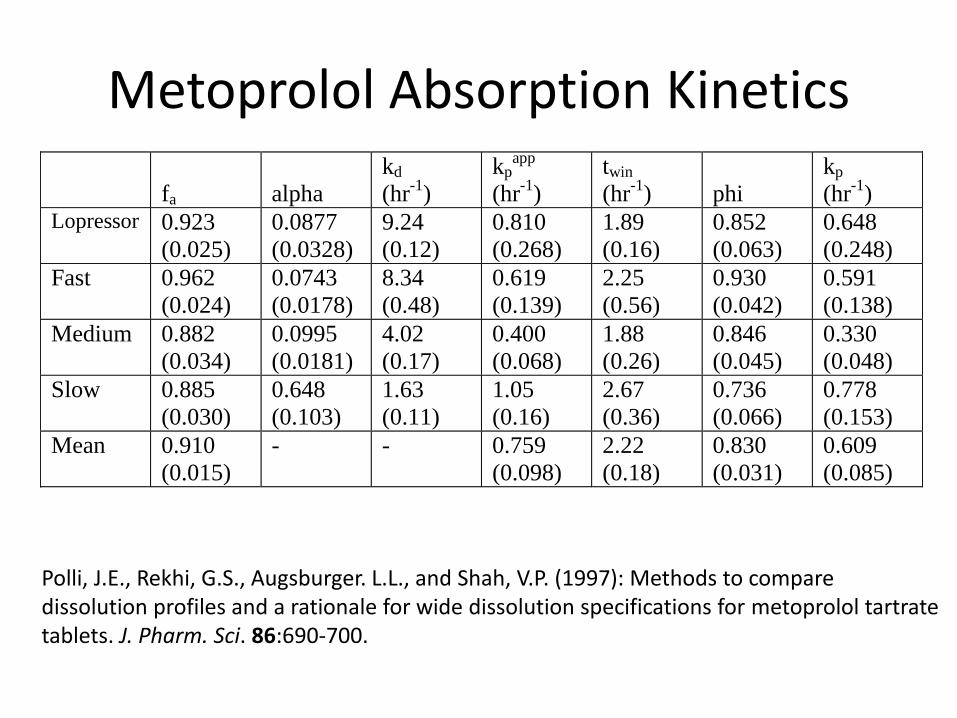
Metoprolol Absorption Kinetics
fa
alpha
kd
(hr-1
)
kpapp
(hr-1
)
twin
(hr-1
)
phi
kp
(hr-1
) Lopressor 0.923
(0.025)
0.0877
(0.0328)
9.24
(0.12)
0.810
(0.268)
1.89
(0.16)
0.852
(0.063)
0.648
(0.248)
Fast 0.962
(0.024)
0.0743
(0.0178)
8.34
(0.48)
0.619
(0.139)
2.25
(0.56)
0.930
(0.042)
0.591
(0.138)
Medium 0.882
(0.034)
0.0995
(0.0181)
4.02
(0.17)
0.400
(0.068)
1.88
(0.26)
0.846
(0.045)
0.330
(0.048)
Slow 0.885
(0.030)
0.648
(0.103)
1.63
(0.11)
1.05
(0.16)
2.67
(0.36)
0.736
(0.066)
0.778
(0.153)
Mean 0.910
(0.015)
- - 0.759
(0.098)
2.22
(0.18)
0.830
(0.031)
0.609
(0.085)
Polli, J.E., Rekhi, G.S., Augsburger. L.L., and Shah, V.P. (1997): Methods to compare dissolution profiles and a rationale for wide dissolution specifications for metoprolol tartrate tablets. J. Pharm. Sci. 86:690-700.
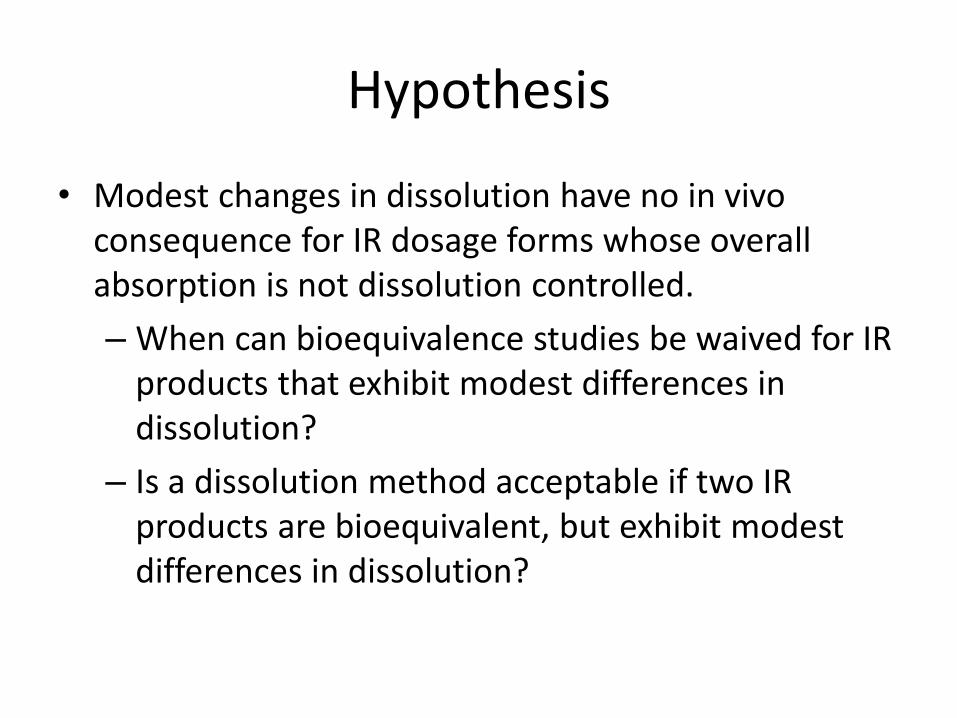
Hypothesis
• Modest changes in dissolution have no in vivo consequence for IR dosage forms whose overall absorption is not dissolution controlled.
– When can bioequivalence studies be waived for IR products that exhibit modest differences in dissolution?
– Is a dissolution method acceptable if two IR products are bioequivalent, but exhibit modest differences in dissolution?
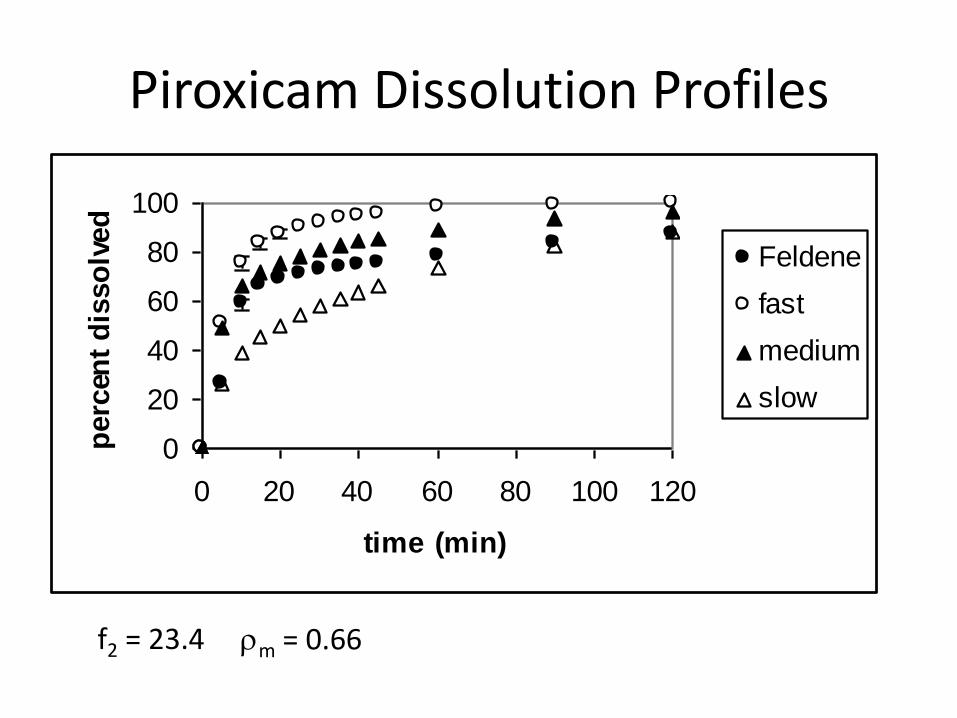
Piroxicam Dissolution Profiles
f2 = 23.4 rm = 0.66
0
20
40
60
80
100
0 20 40 60 80 100 120
time (min)
perc
ent
dis
so
lved
Feldene
fast
medium
slow
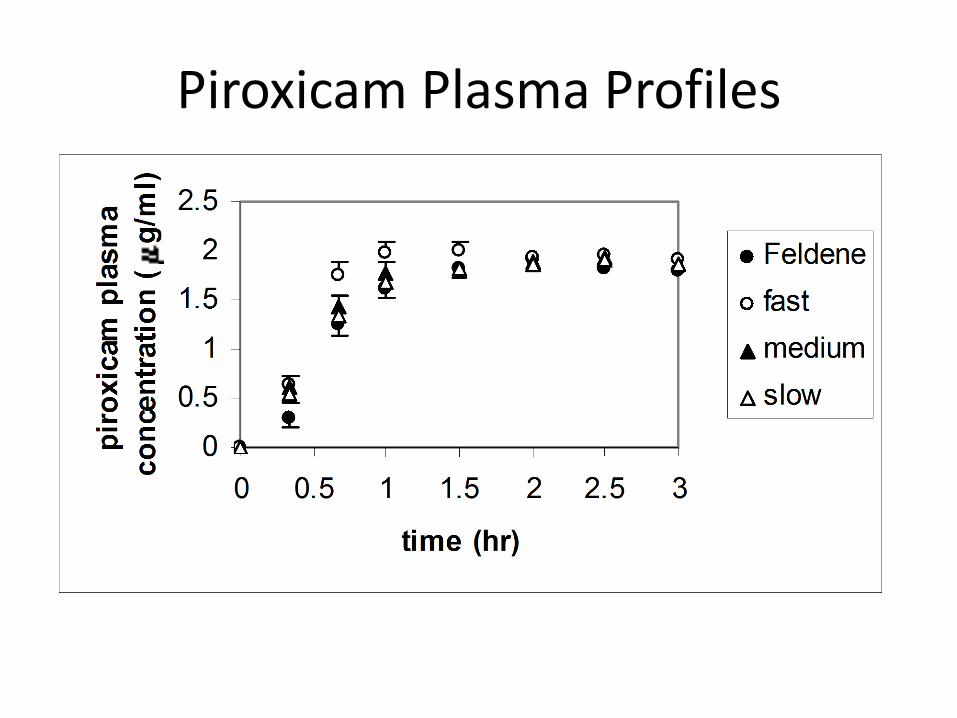
Piroxicam Plasma Profiles
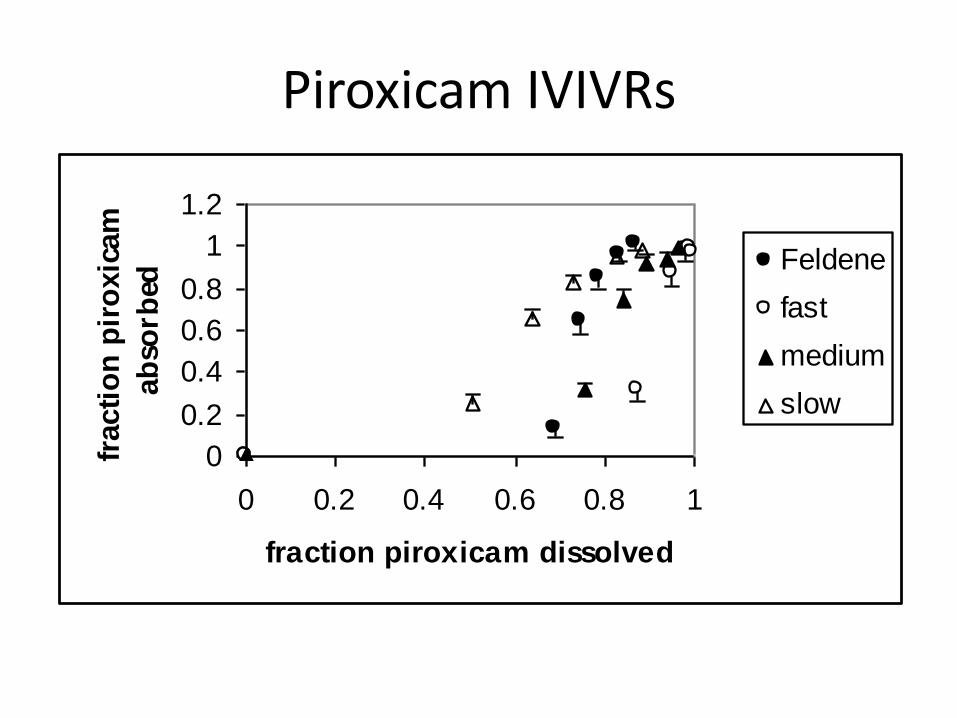
Piroxicam IVIVRs
0
0.2
0.4
0.6
0.8
1
1.2
0 0.2 0.4 0.6 0.8 1
fraction piroxicam dissolved
fracti
on
pir
oxic
am
ab
sorb
ed
Feldene
fast
medium
slow
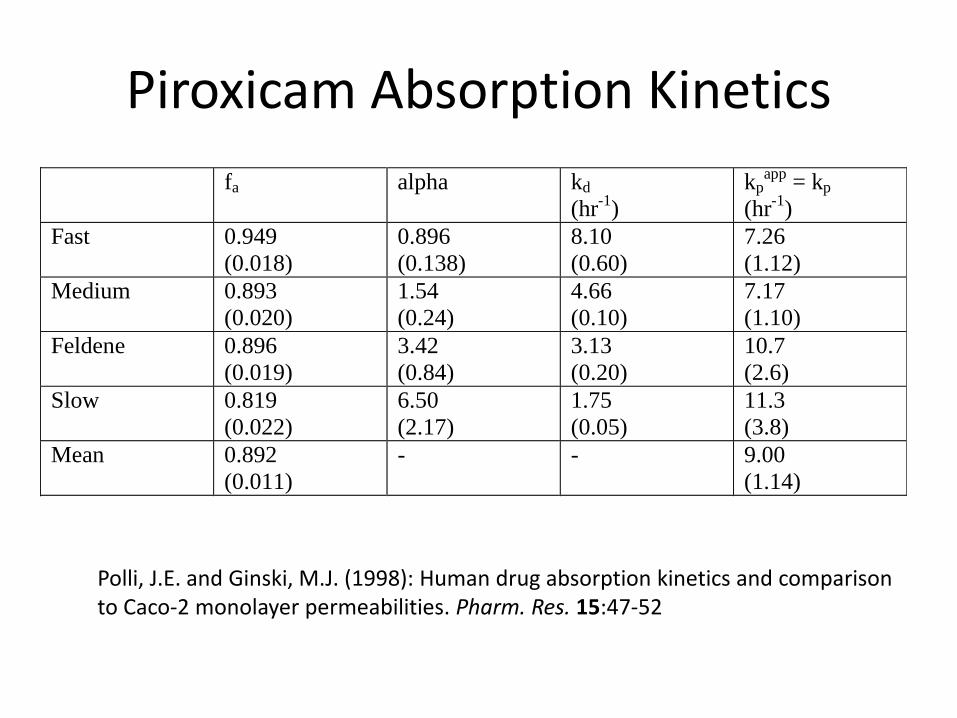
Piroxicam Absorption Kinetics
fa alpha kd
(hr-1
)
kpapp
= kp
(hr-1
)
Fast 0.949
(0.018)
0.896
(0.138)
8.10
(0.60)
7.26
(1.12)
Medium 0.893
(0.020)
1.54
(0.24)
4.66
(0.10)
7.17
(1.10)
Feldene 0.896
(0.019)
3.42
(0.84)
3.13
(0.20)
10.7
(2.6)
Slow 0.819
(0.022)
6.50
(2.17)
1.75
(0.05)
11.3
(3.8)
Mean 0.892
(0.011)
- - 9.00
(1.14)
Polli, J.E. and Ginski, M.J. (1998): Human drug absorption kinetics and comparison to Caco-2 monolayer permeabilities. Pharm. Res. 15:47-52
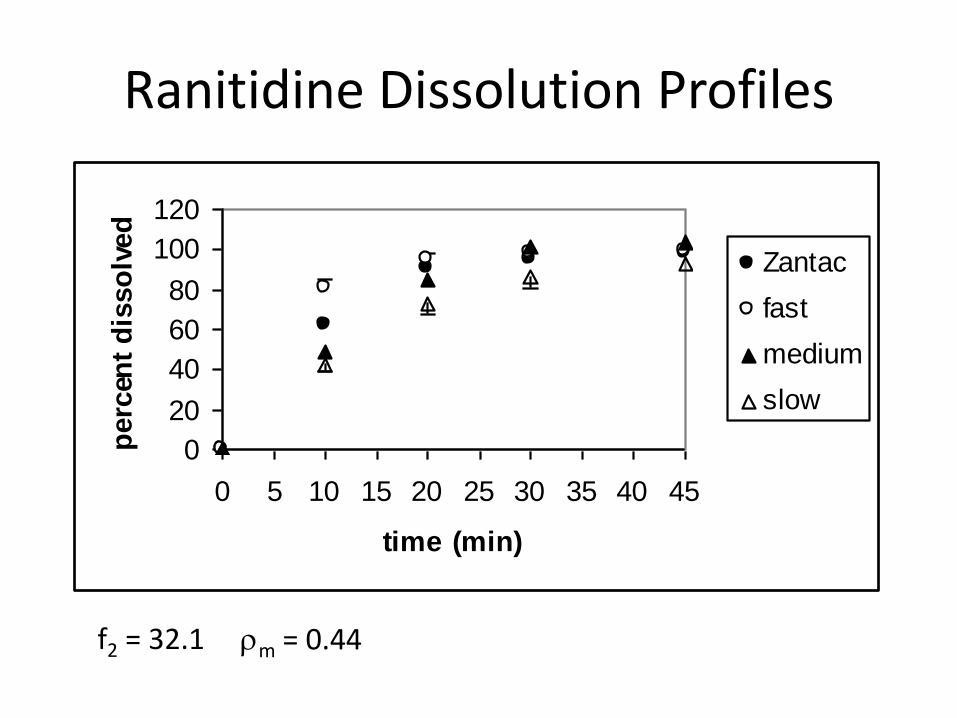
Ranitidine Dissolution Profiles
f2 = 32.1 rm = 0.44
0
20
40
60
80
100
120
0 5 10 15 20 25 30 35 40 45
time (min)
perc
ent
dis
so
lved
Zantac
fast
medium
slow

Ranitidine Plasma Profiles

Ranitidine IVIVRs
0
0.2
0.4
0.6
0.8
1
1.2
0 0.2 0.4 0.6 0.8 1
fraction ranitidine dissolved
fracti
on
ran
itid
ine
ab
sorb
ed
Zantac
fast
medium
slow
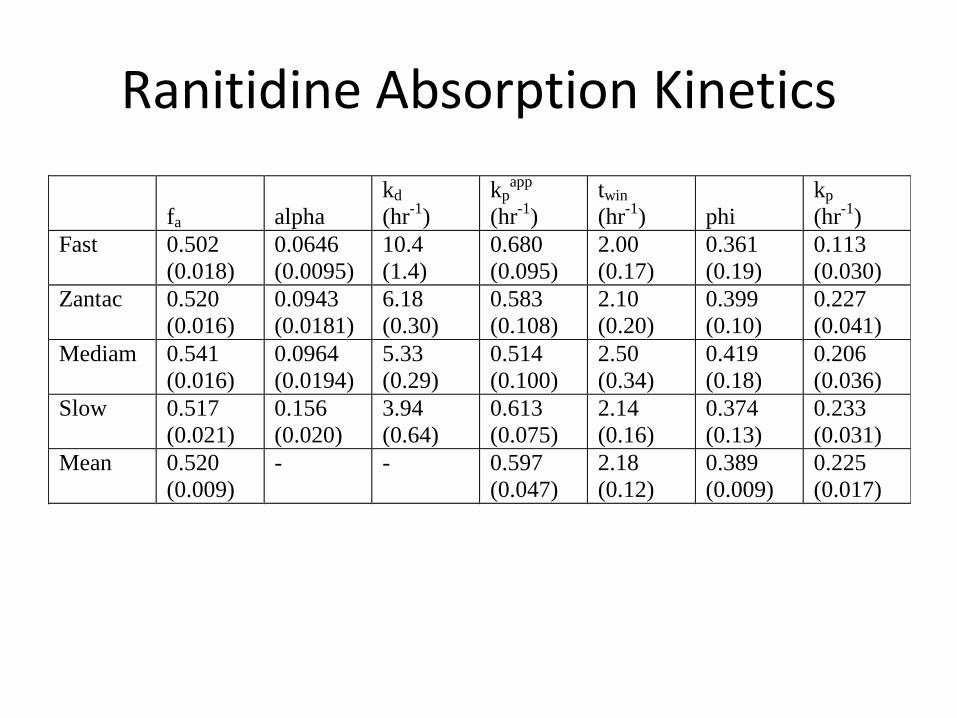
Ranitidine Absorption Kinetics
fa
alpha
kd
(hr-1
)
kpapp
(hr-1
)
twin
(hr-1
)
phi
kp
(hr-1
)
Fast 0.502
(0.018)
0.0646
(0.0095)
10.4
(1.4)
0.680
(0.095)
2.00
(0.17)
0.361
(0.19)
0.113
(0.030)
Zantac 0.520
(0.016)
0.0943
(0.0181)
6.18
(0.30)
0.583
(0.108)
2.10
(0.20)
0.399
(0.10)
0.227
(0.041)
Mediam 0.541
(0.016)
0.0964
(0.0194)
5.33
(0.29)
0.514
(0.100)
2.50
(0.34)
0.419
(0.18)
0.206
(0.036)
Slow 0.517
(0.021)
0.156
(0.020)
3.94
(0.64)
0.613
(0.075)
2.14
(0.16)
0.374
(0.13)
0.233
(0.031)
Mean 0.520
(0.009)
- - 0.597
(0.047)
2.18
(0.12)
0.389
(0.009)
0.225
(0.017)

IVIVR Analysis and Permeability
drug P (cm/sec)
x 106
kp (pred)
(hr-1)
kp (obs)
(hr-1)
piroxicam 91.3
( 1.2)
3.49
( 0.05)
9.00
( 1.14)
metoprolol 10.7
( 0.3)
0.410
( 0.011)
0.609
( 0.085)
ranitidine 0.425
( 0.058)
0.0163
( 0.0022)
0.225
( 0.017)
Summary
• The factor(s) controlling overall absorption kinetics and dosage form performance can be elucidated from in vitro dissolution - in vivo absorption relationships.
– kinetic importance of dissolution
– f2 criteria (or other metrics)
– connection to Caco-2 permeability
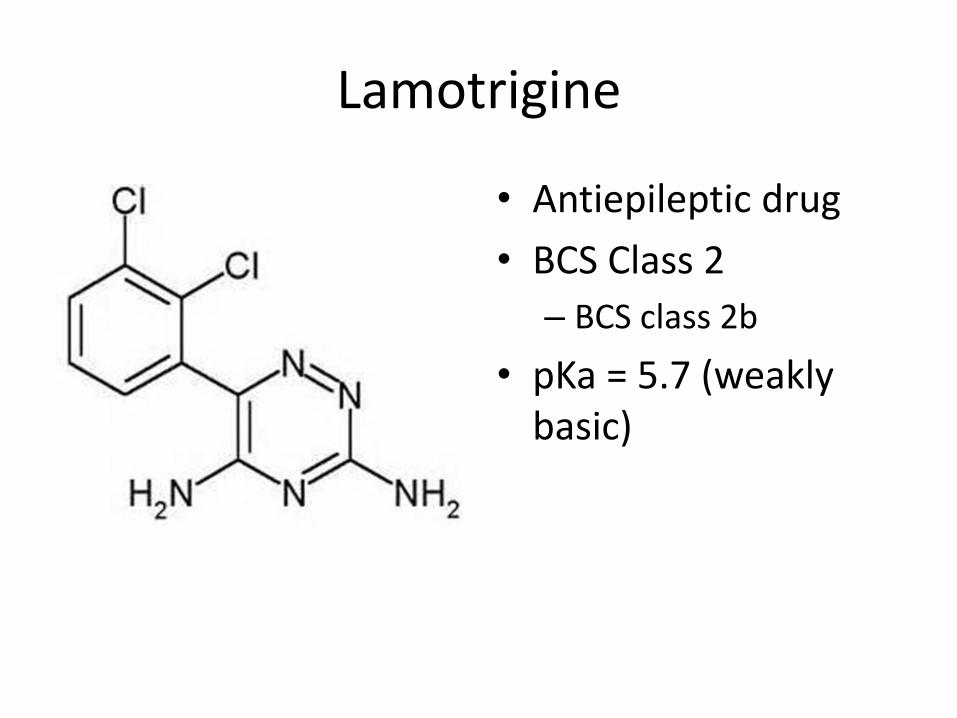
Lamotrigine
• Antiepileptic drug
• BCS Class 2
– BCS class 2b
• pKa = 5.7 (weakly basic)
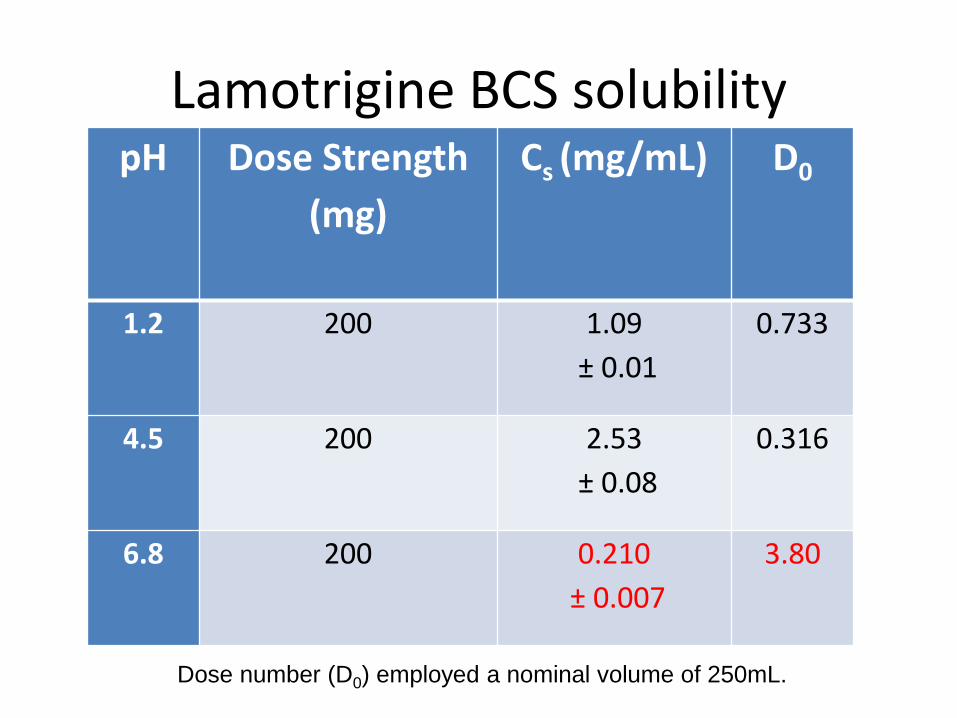
Lamotrigine BCS solubility pH Dose Strength
(mg)
Cs (mg/mL) D0
1.2 200 1.09
± 0.01
0.733
4.5 200 2.53
± 0.08
0.316
6.8 200 0.210
± 0.007
3.80
Dose number (D0) employed a nominal volume of 250mL.
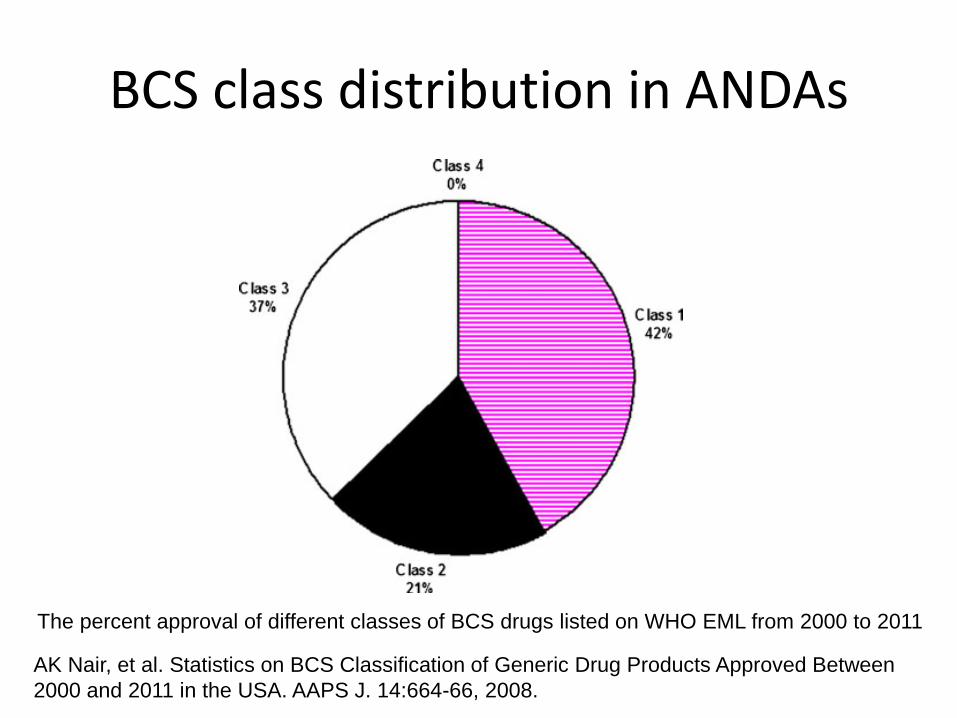
BCS class distribution in ANDAs
The percent approval of different classes of BCS drugs listed on WHO EML from 2000 to 2011
AK Nair, et al. Statistics on BCS Classification of Generic Drug Products Approved Between
2000 and 2011 in the USA. AAPS J. 14:664-66, 2008.
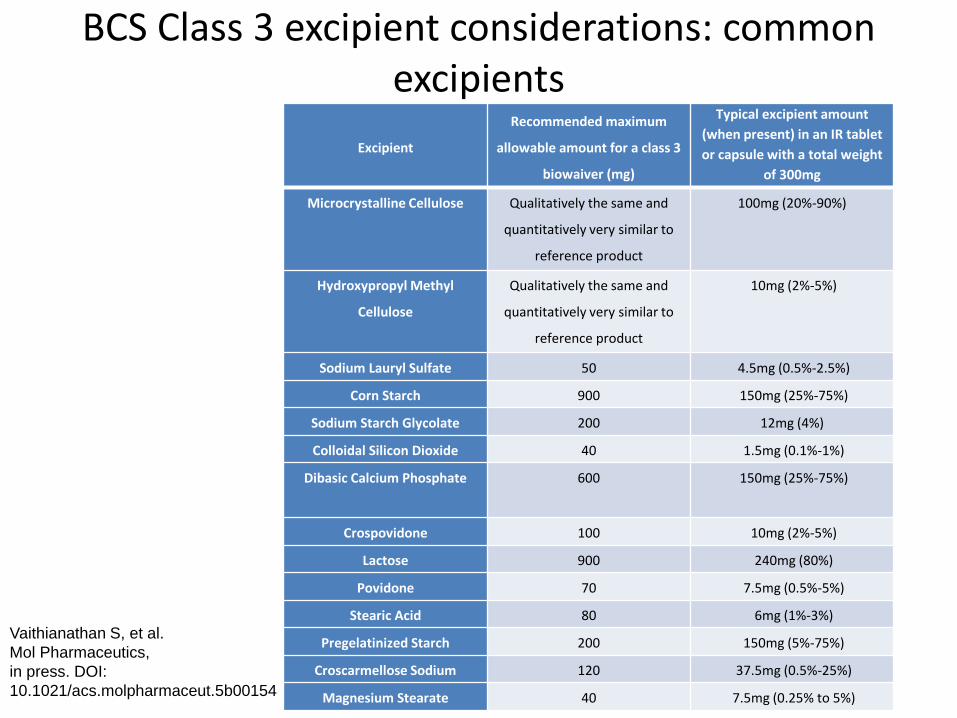
BCS Class 3 excipient considerations: common excipients
Excipient
Recommended maximum
allowable amount for a class 3
biowaiver (mg)
Typical excipient amount
(when present) in an IR tablet
or capsule with a total weight
of 300mg
Microcrystalline Cellulose Qualitatively the same and
quantitatively very similar to
reference product
100mg (20%-90%)
Hydroxypropyl Methyl
Cellulose
Qualitatively the same and
quantitatively very similar to
reference product
10mg (2%-5%)
Sodium Lauryl Sulfate 50 4.5mg (0.5%-2.5%)
Corn Starch 900 150mg (25%-75%)
Sodium Starch Glycolate 200 12mg (4%)
Colloidal Silicon Dioxide 40 1.5mg (0.1%-1%)
Dibasic Calcium Phosphate 600 150mg (25%-75%)
Crospovidone 100 10mg (2%-5%)
Lactose 900 240mg (80%)
Povidone 70 7.5mg (0.5%-5%)
Stearic Acid 80 6mg (1%-3%)
Pregelatinized Starch 200 150mg (5%-75%)
Croscarmellose Sodium 120 37.5mg (0.5%-25%)
Magnesium Stearate 40 7.5mg (0.25% to 5%)
Vaithianathan S, et al.
Mol Pharmaceutics,
in press. DOI:
10.1021/acs.molpharmaceut.5b00154
Topics
• Current issues with in vitro dissolution
• IVIVC, IVIVR, and biopharmaceutic risk
• Deconvolution IVIVR method
• BCS Class 2 (for weakly basic drugs)
• BCS Class 3 excipient considerations