opportunities to transform the future of coal through
TRANSCRIPT

Opportunities to Transform the Future of Coal through TechnologyDaniel P. Connell
2020 International Pittsburgh Coal ConferenceSeptember 8, 2020

Disclaimer
2
This presentation contains statements, estimates and projections which are forward-looking statements (as defined in Section 21E of theSecurities Exchange Act of 1934, as amended). Statements that are not historical are forward-looking, and include, without limitation, projectionsand estimates concerning the timing and success of specific projects and the future production, revenues, income and capital spending of CONSOLEnergy, Inc. (“CEIX”) and CONSOL Coal Resources LP (“CCR,” and together with CEIX, “we,” “us,” or “our”). When we use the words “anticipate,”“believe,” “could,” “continue,” “estimate,” “expect,” “intend,” “may,” “plan,” “predict,” “project,” “should,” “will,” or their negatives, or othersimilar expressions, the statements which include those words are usually forward-looking statements. These forward-looking statements involverisks and uncertainties that could cause actual results and outcomes to differ materially from results and outcomes expressed in or implied by ourforward-looking statements. Accordingly, investors should not place undue reliance on forward-looking statements as a prediction of future actualresults. We have based these forward-looking statements on our current expectations and assumptions about future events. While ourmanagement considers these expectations and assumptions to be reasonable, they are inherently subject to significant business, economic,competitive, regulatory and other risks, contingencies and uncertainties, most of which are difficult to predict and many of which are beyond ourcontrol. Factors that could cause future actual results to differ materially from those made or implied by the forward-looking statements includerisks, contingencies and uncertainties that are described in detail under the captions “Forward-Looking Statements” and “Risk Factors” in ourpublic filings with the Securities and Exchange Commission. The forward-looking statements in this presentation speak only as of the date of thispresentation; we disclaim any obligation to update the statements, and we caution you not to rely on them unduly.

◼ Publicly-traded (NYSE:CEIX) coal producer and exporter based in
Canonsburg, PA
◼ Assets include:
− ~90% economic ownership of the Pennsylvania Mining Complex (PAMC)(1)
− CONSOL Marine Terminal (CMT) in Baltimore, MD
− Itmann Mine Project in Wyoming County, WV
− 1.5 billion tons of undeveloped coal reserves(2) in the Northern
Appalachian, Central Appalachian, and Illinois Basins
◼ PAMC is the largest underground coal mining complex in North America,
consisting of the Bailey, Enlow Fork, and Harvey coal mines and related
infrastructure
− 669 mm tons of reserves in the Pittsburgh No. 8 coal seam(3)
− Five longwalls and 15-17 continuous mining sections
− Central prep plant (8,200 raw tons/h) and rail loadout (9,000 clean tons/h)
− 2019 production = 27.3 million tons
◼ CMT transloaded 12.6 million tons of coal in 2019
◼ Itmann began development mining in April 2020 (low-vol met coal)
Overview
(1) Consists of 75% undivided interest in PAMC, plus GP ownership and ~60% LP interest in CONSOL Coal Resources LP (NYSE:CCR), which owns the remaining 25% interest in PAMC.
(2) Undeveloped reserves do not include any of the 669 million tons of reserves associated with PAMC or 21 million tons of reserves associated with Itmann
(3) As of December 31, 2019.
About CONSOL Energy Inc.
3

Highly-Diversified Portfolio Provides Stability
4
PJM Southeast MISO Industrial/Met
In 2019, the Company sold PAMC coal to 23 domestic power plants located in 13 states, and to thermal and
metallurgical end-users located across five continents.
41%
57%
2%
Industrial/MetCustomers
Regulated PowerPlants
Merchant(Unregulated)Power Plants
Other Asia South AmericaEurope Africa India Canada/North America
Annual coal sales
2015A 2016A 2017A 2018A 2019A
Domestic Export Thermal Export Met
27.3
22.9 24.6
26.1
27.7
2019A Export thermal 2019A Export met
2019A Domestic
(million tons)

Corporate Sustainability Approach
5
◼ PA Mining Complex’s MSHA reportable incident rate was 40% lower than the industry average from 2015 - 20191
◼ 2019 marked 6th consecutive year with an environmental compliance record exceeding 99.9%1
◼ Board-level HSE Committee oversees procedures for identifying, assessing, monitoring, and managing ESG risks
◼ Became a Bettercoal Supplier in 2019 – focused on continuous improvement of sustainability performance
Our Legacy is Built on Safety, Compliance, and Continuous Improvement
Our Future is Based on Efficiency, Technology, and Innovation
(1) CONSOL management and corporate sustainability report.
(2) B Riley FBR, Can Coal Miners Weather the ESG Storm?, Industry Update, May 13, 2019.
(3) Thomson Reuters, Transparency: The Pathway to Leadership for Carbon Intensive Businesses, February, 2019.
◼ Innovative technologies deployed at PA Mining Complex directly relate to ESG aspects of greatest impact to CONSOL
◼ Partnerships with Komatsu Mining Corporation, Environmental Commodities Corporation, and OMNIS Bailey, LLC
◼ Recently recognized for sector leadership in ESG disclosures, transparency, and strategic initiatives2,3
ESG Aspects of Greatest Stakeholder Concern and Impact to CONSOL

The U.S. Coal Reserve Base Remains a Valuable, Strategic National Resource
6
6
Source: BP Statistical Review of World Energy, June 2020
33%
27%
24%
4%
7%5%
World Primary Energy Consumption (2019)
Oil
Coal
Natural Gas
Nuclear
Hydroelectricity
Renewables 0%
10%
20%
30%
40%
50%
60%
70%
80%
0
10
20
30
40
50
60
70
80
90
China India US Japan RussianFed.
SouthAfrica
SouthKorea
Germany
Exajo
ule
s
Top Consumers of Coal (2019)
Coal Consumption
Coal % of Primary Energy
0%
5%
10%
15%
20%
25%
0
50
100
150
200
250
300
US RussianFed.
Australia China India
Billio
n t
on
nes
Proved Coal Reserves (2019)
Proved Reserves
% of World Total
0
50
100
150
200
250
300
350
400
450
Coal Oil Natural Gas
Years
of
Pro
ved
Reserv
es
Reserve-to-Production Ratio (2019)
US World
Coal remains the second largest primary energy source in the world, and the U.S. holds the world’s richest coal reserve base.
We must ensure that technology is in place to take advantage of this valuable national resource.

Putting The Importance of the Coal Mining Industry in Perspective
7
$0 $200 $400 $600 $800 $1,000
0 1 2 3 4 5 6 7 8
Potash
Bauxite
Diamonds
Silver
Nickel
Zinc
Gold
Copper
Iron Ore
Coal
Value (Billion $US)
Production (Billion tonnes)
The Global Mining Sector (2017)
Production (BTs)
Value ($B)
Sources: S&P Global Market Intelligence, ABB Velocity Suite
Coal is by far the most valuable mined commodity in the world, with an annual value more than 4x greater than the next
largest commodity (iron ore). As an industry, we need to invest in new talent and new technology.

EIA Annual Energy Outlook 2020
8 Source: U.S. Energy Information Administration (EIA), Annual Energy Outlook 2020, January 2020; U.S. EIA, Short-Term Energy Outlook, August 11, 2020
Coal is projected to remain an important part of the U.S. energy mix in the future, though the industry must reinvent itself to
overcome the demand gap being created by natural gas and renewables.
0
100
200
300
400
500
600
700
800
0%
5%
10%
15%
20%
25%
30%
35%
40%
2019 2021 2023 2025 2027 2029 2031 2033 2035 2037 2039 2041 2043 2045 2047 2049
U.S
. C
oa
l P
rod
uctio
n (
mm
to
ns)
Sh
are
of U
.S. N
et
Ele
ctr
icity G
en
era
tio
n
Reference Case
Coal (%) Natural Gas (%) Nuclear (%) Renewables (%) Coal Production
* Dotted lines represent updated projections from EIA Short-Term Energy Outlook, August 2020

Coal R&D Requires a Holistic Approach
9
Coal Mine
Coal Preparation Plant
Product Transportation
Power Plant Fixed & Variable O&M
Ash + Power PlantByproductsAlternative
UtilizationMarkets
Prep Plant Refuse
RawTons
CleanTons
CleanTons
Rock and Coal Ultra Fines
Emission Controls
$14$2
$1
$4
$2
$11 $4
Illustrative Example – Eastern U.S. (All Costs in $/MWh)
Fuel cost (mine + transportation) accounts for more than half of the plant’s total O&M cost, and an even
greater amount of its variable (dispatch) cost
“Upstream” Component: $21
Total Fixed + Variable
O&M Cost to the Grid
$38
$
$
$
$Offsetting Revenue
Opportunities
Delivered coal prices represent the average of 2018 data for NAPP, CAPP, and ILB reported in ABB Velocity Suite. Breakdown of mining, plant, and refuse costs approximated based on industry intelligence. All other assumptions from NETL Cost and Performance Baseline for Fossil Energy Plants Volume 1: Bituminous Coal and Natural Gas to Electricity, Case B11A, 9/24/2019 (NETL-PUB-22638)
Keeping coal competitive requires unlocking value across the entire supply chain, and creating new
value-adding end use applications for coal.

Examples of CONSOL’s Current Coal Technology Initiatives
10
◼ Mining Automation and Efficiency Projects
◼ OMNIS Fine Coal Recovery Project
◼ Advanced Pressurized Fluidized Bed Combustion
with Carbon Capture (DOE Coal FIRST Project)
◼ Coal-to-Products Projects
◼ CFOAM
◼ Coal Plastic Composites

Technological Advances Have Played a Huge Role in theEvolution of the Coal Industry …
11
0
2,000
4,000
6,000
8,000
10,000
12,000
1900 1910 1920 1930 1940 1950 1960 1970 1980 1990 2000 2010
U.S
. C
oal
Min
e P
rod
ucti
vit
y(T
on
s p
er
Em
plo
yee
-Year)
Longwalls with shield
supports introduced
(mid-1970s)
Shuttle cars introduced
(1938)
Continuous miners
introduced (1948)
Growth of large-scale
PRB surface mines
Source: MSHA, EIA, ALFRED, Library of Congress, Modern American Coal Mining Methods and Applications
In 1900, the U.S. produced 270 million tons with 449,000 employees (601 tons/employee-year)
In 2018, the U.S. produced 756 million tons with 83,000 employees (9,144 tons/employee-year)
Coal mining fatalities per year decreased from 1,489 in 1900 to 12 in 2018

0
5
10
15
20
25
30
35
40
45
50
0.0
1.0
2.0
3.0
4.0
5.0
6.0
1999 2000 2001 2002 2003 2004 2005 2006 2007 2008 2009 2010 2011 2012 2013 2014 2015 2016 2017 2018
Pro
du
cti
vit
y -
PR
B S
urf
ace
Min
es
(to
ns/
em
plo
ye
e-h
ou
r)
Pro
du
cti
vit
y -
Un
de
rgro
un
d M
ine
s (t
on
s/e
mp
loye
e-h
ou
r)
Current Longwall Mines (left axis)
Current Non-Longwall Underground Mines (left axis)
Current PRB Surface Mines (right axis)
… But Recent Years have been Relatively Stagnant
12 Source: ABB Velocity Suite, MSHA, NREL, EIA. Only includes mines that produced coal in CY 2018.
Coal industry needs to keep pace with rapidly evolving new technology development/implementation.
-4%
-35%
-37%
20-yr ∆
In Comparison …
New natural gas well productivity per rig in the Appalachian Region has increased from450 Mcf/d in 2007 to 16,357 Mcf/d in 2018
Utility-scale solar PV costs have fallen from $5.52/watt DC in 2010 to $1.13/watt in 2018

R&D Spending in the Mining Sector
13
“… innovation in the mining industry is coming at too sluggish a pace, and the rising costs of extraction and
transportation need to be addressed with new ideas.” Mark Cutifani, CEO, Anglo American
Opportunities for Automation in Underground Coal Mining
14Sources: (1) ABB Velocity Suite, MSHA, Coal Age 2018 U.S. Longwall Census; (2) “Automation Raises Productivity,” Komatsu Mining Corp., November 10, 2016;
(3) CONSOL estimate. Images used with permission from Komatsu Mining Corp.
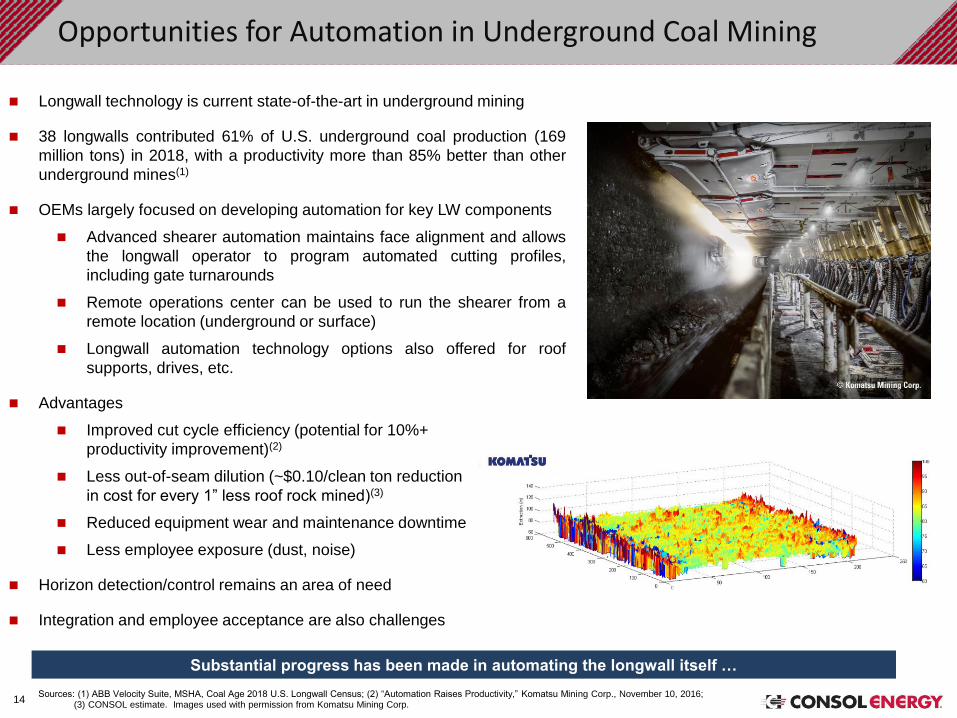
◼ Longwall technology is current state-of-the-art in underground mining
◼ 38 longwalls contributed 61% of U.S. underground coal production (169
million tons) in 2018, with a productivity more than 85% better than other
underground mines(1)
◼ OEMs largely focused on developing automation for key LW components
◼ Advanced shearer automation maintains face alignment and allows
the longwall operator to program automated cutting profiles,
including gate turnarounds
◼ Remote operations center can be used to run the shearer from a
remote location (underground or surface)
◼ Longwall automation technology options also offered for roof
supports, drives, etc.
◼ Advantages
◼ Improved cut cycle efficiency (potential for 10%+
productivity improvement)(2)
◼ Less out-of-seam dilution (~$0.10/clean ton reduction
in cost for every 1” less roof rock mined)(3)
◼ Reduced equipment wear and maintenance downtime
◼ Less employee exposure (dust, noise)
◼ Horizon detection/control remains an area of need
◼ Integration and employee acceptance are also challenges
Substantial progress has been made in automating the longwall itself …
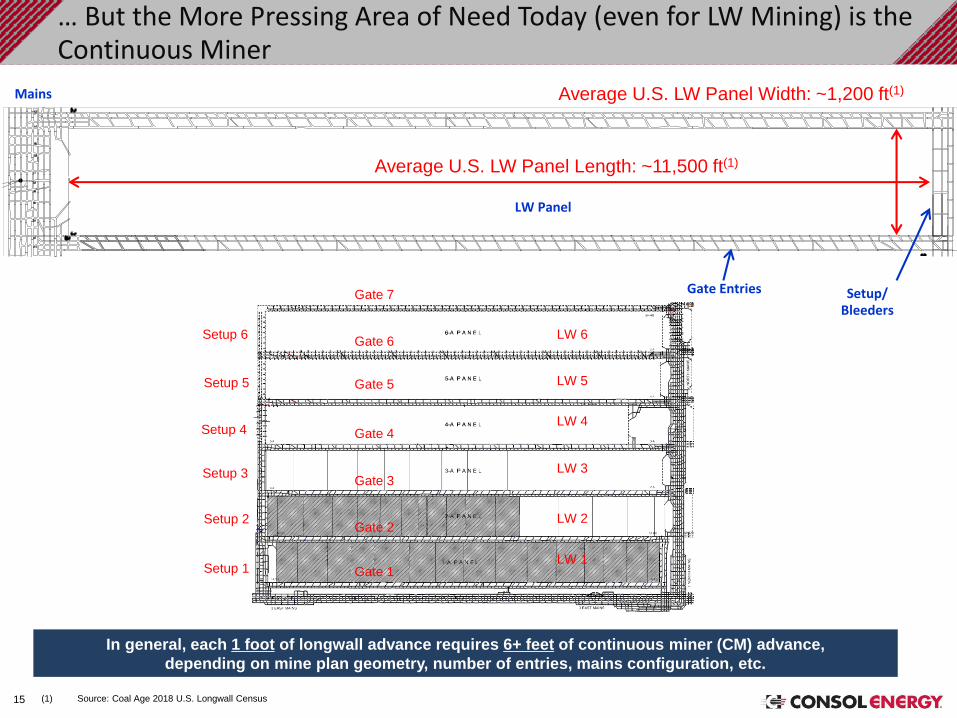
… But the More Pressing Area of Need Today (even for LW Mining) is the Continuous Miner
15
Average U.S. LW Panel Length: ~11,500 ft(1)
Average U.S. LW Panel Width: ~1,200 ft(1)Mains
Gate Entries Setup/ Bleeders
LW Panel
LW 2
LW 3
LW 4
LW 5
LW 6
LW 1
Gate 2
Gate 3
Gate 4
Gate 5
Gate 6
Gate 7
Gate 1
Setup 2
Setup 3
Setup 4
Setup 5
Setup 6
Setup 1
In general, each 1 foot of longwall advance requires 6+ feet of continuous miner (CM) advance,
depending on mine plan geometry, number of entries, mains configuration, etc.
(1) Source: Coal Age 2018 U.S. Longwall Census

16
What Does it Take to Mine a Foot? (Illustrative Example)
Continuous Miner-Bolter
Crew1 Miner Operator2 Miner Bolters2 Rib Bolters/Utility Men2-3 Haulage Operators2 Center Bolters1 Mechanic1 ForemanTOTAL = 11-12 people
ConsumablesRoof bolts/supportRoof meshRib boltsRib meshBitsOilRock dustCurtainElectricity
Clean Tons per Foot ~ 4Feet per Shift ~ 100
Clean Tons per Shift ~ 400
As a general rule, the continuous miner mines at a loss to enable the longwall (and the mine) to mine at a profit.
Longwall
Crew1-2 Shearer Operators1 Shieldman1 Head Gate Operator3 Longwall Support/Utility1 Mechanic1 ForemanTOTAL = 8-9 people
ConsumablesBitsOilRock dustCans or Cribs (floor-to-roof support)Electricity
Clean Tons per Foot ~ 350Feet per Shift ~ 25
Clean Tons per Shift ~ 8,750
>25x difference in productivity
Note: Does not include labor/consumables for mine support activities, surface activities, and administration.

17
What Can Be Done to Improve CM Productivity/Cost Performance?
While transformational approaches should be considered, there are great opportunities to apply technology to
improve upon the traditional CM mining process.
Entirely new approach Improve upon the
current process
Increase mining rate
Increase mining time
Decrease required
resources
Three Fundamental Options:
◼ CMs are capable of cutting ~1 ft/minute
◼ There are 480 minutes in an 8-hour shift
◼ In theory, a CM machine can mine ~480 ft/shift
◼ In practice, CM advance rates are much less than this
Physical Mining(100 ft @ 1 min/ft)
100 min21%
Non-Routine Delays(e.g., mechanical)
220 min46%
Routine Mining-Related Delays
30 min pre-op checks30 min rock dust (3x/shift)20 min move (1h/3 shifts)
80 min bolt/haul bottleneck160 min
33%
Example: Increase Mining Time(1)
Illustrative CM Shift
Why?
(1) Illustrative example shown for a continuous miner-bolter as opposed to a place change miner.

18
CM Technology Development: Where Do We Go Next?
Advances in CM technology would also benefit non-longwall underground mines,
including many metallurgical coal mines.
◼ Fully or partially automate:
◼ Mining
◼ Roof/rib bolting and meshing
◼ Hauling
◼ Rock dusting
◼ Advanced equipment monitoring and predictive analytics for
preventative maintenance to reduce delays
◼ Intercommunication among equipment to reduce bottlenecks
◼ Coal seam detection / horizon control
◼ GPS ineffective underground
◼ Adjusting for adverse conditions
◼ Harsh operating environment (e.g., roof falls, methane)
◼ Constraints on space/maneuverability/wireless connectivity
◼ Stringent mining rules slow new technology introduction
◼ Workforce acceptance/cultural change
Opportunities
Challenges

19
Opportunities for Big Data and Advanced Computing
Development and adoption of intelligent processes enabled by digital technology is critical for the
sustainability of the coal mining industry.
LongwallShearerShields
Conveyor
CMMinerBolter
CMHaulage
CMHaulage
BeltsStage
Loader & Crusher
CMMinerBolter
Raw Coal
Storage
Prep PlantScreening/Sizing
SeparationCoarse/Fine/Ultrafine
Dewatering/Drying
Refuse Haulage
Clean Coal
StorageLoadout
Rail or Barge
Transport
Mine SupportVentilation
Transport Miners/SuppliesInspections/MonitoringMaintenance/Projects
TerminalUnload
StockpileBlendLoad
Vessel
Mining Preparation Transportation
◼ Getting coal from the mine to the end-use customer requires numerous
steps, many of which are serially dependent
◼ A breakdown or bottleneck affecting one step can upset the entire chain
◼ Tremendous opportunity to use state-of-the-art digital technology to optimize
communications and decision making within each box and across all boxes
◼ Specific focus areas should include:
◼ Advanced sensors / machine data capture
◼ Next-generation underground networks/communications
◼ Consolidated data platforms
◼ Real-time analytics and optimization
◼ Advanced control systems
◼ Artificial intelligence and machine learning
◼ Predictive maintenance / RAM analysis

Pennsylvania Mining Complex Aerial Photo
20
CRDA 1
CRDA 3
CRDA 5
CRDA 8SI
CRDA 7
Prep Plant
and Rail
Loadout
OMNIS
Refinery
Site
• The Bailey Central Preparation Plant produces ~400 tons/hour (dry basis) of fine waste coal in the form of
a slurry stream containing ~20-30% (w/w) solids
• This fine waste coal stream (thickener underflow) is sent for disposal in slurry impoundments

OMNIS Refinery at the Pennsylvania Mining Complex
21
◼ The opportunity:
◼ Recover solids from the thickener underflow stream
and/or waste coal slurry impoundments
◼ Refine to produce a Clean Solid Energy (CSE)
product that can be used as fuel or as a feedstock
for other higher-value applications
◼ Improve overall product yield from the mining
operation by >5%
◼ Generate a mineral matter byproduct for use in
agricultural applications or disposal as coarse refuse
◼ Reduce or eliminate the need for future fine coal
refuse impoundments
◼ Forward progress:
2016-2017
•Process development at OMNIS facility inSanta Barbara, CA
•Lab-scale testing of CSE product
2017-2018
•Construction, operation, and optimization of OMNIS pilot unit at Bailey Preparation Plant
•Commercial-scale testing of CSE at customer plant
2019-2021
•Finalize process design
•Construct and commission commercial-scale refinery at Bailey

Advanced Supercritical PFBC with Carbon Capture
22
◼ Concept – build a ~300 MWe power plant
fueled by waste coal slurry that achieves:
◼ High efficiency (>42% HHV
in carbon capture-ready mode)
◼ Very low SOx, NOx, mercury,
and particulate emissions
◼ Zero liquid discharge
◼ ≥ 95% CO2 capture and
storage/beneficial reuse
◼ Carbon neutral/negative operation through
biomass co-firing (BECCS)
◼ Advanced application of commercially-proven technology
◼ Demonstrated at pilot scale (1 MWt) with waste coal slurry fuel and CO2 capture at CONSOL’s R&D facility in
2009-2010
◼ Completed conceptual design and pre-FEED studies as part of the U.S. Department of Energy’s Coal FIRST
program
◼ Evaluating potential plant sites at/near CONSOL’s Pennsylvania Mining Complex
Fuel andSorbent
Handling /Paste Prep /
Feed
PFBCGas
Expander Particulate Removal
Gas Heat Recovery
Stack
AshRecovery
(Bed + Cyclone)
Waste Coal SlurryLimestoneBiomass
Shaft Power Out to Generatorvia Gearbox
AshCooling
Ash to Disposal or Sale
SO2 Polisher and CO2 Capture
CO2 to
Storage or
Utilization
Desirable Traits of Coal-to-Products Opportunities
23
◼ Commercially-relevant scale
◼ Tons
◼ Revenue
◼ Capitalizes on the unique physical and chemical characteristics of coal
◼ Technical performance as good or better than the alternative feedstock/product
◼ Economics as good or better than the alternative feedstock/product
◼ Synergistic with existing operations/logistics infrastructure
◼ Has an attractive environmental profile (including low greenhouse gas emissions)
throughout the lifecycle
CFOAM
24
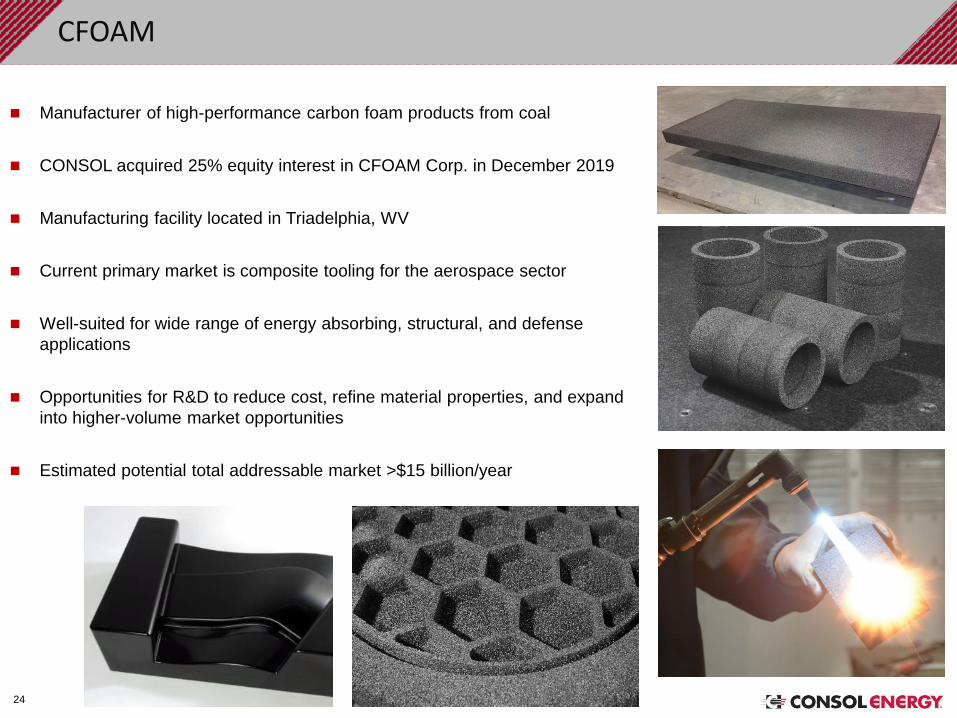
◼ Manufacturer of high-performance carbon foam products from coal
◼ CONSOL acquired 25% equity interest in CFOAM Corp. in December 2019
◼ Manufacturing facility located in Triadelphia, WV
◼ Current primary market is composite tooling for the aerospace sector
◼ Well-suited for wide range of energy absorbing, structural, and defense
applications
◼ Opportunities for R&D to reduce cost, refine material properties, and expand
into higher-volume market opportunities
◼ Estimated potential total addressable market >$15 billion/year

CFOAM – The Opportunity

Coal Plastic Composites (CPCs)
26
◼ Technology invented at Ohio University
◼ U.S. DOE funding a team including Ohio University, CONSOL, Engineered
Profiles, PNNL, and Clear Skies Consulting to further develop and scale up the
technology
◼ CPCs show promise as engineered composite material for decking and other
construction applications
◼ Equivalent or greater strength with higher filler content than wood plastic
composites (WPCs)
◼ Excellent oxidation resistance and predicted service life
◼ Superior flammability properties and moisture resistance
◼ Initial techno-economic studies predict lower manufacturing costs vs. WPCs
◼ Lifecycle analysis suggests CPCs are less energy/emissions intensive than WPCs
◼ Extrusion process currently being developed for commercial-scale equipment
Coal-to-products technologies such as CFOAM and CPCs provide an intriguing new opportunity to utilize our vast coal
resource base, with significantly lower emissions and greater value uplift potential than conventional uses of coal.

Recommended Next Steps
27
Engage in focused dialogue with key industry stakeholders (e.g., producers, transportation providers,
end users, OEMs, technology developers) to prioritize areas of greatest need / potential impact1
Obtain input from other industries that have succeeded in implementing analogous technology
solutions2
Work with DOE and other agencies to define needs and explore funding opportunities, and work with
MSHA to streamline the approval process for new underground technologies3
Incorporate both upstream and downstream goals (including mining productivity/cost improvement
goals and coal-to-products goals) into roadmapping for the future of coal4
Fund research targeting high-priority mining, beneficiation, and utilization technologies to engage
academia, attract students across a variety of disciplines, and bring renewed interest to the coal space5
Innovate to create value and sustainability along all aspects of the coal value chain - from the mine to
the stack - and develop new end-uses for coal