optical design and optimization of planar curved led end
TRANSCRIPT

10 October 2014 / Vol. 53, No. 29 / APPLIED OPTICS H67
Optical Design and Optimization of Planar Curved LED End-lit Light Bar
Jyh-Cheng Yu*, Zhi-Yao Chen, and Bang-De Kao
Department of Mechanical and Automation Engineering, National Kaohsiung First University of Science National Kaohsiung First University of Science and Technology, 1 University Rd., Kaohsiung 824, TAIWAN
*Corresponding author: [email protected]
Received 2 May 2014; revised 5 July 2014; accepted 14 July 2014; posted 14 July 2014 (Doc. ID 211346); published 12 August 2014
This study investigates the optical design of planar curved LED end-lit light bar using v cuts as light diverting structures. The applications of LED in automotive lighting have become popular especially in signal lamps and daytime running lamps. Most designs adopt direct backlight using arrays of LEDs with diffusive coupling optics, which often causes problems such as low uniformity, glaring, and excessive LEDs. Edge-lit LED light guides in automotive applications share a similar principle of the light guide plates in back light models of LCD, but with much more complicated geometry. However, related literatures on the optical design of non-rectangular light guide plates are very limited. This study addresses the design of planar curved LED end-lit light bars and the optimization scheme for illuminance uniformity. V cuts are used as the optical coupling features, and the lead angles of v cut are varied to achieve optimum axial luminous intensity. This study presents a solution to reduce the illuminance difference between the inner and the outer portions of curved light bars by introducing gradual taper v cuts across the curved section. A line graph with preselected anchor points is proposed to define the size distribution of evenly spaced v cuts along the light bar. A Fuzzy optimization scheme is then applied to iterate the anchor size to achieve illuminance uniformity. The designs of a planar curve light bar with rectangular cross section and a light guide ring with circular cross section are presented to illustrate the design scheme.
OCIS codes: (220.2945) Illumination design; (230.3670)Light-emitting diodes; (230.1980) Diffusers; (080.2740) Geometric optical design; (230.7370) Waveguides
The published journal version is available at Optical Society of America: http://dx.doi.org/10.1364/AO.53.000H67
1. Introduction
The applications of LED in automotive lighting have become more and more significant due to energy advantage, longer life, and smaller size [1]. The functions of automotive lighting are mainly to help users see well such as headlamps and to be seen well such as signal lamps. There are various LED applications in signal lamps including tail light, stop light, turning lights, break lights, day running light, and side marker, which transforms their styling appearance.
Typically, pattern-free cover lenses, free-form reflectors, and light guides are applied to shape and distribute light source with respect to performance and regulation requirements. The function of signal lamps is to be seen clearly. Direct lighting using arrays of LEDs with cover lenses often causes glare problems. Light guide technology is promising in signal lamps, which greatly reduces the number of LEDs and provides smooth lighting, shape flexibility, and novel appearance as shown in Fig. 1.
Light guide technology has been widely used in back light modules (BLMs) of displays. Light sources arranged on the edges of light guide are directed and distributed to a uniform planar light by curvature designs [3] or microstructures arranged at one or both sides of light guide [4]~[7]. End-lit light guide bars (LGBs) in automotive lighting share a similar technology but deal with much more complex geometry such as rings [8], stripes [9], tubes [10], sheets [11], and panels with 3-dimensional curvature. Though many patterns propose novel designs of light bars, few address the optical design and distribution of micro features on curved structures.
Because of high manufacturability and better control in the luminous intensity distribution, v cuts are typical optical structures to couple light out of the desired surface of light guide bar [12]. The angles, α and β, of diverting surfaces of v cut can be selected such that the light from the light source can be diverted toward the desired direction as shown in Fig. 2. The illuminance uniformity can then be controlled by manipulating the distribution of v cuts [13]. However, if the light bar is curved,
H68 APPLIED OPTICS / Vol. 53, No. 29 / 10 October 2014
additional attention needs to be paid to the cross section illuminance uniformity between the inner and outer parts of the curved section.
This study first analyzes the lead angles of v cut for optimum axial luminous intensity of the light bars with LED light sources at one and both ends. The illuminance uniformity is the design objective for planar curved light bars especially at the curved section. A fuzzy optimization method is proposed to manipulate the size distribution of v cut for uniform illuminance.
Fig. 1. Example of automotive tail lamp using LED end-lit light guide bars [2]
Fig. 2. End-lit light guide bar using v cuts
2. Optical Design of Light Bars
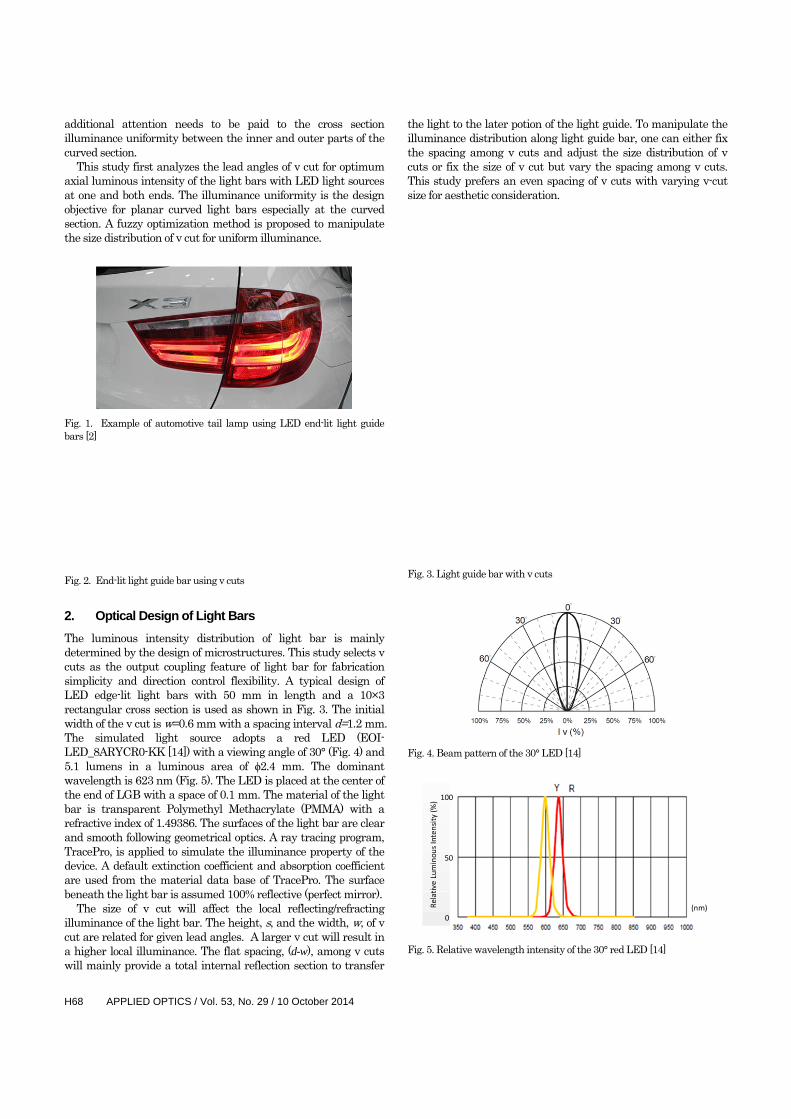
The luminous intensity distribution of light bar is mainly determined by the design of microstructures. This study selects v cuts as the output coupling feature of light bar for fabrication simplicity and direction control flexibility. A typical design of LED edge-lit light bars with 50 mm in length and a 10×3 rectangular cross section is used as shown in Fig. 3. The initial width of the v cut is w=0.6 mm with a spacing interval d=1.2 mm. The simulated light source adopts a red LED (EOI-LED_8ARYCR0-KK [14]) with a viewing angle of 30° (Fig. 4) and 5.1 lumens in a luminous area of ϕ2.4 mm. The dominant wavelength is 623 nm (Fig. 5). The LED is placed at the center of the end of LGB with a space of 0.1 mm. The material of the light bar is transparent Polymethyl Methacrylate (PMMA) with a refractive index of 1.49386. The surfaces of the light bar are clear and smooth following geometrical optics. A ray tracing program, TracePro, is applied to simulate the illuminance property of the device. A default extinction coefficient and absorption coefficient are used from the material data base of TracePro. The surface beneath the light bar is assumed 100% reflective (perfect mirror).
The size of v cut will affect the local reflecting/refracting illuminance of the light bar. The height, s, and the width, w, of v cut are related for given lead angles. A larger v cut will result in a higher local illuminance. The flat spacing, (d-w), among v cuts will mainly provide a total internal reflection section to transfer
the light to the later potion of the light guide. To manipulate the illuminance distribution along light guide bar, one can either fix the spacing among v cuts and adjust the size distribution of v cuts or fix the size of v cut but vary the spacing among v cuts. This study prefers an even spacing of v cuts with varying v-cut size for aesthetic consideration.
Fig. 3. Light guide bar with v cuts
Fig. 4. Beam pattern of the 30° LED [14]
Relative Luminou
s Intensity (%) 100
50
0(nm)
Fig. 5. Relative wavelength intensity of the 30° red LED [14]

10 October 2014 / Vol. 53, No. 29 / APPLIED OPTICS H69
The lead angles, α and β, will determine the intensity distribution of the x-z plane of the emitting light. Since the minimum luminous intensity of most photometric specifications in automotive lighting requires the highest intensity near the axial direction, the lead angles of the v cut will be varied to achieve the optimum axial luminous intensity.
A. V cut Design for Single End-lit Bar
For a shorter light guide bar, the light source is often installed at one end. The v cuts with vertex angle of 90° are used as the coupling structures to divert the light source from edge-lit LEDs to the front surface. The luminous intensity distribution of a light bar with symmetric design of the lead angles, α = β = 45°, is shown in Fig. 6. The intensity distribution in the x-z plane is more scattered, and the peak intensity shows a deviation angle of 19 ° from the axial direction.
The lead angles, α and β, of v cut will affect the intensity distribution of emitting light. Alignment of the peak luminous intensity with the axial direction is preferred to increase the brightness of light bar. The optimum lead angles, in this case, are found to be α = 36° and β = 54°. The corresponding intensity distribution is shown in Fig. 7 where the peak intensity aligns with the axial direction and increases by 14% compared with the v cut design with symmetric lead angles.
Fig. 6. Luminous intensity distribution of the light guide bar with 90° v cuts and symmetric lead angles.
P1
P4
P3P2
Fig. 7. Luminous intensity distribution of the light guide bar with 90° v cuts and lead angles α =36° and β =54°.
Fig. 8. Ray tracing of the peak intensity P1.
Fig. 9. Ray tracing of the peak intensity P2.
Fig. 10. Luminous intensity distribution of the dual end-lit light bar with isosceles v cuts of various lead angles.
The ray tracing using the simulation program TracePro shows
that the intensity peaks P1 and P2 in Fig. 7 are due to the reflection and refraction at the coupling surfaces of v cuts. Light rays split at reflecting/refracting surfaces in ray tracing as shown in Fig. 8 and Fig. 9. The color of each ray indicates its flux. Red rays have flux from 100 to 66 % of their beginning ray flux. Green rays are between 66 and 33 % and blue rays are between 33 and 0 %. Intensity peaks P3 and P4 are due to the refractive rays reflect on the bottom surface and refract back to the light guide before emitting out of the surface. Proper selection of lead angles α and β can control the distribution of peak intensity.
B. V cut Design for Dual End-lit Bar
If the light sources are installed at both ends of the light bar, isosceles v cuts are expected for symmetric luminous intensity distribution. Fig. 10 shows the intensity distributions for v cuts of various lead angles. The dual end-lit light bar with v cuts of α = β = 50 will provide the highest on-axial luminous intensity.
C. Radial Illuminance Uniformity of Bent Section
For the bent section of a curved light bar, the light is likely bound to the outer section of the bend. This phenomenon is noticeable in

H70 APPLIED OPTICS / Vol. 53, No. 29 / 10 October 2014
particular for the light bars with the light source at one end. Fig. 11 is a typical light bar with uniformly distributed v cuts. Two red LEDs (EOI-LED_8ARYCR0-KK [14]) are used. The distance between LED and the end of LGB is 0.1 mm. To improve the extraction efficiency, the far end of the LGB is modified to a semi-circular structure with a radius of 2.75 mm as shown in Fig. 11. The v cuts with vertex angle of 90°, lead angles of α = 36°, β = 54°, and height of 0.3 mm are evenly spaced 1.2 mm apart. The corresponding illuminance map of the bent section shown in Fig. 12 clearly illustrates the illuminance of the outer portion is higher than that of the inner portion.
Since the size of v cut will affect the local illuminance, to reduce the illuminance of the outer portion, this study proposes a gradual taper v cut design at the curved section as shown in Fig. 13. The v cuts blend gradually from a straight v cut at the start of bend to the maximum taper v cut at the mid of bend, and back to the straight v cut at the end of bend using a spline function. The size of v cut tapers from the inner height of hi to the outer height of ho. Fig. 14 shows that the radial illuminance uniformity greatly improves for a gradual taper v cut design.
The taper of v cuts is varied to analyze the influence on the radial illuminance uniformity of the bent section. The maximum taper v cut at the mid of bendbent is defined by (1).
(1)
B
Semi-circular end structure
LEDs
B
B
Fig. 11. A planar curved light bar with uniformly distributed v cuts
To quantify the radial illuminance uniformity of bent section, the observation surface is split into two sub surfaces along the center of light bar to compare the average illuminance between the outer and the inner portions as shown in Fig. 12. The radial illuminance difference (RID) is defined as (2). The numerator of RID is the difference between the average illuminance of the outer and the inner sub surfaces, while the denominator is the average illuminance of the bent section. The radial illuminance uniformity improves for a reduced RID.
eIlluminanc Average
eIlluminancInner - eIlluminancOuter RID (2)
Table 1 shows that the radial illuminance uniformity improves as the taper of the v cut increases. However, the minimum size of v cut will be constrained by the replication quality of molding process of light bar.
Table 1. Influence of the Taper of V Cut on the Radial Illuminance Difference (RID ) of Outer and Inner Portions of Bent LGB
c Outer
Illuminance Inner
Illuminance Average
Illuminance RID
1 2730.9 2323.3 2223.6 0.180.7 2812 2523.9 2336 0.12
0.6 2748 2516.4 2303.5 0.10
0.5 2683.8 2511.1 2274.1 0.08
0.4 2635 2509 2250.8 0.06
0.3 2577.6 2499.5 2223.2 0.04
0.2 2521.2 2489.7 2196.8 0.01
Outer Portion
Inner Portion
Fig. 12. Illuminance distribution of the light bar with straight v cuts in the curved section (hi = ho=0.3 mm)
Fig. 13. Modification of v cuts at the bent section of light bar

10 October 2014 / Vol. 53, No. 29 / APPLIED OPTICS H71
Fig. 14. Illuminance distribution of the light bar with the gradual taper v cut design in the curved section (hi = 0.3 mm, ho=0.165 mm).
3. V-Cut Distribution Using Fuzzy Optimization
The light traveling in the light bar is diverted out of the light bar by v cuts. Therefore, manipulation of either density or size of v cuts would control the local illuminance. For automotive applications, the design of evenly spaced v cuts is often preferred for aesthetic purpose. Therefore, the size distribution of v cuts will be applied to achieve illuminance uniformity along the longitudinal direction of LGB in this study. The designs of v cut are selected according to the analysis in Sections 2A and 2B depending on single or dual end-lit light sources.
This study adopts a Fuzzy optimization scheme to derive the size distribution of v cuts for optimum illuminance uniformity [4]. Typical fuzzy systems consist of a fuzzifier, a fuzzy rule base, a fuzzy inference engine, and a defuzzifier [12]. The fuzzifier transforms input data into linguistic fuzzy variables. Expert decision reasoning is then expressed as a set of fuzzy conditional statements based on fuzzy variables. The decision can be reasoned by the fuzzy inference engine; a defuzzifier then converts the linguistic conclusion into a crisp output.
To simplify the optimization design, the size distribution of v cuts on the light bar is first parameterized as a line graph with anchor points selected at the peaks and valleys of the illuminance distribution as shown in Fig. 15. The v-cut size at the anchor point i is denoted as si, where s is the height of the v cut as shown in Fig. 3 with given lead angles α and β. The anchor points compose a line graph as shown in Fig. 16 for the size distribution of v cuts along the light bar. The v-cut size between two anchor points is determined by linearly interpolating the size si and si+1 at two adjacent anchor points. The proposed v-cut distribution model simplifies the light bar design into a 6-variable, s1–s6, optimization problem in this example. By manipulating the v-cut size at these anchor points, a uniform illuminance distribution of the light bar can be obtained.
Empirical rules suggest reducing v-cut size if the local illuminance is too bright and increasing the size if the local illuminance is too dark compared with the average illuminance of the light bar. However, instead of trial-and-error, the optimization scheme based on a fuzzy inference [15] is applied to
automate the searching process. The local illuminance ratio (LIRi) as in (3) is used as an index to adjust the anchor size si.
LGB theof eilluminanc Average
point anchor at eilluminanc Local iLIRi (3)
If the LIRi of the anchor point i is larger than 1, the
corresponding anchor size si in the line graph is decreased to reduce the illuminance of neighboring region of anchor point i . On the other hand, if LIRi is smaller than 1, si is increased to enhance the illuminance of neighboring region. Therefore, five single-input single-output inference rules are proposed based on the empirical decisions. The fuzzy optimization scheme automatically adjusts the v-cut size distribution iteratively until the optimum illuminance uniformity is reached.
R1: If LIR is Too High then Increase anchor size. R2: If LIR is High then Slightly Increase anchor size. R3: If LIR is Just Right then Maintain anchor size. R4: If LIR is Low then Slightly Decrease anchor size. R5: If LIR is Too Low then Decrease anchor size These five levels, Too High, High, Just Right, Low and Too
Low, are used to describe the conditioned variables of LIR. Five action levels, Increase, Slightly Increase, Maintain, Slightly Decrease, and Decrease, are defined to describe the Adjustment Factor (AF) for v-cut size at anchor points. Anchor size si will be multiplied by AFi in the next iteration. Fig. 17 and Fig. 18 show the standard membership functions associated with the conditional linguistic and decision variables. A simple center average defuzzifier [15] is applied to derive AFi to update the anchor size si. The light bar with the derived v-cut size distribution is applied to TracePro simulation to estimate the root mean squared error (RMSE) of the illuminance distribution. The modification of the line graph of v-cut distribution iterates until the convergence of RMSE.
Fig. 15. Selection of anchor points of the line graph function for the v-cut size distribution along the light bar

H72 APPLIED OPTICS / Vol. 53, No. 29 / 10 October 2014
Feature S
ize
Fig. 16. Line graph function for the v-cut size distribution
Fig. 17. Membership functions of the local illuminance ratio, LIR.
Adjustment Factor1.11.051.00.9 0.95
Mem
bers
hip
1.0 IncreaseSlightlyincreaseMaintain
SlightlydecreaseDecrease
0.85 1.15
Fig. 18. Membership functions of the size adjustment factor, AF.
4. Optimization Examples of LGB
A. Design Optimization of a Single End-lit Bar
The optical design of the tail lamp shown in Section 2C is used to illustrate the proposed design process. Fig. 19 shows the illuminance map of the curved light bar with uniform v cut of 0.3 mm in height and evenly spaced at an interval of 1.2 mm. Since the design is lit with two LEDs installed at single end, the lead angles of v cuts are set at α = 36° and β = 54° for optimum axial intensity. The gradual taper v cuts are first introduced as stated in Section 2C to improve the radial uniformity of illuminance. The taper ratio c of v cut at the bent section is selected as 0.55 to ensure the minimum v-cut size larger than 0.1 mm for manufacturing concerns. The convergence criterion for the illuminance RMSE is selected as 2%. The iteration stops if the improvement of RMSE is less than 2% in last two iterations. By using the fuzzy optimization scheme in size distribution, the RMSE of the light bar reduces effectively from the initial 1394 lux to the optimum 592 lux in six iterations as shown in Fig. 20. The illuminance map of the optimum design is shown in Fig. 21.
Fig. 19. Illuminance distribution of the initial curved light bar with uniform v cut.
Fig. 20. Iteration result of the illuminance RMSE of light bar
Fig. 21. Illuminance distribution of the optimized curved light bar.
Since the light-bar is usually observed by people at different locations and angles, the luminance analysis is conducted to examine the visual effect of the design. Five 6x6 mm observation surfaces are set up with the viewpoints 50 mm above the locations of observation surface as shown in Fig. 22. The luminance results when tilting the light bar ±10º are also shown in Table 2. The luminance at the bent
500600700800900
1,0001,1001,2001,3001,4001,500
F0 F1 F2 F3 F4 F5 F6
RMSE (lux)
Iteration

10 October 2014 / Vol. 53, No. 29 / APPLIED OPTICS H73
section (OB3) of LGB is the lowest. The uniformity of the illuminance of LGB doesn’t guarantee a uniform luminance due to the change of the intensity distribution at the bent section. As to the luminance at left and right tilt of 10º, the luminance changes as well. It is due to the geometry of a single curved light bar and the light source at only one end. The situation can be improved if dual end lit LEDs are used. Also if a diffusive cover is used with the LGB, the luminance uniformity can be assured.
Fig. 22. Locations of the luminance measurement.
Table 2. Luminance at various locations and tilt angles
OB1 OB2 OB3 OB4 OB5
Up front 13416 10415 1218 7777 5528
Left Tilt 10° 7424 9306 1035 8477 10611
Right Tilt 10° 10850 11354 2560 7584 2067
Unit: cd/m2
The visibility of LED end-lit light bar to the pedestrian and/or driver behind it at a distance is also important in automotive applications. Most tail lamp modules using LGBs consist of multiple LGBs, as in the example in Fig. 1. SAE J585 is primary specification for the tail lamps of passenger cars, which provides a design guide line for the minimum luminous intensity at several specified test points. For instance, the minimum SAE photometric requirement for the tail light with three compartments is 5.0 cd at the axial direction. This study sets up a 10m×10m observation surface at 10 m away from the curved LGB to simulate the rectangular isocandela plot as shown in Fig. 23. The simulated luminous intensity at specified coordinates can be identified from the isocandela plot to compare with the SAE requirement. As seen from Fig. 23, the luminous intensity at the axial direction is about 3.5 cd for a single LGB, which demonstrate the feasibility in tail lamp applications.
B. Design Optimization of a Dual End-lit Ring
Another example of light guide ring with circular cross section and two-end LED illumination is shown in Fig. 26. The optimum lead angles derived in section 2 are also applicable to the light
bars with circular cross section. This exemplar ring is lit at both ends with white surface mount LED devices (NICHIA NS2W757AT-V1 [16]) with a viewing angle of 120° and 30 lumens in a luminous area of ϕ 2.6 mm. The beam pattern of the LED is shown in Fig. 24, and the wavelength intensity distribution is shown in Fig. 25. The distance between the LED and the end of light guide ring is assumed 0.1 mm. The lead angles of v cuts are selected as 50° as discussed in Section 2B. The curvature of the ring is 0.0182 with a circular cross section of diameter 10 mm. The corresponding radius of the ring is 55 mm. The v cuts are evenly spaced at an interval of 1.2 mm on the bottom flat of the cross section as shown in Fig. 26. The initial design applies a uniform v cuts of height s = 0.3575 mm. Unlike the light guide bar of rectangular cross section in the previous example, a planar curved light guide with circular cross section doesn’t have the problem in radial illuminance uniformity. Therefore, straight v cuts are applied in the design.
Fuzzy optimization scheme is applied to the v-cut size distribution, and the illuminance RMSE of the ring reduces from the initial 1979 lux to the optimum 1559 lux in five iterations. The comparison of the illuminance distribution between the initial and the optimum designs are shown in Fig. 27 and Fig. 28.
Fig. 23. Rectangular Isocandela Plot of the optimized LGB observed at 10 m away
Fig. 24. Beam pattern of the 120° LED [16]
Since light guide bars are injection molded, the lead angles of optimized v cut are liable to replication errors which are common in automotive applications where tight tolerances are not practical due to cost concern. Assuming the tolerance of the lead

H74 APPLIED OPTICS / Vol. 53, No. 29 / 10 October 2014
angles are ± 2°, a tolerance analysis is shown in Table 3. The deviation of RMSE is less than 4%, and the deviation of average illuminance is less than 2%, which are satisfactory for automotive applications.
Table 3. Tolerance analysis for the lead angles of the light guide ring
α = β = 50º α = β = 52º
α = 52º β = 48º
α = β = 48º
RMSE (lux) 1559.1 1496.1 1560.8 1617.1
AVG (lux) 4408.4 4323.9 4422.2 4487.4
5. Conclusion
This study proposed an effective solution to design planar curved light bars with lighting efficiency and uniformity. By adjusting the lead angles of v cuts, the peak illuminance intensity is aligned to the axial direction. The uneven illuminance in the radial direction of curved section of light bars is alleviated by introducing the gradual taper v cut design to the bent section of the light guide. At last, the combination of the light graph model and fuzzy optimization scheme effectively optimizes the size distribution of v cuts to achieve illuminance uniformity. The optimization results reduce the illuminance RMSE by 52% for the curved light bar and 21% for the light guide ring respectively, and demonstrate the effectiveness of the proposed scheme, which can be readily applied to general design of planar curved light guide bars.
Fig. 25. Relative wavelength intensity of the 120° white LED [16]
3
R55
unit: mm
Fig. 26. Design of light guide ring with dual end-lit LEDs.
Fig. 27. Illuminance distribution of the initial design of light guide ring with uniform size of v cut.
Fig. 28. Illuminance distribution of the optimized light guide ring.
Acknowledgment We thank the National Science Council, TAIWAN (Grant No.
NSC 101-2221-E-327-007 and NSC 102-2221-E-327-010) for funding this study.
References
[1] Eichhorn K., “LEDs in automotive lighting,” Proc. of SPIE Light-Emitting Diodes: Research, Manufacturing, and Applications X, 6134, 613405-1 (2006).
[2] Http://www.bmw.com.tw [3] Van Derlofske, J.F., "Computer modeling of LED light
pipe systems for uniform display illumination," Proc. SPIE 4445, Solid State Lighting and Displays, 119~129 (2001).
[4] Yu, J. and Hsu, P.-K., “Integration of stamper fabrication and design optimization of LCD light guides using silicon-based microfeatures,” Microsystem Technologies 16(7), 1193-1200 (2010).

10 October 2014 / Vol. 53, No. 29 / APPLIED OPTICS H75
[5] Ronny, R.A., K. Knopf, G.K., Bordatchev, E. and Nikumb, S., “Micromilled optical elements for edge-lit illumination panels,” J. Micro/Nanolith. MEMS MOEMS. 12(2), 023002 (2013).
[6] Zhao, H, Fang, SP, Shang, B, “Adaptive neuro-fuzzy inference system for generation of diffuser dot patterns in light guides,” Applied Optics, 49(14), 2694-2702 (2010).
[7] Xu, Ping, Huang, Y., Su, Z., “Algorithm research on microstructure distribution on the bottom surface of an integrated micro-optical light guide plate,” Applied Optics, 53(7), 1322-1327 (2014).
[8] Ko, C.-C., “Light guide ring unit and backlight module using the same,” US patent US8246228 B2, (Aug. 21, 2012)
[9] Wu, R.-Y., Yen, C.M., Liao, C. L., Chen, Y.-C., “Light guide bar with patterned surface to enhance light uniformity and intensity,” US patent US20100002461 A1, (Jan. 7, 2010).
[10] Huang, J., “Light guide device for vehicle lamps,” US patent 0310187A1, (Dec. 18, 2008).
[11] Martin, L., Vernisse, B., Thierry ,B., Vathonne, N., Gasquet, J. C., “Optical system with main function for motor vehicle,” US patent 0219731Al, (Dec. 4, 2009).
[12] Gebauer, M., Wiersdorff, S., “Lighting Mechanism,” US Patent 7494257B2 (Feb. 24, 2009).
[13] Yu, J. Chen, J.-H., and Liu, S.-C, “Design of LED edge-lit light bar for automotive taillight applications”, Proc. SPIE 8835, LED-based Illumination Systems, 88350G (2013).
[14] http://www.eoi.com.tw/index.php?module=ProductsList&func=detail&lang=en&sid=2644
[15] Jang, J.S., Sun, C.T., Mizutani, E. [Neuro-Fuzzy and Soft Computing: a computational approach to learning and machine intelligence]. Prentice-Hall (1997).
[16] http://www.nichia.co.jp/specification/products/led/NS2W757A-V1(65mA)-E.pdf