optical dissolved oxygen ie genehmi - hach uk · the primary cycle in the case of pressurised water...
TRANSCRIPT

Optical Dissolved Oxygen Measurement in Power plantsA comparison of amperometric and optical dissolved oxygen sensors for applications at low oxygen levels (<5µg∙kg-1, <5ppb)
AbstractThe majority of existing dissolved oxygen analyzers use amperometric sensors. Whilst these are renowned for their accuracy and reliability, issues encountered by users include maintenance complexity and frequency in addition to flow dependence and calibration needs. In more complex applications, amperometric sensors suffer from interference when measuring in the presence of high levels of hydrogen – this often results in negative readings and an unreliable measurement method.Luminescence technology has been used in power plants since 2006. This sensor showed significant reductions in maintenance complexity and frequency but was limited by its accuracy with use generally confined to oxygenated treatment (OT) environments.In 2009, the first luminescent oxygen sensor with a sub-µg∙kg-1 accuracy for use in power plants was launched.In this paper, authors will compare and discuss the performance of both optical and amperometric oxygen sensors in both fossil and nuclear power plant applications.
Authors:Stephen Bell (MEng (Hons), MBA) – Global Product Line Manager, HACH LANGE Sàrl, Geneva, Switzerland
Dr. rer. nat. Frank Dunand – Global Product Manager, HACH LANGE Sàrl, Geneva, Switzerland
Dipl.-Ing. Martin Schubert - Process Sales Development & Support Manager EU, HACH LANGE GmbH, Düsseldorf, Germany
Dipl.-Chem. Ralf König – Vertical Market Manager EMEA, HACH LANGE GmbH, Düsseldorf, Germany
IntroductionIn a power plant, the parameter of dissolved oxygen forms one of the most important indicators in the timely detection of oxidation-related corrosion, helping to prevent it with suitable measures – e.g. by using oxygen binders.Numerous guidelines exist from standardisation organisations for different operations with which the oxygen content can be effectively monitored. Chemical processes in fossil power plants, including AVT treatment with reduction (AVT(R)) and oxidation (AVT(O)) as well as an oxygen-dosing treatment (OT), permit strict control of the oxygen content to prevent corrosion [1].
In nuclear power plants, the oxygen measurement is somewhat more complicated, due to both the radioactive material in the sample and the frequent presence of high hydrogen contents in the primary cycle in the case of pressurised water reactors and in the balance of boiling water reactors.The injection of water in nuclear power plants with the aid of hydrogen water chemistry (HWC) removes the traces of oxygen that are present by recombining oxygen and hydrogen and forming water. However, the majority of oxygen sensors are cross-sensitive to the increased hydrogen content and can therefore display incorrect measurement results. It is precisely in this area though that an exact determination of the oxygen is very important, in order to determine the precise amount of hydrogen to be used. This is again decisive in preventing the formation of the dangerous oxyhydrogen reaction.
Another application of oxygen measurement under hydrogen influence is the measurement in the stator cooling water cycle. The most frequently used procedure is the monitoring of a low oxygen content in a range of typically 1 to 10 µg∙kg-1 oxygen and again here, the cooling water is generally hydrogen-saturated [2]. For safety reasons, and to contain corrosion, the oxygen content must also be measured precisely here.
1
VGB PowerTech 9 l 2012
Optische Sauerstoffmessung in Kraftwerken
Autoren
AbstractOptical Dissolved Oxygen Measurement in Power Plants – A
comparison of amperometric and optical dissolved oxygen sensors for applications at low oxygen levelsThe majority of existing dissolved oxygen ana-
lyzers use amperometric sensors. Whilst these
are renowned for their accuracy and reliability,
issues encountered by users include mainte-
nance complexity and frequency in addition to
flow dependence and calibration needs.In more complex applications, amperometric
sensors suffer from interference when measur-
ing in the presence of high levels of hydrogen
– this often results in negative readings and an
unreliable measurement method.Luminescence technology has been used in pow-
er plants since 2006. This sensor showed sig-
nificant reductions in maintenance complexity
and frequency but was limited by its accuracy
with use generally confined to oxygenated treat-
ment (OT) environments.In 2009, the first luminescent oxygen sensor
with a sub-µg∙kg -1 accuracy for use in power
plants was launched.In this paper, authors will compare and discuss
the performance of both optical and ampero-
metric oxygen sensors in both fossil and nuclear
power plant applications.
l
Optische Sauerstoffmessung in KraftwerkenEin Methodenvergleich amperometrischer
und optischer Sauerstoffsensoren für die Messung
von gelöstem Sauerstoff im SpurenbereichStephen Bell, Frank Dunand, Martin Schubert und Ralf König
Stephen Bell (MEng (Hons), MBA)Dr. rer. nat. Frank DunandGlobal Product ManagerHach Lange SàrlGenf/SchweizDipl.-Ing. Martin SchubertProcess Sales Development &
Support Manager EUHach Lange GmbHDüsseldorf/DeutschlandDipl.-Chem. Ralf KönigVertical Market Manager EMEAHach Lange GmbHDüsseldorf/Deutschland
EinführungIm Kraftwerk stellt der Parameter gelös-
ter Sauerstoff eine der wichtigsten Kenn-
größen dar, um zum Beispiel oxidations-
bedingte Korrosionen rechtzeitig zu er-
kennen und mit geeigneten Maßnahmen
– zum Beispiel über den Einsatz von Sauer-
stoffbindemitteln – zu unterbinden.Es existieren zahlreiche Richtlinien von
Normungsorganisationen zu unterschied-
lichen Fahrweisen, mit denen der Sauer-
stoffgehalt effektiv kontrolliert werden
kann. Chemische Verfahren in fossilen
Kraftwerken einschließlich AVT-Behand-
lung mit Reduktion (AVT(R)) und Oxida-
tion (AVT(O)) sowie eine sauerstoffdo-
sierende Behandlung (OT) erlauben eine
strikte Kontrolle des Sauerstoffgehalts zur
Korrosionsvorbeugung [1].In Kernkraftwerken ist die Sauerstoffmes-
sung etwas komplizierter, sowohl wegen
des radioaktiven Materials in der Probe als
auch wegen der häufig vorhandenen hohen
Wasserstoffgehalte im Primärkreislauf bei
Druckwasserreaktoren und im Ausgleich
der Siedewasserreaktoren.Die Wasserstoffeinspritzung in Kernkraft-
werken mithilfe der Wasserstoff-Wasser-
Chemie beseitigt durch die Rekombination
von Sauerstoff und Wasserstoff und der
sich daraus ergebenden Wasserbildung
vorhandene Sauerstoffspuren. Die meisten
Sauerstoffsensoren sind allerdings quer-
empfindlich gegenüber dem erhöhten Was-
serstoffgehalt und können somit falsche
Messergebnisse anzeigen. Allerdings ist ge-
rade in diesem Bereich eine exakte Bestim-
mung des Sauerstoffs sehr wichtig, um die
Menge des einzusetzenden Wasserstoffs
genau zu bestimmen. Dies ist wiederum
entscheidend, um die Bildung der gefährli-
chen Knallgasreaktion zu unterbinden.Eine weitere Anwendung einer Sauerstoff-
messung unter Wasserstoffeinfluss ist die
Messung im Stator-Kühlwasserkreislauf.
Die am häufigsten verwendete Fahrwei-
se ist die Überwachung eines niedrigen
Sauerstoffgehalts in einem Bereich von
typischerweise 1 bis 10 µg ∙ kg -1 Sauer-
stoff, und auch hier ist das Kühlwasser im
Allgemeinen wasserstoffgesättigt [2]. Aus
Sicherheitsgründen und zur Korrosions-
eindämmung muss auch hier der Sauer-
stoffgehalt genau gemessen werden.Tendenzen in der EnergiewirtschaftIn den vergangenen zehn Jahren haben
Kosteneinsparungen im Energiesektor zu
neuen Anforderungen gegenüber den Be-
triebsleitern und -chemikern sowie der ein-
gesetzten Messtechnik geführt: – Haushaltskürzungen führen bei War-
tung und Betrieb zu Personaleinsparun-
gen. Dadurch wird das verbleibende Be-
triebspersonal gezwungen, die tägliche
Arbeit noch weiter zu optimieren und
die Arbeitsbelastung durch Wartungs-
und Kalibrierarbeiten möglichst gering
zu halten oder völlig zu vermeiden. Die
messtechnische Verantwortung und
Überwachung wird zunehmend aus den
Chemielaboren hin zur Prozesskontrolle
und damit zum Verantwortungsbereich
des Betriebspersonals verlagert. – Bedingt durch die Situation, dass die
Rahmenbedingungen für die Genehmi-
gung neuer Kraftwerke und auch deren
Finanzierung zunehmend schwieriger
werden, gewinnt die Thematik der An-
lagenerweiterung und Verlängerung
der Betriebsdauer immens an Bedeu-
tung. Diese Problematik wird verstärkt
durch die behördlichen Forderungen,
neue Kraftwerke mit kostenintensiven
CO2-Rückhaltesystemen auszustatten.
Natürlich sind Anlagenerweiterungen
nur möglich, wenn das Herz des Kraft-
werks, der Wasser-Dampf-Kreislauf, gut
überwacht und gewartet werden kann.
Dies steigert die Bedeutung von Chemie-
ingenieuren und die Wichtigkeit einer
zuverlässigen Messtechnik bei der Anla-
genbetriebstechnik. – Die Anzahl an Spitzenlast-Kraftwerken
wächst im Energiesektor insbesondere
mit den technischen Fortschritten und
dem ökologischen Nutzen von neuen
Gas- und Dampf (GuD)-Kombikraft-
werken [3]. Spitzenlast-Kraftwerke
haben mehr Anfahr- und Abfahrzyklen
als Kraftwerke für die Grundlast, und
jeder dieser Zyklen führt zu einer hohen
Reprint of article published in the German VGB POWERTECH magazine in September 2012.

biology in waste water [4], blood gas analysis [5], fermentation control in biotechnology processes [6], micro-oxygenation of wine [7] and oxygen analysis in waste water [8].The importance of the LDO technique is also strengthened by the fact that this optical method has now been included officially in the catalogue of ASTM standards[9]. In the past, the measurement of dissolved oxygen using LDO was restricted to relatively high oxygen concentrations, for example, in the mg∙kg-1 range.
Technological progress during the last three years has led to the development of optical measuring systems that can also produce exact measurement results in the µg∙kg-1 range. Precise and con-sistent measurements of concentrations in the trace amounts range, in other words, below 10 µg∙kg-1, were restricted due to a lack of accuracy and dissolution. However, with the development of the ORBISPHERE K1100 in 2009, these precise measurements of con-centrations below 1 µg∙kg-1 are now possible precisely and reliably.
Measuring principleWith the optical process for the measurement of dissolved oxygen, a measurement method has been developed that eliminates the process-related disadvantages of traditional electrochemical measurement methods, for example the progressive wear of the anodes due to the oxidation process and the decrease in electro-lyte density.
The K1100 LDO sensor (refer to Figure 1) consists of two major components:
f A sensor layer with the luminophore, applied on a transparent carrier material, f The sensor body with a blue LED, a photodiode as a receiving unit and an additional red LED used as a reference light source.
The blue LED sends out a light pulse for the measurement. This passes through a transparent carrier material and hits the lumino-phore in the sensor layer. Part of the radiant energy is transferred to the luminophore as a result. The electrons in the luminophore
Trends in energy management
In the last ten years, cost savings in the energy sector have led to new requirements being placed on plant managers and plant chemists, as well as on the measuring technology in use:
f Budget reductions lead to personnel savings in both maintenance and operation. As a result, the remaining operating personnel is required to optimise its daily work even further and to keep the workload through service and calibration work as low as possible, or to avoid it altogether. The technical responsibility and moni-toring is increasingly taken from the chemical laboratories and is passed to process control and hence transferred to the field of responsibility of the operating personnel.
f As a result of the situation where the framework conditions for the approval of new power plants – and their financing – is increasingly difficult, the topic of plant expansion and the extension of service life is gaining immense importance. This difficulty is increased by the official demands for new power plants to be equipped with cost-intensive CO2 retention systems. Plant expansions are of course only possible if the heart of the power plant – the water-steam cycle – can be well monitored and serviced – this increases the significance of chemical engi-neers and the importance of a reliable measuring technique for plant operations engineering.
f The number of peak load power plants within the energy sector is growing, in particular with the technical advances and the ecological benefits of new gas and steam combination power plants [3]. Peak load power plants have more start-up and shut-down cycles than power plants for the base load, and each of these cycles leads to a high oxygen concentration during the start period. This in turn leads to increased work and service requirements in operation, for example, when servicing the amperometric oxygen sensors used.
These trends have changed the requirements in operating power plants. Starting from these trends, this article analyses the options for oxygen measurements that are precise, reliable and stable and above all require only a little service work or none at all.
Background and history of optical oxygen measurement (LDO) The optical measurement of oxygen (LDO = Luminescent Dissolved Oxygen) has been discussed in numerous articles and has prevailed in many different industries, including the monitoring of aquatic
Figure 1: Optical ORBISPHERE K1100 sensor

hence move from an energetic basic state to a higher energy level. This level is exited after a very short stay via interim levels, whereby a red light is emitted (refer to Figure 2).
If oxygen molecules are now present, they are in a position to take up the energy from the electrons – which are in the higher energy levels – and enable their transition into the base level without emitting radiation. This procedure is called quenching. With an in-creasing oxygen concentration, this process leads to a significant reduction in the emitted radiation intensity of the red light. The quenching also reduces the period the energy spends in the incited level, which leads to electrons leaving the higher energy level again faster. Both the life span and the intensity of the red emitted radiation are reduced by the presence of oxygen molecules.
The effect of the quenching process is made clear in Figure 3: The light pulse sent out by the blue LED at point in time t=0 hits the luminophore, which emits red light immediately afterwards. The maximum intensity (Imax) and the decay time of the red radia-tion depend on the ambient oxygen concentration (the decay time T is defined here as the period between incitement and the red radiation returning to 1-times the maximum intensity). To deter-mine the oxygen concentration, the life span T of the red radiation is evaluated.
A constant alignment of the sensor occurs with the help of the red LED fitted in the probe. Before each measurement, this sends out a light beam of a known radiation characteristic. Changes in the measurement system are hence detected without any time delay.
System calibrationThe currently established electrochemical process for the meas-urement of dissolved oxygen requires the user to carry out regular service work. Cleaning, calibration, replacing the membrane and electrolytes, polishing the anodes and documenting these activities are all viewed as necessary and unavoidable jobs, as only in this way can the propensity of these sensors to results that are too low be kept within certain limits. Amperometric oxygen sensors generally require a two-point cali-bration – the zero point and the slope (with a default calibration sample). The exception to this rule is the amperometric ORBISPHERE A1100 sensor, used for the comparison measurement. Due to its real zero point, this sensor only requires a single point calibration in air in order to determine the slope – to date, this sensor still applies as the industry standard for oxygen measurement. Optical oxygen sensors also only need a single point zero point calibration. The optical signal varies the greatest in the area around the zero point. For this reason, a precise setting here is crucial, particularly if precise measurements in the range below 1 µg∙kg-1 are to be carried out.The major advantage of optical calibration is: it does not need any chemicals. The sensor can be calibrated with a pure, oxygen-free gas such as nitrogen or carbon dioxide without any other liquids being needed for cleaning, as the sensor does not have any elec-trolyte. As the only reliable calibration process, the sensor is still exposed to a known reference sample as is usual during calibra-tion, in order to set the zero point. Hach Lange recommends a gas with 5.0 quality as the reference zero value, offering a purity of 99.999 %. As a result, the accuracy for measurements in the lower µg∙kg-1 range is ensured.This procedure guarantees a secure and trouble-free sequence for subsequent oxygen measurement.
Figure 4 compares the servicing, calibration, stabilisation and the response time of an optical sensor with an amperometric sensor. The diagram shows that the service and stabilisation time of an optical sensor is 82 % lower than that of a typical amperometric sensor. In view of the fact that this sensor has to be serviced three times less than an amperometric sensor, the workload of the respon-sible personnel can be reduced by 95 % – these savings in time and costs can be multiplied at a power plant with a large number of oxygen sensors. Figure 4 also shows that the response time of an optical sensor (following successful calibration) of saturation in Figure 3: Course of the intensity of incited blue radiation and emitted red radiation.
Figure 2: Principle of operation, HACH LANGE LDO optical sensor
Blue light excitation
Transparent carrier material
Red luminescence detection
Sensor layer with luminophore
0,0
0,2
0,4
0,6
0,8
1,0
1,2
0 20 40 60 80 100Zeit
Normierte Intensität Eingstrahltes Licht
Abgestrahltes Licht
Ohne O2
mit O2
τ1
τ2
Standardised intensity Radiated light
Emitted light
Without O2
With O2

Power plants operated with the AVT method generally require lower concentrations and consequently a more precise oxygen measurement than power plants using the OT method. The oxygen concentrations normally present in fossil power plants have been discussed in detailed articles from Dooley and Shields [10]. Given such varying concentrations and different methods, a clear under-standing of the factors impacting system performance is essential.
Sensor repeatability and stabilityThe oxygen level in power plant applications and their monitoring depends greatly on the measurement point and the method used. While a few amperometric sensors are very sensitive and can measure with an accuracy of 0.1 µg∙kg-1, this is balanced with some drawbacks: 1. Stability or drift between maintenance interventions.2. Effort and costs associated with minimising errors due to drift
through more regular calibration and sensor maintenance.For this reason, the oxygen concentrations to be measured, along with the constraints of time and system reliability, must be consid-ered.
Before the merits of the different technologies are compared, a few fundamental terms should be discussed, which have a con-siderable influence on the quality of the measurement value:
1. Repeatability: Capability of a specific sensor/system to measure a reference sample consistently over time.
2. Reproducibility: Measurement deviation of different sensors/systems in the same reference sample.
3. Accuracy: A measurement for the correctness of the system when comparing measured values and the actual value.
4. Stability: Deviation in the accuracy of a sensor/system over time.
These technical terms and definitions are widely accepted [11]; however, contrary to popular belief there is no definition of precision in the measurement of water chemistry parameters.
In light of these numerous definitions and the already mentioned water chemistry process that is most frequently used, the repeat-ability and stability of systems is discussed below. It should be debated as to how accurately a system can measure and how it acts viewed over a longer time period (stability), a factor often called drift.
Most systems tend to measure well after calibration; however, close to 100 % of measurements are completed when the longer-term performance of a system starts to play a more important role, hence the elevated importance of repeatability and stability for oxygen systems.
air at approximately 9000 µg∙kg-1 to 4 µg∙kg-1 is around 79 % faster than that of a typical amperometric sensor. As a result, the system up-time is higher with lower personnel intervention.
Comparative test and installationMany different tests have been performed in power plant environ-ments around the world to demonstrate the significant benefits that can be achieved by using optical oxygen sensors compared with amperometric sensors.
Data discussed and illustrated in this article includes that from the following installations:
1. Gas and steam combined cycle power plant; 1000 MW capacity, with an AVT water chemistry.
f Feed water oxygen measurement; typical values in the 0 to 10 µg∙kg-1 range at temperatures of 15 to 25°C. f Within the AVT chemistry, carbohydrazine and ammonia were present. f Both the optical K1100 sensor and the amperometric A1100 were fitted.
2. Pressurised water reactors (nuclear power plant); 355 MW capacity running a hydrogen water chemistry (HWC).
f Reactor water measurement; typical values below 1 µg∙kg-1 during hydrogen injection (during normal operation) at temperatures of 18 to 23 °C. f Hydrogen present in feed water at a concentration of 180 µg∙kg-1; radiation level of approximately 160 µSv∙h-1.
ORBISPHERE K1100Amperometric sensor
Correct Correct
Response timeCleaning
Cleaning Polarisation Response time
Cal
Cal
Time [min]
dO (µ
g kg
-1)
Figure 4: Maintenance, calibration, stabilisation and response timeline for an optical versus an amperometric sensor.

Repeatability
The system repeatability depends greatly on the measurement system and the various technologies and controllers in use. The higher the repeatability of a system, the lower the signal noise of the measurement signal.
Figure 5 shows a comparative test between the amperometric ORBISPHERE A1100, which is frequently used as a reference for online oxygen measurements, and the optical K1100 sensor. The optical sensor measures with a repeatability (r95) of ±0.1 µg∙kg-1 at concentrations of below 5 µg∙kg-1. This repeatability is comparable with that of the most accurate amperometric sensors available on the market, and offers an excellent measurement accuracy in power plant applications for OT and AVT methods and in nuclear power plants.
StabilitySensor drift is the greatest reason for concern among plant operators and can lead to excessive calibration and maintenance.
The stability of a system has a direct effect on the long-term confidence placed in the system – a system that drifts considerably will never serve as a data source for process control. It is reported that numerous systems have a drift of ±5 % [12] and of up to ±2 µg∙kg-1 per week [13] on the measurement values, requiring fre-quent interventions by personnel for calibration purposes and leading to a loss in confidence in the system. A drift of up to ±2 µg∙kg-1 per week in applications below 5 µg∙kg-1 is not acceptable for many operators of fossil power plants.With the stability or drift of a system playing such an important role in measurement during the time between calibrations, it really
is the overlying factor in all oxygen measurement systems.Figure 6 compares – at a typical drift of ±2 µg∙kg-1 – the necessary calibration frequency of two amperometric sensors (working at below average and average) with the calibration requirements of an optical sensor.
Amperometric sensors suffer drift when the electrolyte ages (being consumed by the oxygen measured), resulting in the sensor becoming less responsive. When higher oxygen concentrations are measured, for example during plant start-up or shotdown, this drift is even more pronounced – precisely when the measurements need to be most accurate, as the plant is switched online and high oxygen concentrations are expected. In the case of optical LDO technology, the long-term ageing of the sensor layer (luminophore) also causes a downwards drift of the measurement signals. However, this effect is much slower than on the amperometric sensors (refer to Figure 6). The LDO technology used in the optical K1100 system therefore guarantees a much high-er stability and much longer calibration intervals (up to 12 months).
Results comparison in hydrogen-rich samples As already mentioned, measurements in nuclear power plants in the primary cycle of a pressurised water reactor, in which very precise measurement values are required, can be very laborious with amperometric sensors. High hydrogen concentrations are often present in the sample in the primary cycle – with ampero-metric sensors, hydrogen concentrations can cause a negative offset of up to -10 µg∙kg-1. Although there are systems that bal-ance out this offset [14], precise oxygen measurement values are critical for the operation of HWC and NWC plants[15].
Time [days]
dO [ug/kg] ORBISPHERE K1100
ORBISPHERE A1100
Repeatability K1100 (r95)< 0.1 [ug/kg]
Differences K1100 versus amperometric sensor< 0.4 [ug/kg]
Figure 5: Comparative test of an optical sensor (K1100) and an amperometric sensor (A1100) in a steam boiler feed water application with AVT method
Time [days]
Drift less [ug/kg]
Calibration when drift of > 2 [ug/kg] is observed
ORBISPHERE K1100Amperometric sensor
Calibration required(below-average amp. sensor)
Calibration required(average amp. sensor)
Figure 6: Comparison of the drift of different sensors and the impact on the calibration requirements for measurements at concentrations of 4 µg∙kg-1
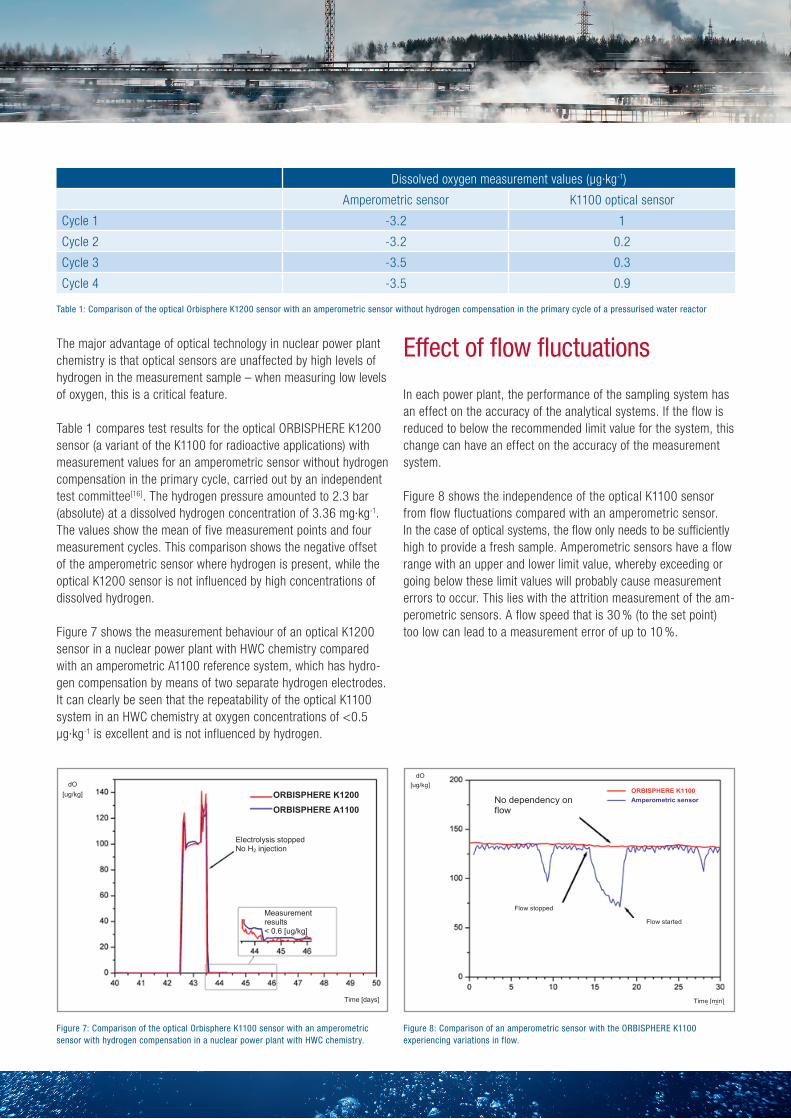
Effect of flow fluctuations
In each power plant, the performance of the sampling system has an effect on the accuracy of the analytical systems. If the flow is reduced to below the recommended limit value for the system, this change can have an effect on the accuracy of the measurement system.
Figure 8 shows the independence of the optical K1100 sensor from flow fluctuations compared with an amperometric sensor.In the case of optical systems, the flow only needs to be sufficiently high to provide a fresh sample. Amperometric sensors have a flow range with an upper and lower limit value, whereby exceeding or going below these limit values will probably cause measurement errors to occur. This lies with the attrition measurement of the am-perometric sensors. A flow speed that is 30 % (to the set point) too low can lead to a measurement error of up to 10 %.
The major advantage of optical technology in nuclear power plant chemistry is that optical sensors are unaffected by high levels of hydrogen in the measurement sample – when measuring low levels of oxygen, this is a critical feature.
Table 1 compares test results for the optical ORBISPHERE K1200 sensor (a variant of the K1100 for radioactive applications) with measurement values for an amperometric sensor without hydrogen compensation in the primary cycle, carried out by an independent test committee[16]. The hydrogen pressure amounted to 2.3 bar (absolute) at a dissolved hydrogen concentration of 3.36 mg∙kg-1. The values show the mean of five measurement points and four measurement cycles. This comparison shows the negative offset of the amperometric sensor where hydrogen is present, while the optical K1200 sensor is not influenced by high concentrations of dissolved hydrogen.
Figure 7 shows the measurement behaviour of an optical K1200 sensor in a nuclear power plant with HWC chemistry compared with an amperometric A1100 reference system, which has hydro-gen compensation by means of two separate hydrogen electrodes. It can clearly be seen that the repeatability of the optical K1100 system in an HWC chemistry at oxygen concentrations of <0.5 µg∙kg-1 is excellent and is not influenced by hydrogen.
Dissolved oxygen measurement values (μg·kg-1)
Amperometric sensor K1100 optical sensor
Cycle 1 -3.2 1
Cycle 2 -3.2 0.2
Cycle 3 -3.5 0.3
Cycle 4 -3.5 0.9
Table 1: Comparison of the optical Orbisphere K1200 sensor with an amperometric sensor without hydrogen compensation in the primary cycle of a pressurised water reactor
dO [ug/kg]
Time [days]
ORBISPHERE K1200ORBISPHERE A1100
Electrolysis stopped No H2 injection
Measurement results< 0.6 [ug/kg]
dO [ug/kg]
Time [days]
ORBISPHERE K1200ORBISPHERE A1100
Electrolysis stopped No H2 injection
Measurement results< 0.6 [ug/kg]
Figure 7: Comparison of the optical Orbisphere K1100 sensor with an amperometric sensor with hydrogen compensation in a nuclear power plant with HWC chemistry.
dO [ug/kg]
Time [min]
ORBISPHERE K1100Amperometric sensorNo dependency on
flow
Flow stopped
Flow started
dO [ug/kg]
Time [min]
ORBISPHERE K1100Amperometric sensorNo dependency on
flow
Flow stopped
Flow started
Figure 8: Comparison of an amperometric sensor with the ORBISPHERE K1100 experiencing variations in flow.

Summary
The performance of optical and amperometric oxygen sensors both in fossil power plants and in nuclear power plants was com-pared and discussed.
The measurement and control of the dissolved oxygen in power plant chemistry has never been as critical as it is today. While the number of qualified service engineers has been continually reduced (and continues to be reduced further), at the same time the economic pressure on plant operators to keep the capital equipment in operation for as long as possible grows. As a result, the labour time available to the personnel for servicing the meas-urement technology becomes an increasingly critical factor.
The measurement results presented in the comparative tests carried out in power plant and industrial water applications show that the repeatability of the optical K1100 sensor is comparable with that of the amperometric A1100 sensor, in particular at concentrations below 5 µg∙kg-1.
With respect to its stability, the K1100 optical sensor has proven that it far exceeds the amperometric sensors with a calibration interval of 12 months without an interim intervention.
Power plant-typical flow fluctuations have no negative influence on the accuracy of optical oxygen measurements. This is the result of a further test comparison between the amperometric A1100 and the optical K1100. This is a decisive advantage, as conventional amperometric sensors often tend towards results that are too low, due to their attrition measurement in the case of flow fluctuations. This occurs in par-ticular at very low flow speeds.
In addition, the optical K1100 sensor did not show any cross sen-sitivity in the presence of hydrogen. This has been proven with an amperometric A1100 sensor, which was operated with and without hydrogen compensation.
The response time of the K1100, following successful calibration and return to operation (upon reaching an oxygen concentration of 4 µg∙kg-1) was approximately 79 % faster than that of the fastest amperometric sensor. The calibration and maintenance effort is up to 95 % less.
In general, the K1100 offers all users cost-efficient and exact oxygen measurements. With a proven repeatability of ±0.1 µg∙kg-1 and the possibility of measuring for a time period of 12 months without additional service intervals, calibration or personnel inter-vention, the ORBISPHERE K1100 sets new standards in oxygen measurements within power plants.
The instruments used
ORBISPHERE K1100 Optical K1100 sensor with transmitter 410, flow chamber and flow meter integrated in a prefabricated panel for simple installation in-cluding flow chamber, flow meter and three-way valve. “Plug and play” start up.Numerous memory and diagnosis functions together with a colour touch screen make operation easier and enable a high measure-ment value quality.
Optical K1100 sensor with transmitter 410, flow chamber and flow meter integrated in a prefabricated panel for simplified installation including flow chamber, flow meter and three-way valve

References1 Dooley, B., Shields, K. ; Cycle Chemistry for Conventional Fossil Plants and Combined Cycle/HRSGs – PPChem 2004, 6(3).2 McInnes, D. ; Stator Cooling Water Deoxygenation Control at Tarong Power Station – PPChem 2006, 8(5)3 Smith, Rebecca. ; Turmoil in Power Sector – Wall Street Journal – Politics, 14.01.10.4 Hach Company ; HACH LDO® Dissolved Oxygen Probe – LIT 2455, 07/2007.5 Osmetech, USA ; OPTI® CCA Blood Gas Analyzer.6 Lindblom, T. ; Qualitative Comparison of Optical and Amperometric Sensors for measuring Dissolved Oxygen in Bioreactors –
Linköping University, Institute of Technology – 03/2009.7 Pütz, Petra ; Determination of oxygen in wine – Hach Lange Applications, 07/2008, DOC042.52.20018.Jul08.8 Hach Company ; Case History: Bristol-Myers Squibb/Hach Process Luminescence DO – S-P250, 07/2004.9 Hach Company ; Case History: Bristol-Myers Squibb/Hach Process Luminescence DO – S-P250, 07/2004.10 Dooley, B., Shields, K. ; Cycle Chemistry for Conventional Fossil Plants and Combined Cycle/HRSGs – PPChem 2004, 6(3).11 ISO ; International vocabulary of basic and general terms in metrology – ISO/IEC Guide 99:2007.12 ABB Limited ; Low and High Level Dissolved Oxygen Monitor, Model 9437 – SS/9437_7, 11/2006.13 Waltron LLC ; Dissolved Oxygen Analyzer: Aqualyzer® 9062 – 05/2009.14 Hach Company ; Orbisphere 512 Oxygen-Hydrogen Controller – 2009.15 Böttcher, F. ; Mandatory and Desirable Instrumentation in PWR and BWR Units – Power Plant Chemistry, Zurich, 09/2006.16 Auener, C. ; Serco TAS Orbisphere Trial – 07/2009.
ORBISPHERE A1100The amperometric A1100 oxygen sensor has been designed both for process monitoring and for laboratory analysis tasks in liquids or in the gas phase for a large number of applications where the oxygen measurement is crucial. The exclusive sensor design ena-bles a very low signal noise and a unique level of accuracy of ±0.1 µg∙kg-1. The fast response time is achieved by a special membrane construction. The guard ring electrode shields influences from other gases and increases stability. The A1100 is a sensor with a fast response behaviour to sample changes for extremely effective pro-cess monitoring.
ORBISPHERE 3100The portable variant of the K1100 system used is the data logger 3100. This is used for fast and easy monitoring of the dissolved oxygen at various measurement points in the power plant, includ-ing the analytical laboratory. Separate flow chambers, cut-off valves or additional sensors are not required. Data security is guaranteed by a special logger that can save 5700 measurement values, which can also be shown graphically.
Portable data logger ORBISPHERE 3100 including flow chamber, cut-off valve and measurement value memory
Amperometric oxygen sensor ORBISPHERE A1100 including guard ring electrode to shield the influences of other gases and to increase stability. The A1100 is also equipped with a separate hydrogen sensor to compensate for the influence of hydrogen.