optical measurements of plasma velocity and temperature...
TRANSCRIPT

Surface and Coatings Technology 162(2002) 79–92
0257-8972/02/$ - see front matter� 2002 Elsevier Science B.V. All rights reserved.PII: S0257-8972Ž02.00565-0
Optical measurements of plasma velocity and temperature in a low-rate,low-power LPPS system
H. Hamatani *, W.S. Crawford, M.A. Cappelli1,
Department of Mechanical Engineering, High Temperature Gasdynamics Laboratory, Stanford University, Stanford, CA, 94305-3032, USA
Received 17 May 2002; accepted in revised form 16 August 2002
Abstract
Low-pressure plasma spraying(LPPS) is a promising method of applying coatings to surfaces for thermal, chemical, andmechanical protection. The deposition of coatings with superior properties requires an improved understanding of this complexspray process, including the detailed understanding of the time–temperature and chemical history to which an injected particle isexposed during its travel through the high-temperature and high-velocity plasma jet. In this paper, we report on measurements ofthe temperatures and velocities within the plasma in a low-pressure argon–hydrogen arcjet spray plasma being developed formesoscale manufacturing of mechanical components. The measurements reported here make use of laser absorption, laser-inducedfluorescence, and optical emission spectroscopy of the H Balmer transition in atomic hydrogen. Both the absorption anda
fluorescence methods take advantage of the well-known spectral line broadening of atomic hydrogen, to extract the arcjettemperature and electron density. Jet axial velocities are measured via the time of flight, as detected by optical emission, ofconvected disturbances caused by intrinsic fluctuations in the arc voltage. Measurements made for various anode(nozzle)geometries indicate that relatively low(;1 km s mm ) velocity gradients in the axial direction could be achieved withy1 y1
nozzles that include an expanding section of 108 half-angles. The measured temperatures and velocities suggest the presence ofcomplex gas-dynamic shock structures in the arcjet plume, depending on the particular nozzle length and expansion section.� 2002 Elsevier Science B.V. All rights reserved.
Keywords: Low pressure plasma spraying; Laser absorption; Laser-induced fluorescence; Arcjet temperature; Electron density; Jet axial velocity
1. Introduction
Conventional thermal spray processes operate at rel-atively high power(30–120 kW), have relatively highdeposition rates(50–100 g min ) and are capable ofy1
depositing most materials that have a liquid phasew1x.Among many advanced spray-coating technologies thatare used to deposit thick(thickness greater than 1 mm)chemical and thermal protective barriers, plasma spray-ing is considered to be one of the most effective andmost widely used. However, conventional plasmasprayed coatings, along with other spray coating meth-ods, often have a relatively low strength compared to
*Corresponding author. Fax:q81-43-80-2745.E-mail address: [email protected](H. Hamatani).On leave from the Nippon Steel Corporation, Welding & Joining1
Laboratory, 20-1 Shintomi, Futtsu, Chiba, 293-8511, Japan.
bulk materials. This problem, or the related problem oflow adhesion strength to the substrate, may preclude theuse of these coatings in applications requiring uniformlyhigh mechanical strength.The strength of sprayed coatings depends substantially
on features, such as porosity and interlamellar strength,that exist because the coatings are built of solidifieddroplets, or splats. These features result from the splatprocess on the substrate, and thus the properties ofcoatings have been correlated closely to the temperatureand velocity of particles upon impactw2x. The incom-plete melting of injected particles is often the primaryreason for a low spraying efficiency and a low bulkstrength and adhesion strength. Particles’ temperaturesand velocities typically sustain higher values in low-pressure plasma spraying(LPPS) than in atmospheric-pressure plasma spraying(APS) w1x. LPPS processingcan accommodate a wide range of materials, including

80 H. Hamatani et al. / Surface and Coatings Technology 162 (2002) 79–92
refractory metals and ceramics, with its high capacityfor melting and fusing particles.The exclusion of air from the vacuum chamber also
prevents oxidation of the particle or substrate at elevatedtemperature. Higher limits on substrate temperatureallow two advantages: increased adhesion strength bydiffusion at the substrateycoating interface; and, greatercontrol over post-process residual stress, which is direct-ly related to the temperature gradient in the systemduring processing.Due to several factors, LPPS coatings thus often
demonstrate higher adhesion strength, higher bulkstrength, and lower porosity, especially in metallic sys-tems, than do APS coatings. Studies have shown LPPSto improve the overall properties of sprayed metallurgi-cal coatingsw3x.The (velocity, temperature) state of sprayed particles
is also important for determining the true microstructureof coatings, including cases such as deposition of alloyor compound feedstockw4x, or spraying in reactive gasesw5x. For alloys or compounds, the cooling rate is criticalfor determining grain size and phases present, and thestate of the impacting particle helps to determine thecooling ratew6x. For reactive spraying, the state of theparticle helps to determine the extent of reaction inflight. Of course, the thermodynamic state of the reactivegas is similarly important.In fact, the conditions of the plasma gas are critical
in all spray cases. Due to heat and momentum transfer,the state of particles depends critically on the tempera-ture and velocity fields of the plasma jet itself. Theseinteractions have been modeled fairly extensivelyw7x.Knowledge of the plasma temperature and velocity fieldsis important during the design stage of a plasma sprayprocess, when model predictions and well-designedexperiments can help to guide the choice of many otherkey process parametersw7x.The current study is motivated by the development
of low-power LPPS technology suitable for the rapidprototyping of mesoscale mechanical devices usingshape-deposition manufacturing methodsw8x. Thesemechanical systems, such as micro gas turbine enginesw9x, require materials to have properties comparable tothe bulk cast properties, and, in some cases, must bedeposited in a layer-by-layer fashion in order to achievecomplex three-dimensional shapes.This paper describes the measurement of plasma
temperatures and plasma velocities in an arcjet plume.This plasma jet is a low-power LPPS source that wehave developed and used recently to spray thick coppercoatings of relatively high bulk mechanical strength atvery low deposition rates(approx. 0.1 g min ) andy1
low arc powers(2–4 kW) w10x. As shown here, the jetproperties are strongly dependent on the geometry ofthe anode(nozzle) and on the overall operating condi-tions. Knowledge of this dependence has guided our
selection of spray conditions and configurations neededto extend this process to more challenging structuralmaterials such as stainless steel and alloys of titaniumand aluminum, and possibly to reactively sprayed metal-nitrides.The plasma gas used here was a mixture of hydrogen
and argon. Argon–hydrogen mixtures are widely usedin LPPS. Hydrogen is added to argon to increase theoverall plasma enthalpy at a fixed discharge current(higher operating voltage), and to increase the plasmathermal conductivity. These two effects enhance theheating of particles. The presence of electronically excit-ed atomic hydrogen in the jet also provides a convenientspectroscopic means of probing temperature and veloc-ity, since it is a strong radiator at 438 nm and 656 nm,the wavelengths corresponding to the Balmer-b andBalmer-a electronic transitions, respectively. Our labor-atory has used optical emission, laser absorption, andlaser-induced fluorescence(LIF) extensively in the pastw11x, to understand the properties of arc-heated hydrogenflows. The 656 nm transition is readily accessed bymodern tunable narrow-band laser sources to permitinterrogation of this transition with high spectral reso-lution. The following discussion regards spectroscopicmeasurements of this Balmer-a transition in the H atomspresent in the LPPS jet.
2. Measurement and analysis techniquesimplemented
2.1. Lineshape analysis
2.1.1. Relevant broadening mechanismsWhen the signal intensity of absorption or LIF is
plotted vs. wavelength or wavenumber, the shape of apeak(or lineshape) carries information on temperatureand velocity distribution of the optically active particles.The peak is broadened by various mechanisms thatcreate a distribution in the energies of photons absorbedor emitted, in the absorption or LIF case, respectively.
Doppler broadening of the spectral peak is due to thedistribution of velocities of the absorbing or fluorescingH atoms. Thus, the degree of Doppler broadening canbe used to measure the translational temperature of theseatoms. At typical pressures for LPPS, thermal equilib-rium exists between H atoms and the other atomic andmolecular species present. Doppler broadening aloneproduces a Gaussian profile.
Stark broadening is caused by interactions of elec-tronically excited atoms with the microfields aroundcharged particles, namely ions and free electrons, in theplasmaw12x. Analysis of the degree of Stark broadeningcan yield the density of ions and electrons(plasma

81H. Hamatani et al. / Surface and Coatings Technology 162 (2002) 79–92
density), for sufficiently high plasma densitiesw13x.Stark broadening alone produces a Lorentzian profile.Under plasma conditions that produce amounts of
both Doppler and Stark broadening that are discernibleand comparable in magnitude, both effects can bemeasured on a single peak. The profile that is generatedby the convolution of a Gaussian profile and a Loren-tzian profile, provided that the two broadening mecha-nisms are statistically independent, is known as a Voigtprofile.For the plasma densities expected near the exit of the
arcjet (n )3=10 m ), Stark broadening due to19 y3e
interactions between the excited hydrogen atoms andthe background ions or electrons cannot be neglectedw14,15x. Thus, H-atom translational temperature andelectron density were determined as the two parametersin a Voigt fit to the measured Balmer-a spectral linesha-pe taken by absorption or LIF. Both broadening mech-anisms contribute to the measured width of the spectralline. They are distinguishable since they affect the shapeof the line in different ways.In fitting the data, the Voigt-shaped five partially
resolvable fine structure components are summed toobtain the overall lineshape,f (n):V
5
Ž . Ž .f n s R f n (1)V i V,i8is1
wheref (n) is the spectral lineshape for each of theVi
five fine structure components, andR is the relativei
line strength. Letting the third line be the center, thefive fine-structure peaks are located at the followingpositions in wavenumbers(cm ): y0.144,y0.036, 0,y1
0.22, 0.328. Although the overall linewidths were greaterthan the spacing of the fine structure, the fine structurecomponents affected the overall shape substantially. Theresolution of the measurement was 0.005 cm .y1
2.1.2. The effect of gas mixture on Stark broadeningWhen hydrogen ions constitute the ionic population
of the plasma, the full width at half-maximum(FWHM)of the Stark broadening contribution to the Voigt line-shape is well approximated, for this intermediate regimeof n , by the empirical relationw16x:e
0.09 y3Ž .logDl s0.027n y3.3 nm, m (2)S e
However, as described above, the plasma gases usedin plasma spraying are usually mixtures. In the gasmixtures studied here, which consist of at least 55 mol%argon prior to dissociation of hydrogen, one must con-sider the possibility that argon ions are also importantperturbers in the observed Stark broadening. Stehle and´Feautrierw17x showed the dependence on ion propertiesin an approximate analytical expression for the ion-induced Stark width of H :a
0.5 SB Em* 1 TIyHy4 UC FDn s1.55=10 n 27.54TS,I ID G Vm ye TI
2w zWT T m Te I eXqlnx |TŽ . YT qT n m*y ~e I I IyH
y3Ž .Hz, cm , K (3)
wheren is the ion density,m* is the reduced massI IyH
of the pair of ion and H-atom, andT , T , andm areI e e
the ion and electron temperatures and electron mass,respectively. Eq.(3) assumes theimpact limit for theStark effect, in which thermal motion of the ions isimportant. This assumption is appropriate for electrondensities up to approximately 10 m w14x. For a20 y3
mixture containing both H and Ar , assuming that theq q
different ions have the same temperature, Eq.(3) yieldsapproximately
0.5B EDn n m*q q qS,Ar Ar Ar yHC Ff (4)D GDn n m*q q qS,H H H yH
Eq. (4) illustrates, for the case of argon, the twoways in which the presence of other species may nothave an appreciable effect on the Stark broadening ofthe H line. First, the contribution of argon ions to thea
linewidth is proportional to their density. Using the Sahaequation(assuming local thermodynamic equilibrium)as a guideline, we expect the ratio y to be onlyn nq qAr H
approximately 0.01–0.1 for the upper range of jettemperatures measured, 3750–6000 K. Furthermore, dueto the use of the reduced mass in Eqs.(3) and (4), theeffect of perturber mass on linewidth is limited. Thequantity y equals 1.95, so the Starkm* m*q qAr yH H yH
linewidth per unit density for argon ions exceeds thatfor hydrogen ions by only 40%. Using these values inEq. (4), argon ions are expected to contribute less than14% to the overall Stark broadening, implying that thepure-hydrogen relation, Eq.(2), is a valid approximationfor these argon–hydrogen mixtures at thesetemperatures.It should be pointed out that peak plasma temperatures
at the arc have been measured at approximately 10 000K for a similar arcjet on pure hydrogenw18x. In Sahaequilibrium at 10 000 K, Eq.(4) predicts nearly equalcontributions from Ar and H to the Stark linewidth.q q
Near the arc, therefore, or in the case of frozen chemistrythat has been established by an arc, Eq.(2) must bereplaced with an expression that accounts for the contri-bution of argon ions to the Stark effect.
2.2. Velocity measurements by Doppler shifted peaks(Doppler shift velocimetry)
Besides lineshape measurements, the component ofbulk velocity in the direction of view can be inferredfrom a net Doppler shift, of the entire spectral peak,

82 H. Hamatani et al. / Surface and Coatings Technology 162 (2002) 79–92
Fig. 1. Schematic diagram of the experimental setup for velocitymeasurements by the correlation method. Fiber separation distanceDl9was varied in the range of 1–3 mm.
relative to the peak observed for a stationary gasw19x.In our facility, however, the axial view was preventedby the presence of a substrate holder for spray depositionstudies. This obstruction precluded the use of LIF tomeasure axial velocities.
2.3. Velocity measurements by fluctuation propagation
In the present study, we instead measured the axialplume velocity by timing the propagation of variationsin the excited-state density induced by natural fluctua-tions in the arc discharge power. These normally-occur-ring disturbances arise from small fluctuations in thepower supply voltage that compensate for instabilitiesin the attachment of the arc root on the anodew20x. Theresulting fluctuations in the 656 nm line emission weretracked at two known axial locations and the delaybetween the arrivals of disturbances in emission wasattributed to the finite mean velocity. To determine withaccuracy the temporal shift in the two emission wave-forms, a cross-correlation operation was applied to thetime-dependent signals on the two detectors. Thus, theaverage velocity over the sampling time was measured.We shall refer to this method as theemission correlationmethod for plasma velocity measurements. Pobst et al.w21x used this method in a pure hydrogen arcjet andshowed it to be consistent with measurements madeusing LIF.Pobst et al.w21x also developed a similar method
with finer temporal resolution, called current modulationvelocimetry(CMV), in order to resolve the dependenceof velocity on the phase of the fluctuation waveformitself. This resolution was not necessary for plasmaspray studies, because particles are accelerated andheated slowly as compared to the frequency of fluctua-tions. The calculated characteristic time scales for accel-eration and heating of particles in this system are on theorder of 0.1–1 ms, whereas the period of fluctuation forthe power supply was less than 10ms. Also, CMV maynot be desirable when temporal resolution is not neces-sary, because it requires external perturbation of the arccurrent.The setup used here differs slightly from that of Pobst
et al. by using precision-mounted optical fibers tofacilitate the precise spacing of collection sites. It alsorepresents a hybrid of the two methods highlighted inPobst et al.w21x, using two PMTs for spatial resolutionwhile averaging temporally. Fig. 1 shows a schematicdiagram of the optical setup used here for the correlationmethod.
2.4. Knudsen number criteria for applying the correla-tion method
With filters passing only the emission near 656 nm,the only velocity measured directly by the correlation
method was that of excited hydrogen atoms in theplasma. There are two criteria that should be satisfiedto assert that this velocity equals that of the other plasmaconstituents.Most importantly, if the flow is in the continuum
regime, then the mean velocities of the various speciesare equal. The relevant criterion is
lKn s g1 (5)d d
wherel is the mean free path between particles in themixture, andd is a characteristic length of the jet suchas the jet diameter. In the studied region of this plasmajet, l is typically in the range of 30–60mm for argonand 200–400mm for atomic hydrogen. The pressuresin the jet are not known exactly, but due to its relativelysmall area ratio in the diverging section, the nozzle islikely to be under-expanded for low chamber pressures.Thus, l is calculated using the chamber pressure, andthe measured temperature, to obtain an upper bound onKn . An upper-bound estimate for Kn , for chamberd d
pressure 5.3 kPa, is 0.1(for H atoms at the 2 mm axialposition where the jet diameter is approx. 3 mm). Sincethis barely satisfies the criterion, it could cast into doubtthe continuum flow assumption for chamber pressureslower than 5.3 kPa, at locations very near the nozzleexit. The observed existence of relatively thin shocks,however, indicates thatl is much smaller thand for thejet conditions and regions studied here, since shockwave thickness is on the order ofl w22x.The other criterion of interest, to validate this velocity
measurement in a gas mixture, relates to the number ofcollisions that occur between the sites at which emissionis detected. Since collisions between H and Ar atomsequalize their mean velocities, the equivalence of thedetected and the mixture velocity are only confirmed

83H. Hamatani et al. / Surface and Coatings Technology 162 (2002) 79–92
for a given measurement location if several such colli-sions occur between detection sites. This criterion canbe expressed in the form of another Knudsen number:
l mAr-H HKn s F (6)Dl,Ar yDl mAr
wherel is the mean distance traveled by an argonAr–H
atom between collisions with hydrogen atoms, andDlis the distance between detection sites as shown in Fig.1. The inequality in Eq.(6) gives an approximateguideline of Kn less than approximately 0.16,Dl,Ar
reflecting that several such collisions are required toappreciably alter the momentum of the much heavierargon atomw23x. Thus, in regions of steep velocitygradient, the two species may exhibit different velocitiesover length scales less than a fewl . This consid-Ar–H
eration can establish a minimum on the detector spacingfor a mixed flow, especially when the tracer specie hasmass much different from other species in the flow. Inthe present study at 5.3 kPa, the conservatively estimatedvalues for Kn were at a maximum of approximatelyDl,Ar
0.03 near the jet exit, satisfying the inequality in Eq.(6). At 1.1 kPa, however, Kn may be as high as 0.2Dl,Ar
near the jet exit, so the maximum detected velocity maybe higher than the argon velocity for the lowest pressurecases reported here.
2.5. Equilibrium assumptions for temperaturemeasurements
The absorption and LIF techniques described here useDoppler broadening of the Balmer-a line to measure thetranslational temperature of atomic hydrogen. To equatethis measured temperature to that of argon and anymolecular hydrogen in the flow, local thermodynamicequilibrium is assumed for the mixture. The measuredintensity ratios between Balmer-a and Balmer-b reflecthigher temperatures, from which we infer an approxi-mate electron temperature assuming thermal equilibriumbetween free electrons and the excitation state of Hatoms.
2.6. Abel inversion of laser absorption data
Whereas LIF measurements are spatially resolved towithin the volume of intersection of the excitation laserand the collection optics, the absorption signal representsan integral of the strongly varying plasma propertiesalong the beam path. For a plasma plume with radialsymmetry, successive absorption measurements throughvarious lateral chords of the jet can be converted toradial data through an Abel inversion. However, theplume studied here does not satisfy the condition ofradial symmetry required for accurate Abel inversion.Spectroscopic data, as well as flow visualization, indi-cate asymmetry in this arcjet plume. Asymmetric flow
may stem from uneven electrode wear that seems toresult from slight initial misalignment of the cathodeand surrounding anodeynozzle. Abel inversion was car-ried out for a limited data set, nonetheless, for compar-ison to the spatially resolved LIF temperaturemeasurements. We have employed a segment methodw24x when using the Abel inversion. Most of the absorp-tion data shown here are instead from the basic, line-of-sight signal, in order to avoid inversion error due toasymmetry. This is described further below.
3. Experimental procedures
Fig. 2 shows the experimental setup highlighting thelow-pressure plasma source, and the components usedfor the laser absorption and the LIF measurements. Theplasma source and deposition facility consists of a 30cm diameter by 25 cm long vacuum chamber equippedwith feed through for the powder injection(the powderfeeder is located outside of the vacuum chamber), waterfor substrate cooling, and optical ports for emission andLIF diagnostics. The plasma discharge head is a modi-fied low-power commercial Komatsu G9401 transferred-arc cutting torch, with a redesigned cathode and anodefor low-power non-transferred arc plasma spraying.Although the main body of the arc source is locatedinside the vacuum chamber, it is interfaced to the outsideof the chamber with a compression vacuum fitting, sothat all connections(power, water, plasma gas) are madeoutside of vacuum for convenience. Regulated currentis delivered to the arc source by a Komatsu 4 kW(maximum) fine plasma power supply. The vacuumchamber is pumped by two mechanical pumps with atotal capacity of 2300 cfm. It is possible to maintainchamber pressures in the range from 0.7 to 101.3 kPaduring plasma spraying, although the present results arefor 1.3–10.7 kPa, which is a typical range over whichwe have performed spray studiesw10x.For LIF and absorption studies, we used a tunable
external-cavity diode laser(New Focus Inc. Model 600910 mW maximum). For LIF, a wedged and coated beamsplitter (Opto-Sigma Model 038-2460) provided a pre-cise fraction of the beam for a coarse measure of theincident intensity(Photodiode 2 in Fig. 2) and a wave-length reference(using a Burleigh wavemeter). Forabsorption, the reference intensity was taken to be thetransmitted beam intensity with gas flow but no arc,measured immediately prior to striking and stabilizingthe arc for an absorption measurement. This alternativewas chosen due to etalon problems with a differentbeam splitter.In both cases, the probe beam was passed through
both an optical chopper(New Focus 3501, 1.5-kHzchopping rate) for phase-sensitive discrimination againstplasma emission, and a double convex lens(40 mmdiameter, 400 mm focal length) that produced a tight

84 H. Hamatani et al. / Surface and Coatings Technology 162 (2002) 79–92
Fig. 2. Top-view schematic diagram of the experimental setup. Composite of systems for laser absorption, laser-induced fluorescence, and line-ratio measurements. Plasma jet direction is into the page.
beam waist(0.5 mm) for high spatial resolution. Forabsorption measurements, the intensity of the beamtransmitted through the plasma was measured by asecond photodiode(Photodiode 1 in Fig. 2). The trans-mitted laser photodiode signal was sent to a lock-in-amplifier (Stanford Research Systems SR850). A PCcontrolled the diode laser and the lock-in amplifier. Thetuning range of the diode laser was found to be 656.39–656.56 nm. The tuning rate chosen for these studies was0.002 nm s . A Hamamatsu R928 photomultiplier tubey1
(PMT) was used to detect the laser-induced fluorescenceemission from the intersection of foci of the laser andthe collection optics. The collection train consisted of alens of diameter 40 mm and focal length 400 mm,neutral density filter(�2), and an interference-typebandpass filter. The bandpass filter, centered at 656.3nm with FWHM of 11.5 nm, was used to isolate theBalmer-a emission from broadband light sources.For some plasma conditions, this optical train was
used to collect emission simultaneously from the Bal-mer-b transition as well, by inserting a beam splitterand second PMT instrumented with a bandpass filtercentered at 438 nm. Both photomultipliers were cali-brated for relative spectral response, and the ratio of thespectral line intensities forspontaneous emission wasused to estimate the electron temperaturew13x.LIF measurements are point-specific and thus offer
excellent spatial resolution. Also, the LIF lineshapemeasurement does not require compensation for laserattenuation if the absorptance along the laser path is
wavelength-independent over the tuning range. Thisassumption was considered to be valid, for the room air,quartz lens and window due to the narrowness of thetuning range, and for the chamber bath gas due to itslow temperature and thus negligible concentration ofatomic hydrogen. A small error may have been incurredby neglecting the spectral variation of absorptance ofthe portion of the plasma jet through which the laserpasses prior to reaching the measurement volume. How-ever, this effect was minimized by minimizing the laser’spath length through the plume.On the other hand, the intense background plasma
emission necessitated scans of relatively long duration.Integration times greater than 1 s, on the lock-in ampli-fier, were required in order to achieve a desired signal-to-background ratio greater than 10 at maximumfluorescence. Laser absorption measurements, converse-ly, do not suffer due to background emission, but theylack spatial resolution as described in the previoussection.As discussed above, axial velocities were measured
by the correlation method diagrammed in Fig. 1. Plasma-induced optical emission was imaged with a bi-convexlens (fs400 mm) at a magnification ofMs1.2 ontothe entrance aperture of two optical fibers(core size is62.5mm, manufactured by Wave Optics Inc). The fibersdelivered the signals to the pair of photomultipliers(Hamamatsu R928), PMT and PMT , respectively. The1 2
light emitted from points A and B in the plasma jet,separated by a distanceDl, was projected onto the
85H. Hamatani et al. / Surface and Coatings Technology 162 (2002) 79–92
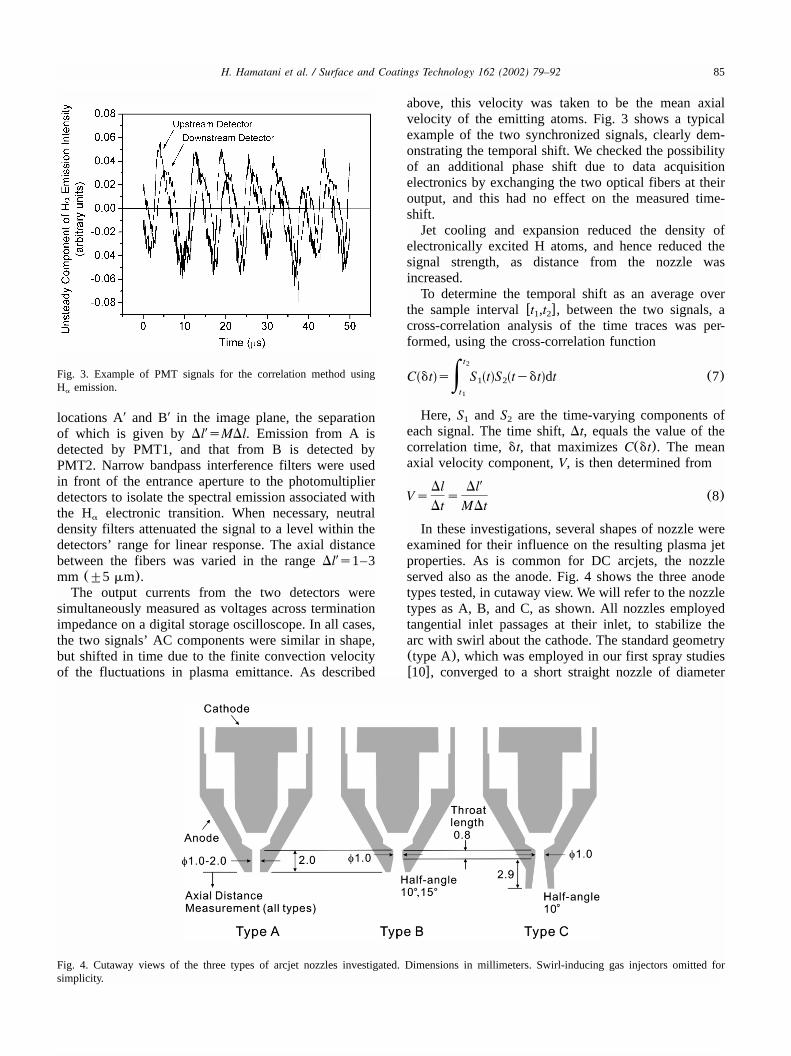
Fig. 3. Example of PMT signals for the correlation method usingH emission.a
Fig. 4. Cutaway views of the three types of arcjet nozzles investigated. Dimensions in millimeters. Swirl-inducing gas injectors omitted forsimplicity.
locations A9 and B9 in the image plane, the separationof which is given byDl9sMDl. Emission from A isdetected by PMT1, and that from B is detected byPMT2. Narrow bandpass interference filters were usedin front of the entrance aperture to the photomultiplierdetectors to isolate the spectral emission associated withthe H electronic transition. When necessary, neutrala
density filters attenuated the signal to a level within thedetectors’ range for linear response. The axial distancebetween the fibers was varied in the rangeDl9s1–3mm ("5 mm).The output currents from the two detectors were
simultaneously measured as voltages across terminationimpedance on a digital storage oscilloscope. In all cases,the two signals’ AC components were similar in shape,but shifted in time due to the finite convection velocityof the fluctuations in plasma emittance. As described
above, this velocity was taken to be the mean axialvelocity of the emitting atoms. Fig. 3 shows a typicalexample of the two synchronized signals, clearly dem-onstrating the temporal shift. We checked the possibilityof an additional phase shift due to data acquisitionelectronics by exchanging the two optical fibers at theiroutput, and this had no effect on the measured time-shift.Jet cooling and expansion reduced the density of
electronically excited H atoms, and hence reduced thesignal strength, as distance from the nozzle wasincreased.To determine the temporal shift as an average over
the sample intervalwt ,t x, between the two signals, a1 2
cross-correlation analysis of the time traces was per-formed, using the cross-correlation function
t2
Ž . Ž . Ž .C dt s S t S tydt dt (7)1 2|t1
Here, S and S are the time-varying components of1 2
each signal. The time shift,Dt, equals the value of thecorrelation time,dt, that maximizesC(dt). The meanaxial velocity component,V, is then determined from
Dl Dl9Vs s (8)
Dt MDt
In these investigations, several shapes of nozzle wereexamined for their influence on the resulting plasma jetproperties. As is common for DC arcjets, the nozzleserved also as the anode. Fig. 4 shows the three anodetypes tested, in cutaway view. We will refer to the nozzletypes as A, B, and C, as shown. All nozzles employedtangential inlet passages at their inlet, to stabilize thearc with swirl about the cathode. The standard geometry(type A), which was employed in our first spray studiesw10x, converged to a short straight nozzle of diameter

86 H. Hamatani et al. / Surface and Coatings Technology 162 (2002) 79–92
Fig. 5. Typical measured LIF excitation spectrum, taken by varyingthe laser wavelength across the H transition, and its Voigt fit.wTypea
C nozzle, chamber pressure 2.4 kPa, arc power 1.95 kW(30 A=65V), argon flow rate 3.7 sl min , hydrogen flow rate 3.0 sl min .xy1 y1
Fig. 6. Comparison of radial temperature profiles measured by threedifferent methods: directly by LIF; by Abel inversion of laser absorp-tion spectra; by direct analysis of laser absorption spectra.wAt axialposition 4 mm, Type C nozzle, chamber pressure 2.4 kPa, arc power1.95 kW(30 A=65 V), argon flow rate 3.7 sl min , hydrogen flowy1
rate 3.0 sl min .xy1
that was varied from 1 to 2 mm. The other two nozzletypes had throats of diameter 1 mm, followed by short(type B) or long (type C) conical diverging sections ofangles as noted in the figure. Table 1 summarizes thenozzle parameters, as well as the other key operatingconditions, for the experiments. Axial positions weremeasured relative to the exit plane of the short nozzles(types A and C). At any given axial location, the centerreference for radial position was taken to be where theabsorption due to the H transition was found to be aa
maximum.
4. Results and discussion
Fig. 5 shows a typical LIF excitation spectrum, takenby varying the laser wavelength across the H transitiona
and thus collecting the spectral fluorescence through thebandpass filter. Also shown in the plot is the correspond-ing Voigt lineshape fit to the spectrum, to extract boththe Stark(Lorentzian) and Doppler(Gaussian) compo-nents. These data were collected at the exit of a type Cnozzle, at a chamber pressure of 2.4 kPa, an arcjetpower of 1.95 kW (30 A, 65 V), and argon andhydrogen plasma gas flow rates of 3.7 sl min and 3.0y1
sl min , respectively. The Voigt fit, which is found toy1
capture the lineshape reasonably well, yields a temper-ature of 1800 K and an electron density of approximately1=10 m . The uncertainties in temperature and20 y3
electron density correlate to the signal-to-noise ratiosnear the core and in the wings of the lineshape, respec-tively. This is due to the respective dominance ofDoppler and Stark broadening in those spectral regions.For this example, the uncertainties inT and n aree
estimated to be approximately 17% and 25%,respectively.Detailed saturation studies were not carried out in this
work, since past LIF measurements performed by ourgroup in lower pressure(;0.1 kPa) hydrogen arcjetflows w16x indicated that H lineshapes were not satu-a
rated at comparable laser spectral irradiances used inour studies.The signal-to-noise ratio for LIF varied greatly
depending on the discharge conditions. For example, fora chamber pressure of 3.7 kPa, with all other dischargeconditions held constant, the LIF spectrum degradedrelative to the spectrum for lower pressures. The con-comitant increase in noise with chamber pressure wasattributed to background plasma emission.On the other hand, laser absorption measurements
were found to have very good signal-to-noise ratios overa broader range of plasma conditions. Therefore, theywere used widely, even though jet asymmetry preventedthe use of an Abel inversion as mentioned above. Mostof the temperature data shown were based instead on ananalysis of the direct line-of-sight absorption spectra.Thus, they provide only a qualitative indication of thevariation in the jet temperature. The inaccuracy in theline-of-sight data, due to radial variation of temperatureand population of the excited absorbing state, is reflectedin the discrepancies in Fig. 6. It is assumed, due to thesimilarity in size and shape of the plume over theconditions studied, that the line-averaged data are none-theless sufficiently repeatable for use in comparison ofvarying operating conditions and nozzle configurations.

87H. Hamatani et al. / Surface and Coatings Technology 162 (2002) 79–92
Fig. 7. Velocity profile by emission correlation measurement. Typicalspray conditions, axial position 2 mm. Type A nozzle, chamber pres-sure 5.2 kPa, arc power 1.50 kW(20 A=75 V), argon flow rate 3.7sl min , hydrogen flow rate 3.0 sl min .y1 y1
Fig. 6 compares the three types of temperature data.For typical spray conditions, except with pressuredecreased to enhance the LIF signal-to-noise, Fig. 6shows the radial temperature profile in the plasma jet asobtained from LIF and Abel-inverted absorption data.Also shown is the temperature inferred from directanalysis of the line-of-sight absorption spectra(whichassumes a uniform plasma along the line-of-sight), andpresented for various lateral positions across the jet. Theinverted absorption data are found to result in tempera-tures that appear to be lower than those determined byLIF, although it is noted here that part of this differencecan be attributed to the difficulty in reproducing theprecise downstream axial locations for the two measure-ments. It was found that the axial locations can differby as much as 1 mm, and, over the course of a mm inthe axial direction, a change in temperature of approxi-mately 1000 K is not unexpected. Another possiblesource for the discrepancy is a possible jet asymmetry.Note that the line-of-sight absorption analysis furtherunderestimates temperature, especially through the coreregion where gradients are highest.These measurements reveal that although reasonably
high temperatures are generated near the exit of thenozzle under conditions typically employed for LPPS,significant radial gradients in temperature(up to 2000K mm ) can exist in this low-power arcjet plasmay1
source. Such strong radial energy flows can have asignificant consequence on the thermal history of inject-ed particles in plasma spray deposition, since a largefraction of the particles have trajectories that can traversea large radial distance. These results underscore theimportance of precise entrainment of powder in the jetcore in this low-power LPPS system, in order to heatthe particles sufficiently.Fig. 7 shows the velocity distribution inferred from
the emission correlation measurements, for typical sprayconditions. The velocities are plotted vs. the lateraldisplacement from the centerline. Although the emissionwas collected with focusing optics, adjusted so that thefocal plane was the jet mid-plane, path-averaged out-of-plane emission contributes noise to the signal.For this measurement, to estimate the depth of field,
or the extent of effective measurement volume in theout-of-plane direction, one must consider two effects.First, the focusing optics alone(Fy18,Ms1.2, detectordiameters0.063 mm) produce a depth of field ofapproximately 1.0 mm. Second, all of the measurementswere done in the jet mid-plane, where the temperaturesare highest for a given lateral position, so the emittanceis at a maximum in the focal plane. The radial eccen-tricities of up to 0.5 mm for this jet may offset thisadvantage, yielding an estimated net effective depth offield of 1.0 mm. The spatial resolution in the axialdirection is also approximately 1 mm, due to the spacingbetween the detectors. We obtained strong peaks from
the correlation calculations, indicating that the spatialaveraging of out-of-plane velocities due to depth of fieldwas not excessive. The averaging that did occur wouldhave slightly reduced the radial velocity gradients asmeasured, further emphasizing the conclusion below.The lateral diameter of the detected area is only approx-imately 0.052 mm, due to the small size of the detectors.The effective measurement volume is approximately0.002 mm .3
The velocity profiles display significant radial asym-metry, similar to that found in the temperature field. Itis also clear from Fig. 7, that while very high axial jetvelocities (approx. 7 km s ) are generated near they1
exit plane of this LPPS source, there is a substantialradial gradient in the axial velocity most likely due tothe highly viscous nature of these low-pressure, super-sonic flows. Radial gradients of approximately 3 kms mm are not uncommon. This measurement againy1 y1
reinforces the need for precise powder injection as wellas the challenge of achieving it in the presence of sucha velocity field.The choice of nozzle diameter significantly influences
the temperature and velocity fields of the plasma jet. InFig. 8, we illustrate this effect for type A nozzles withdiameters in the range of 1.0–1.6 mm. Fig. 8a presentsabsorption measurements characterizing the radial tem-perature profile at a fixed downstream axial position of5 mm. Fig. 8b shows correlation method measurementsof axial velocity for positions on the jet centerline. Sincethey come from line-of-sight data, the temperaturesextracted should constitute lower bounds on the actualtemperatures in the jet. The plasma conditions for theresults shown here are flow rates of 3.7 sl min argon,y1
3.0 sl min hydrogen, current of 30 A, and chambery1
pressure of 5.2 kPa. These conditions are very common

88 H. Hamatani et al. / Surface and Coatings Technology 162 (2002) 79–92
Fig. 8. Effect of nozzle diameter on temperature and velocity. Type Anozzle, chamber pressure 2.7 kPa, arc power 1.95 kW(30 A=65 V),argon flow rate 3.7 sl min , hydrogen flow rate 3.0 sl min .(a)y1 y1
Radial temperature profiles at axial position 5 mm.(b) Axial profilesof axial velocity, measured from emission along chords intersectingthe jet axis.
Fig. 9. Comparison of axial profiles of axial velocity for the threenozzle geometries. Chamber pressure 5.3 kPa, arc power 1.95 kW(30A=65 V), argon flow rate 3.7 sl min , hydrogen flow rate 3.0 sly1
min .y1
for our LPPS studies. It is seen that higher upstreamtemperatures and axial velocities are achieved with anintermediate nozzle diameter of 1.1 mm. All else beingequal, larger diameter nozzles(e.g. 1.3 mm and 1.6mm) resulted in generally lower plasma jet temperaturesand velocities. For the larger diameters, the arc voltagewas also observed to be less stable. These measured andobserved effects would be consistent with reduced ther-mal efficiency of the torch for the larger diameters,though detailed efficiency measurements were not car-ried out for these cases. For these gas mixtures, thisplasma torch has thermal efficiency defined as net powerto plume divided by arc input power, of 50%–65%.
The axial velocity data also clearly identify thepresence of recurring diamond shocks, the first andstrongest of which occurs closer to the exit of the nozzlefor the smaller nozzle diameters. The diamond shockpattern is often visible as thin, dark, oblique lines in theglowing plume.A comparison is made of velocity profiles for the
three nozzle types in Fig. 9. All three nozzles had a 1.1mm diameter for their straight sections. The plasmaconditions for the results shown here are flow rates of3.7 sl min argon, 3.0 sl min hydrogen, a current ofy1 y1
30 A, and a chamber pressure of 5.3 kPa. The nozzleswith 108 diverging sections produced higher velocitiesoverall, with maximum velocities in excess of 5 kms . Furthermore, use of the longer(type C) 108 nozzley1
resulted in overall higher velocities at positions furtherfrom the nozzle exit.As expected, increasing the arc power dramatically
increases both temperature and velocity in the plasmajet. Fig. 10a shows temperatures measured at an axialposition of 5 mm, for discharge conditions similar tothose of Fig. 9 but varying arc current. The analogousvelocity measurements, of Fig. 10b, were taken at areduced hydrogen flow rate(1.5 sl min ) and aty1
reduced chamber pressure(1.1 kPa). In general, it isobserved that gas-dynamic shock features become morepronounced at the higher discharge powers. These arealso the conditions of maximum Mach number, calcu-lated to be approximately Mach 5 for 8 km s at 4000y1
K with incomplete hydrogen dissociation. The succes-sive shock waves seen to be prominent at the higherpowers eventually dissipate kinetic energy and result ina downstream velocity that is comparable to that of thelower discharge power. For spraying purposes, the ben-

89H. Hamatani et al. / Surface and Coatings Technology 162 (2002) 79–92
Fig. 10. Effect of plasma arc power on temperature and velocity.(a)Radial temperature profiles at axial position 5 mm. Type C nozzle,chamber pressure 5.2 kPa, argon flow rate 3.7 sl min , hydrogeny1
flow rate 3.0 sl min .(b) Axial profiles of axial velocity, measuredy1
from emission along chords intersecting the jet axis. Type A nozzleof diameter 1.1 mm, chamber pressure 1.1 kPa, argon flow rate 3.7sl min , hydrogen flow rate 1.5 sl min .y1 y1
Fig. 11. Effect of hydrogen flow rate on temperature at axial position5 mm. Type C nozzle of diameter 1.1 mm, chamber pressure 5.2 kPa,arc current 30 A, argon flow rate 3.7 sl min .y1
efit of higher arc power is not lost due to shocks, sincethe decreased kinetic energy is recovered as enthalpy.The addition of hydrogen to the flow, while increasing
the enthalpy due to increased arc voltage, is found tohave an unexpected impact on the temperature of theplasma jet. Fig. 11 shows the effect of increased hydro-gen flow on the temperature profile measured at an axiallocation of zs5 mm and at a chamber pressure of 5.2kPa. Plasma temperature was maximized, at this axiallocation, by an intermediate hydrogen flow rate of 2 slmin . Above 2 sl min , the benefit of increasedy1 y1
discharge power was apparently offset by the increasedheat capacity due to addition of a diatomic gas. Themolar specific heat of the AryH mixture increases with2
H fraction, not to mention the energy absorbed through2
dissociation of hydrogen. Some of this temperaturedeficit may be recovered in plasma–particle heat transferthrough the corresponding gains in plasma thermalconductivity. Thermal conductivity of a non-reacting gasmixture is proportional to its specific heat, and dissoci-ated H further increases the effective thermal conduc-2
tivity through recombination on the particle.A series of measurements of the local translation
temperature(as determined by LIF), electronic excita-tion temperature(by the ratio of intensities of the Hband H spectral lines), and of the local electron densitya
(from the Lorentzian component of the LIF spectralline) were performed at a fixed axial location(zs5 mmand rs0 mm) and varying chamber pressures. Theresults are displayed in Fig. 12 for the type C nozzle.The higher chamber pressure reduces the tendency forthe jet to expand, and, as expected, results in a higherelectron density. We find that there is a nearly linearrelation between the electron density and chamber pres-sure, as seen in Fig. 12b. On the other hand, at thehigher pressure, the gas temperature is seen todecrease—a result attributed to the entrainment of colderchamber gas near the plasma jet boundary. While thegas temperature decreases due to this entrainment, theexcitation temperature, which is elevated well abovethat of the gas temperature(due to an elevated electrontemperature) is seen not to vary substantially. This laterresult is not unexpected, as the electron energy relaxationis slow, due to the disparity between the electron andatomic hydrogen mass.The effects of varying chamber pressure on the axial
velocity are displayed in Fig. 13, for experiments per-formed with the short, 108 divergent nozzle. It isexpected that variations in the chamber pressure willaffect both the location and strength of the shock

90 H. Hamatani et al. / Surface and Coatings Technology 162 (2002) 79–92
Fig. 12. Effect of chamber pressure on temperature and electron den-sity. Type C nozzle of diameter 1.1 mm, arc power 1.50 kW(30A=75 V), argon flow rate 3.7 sl min , hydrogen flow rate 3.0 sly1
min . (a) Translational temperature and electronic temperature.(b)y1
Electron density.
Fig. 13. Effect of chamber pressure on axial velocity.(a) Axial pro-files of velocity at 1.1 kPa and 7.3 kPa. Type B nozzle of diameter1.1 mm, arc power 1.50 kW(20 A=75 V), argon flow rate 3.7 slmin , hydrogen flow rate 1.0 sl min .(b) Axial velocity vs. cham-y1 y1
ber pressure at axial position 4 mm. Type C nozzle of diameter 1.1mm, arc power 2.15 kW(30 A=75 V), argon flow rate 3.7 slmin , hydrogen flow rate 3.0 sl min .y1 y1
features, as seen from the measured axial variation inthe velocity for a relatively low pressure(1.1 kPa) andhigh-pressure(7.3 kPa) condition shown in Fig. 13a.The plasma conditions for the results shown here aregas flow rates of 3.7 sl min of argon, 1.0 sl miny1 y1
of hydrogen, a current of 20 A, and a voltage of 75 V.The location of diamond shocks will move upstreamwith increased chamber pressure, as the expansion wavesare reflecting off a jet boundary that is reduced indiameter. Measurements taken at a fixed axial location(zs4 mm) in the long, 108 divergent nozzle, withvarying pressure(Fig. 13b) shows a strong maximummost likely the result of the upstream passage of astrong shock across the measurement volume as thepressure is increased. The maximum velocity, which isseen at a pressure of approximately 4.0 kPa for the long
nozzle, is approximately 7 km s . In this figure, gasy1
flow rates of 3.7 sl min of argon, 3.0 sl min ofy1 y1
hydrogen, a current of 30 A, and a voltage of 75 V.Fig. 14 shows the effect of carrier gas flow rate on
the atomic hydrogen temperature distribution, measuredby the inverted laser absorption method. The radialtemperature gradient was estimated to be 200–2000 Kmm and the gradient near center of the plasma,r-1y1
mm, was 1y10 to 1y3 lower than that at far from thecenter, r)1 mm. It was also found that temperatureincreased with carrier gas flow rate in this study range.As mentioned above, argon atoms may increase the rateof hydrogen recombination reaction that releases heat inthe form of thermal energy.
5. Summary and conclusions
The temperature measurements were carried out usinglaser absorption and LIF techniques based on a Voigt

91H. Hamatani et al. / Surface and Coatings Technology 162 (2002) 79–92
Fig. 14. Effect of carrier gas flow rate on temperature at axial position5 mm. Type A nozzle of diameter 1.1 mm, chamber pressure 5.2 kPa,arc power 1.95 kW(30 A=65 V), argon flow rate 3.7 sl min ,y1
hydrogen flow rate 3.0 sl min .y1
fit of the lineshapes of the Balmer-a transition. Eventhough the accuracy was lower than the other methods,because it was easier to implement and signals wereless noisy, laser absorption without inversion was mainlyused to evaluate the effect of the plasma gun shape andplasma conditions on the temperature distribution. Also,laser absorption with inversion and LIF were performedto obtain more accurate temperature measurements incases where it was possible to obtain good signals.In light of the advantages of LIF temperature meas-
urements for spatial resolution and hence for overallaccuracy in an asymmetric temperature field such asthis one, it should be noted that the LIF system couldbe improved to extend its usability to higher pressures.The signal-to-noise ratio for LIF at higher pressureswould be improved by simply replacing the excitationlaser with one of greater instantaneous power. A pulsedlaser, with gated data acquisition, is often used forachieving high instantaneous power. The benefit ofincreased laser power is limited by the saturation inten-sity of the LIF transition for the plasma conditions ofinterest. A calculation of saturation intensityw16x musttherefore be made before specifying the laser for an LIFsystem.The measured temperature and velocity were strongly
dependent on the plasma nozzle shape. It was foundthat a relatively long throat and 108 divergent nozzleresulted in a higher maximum velocity and a lowervelocity gradient in the axial( jet) direction. The maxi-mum velocity and the velocity gradient in the axialdirection were measured to be more than 7 km s andy1
1 km s mm , respectively. For thermal sprayingy1 y1
purposes, ease of particle entrainment and uniformity of
particle transport and heating are enhanced by broaden-ing the jet’s momentum core and reducing the radialand axial gradients in velocity. These considerations areespecially critical in this small-scale spray system. Sim-ilarly critical is the breadth of the jet’s thermal core,and the minimization of radial and axial temperaturegradients. From the standpoints of momentum and heattransfer to particles, it was determined that a nozzlewith a relatively long diverging section(type C) wasthe best geometry for low-power LPPS.It was also found that the input power, chamber
pressure, hydrogen flow rate, and carrier gas flow rateaffected the plasma temperature and velocity. As expect-ed, the measured temperature increased with increasingarc power(ranging between 1 and 3 kW). Several othereffects were observed that were less predictable. Theplasma temperature was maximized, in the range 4.0–9.3 kPa, approximately 5.3 kPa. The plasma temperaturewas also maximized at hydrogen flow rates approxi-mately 2 sl min , due possibly to a balance betweeny1
temperature rise and dissociation fraction. Finally, theintroduction of up to 1 sl min carrier gas flow wasy1
observed surprisingly to cause an increase in measuredtemperatures, possibly by promoting the recombinationof hydrogen ions with electrons. These surprising resultswarrant further study if they are deemed to impactsubstantially the conditions for plasma spraying.
References
w1x L. Pawlowski, The Science and Engineering of Thermal SprayCoatings, John Wiley & Sons, Chichester, UK, 1995.
w2x C. Moreau, L. Leblanc, Key Eng. Mater. 197(2001) 22.w3x H. Hamatani, N. Shimoda, Y. Ichiyama, S. Kitaguchi, T. Saito,
Funct. Gradient Mater. 34(1992) 385.w4x H.D. Steffens, Proceeding of the 7 International Conferenceth
on Vacuum Metallurgy, Tokyo, 1982, p. 295.w5x P. Chraska, J. Dubsky, K. Neufuss, J. Pisacka, JTST 6(3)
(1997) 325.w6x M. Vardelle, A. Vardelle, A.C. Leger, P. Fauchais, D. Gobin,
JTST 4(1) (1995) 50.w7x T. Zhang, D.T. Gawne, B. Liu, Surf. Coat. Technol. 132(2000)
233.w8x R. Merz, F. Prinz, K. Ramaswami, K. Terk, L. Weiss, Shape
deposition manufacturing, Proceedings of the Solid FreeformFabrication Symposium, University of Texas at Austin, Austin,Texas, 1994, p. 1.
w9x A.G. Cooper, S. Kang, J. Stampfl, F.B. Prinz, Fabrication ofceramic parts for a miniature jet engine application using MoldSDM, in: J.P. Singh, N.P. Bansal, K. Nihara(Eds.), InnovativeProcessing and Synthesis of Ceramics, Glasses and CompositesIII. Ceram. Trans. 108(2000) 389.
w10x W.S. Crawford, H. Hamatani, M.A. Cappelli, F.B. Prinz, Inter-national Conference on Plasma Science, 1999, p. 194.
w11x J.G. Liebeskind, Ph.D. Thesis, Stanford University, Stanford,California, 1994.
w12x H.R. Griem, Contrib. Plasma Phys. 40(1–2) (2000) 46.w13x H.R. Griem, Plasma Spectroscopy, McGraw-Hill, New York,
1964.w14x D.E. Kelleher, W.L. Wiese, V. Helbig, R.L. Greene, D.H. Oza,
Phys. Scr. T47(1993) 75.

92 H. Hamatani et al. / Surface and Coatings Technology 162 (2002) 79–92
w15x P.V. Storm, M.A. Cappelli, Appl. Opt. 35(1996) 4913.w16x P.V. Storm, Ph.D. Thesis, Stanford University, Stanford, Cali-
fornia, 1997.w17x C. Stehle, N. Feautier, J. Phys. B: At. Mol. Phys. 17(1984)
1477.w18x B. Glocker, M. Auweter-Kurtz, AIAA Paper 92-3835, July
1992.w19x W. Juchmann, J. Luque, J.B. Jeffries, Appl. Opt. 39(21)
(2000) 3704.
w20x P. Fauchais, A. Vardelle, A. Denoirjean, Surf. Coat. Technol.97 (1997) 66–78.
w21x J.A. Pobst, R.A. Spores, J.H. Schilling, D.A. Erwin, J. Propul.Power 12(6) (1996) 1107.
w22x A.H. Shapiro, The Dynamics and Thermodynamics of Com-pressible Fluid Flow, vol. I, The Ronald Press Company, 1953.
w23x M. Mitcher, C.H. Kruger, Partially Ionized Gases, John Wiley& Sons, New York, 1992.
w24x W.C. Kreye, J.W. Hemsky, M.J. Andrews, J. Phys. D: Appl.Phys. 26(1993) 1836.