optical properties of polymer blends composed of …...optical properties of polymer blends composed...
TRANSCRIPT
Japan Advanced Institute of Science and Technology
JAIST Repositoryhttps://dspace.jaist.ac.jp/
Title
Optical properties of polymer blends composed of
Poly(methyl methacrylate) and Ethylene-vinyl
acetate copolymer
Author(s)Takahashi, Shuji; Okada, Hiroaki; Nobukawa,
Shogo; Yamaguchi, Masayuki
Citation European Polymer Journal, 48(5): 974-980
Issue Date 2012-03-03
Type Journal Article
Text version author
URL http://hdl.handle.net/10119/10725
Rights
NOTICE: This is the author's version of a work
accepted for publication by Elsevier. Shuji
Takahashi, Hiroaki Okada, Shogo Nobukawa,
Masayuki Yamaguchi, European Polymer Journal,
48(5), 2012, 974-980,
http://dx.doi.org/10.1016/j.eurpolymj.2012.02.009
Description
Optical properties of polymer blends
composed of Poly(methyl methacrylate)
and Ethylene-vinyl acetate copolymer
Shuji Takahashi,1,2) Hiroaki Okada,1) Shogo Nobukawa,1) and
Masayuki Yamaguchi1)
1) School of Materials Science, Japan Advanced Institute of Science and Technology
1-1 Asahidai, Nomi, Ishikawa 923-1292 JAPAN
2) Development Department, Suzuki Motor Corporation
300 Takatsuka-cho, Minami-ku, Hamamatsu, Shizuoka 432-8611 JAPAN
*Corresponding to
Masayuki Yamaguchi
School of Materials Science, Japan Advanced Institute of Science and Technology
1-1 Asahidai, Nomi, Ishikawa 923-1292 Japan
Phone +81-761-51-1621, Fax +81-761-51-1625
E-mail [email protected]
Takahashi et al., 2
Abstract
Optical properties for immiscible polymer blends composed of poly(methyl
methacrylate), PMMA, and ethylene-vinyl acetate copolymer, EVA, are studied
employing various EVA samples with different vinyl acetate contents. PMMA/EVA
shows transparency at room temperature when the difference in refractive index
between both phases is small. The light transmittance, however, decreases with
increasing the ambient temperature. This phenomenon is attributed to the difference in
the volume expansion ratio, leading to the difference in refractive index, between
PMMA and EVA. It is found that addition of tricresyl phosphate, TCP, improves the
transparency and its temperature dependence. As a result, a ternary PMMA/EVA/TCP
blend shows high level of transparency in the wide temperature range, although it has
apparent phase separated morphology.
Key words: polymer blends; transparency; refractive index
Takahashi et al., 3
Introduction
Transparent polymers have been widely used in various fields such as industrial,
medical, and household applications. In particular, poly(methyl methacrylate) (PMMA)
is one of the most available polymers, because it has remarkable light transmittance,
good weatherability, low refractive index and small birefringence compared to other
transparent polymers. However, the applications required for high impact strength have
been limited because of its inherent brittleness. In the 1970’s, rubber toughening
technology was proposed to improve the disadvantage.1-4
In case of rubber-toughened plastics using a transparent polymer, however, it is
significantly difficult to keep the transparency because of the light scattering at the
interface between two materials due to the difference in the refractive index.5,6
Furthermore, it has been known that the light scattering can be reduced by adjusting the
refractive indices of both phases.7-9 Ethylene-vinyl acetate copolymer (EVA), known as
a rubbery material because of the low degree of crystallization, is a good candidate for
the modifier of PMMA, because the refractive index of EVA is very close to that of
PMMA. Furthermore, the refractive index of EVA can be controlled by the vinyl acetate
content.10,11
Up to now, several studies have been carried out on PMMA/EVA blends such as
in-situ polymerization12-14 and melt-mixing15,16 in order to improve the impact property
without losing transparency. Cheng et al. found that EVA-g-PMMA prepared by in-situ
polymerization results in the fine dispersed EVA particles in the PMMA matrix.13
Poomalai et al. reported that binary blends of PMMA/EVA in different proportions
prepared by a melt-mixing method show a substantial increase in its impact strength
from 19 to 32 J/m.16 Bernini et al. evaluated the transparency as a function of
Takahashi et al., 4
temperature using PMMA/EVA blends and found that PMMA/EVA shows a
transparent-to-opaque transition at about 50 oC.17,18 Moreover, Errico et al. revealed that
the blend composed of EVA-g-PMMA and PMMA shows transparency at room
temperature, while it becomes opaque at high temperature. They concluded that this
phenomenon is attributed to the difference in the temperature dependence of refractive
index between the graft copolymer and PMMA.19 In general, the temperature coefficient
of the refractive index (dn/dT) of a rubber is larger than that of a glassy polymer,
because of a large value of the thermal expansion coefficient.20 Therefore, the difference
in the refractive index is dependent on the temperature. Furthermore, the crystallinity of
EVA also plays an important role in the transparency because it affects the refractive
index. It has been already clarified that the degree of crystallinity of EVA decreases
with increasing the vinyl acetate content and becomes zero at approximately 25 wt%.11
The temperature dependence of the refractive index is expressed by the Lorentz
and Lorenz equation.21
T
R
RTn
T
n ][
][
111
(1)
31
T
(2)
where n the refractive index, T the temperature, the density, [R] the molecular
refractive and the linear expansion coefficient. The equation shows that the
temperature coefficient of the refractive index depends on the molecular refractive
determined by the chemical structure and the molar volume.
Takahashi et al., 5
In this study, a modification method of transparency by adding a liquid
compound, tricresyl phosphate (TCP), to a binary blend composed of PMMA and EVA
is demonstrated. TCP is a low-molecular compound with high refractive index and
shows a plasticizing performance for PMMA and EVA. That is to say, to achieve high
level of transparency in the wide temperature range, TCP should be added to the binary
blend. Furthermore, the temperature dependence of transparency is investigated for the
binary blends to clarify the relation between transparency and the difference in the
refractive index.
Experimental
Materials
Polymers used in this study were commercially available poly(methyl
methacrylate) (PMMA) (Sumitomo Chemical, Sumipex LG-21) and four types of
ethylene-vinyl acetate copolymer (EVA) containing from 14 to 32 weight percent of
vinyl acetate (VAc). The number-average molecular weight and polydispersity of
PMMA are as follows; Mn = 4.4 x 10⁴ and Mw/Mn = 1.89. The characteristics of EVA
samples were summarized in Table 1. In this study, EVA14 represents EVA containing
14 wt% of vinyl acetate. Tricresyl phosphate (TCP, Daihachi Chemical Industry) was
also employed. The refractive index at room temperature is 1.557.
[Table 1]
Sample Preparation
Takahashi et al., 6
PMMA and EVA were mechanically blended with and without TCP in the
molten state with thermal stabilizers such as hindered phenol (Ciba, Irganox 1010) and
phosphate (Ciba, Irgafos 168). The blend ratio of the binary blends was PMMA/EVA =
80/20 in a weight fraction. In case of the ternary blends, the ratio was
PMMA/EVA/TCP = 72/18/10 in a weight fraction. The amount of each thermal
stabilizer used in the preparation was 0.5 %. Compounding was performed by an
internal batch mixer (Toyoseiki, Labo-plastmil) at 200 ºC for 10 min. The blade rotation
speed was 40 rpm. Prior to melt-mixing, the polymers were dried under vacuum at 60
ºC for 3 h. Furthermore, PMMA/TCP and EVA/TCP with various blend ratios were
prepared by the same method.
The obtained samples were compressed into flat sheets with 0.2 mm thickness by
a laboratory compression-molding machine at 200 ºC under 10 MPa for 10 min. Then
the sample was subsequently cooled at 20 ºC for 5 min.
Measurements
Thermal analysis of EVA was conducted by a differential scanning calorimeter
(DSC) (Mettler, DSC820) under a nitrogen atmosphere. The samples were heated from
-80 to 120 ºC at a heating rate of 10 ºC/min to detect the melting point. After holding at
120 ºC for 3 min, the samples were cooled down to -80 ºC at a cooling rate of 10 ºC/min
to detect the crystallization temperature. The amount of the sample in an aluminum pan
was approximately 10 mg.
Refractive index was measured at 20 ºC and 70 ºC by an Abbe refract meter
(ATAGO, NAR-1T) with methylene iodide as a contact liquid. Besides the EVA
samples in Table 1, low-density polyethylene (LDPE) (Mitsui Chemical, 16P) and
Takahashi et al., 7
poly(vinyl acetate) (PVAc) (Aldrich) were employed as polymers with 0 and 100 wt%
of VAc content, respectively.
The temperature dependence of oscillatory tensile modulus in the solid state,
such as tensile storage modulus E and loss modulus E , was measured by a
dynamic mechanical analyzer (UBM, E4000) in the temperature range between -80 and
150 ºC. The heating rate was 2 ºC/min, and the applied frequency was 10 Hz. The
rectangular samples with the dimension of 4 x 25 x 0.2 mm were cut out from the
compressed flat sheets.
To evaluate the transparency and its temperature dependence of polymer blends,
light transmittance was measured at various temperatures using an optical microscope
(Leica microsystems, DMLP) equipped with a hot stage (Mettler, FP900) and a photo
multiplier as a light detector. The light transmittance T is determined by the following
relation:
100/(%) 0 IIT (3)
where I0 and I are the intensities of transmittance light and incident light, respectively.
The morphology of the blends was examined by a scanning electron microscope
(SEM) (Hitachi, S4100). Prior to the observation, the surface of cryogenically fractured
samples was coated by Pt-Pd.
The linear thermal expansion coefficient was measured by a thermo-mechanical
analyzer (TMA) (Brucker, TMA4000SA) in the temperature range between 20 and 80
ºC. The heating rate was 2 ºC/min. The rectangular samples with the dimension of 5 x 5
x 0.2 mm were cut out from the compressed flat sheets.
Takahashi et al., 8
Results and Discussion
Characteristics of pure polymers
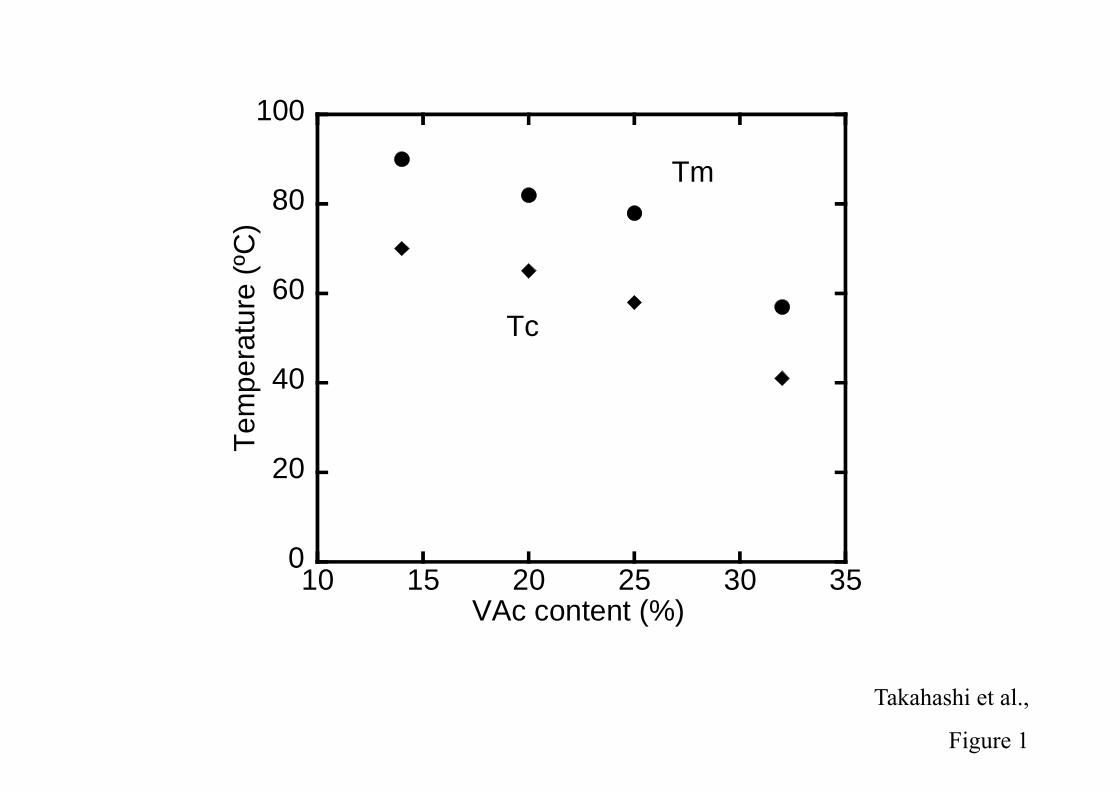
Table 2 shows the glass transition temperature (Tg), crystallization temperature
(Tc), and melting point (Tm) of the EVA samples, which are determined by the DSC
measurement. As seen in the table, all EVA samples show the same Tg, suggesting that
they have the alomost same VAc content in the amorphous region. Furthermore, it is
found from Figure 1 that Tc and Tm decrease with increasing the VAc content because
of the decrease in the ethylene sequence, as firstly reported by Slayer et al.10 On the
other hand, Tg of PMMA is 105 ºC.
[Table 2] & [Figure 1]
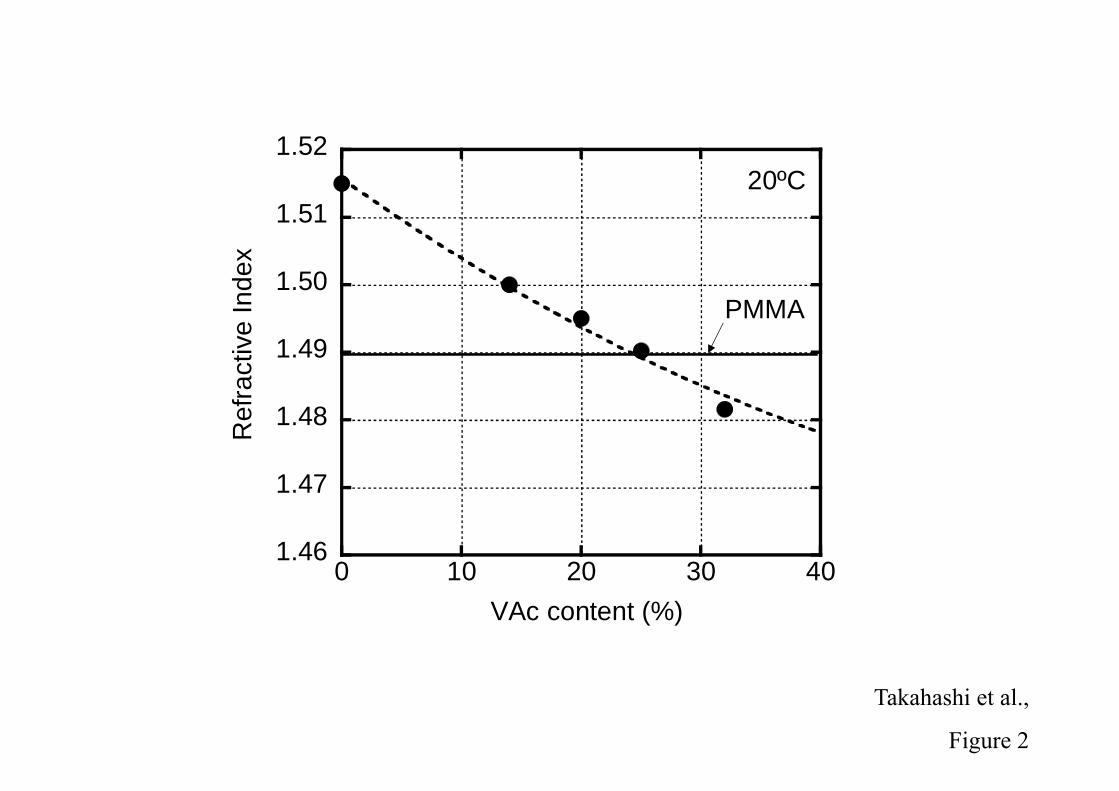
Figure 2 shows the refractive index of EVA as a function of VAc content at 20
ºC. In the figure, the refractive index of LDPE, 1.5150, is also shown as an EVA sample
containing 0 wt% of VAc. Moreover, the refractive index of PMMA, 1.4900, is shown
by a solid line.
[Figure 2]
As seen in Figure 2, the refractive index decreases with VAc content because of
low degree of crystallinity, and approaches to the value of PVAc, 1.4699. Furthermore,
the refractive index of EVA25 is almost the same as that of PMMA. Therefore, it can be
Takahashi et al., 9
deduced that the binary blend composed of PMMA and EVA25 is fairly transparent
irrespective of the morphology.
Morphology and dynamic mechanical properties of binary blends
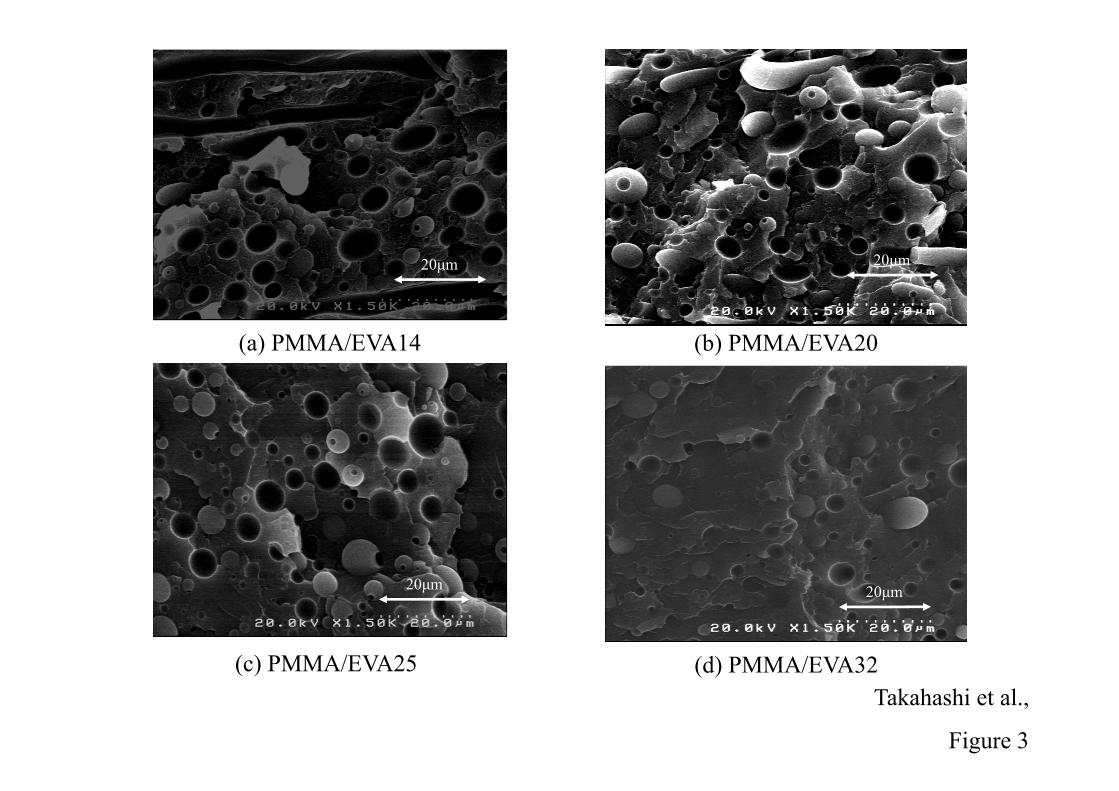
Figure 3 shows the SEM pictures of the cryogenically fractured surface of
PMMA/EVA binary blends.
[Figure 3]
As seen in the figure, phase separated morphology is detected in all blends, in
which spherical droplets of EVA are dispersed in a continuous phase of PMMA. The
diameter of dispersed particles is in the range of 1-10 μm and almost the same
irrespective of the VAc content.
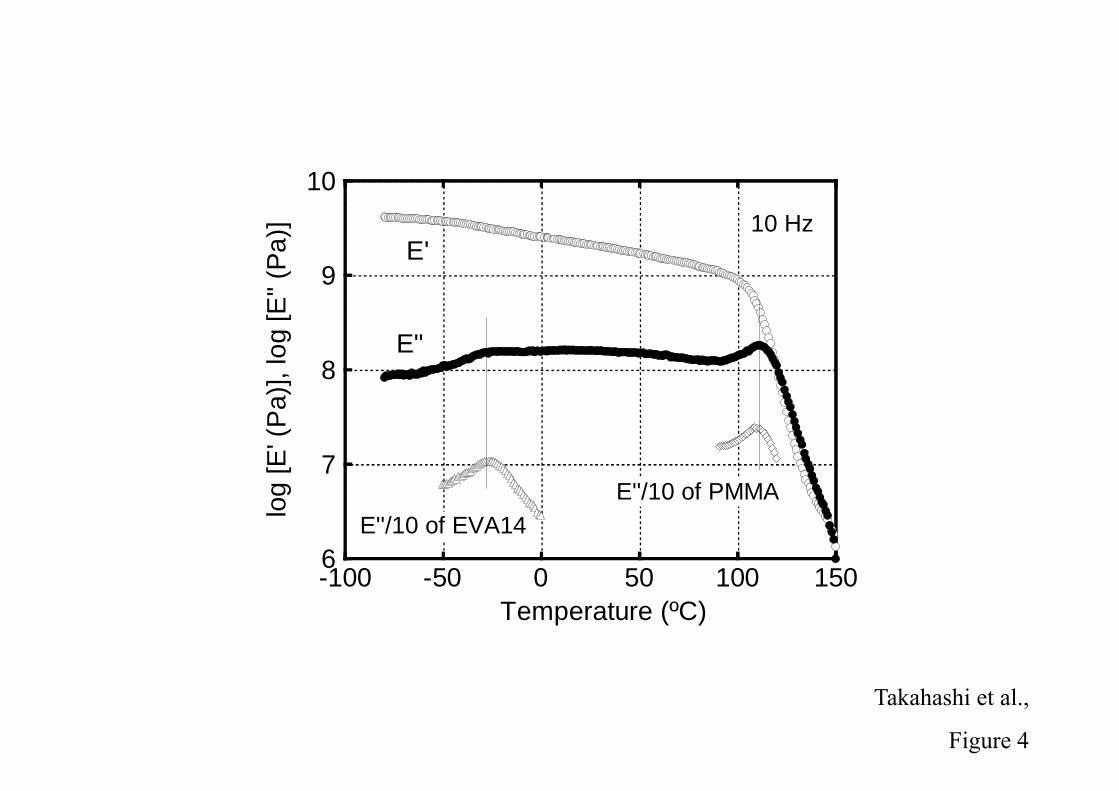
Figure 4 exemplifies the temperature dependence of oscillatory tensile moduli
such as storage modulus E and loss moduli E in the solid state at 10 Hz for
PMMA/EVA14.
[Figure 4]
The storage modulus E decreases slightly around -40 ºC because of the
glass-to-rubber transition of EVA phase. Then, E’ drops off sharply around at 100 ºC
due to Tg of PMMA phase. Correspondingly, there are two peaks in the loss modulus
E curve, demonstrating that the blend shows phase separation. Furthermore, the
locations of the peak temperature of E for the blend are the same as those for the
individual pure components, which is confirmed also for the other binary blends. These
Takahashi et al., 10
results demonstrate that molecules of EVA employed in this study are not dissolved into
PMMA, even though PVAc is miscible with PMMA.22
Optical properties of binary blends
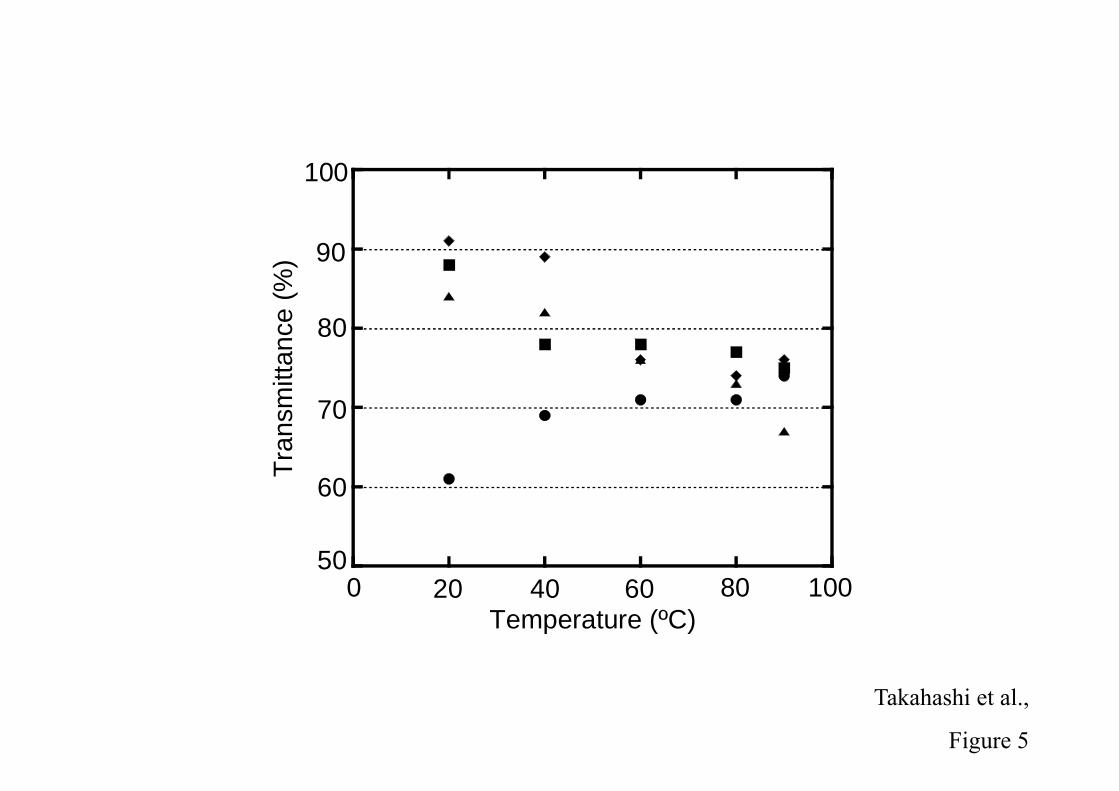
Figure 5 shows the light transmittance for the binary blends of PMMA and EVA
at various temperatures. The content of EVA is 20 wt%.
[Figure 5]
The blend with EVA25 is the most transparent at 20 ºC. This is reasonable
because EVA25 (n = 1.4902) shows the closest refractive index with PMMA (n =
1.4900). Nevertheless, it is demonstrated that the transmittance decreases with the
ambient temperature. On the contrary, the transparency is improved at high temperature
for PMMA/EVA14, although the blend is opaque at 20 ºC. This phenomenon is
attributed to the difference in the thermal expansion coefficient and thus the temperature
dependence of refractive index between PMMA and EVA, which is provided by the
Lorentz and Lorenz equation. As shown in eq. (1), Tn / is determined by two terms,
i.e., thermal expansion and molecular refractive, although the molecular refractive is
hardly affected by temperature.23 The thermal expansion of a rubbery material is
generally larger than that of a glassy polymer. In fact, the temperature coefficients of the
refractive index at λ = 514 nm and T = 20 ºC are -1.2 x 10⁻⁴ ºC -1 for PMMA and -5.0 x
10-4 ºC -1 for EVA.24 Consequently, the refractive index of EVA decreases rapidly with
increasing temperature as compared to that of PMMA.
Takahashi et al., 11
The refractive index is also measured at 70 ºC. It is found that the value of
EVA14 (n = 1.4857) is almost identical to that of PMMA (n = 1.4853), even though
EVA14 (n = 1.5001) shows a much higher value than PMMA (n = 1.4900) at 20 ºC. As
a result, the light transmittance increases with temperature for PMMA/EVA14.
Optical properties of ternary blend
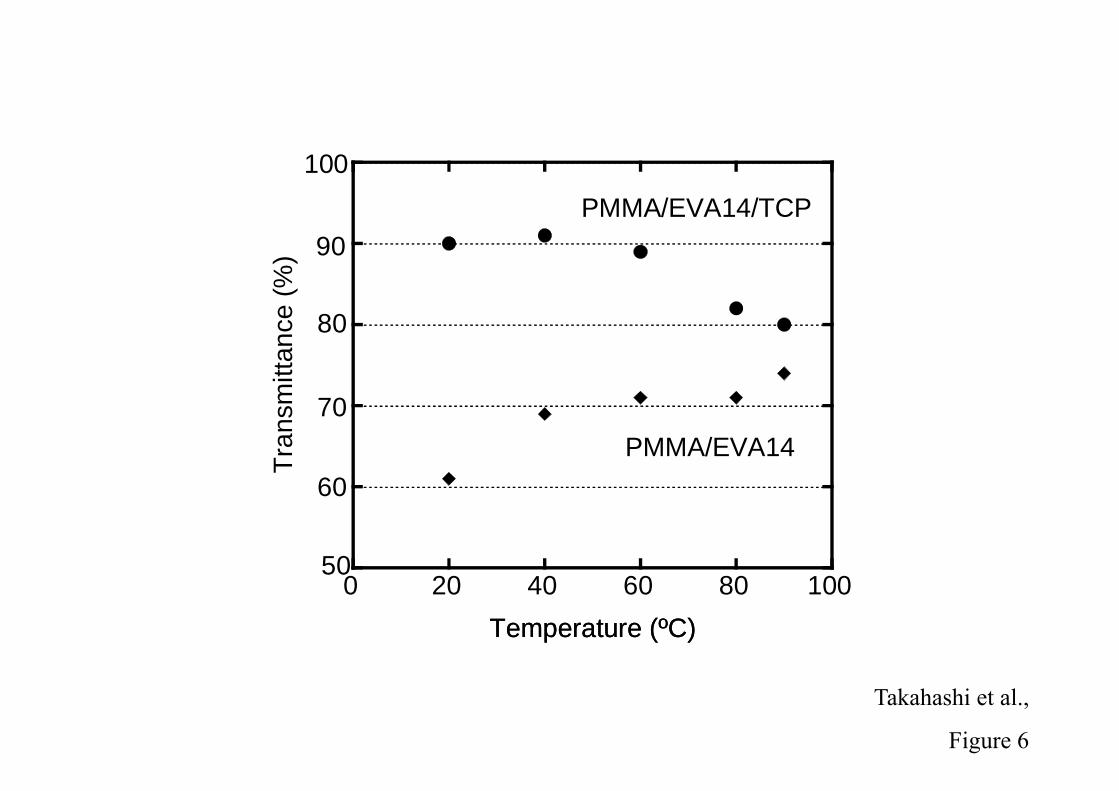
Although the light transmittance of PMMA/EVA14 is the lowest among the
binary blends at 20 ºC, it is significantly improved by the addition of TCP, as
demonstrated in Figure 6. Considering that the refractive index of TCP is 1.5570, which
is higher than those of PMMA and EVA14, this can be explained by the change in the
difference in the refractive index of both phases.
[Figure 6]
It should be noted in Figure 6 that the ternary blend with TCP shows high level
of light transmittance in the broad range of temperature, even though the difference in
the refractive index shows the largest among the binary blends at 20 ºC as shown in
Figure 2. Upon the addition of TCP, the ternary blend shows approximately 90 % of the
light transmittance at 20 ºC, which is almost the same value as PMMA/EVA25.
Furthermore, it shows over 80 % even at 90 ºC. Consequently, the light transmittance of
PMMA/EVA14/TCP exceeds 80 % in a wide temperature range from 20 ºC to 90 ºC.
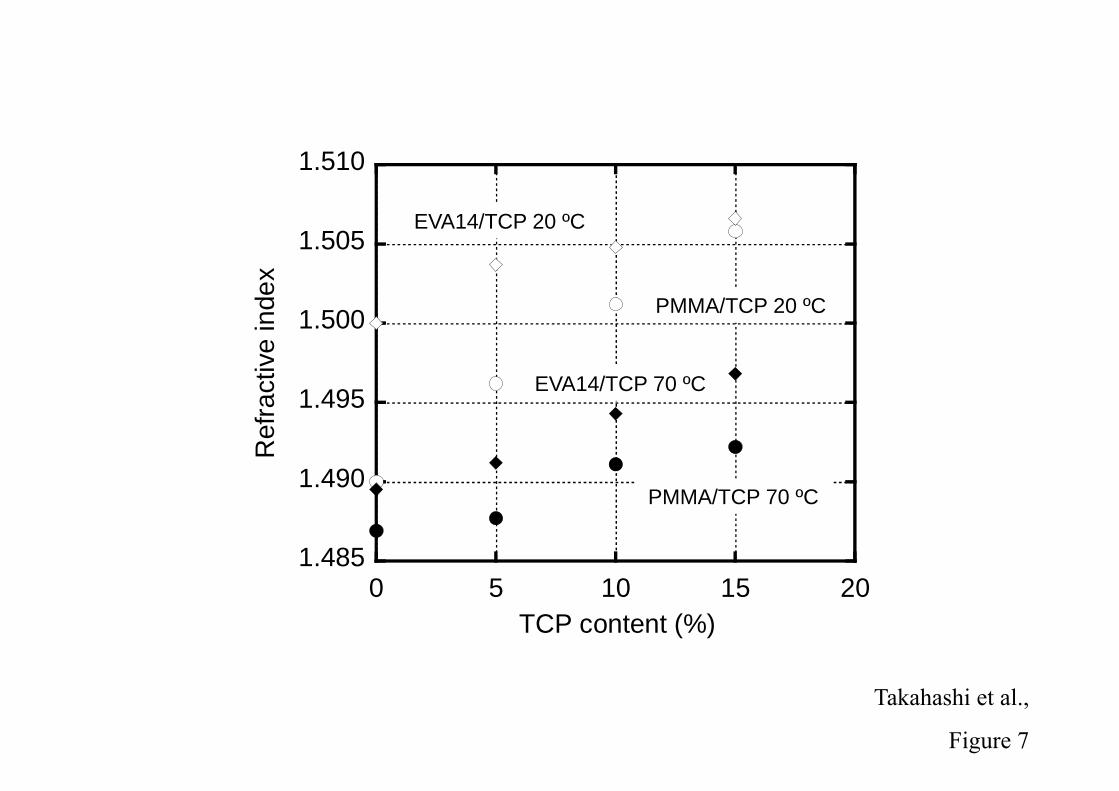
In order to clarify the effect of TCP, refractive index of PMMA/TCP and
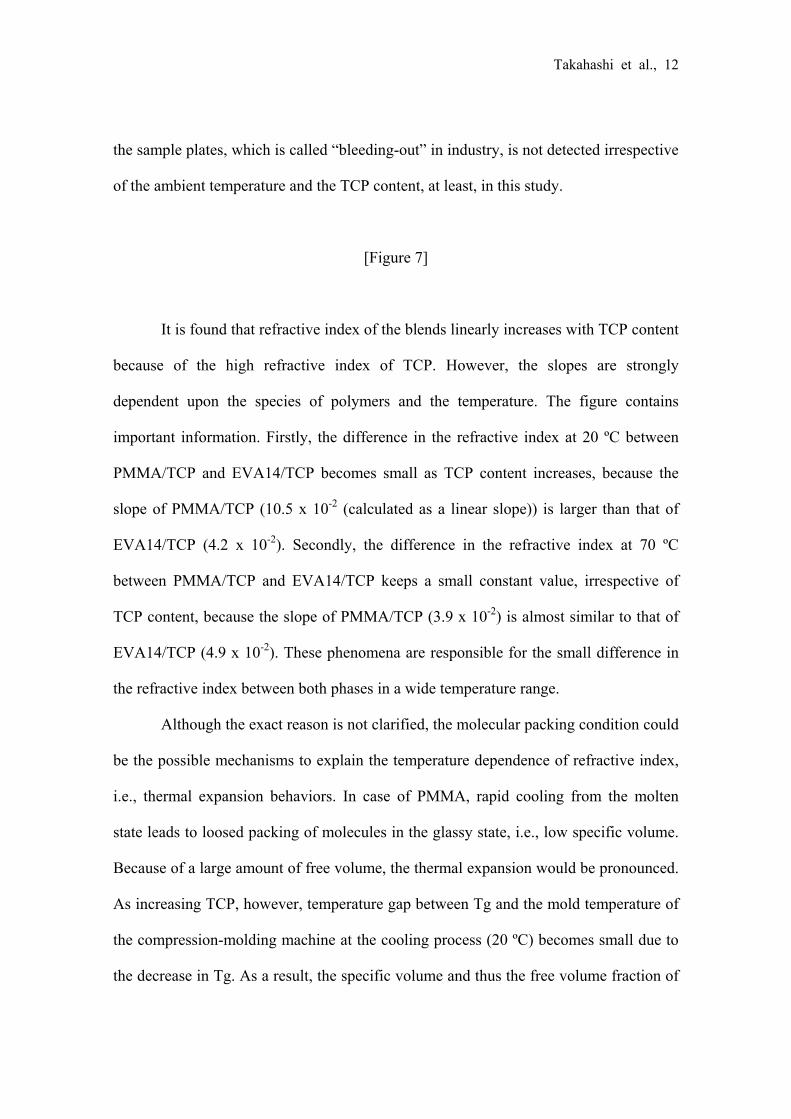
EVA14/TCP at 20 ºC and 70 ºC are evaluated as shown in Figure 7. During the
measurements, as similar to the ternary blends, the segregation of TCP on the surface of
Takahashi et al., 12
the sample plates, which is called “bleeding-out” in industry, is not detected irrespective
of the ambient temperature and the TCP content, at least, in this study.
[Figure 7]
It is found that refractive index of the blends linearly increases with TCP content
because of the high refractive index of TCP. However, the slopes are strongly
dependent upon the species of polymers and the temperature. The figure contains
important information. Firstly, the difference in the refractive index at 20 ºC between
PMMA/TCP and EVA14/TCP becomes small as TCP content increases, because the
slope of PMMA/TCP (10.5 x 10⁻² (calculated as a linear slope)) is larger than that of
EVA14/TCP (4.2 x 10⁻²). Secondly, the difference in the refractive index at 70 ºC
between PMMA/TCP and EVA14/TCP keeps a small constant value, irrespective of
TCP content, because the slope of PMMA/TCP (3.9 x 10⁻²) is almost similar to that of
EVA14/TCP (4.9 x 10⁻²). These phenomena are responsible for the small difference in
the refractive index between both phases in a wide temperature range.
Although the exact reason is not clarified, the molecular packing condition could
be the possible mechanisms to explain the temperature dependence of refractive index,
i.e., thermal expansion behaviors. In case of PMMA, rapid cooling from the molten
state leads to loosed packing of molecules in the glassy state, i.e., low specific volume.
Because of a large amount of free volume, the thermal expansion would be pronounced.
As increasing TCP, however, temperature gap between Tg and the mold temperature of
the compression-molding machine at the cooling process (20 ºC) becomes small due to
the decrease in Tg. As a result, the specific volume and thus the free volume fraction of
Takahashi et al., 13
PMMA tend to increase with increasing TCP content. Even if the temperature gap is not
so important, the addition of a plasticizer tends to loosen the molecular packing. Up to
now, the effect of the addition of a plasticizer on the thermal expansion has been
reported by two research gropus to the best of our knowledge. Mohanty et al. found that
the plasticized cellulose acetate shows enhanced thermal expansion.25 Furthermore,
Borek et al. revealed that free volume fraction of poly(vinyl chloride) (PVC) in the
glassy state increases with a plasticizer.26
On the contrary, addition of TCP has no/little effect on the specific volume of
EVA, because Tg of the amorphous region, in which TCP molecules must exist,27 is
significantly lower than 20 ºC even without TCP.
In general, anharmonicity of potential-energy function, which can be detected by
vibrational frequency shift in the infrared and Raman spectra by applied stress,28,29 is
responsible for the thermal expansion. The thermal expansion, i.e., separation between
the molecules with increasing temperature, occurs owing to the asymmetry of the
potential function. When a material has strong anharmonicity with low modulus, it
shows marked thermal expansion.28-32 Since the modulus becomes lower by the
additoon of TCP, pronounced thermal expansion is expected.
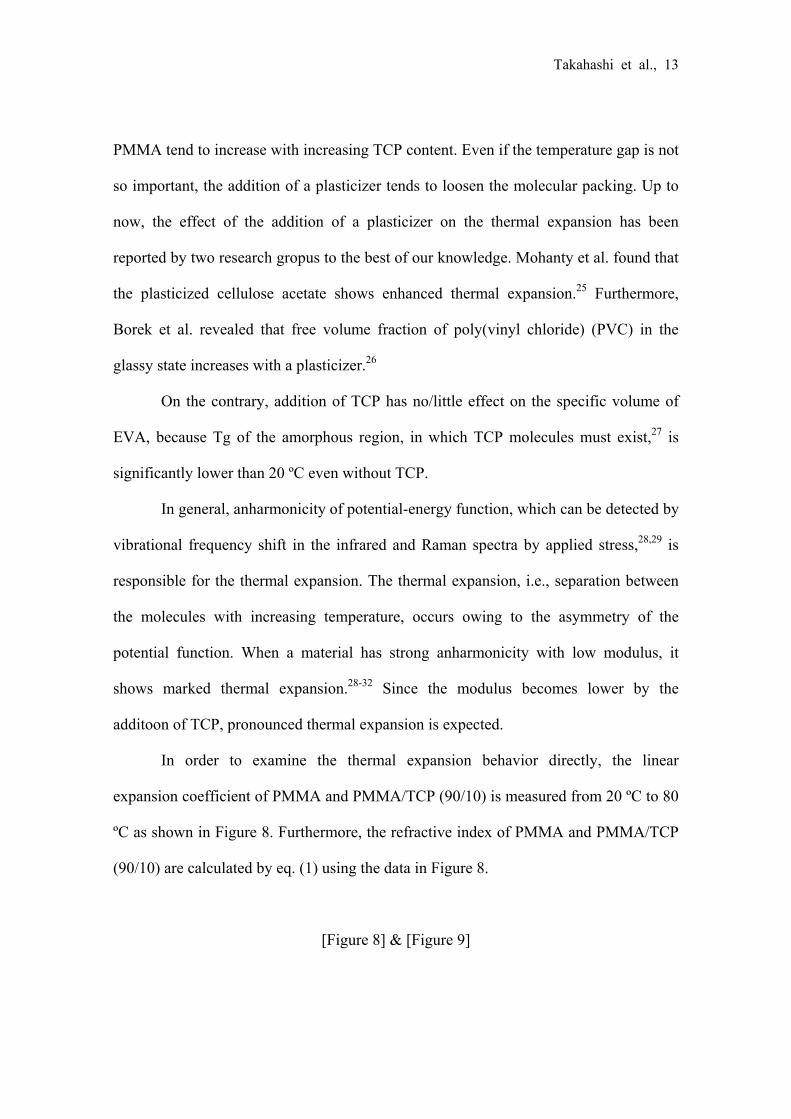
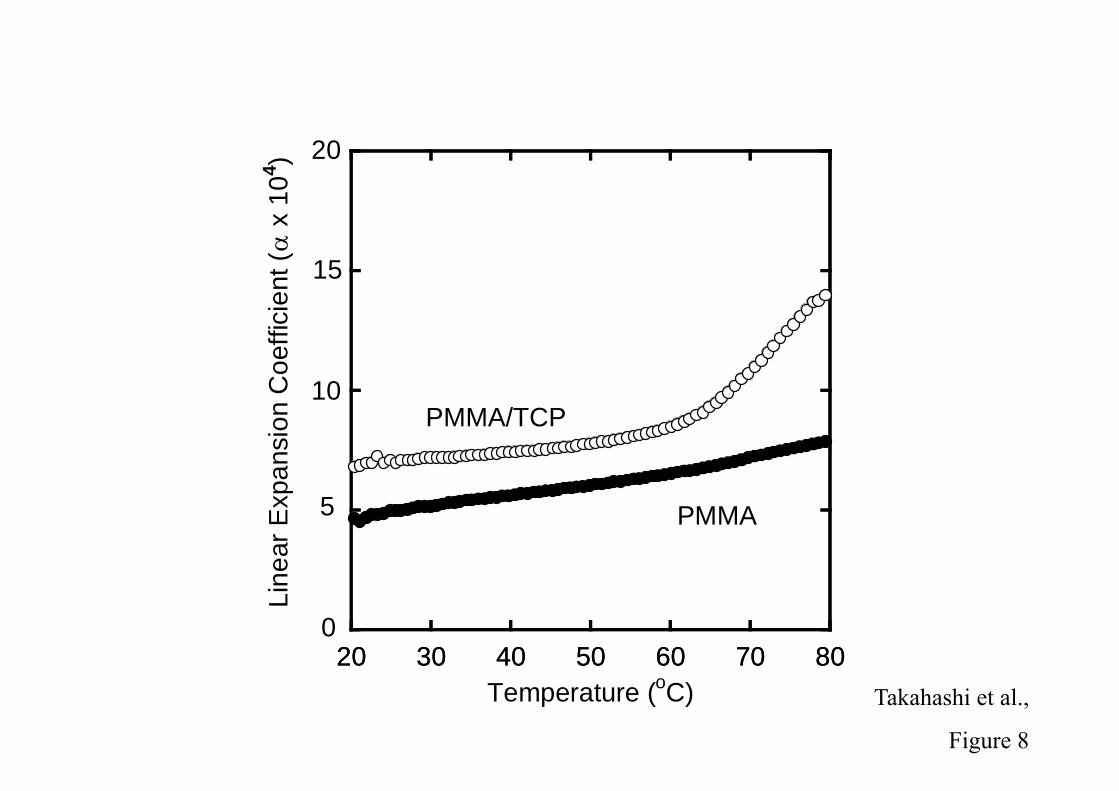
In order to examine the thermal expansion behavior directly, the linear
expansion coefficient of PMMA and PMMA/TCP (90/10) is measured from 20 ºC to 80
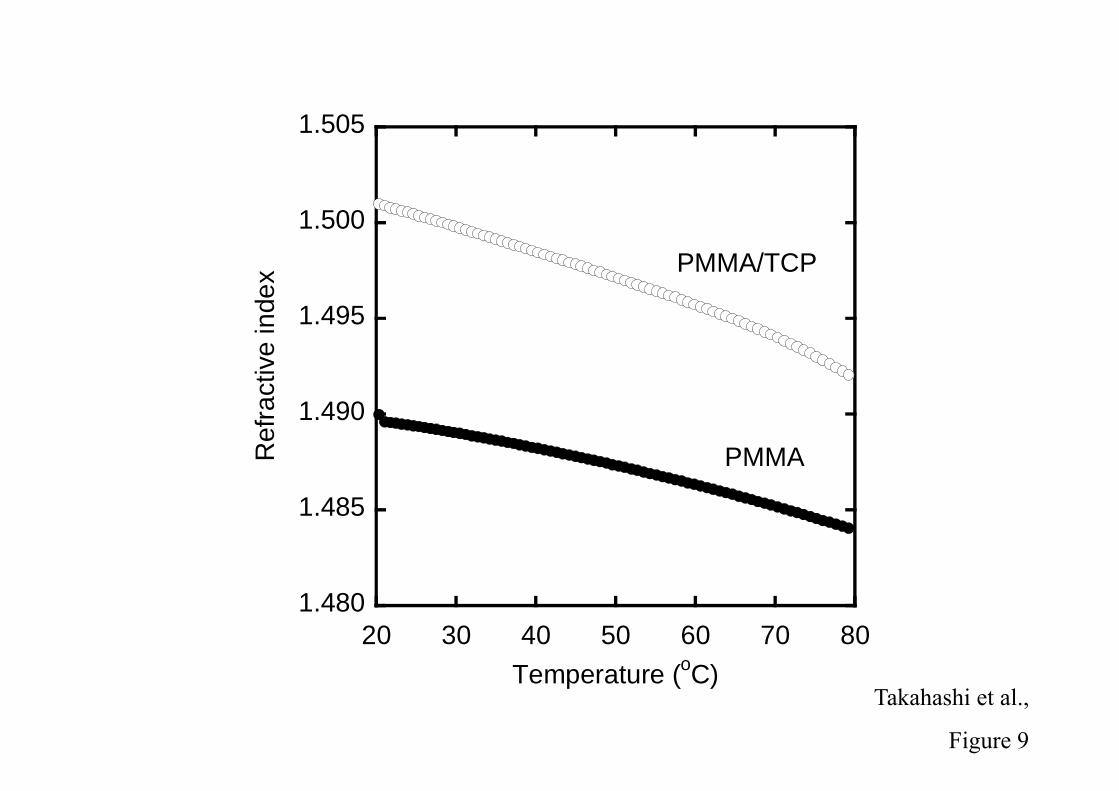
ºC as shown in Figure 8. Furthermore, the refractive index of PMMA and PMMA/TCP
(90/10) are calculated by eq. (1) using the data in Figure 8.
[Figure 8] & [Figure 9]
Takahashi et al., 14
It is obvious that the linear expansion coefficient increases by the addition of
TCP. Furthermore, the calculated value of the refractive index, as shown in Figure 9, at
70 ºC is 1.494, which approximately corresponds to the result (1.492) in Figure 7, the
experimental data obtained by an Abbe refract meter.
Morphology and dynamic mechanical properties of blends with TCP
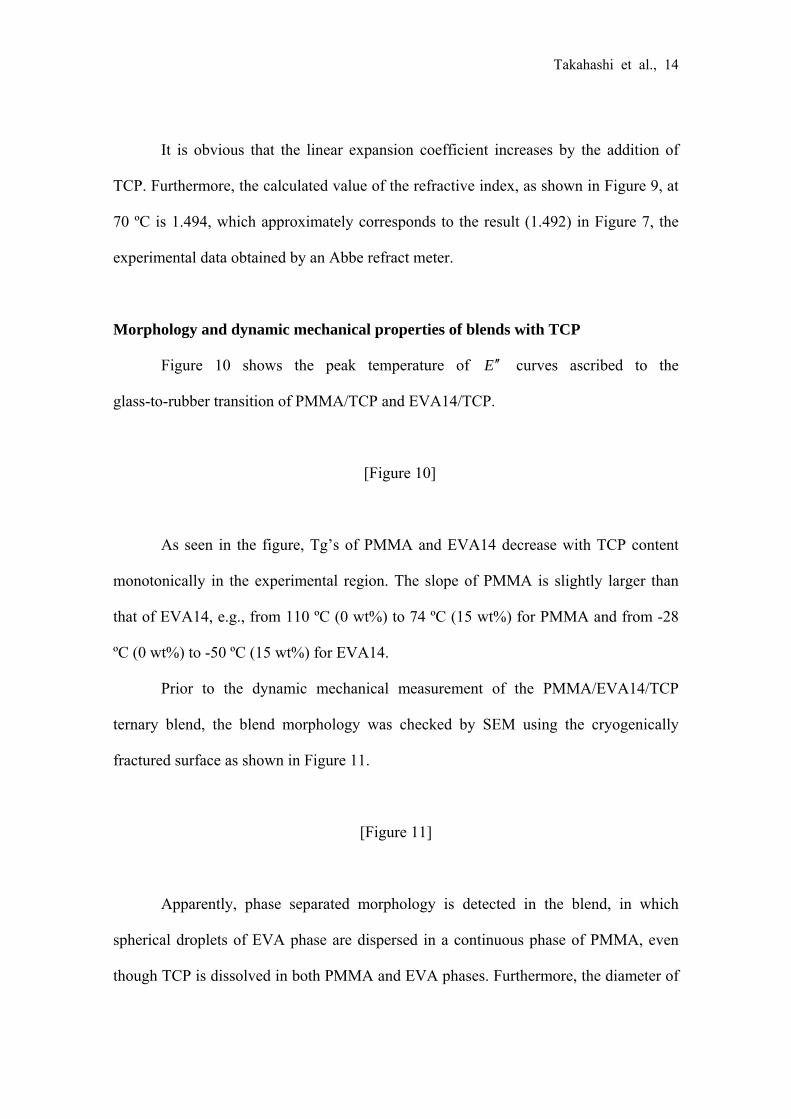
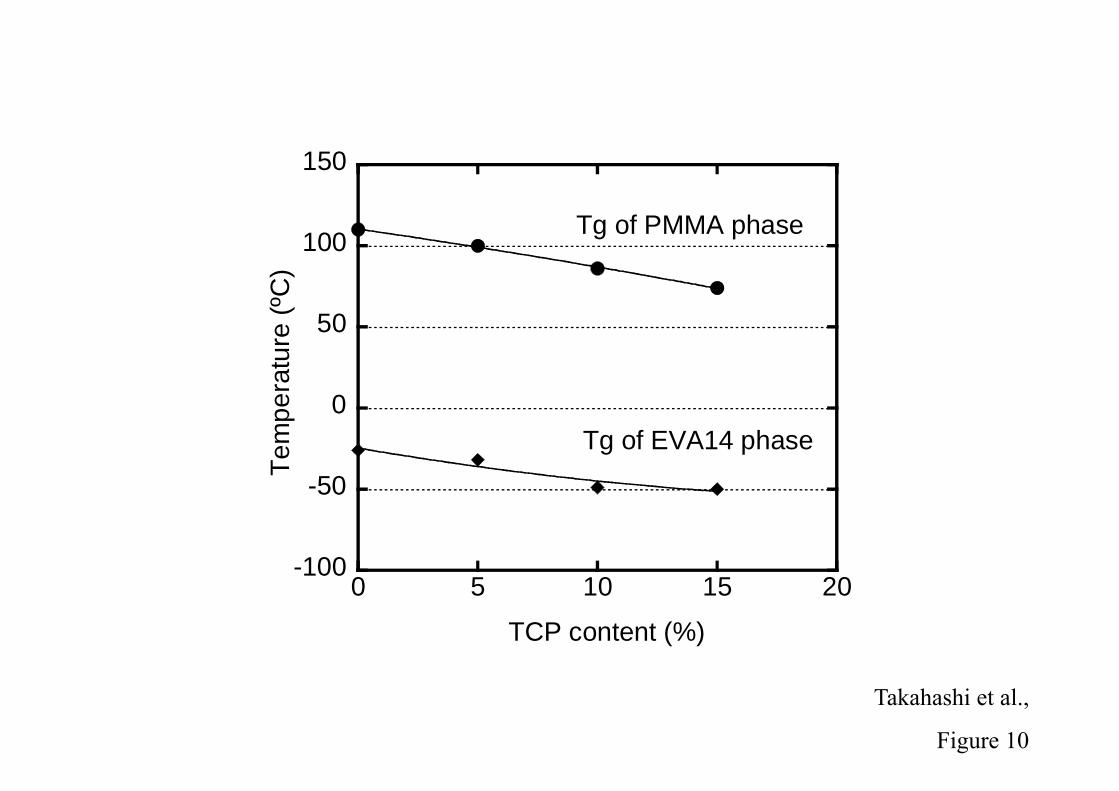
Figure 10 shows the peak temperature of E curves ascribed to the
glass-to-rubber transition of PMMA/TCP and EVA14/TCP.
[Figure 10]
As seen in the figure, Tg’s of PMMA and EVA14 decrease with TCP content
monotonically in the experimental region. The slope of PMMA is slightly larger than
that of EVA14, e.g., from 110 ºC (0 wt%) to 74 ºC (15 wt%) for PMMA and from -28
ºC (0 wt%) to -50 ºC (15 wt%) for EVA14.
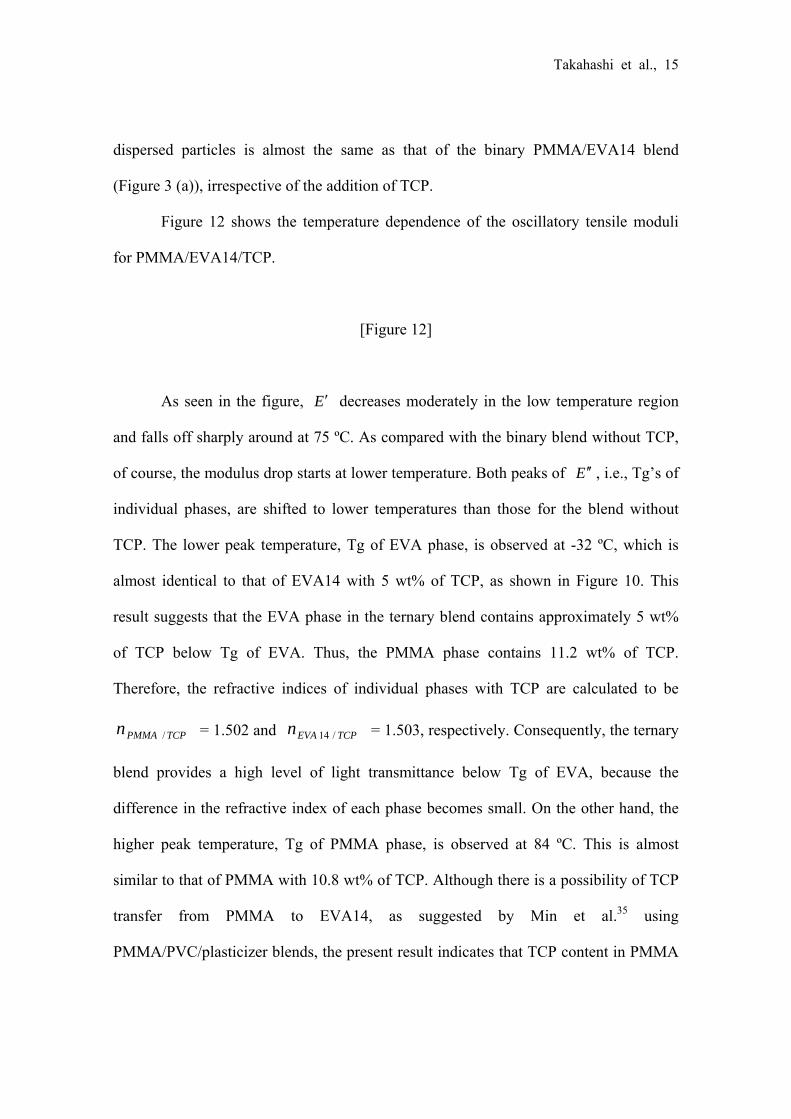
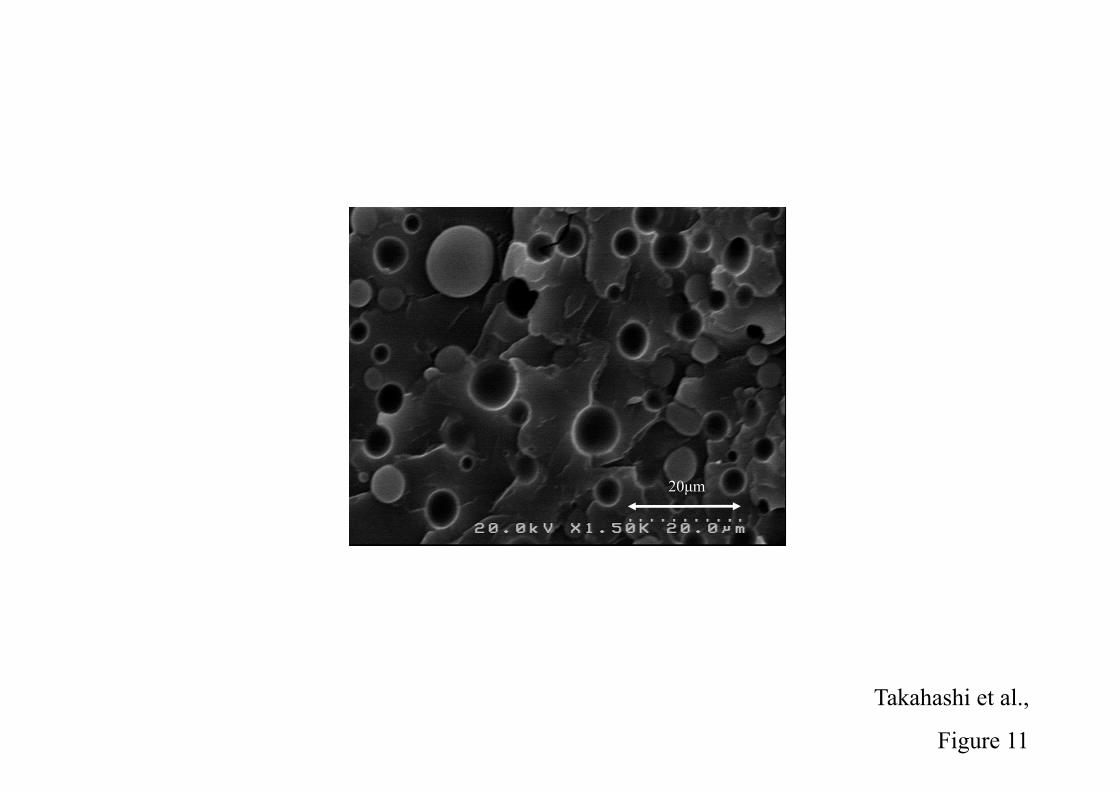
Prior to the dynamic mechanical measurement of the PMMA/EVA14/TCP
ternary blend, the blend morphology was checked by SEM using the cryogenically
fractured surface as shown in Figure 11.
[Figure 11]
Apparently, phase separated morphology is detected in the blend, in which
spherical droplets of EVA phase are dispersed in a continuous phase of PMMA, even
though TCP is dissolved in both PMMA and EVA phases. Furthermore, the diameter of
Takahashi et al., 15
dispersed particles is almost the same as that of the binary PMMA/EVA14 blend
(Figure 3 (a)), irrespective of the addition of TCP.
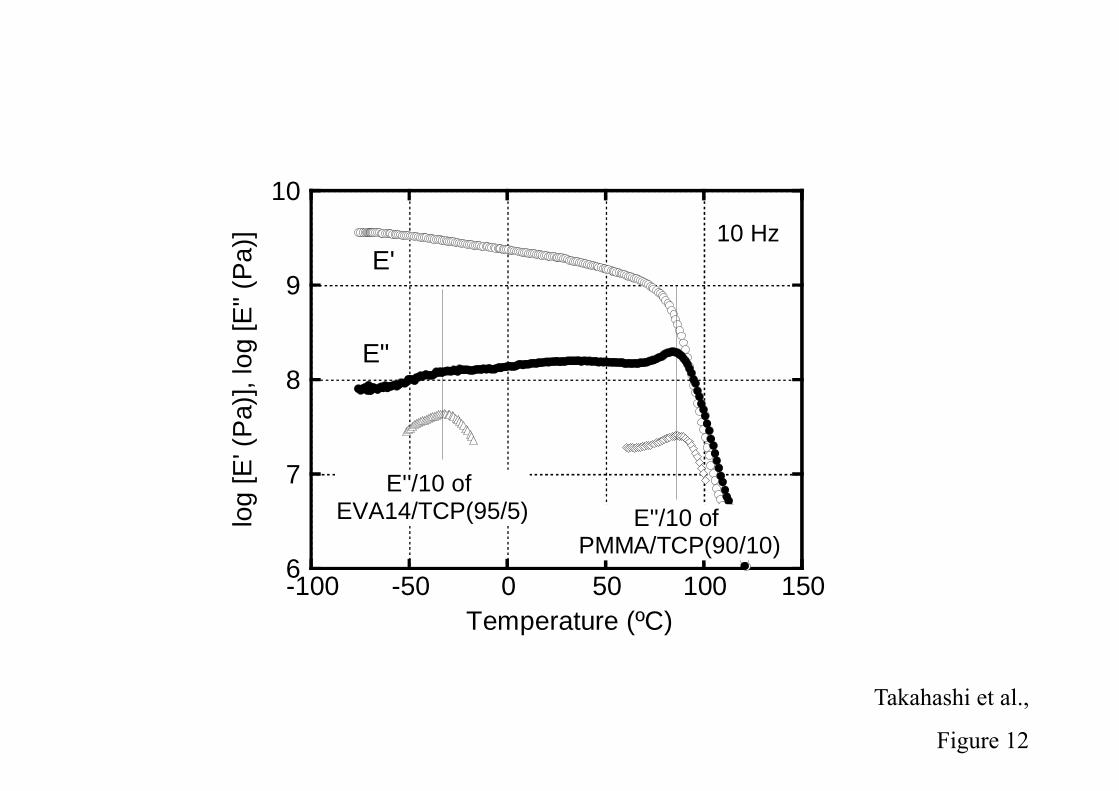
Figure 12 shows the temperature dependence of the oscillatory tensile moduli
for PMMA/EVA14/TCP.
[Figure 12]
As seen in the figure, E decreases moderately in the low temperature region
and falls off sharply around at 75 ºC. As compared with the binary blend without TCP,
of course, the modulus drop starts at lower temperature. Both peaks of E , i.e., Tg’s of
individual phases, are shifted to lower temperatures than those for the blend without
TCP. The lower peak temperature, Tg of EVA phase, is observed at -32 ºC, which is
almost identical to that of EVA14 with 5 wt% of TCP, as shown in Figure 10. This
result suggests that the EVA phase in the ternary blend contains approximately 5 wt%
of TCP below Tg of EVA. Thus, the PMMA phase contains 11.2 wt% of TCP.
Therefore, the refractive indices of individual phases with TCP are calculated to be
TCPPMMAn / = 1.502 and TCPEVAn /14 = 1.503, respectively. Consequently, the ternary
blend provides a high level of light transmittance below Tg of EVA, because the
difference in the refractive index of each phase becomes small. On the other hand, the
higher peak temperature, Tg of PMMA phase, is observed at 84 ºC. This is almost
similar to that of PMMA with 10.8 wt% of TCP. Although there is a possibility of TCP
transfer from PMMA to EVA14, as suggested by Min et al.35 using
PMMA/PVC/plasticizer blends, the present result indicates that TCP content in PMMA
Takahashi et al., 16
phase is not so changed. As a result, the difference in refractive index at 70 ºC is also
small (Figure 7), leading to good transparency.
Conclusions
The transparency and its temperature dependence for immiscible polymer blends
composed of PMMA and EVA are studied. It is found that the difference in refractive
index of each phase is the most important factor for transparency of the binary blends.
However, the transparency of the binary blend depends on the ambient temperature to a
great extent, because the temperature dependence of refractive index of EVA is more
pronounced than that of PMMA.
Addition of TCP into the PMMA/EVA blend improves the transparency and its
temperature dependence. This phenomenon can be explained by the following reasons;
(1) The difference in the refractive index between both phases is reduced because of the
high refractive index of TCP and (2) Addition of TCP increases the thermal expansion
coefficient of PMMA.
In this paper, a new material design of transparent rubber-toughened polymer
blends having phase separated morphology is demonstrated. However, the thermal and
mechanical properties such as heat deflection temperature, toughness, and yield stress
should be checked in detail prior to application, because the addition of plasticizers
always provides a negative influence on these properties. A new plasticizer having large
refractive index and appropriate solubility parameter should be preferred for industrial
application, because a small amount is enough to control the refractive index.
Takahashi et al., 17
References
(1) Ayre DS, Bucknall CB. Polymer 1998;39:4785-91.
(2) Gloaguen JM, Steer P, Gaillard P, Wrotecki C, Lefebvre JM. Polym Eng Sci
1993;33:748-53.
(3) Smith AP, Ade H, Balik CM, Koch CC, Smith SD, Spontak RG. Macromolecules
2000;33:2595-604.
(4) Poomalai P, Varghese TO, Siddramaiah J. J Appl Polym Sci 2008;109:3511-8.
(5) Huges LT, Britt GE. J Appl Polym Sci 1961;5:337-48.
(6) Roxton TR. J Appl Polym Sci 1963;7:1499-508.
(7) Song JY, Kim JW, Suh KD. J Appl Polym Sci 1999;71:1607-14.
(8) Park JY, Kim JY, Suh KD. J Appl Polym Sci 1998;69:2291-302.
(9) Feng J, Winnik MA, Shivers RR, Clubb B. Macromolecules 1995;28:7671-82.
(10) Salyer IO, Kenyon AS. J Polym Sci Part A 1971;9:3083-103.
(11) Arsac A, Carrot C, Guillet J. J Appl Polym Sci 1999;74:2625-30.
(12) Laurienzo P, Malinconico M, Matruscelli E, Ragosta G, Volpe MG. J Appl Polym
Sci 1992;44:1883-92.
(13) Cheng SK, Chen CY. J Appl Polym Sci 2003;90:1001-8.
(14) Cheng SK, Chen CY. Eur Polym J 2004;40:1239-48.
(15) Poomalai P, Ramaraj B, Siddramaiah. J Appl Polym Sci 2007;104:3145-50.
(16) Poomalai P, Ramaraj B, Siddramaiah. J Appl Polym Sci 2007;106:684-91.
(17) Bernini U, Carbonara G, Malinconico M, Mormile P, Russo P, Volpe MG. Appl Opt
1992;31:5794-98.
(18) Bernini U, Malinconico M, Matruscelli E, Mormile P, Novellino A, Russo P, Volpe
MG. J Mater Process Technol 1995;55:224-8.
Takahashi et al., 18
(19) Errico ME, Greco R, Laurienzo P, Malinconico M, Viscardo D. J Appl Polym Sci
2006;99:2926-35.
(20) Zoller P, Walsh DJ. Technomic Lancaster PA 1995;147:91.
(21) Choi JH, Eichele C, Lin YC, Shi FG, Carlson R, Sciamanna S. Scripta Materialia
2008;58:413-6.
(22) Song M, Long F. Eur Polym J 1991;27:983-6.
(23) Bernini U, Stefano LD, Feo M, Mormile P, Russo P. Appl Phys B 1996;63:155-9.
(24) Bernini U, Malinconico M, Matruscelli E, Mormile P, Russo P, Volpe MG. J Mater
Sci 1993;28:6399-402.
(25) Mohanty AK, Wibowo A, Misra M, Drzal LT. Polym Eng Sci 2003;43:1151-61.
(26) Borek J, Osoba W. J Polym Sci Polym Phys 1998;36:1839-45.
(27) Qian JW, An QF, Zhou GH. Eur Polym J 2003;39:375-9.
(28) Nitta K, Yamaguchi M. J Mater Sci 1998;33:1015-21.
(29) Yamaguchi M, Nitta K, Tanaka A, Kitamura M. J Polym Sci Polym Phys
1999;37:1513-21.
(30) Yamamoto O. Polym J 1971;2:501-17.
(31) Kijima T, Koga K, Imada K, Takayanagi M. Polym J 1975;7:14-20.
(32) Barron RM, Barron THK, Mummery PM, Sharkey M. Can J Chem
1988;66:718-24.
(33) Jarzynski J, Balizer E, Fedderyl J, Lee G. Acoustic Properties, in Properties and
Behavior of Polymers, Vol.1, Seidel A. Ed., Wiley, New York, 2011.
(34) Hartwig G. Cryogenic Properties, in Properties and Behavior of Polymers, Vol.1,
Seidel A. Ed., Wiley, New York, 2011.
(35) Min KE, Lim JC, Seo WY, Kwon HK. J Appl Polym Sci 1994;51:1521-25.
Takahashi et al., 19
Figure Captions
Figure 1 Melting point Tm and crystallization temperature Tc plotted against VAc
content in EVA; (circles) Tm and (diamonds) Tc.
Figure 2 Refractive index of EVA as a function of VAc content. The bold line
represents the refractive index of PMMA.
Figure 3 Scanning electron micrographs of PMMA/EVA (80/20) blends; (a)
PMMA/EVA14, (b) PMMA/EVA20, (c) PMMA/EVA25 and (d)
PMMA/EVA32.
Figure 4 Temperature dependence of (opened circles) tensile storage modulus E
and (closed circles) loss modulus E at 10 Hz for PMMA/EVA14. In the
figure, E curves around Tg of (triangles) EVA14 and (diamonds) PMMA
are also shown with vertical shift.
Figure 5 Temperature dependence of light transmittance for binary blends containing
20 wt% of EVA; (circles) PMMA/EVA14, (squares) PMMA/EVA20,
(diamonds) PMMA/EVA25 and (triangles) PMMA/EVA32.
Figure 6 Temperature dependence of light transmittance for (circles)
PMMA/EVA14/TCP and (diamonds) PMMA/EVA14.
Takahashi et al., 20
Figure 7 Refractive index plotted against the TCP content; (circles) PMMA/TCP and
(diamonds) EVA14/TCP at (open symbols) 20 ºC and (closed symbols) 70
ºC.
Figure 8 Linear expansion coefficients of (closed circles) PMMA and (opened circles)
PMMA/TCP (90/10).
Figure 9 Predicted linear expansion coefficients using the Lorentz and Lorentz
equation for (closed circles) PMMA and (open circles) PMMA/TCP (90/10).
Figure 10 Relation between Tg and TCP content; (circles) PMMA/TCP and
(diamonds) EVA14/TCP.
Figure 11 Scanning electron micrograph of PMMA/EVA14/TCP.
Figure 12 Temperature dependence of (opened circles) tensile storage modulus E
and (closed circles) loss modulus E at 10 Hz for PMMA/EVA14/TCP. In
the figure, E curves around Tg of (triangles) EVA14/TCP (95/5) and
(diamonds) PMMA/TCP (90/10) are also shown with vertical shift.
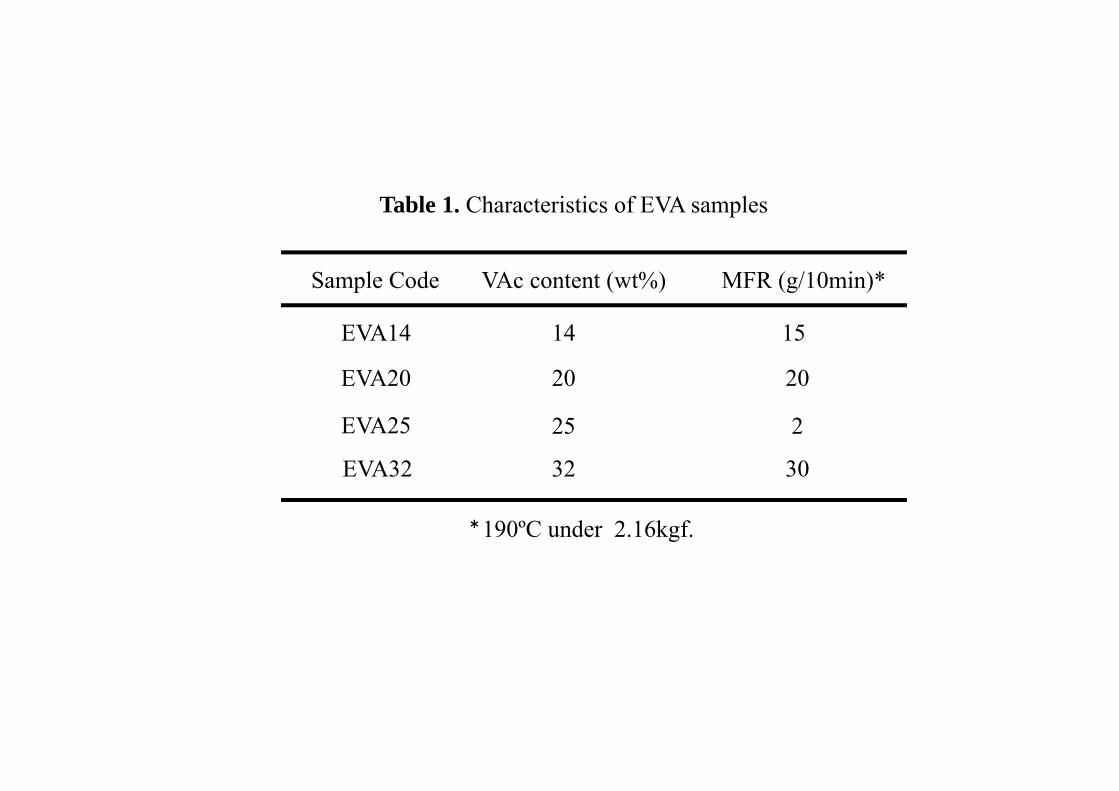
Table 1. Characteristics of EVA samples
Sample Code VAc content (wt%)
EVA14
EVA25
EVA20
EVA32
MFR (g/10min)*
14 15
20 20
25 2
32 30
*190ºC under 2.16kgf.
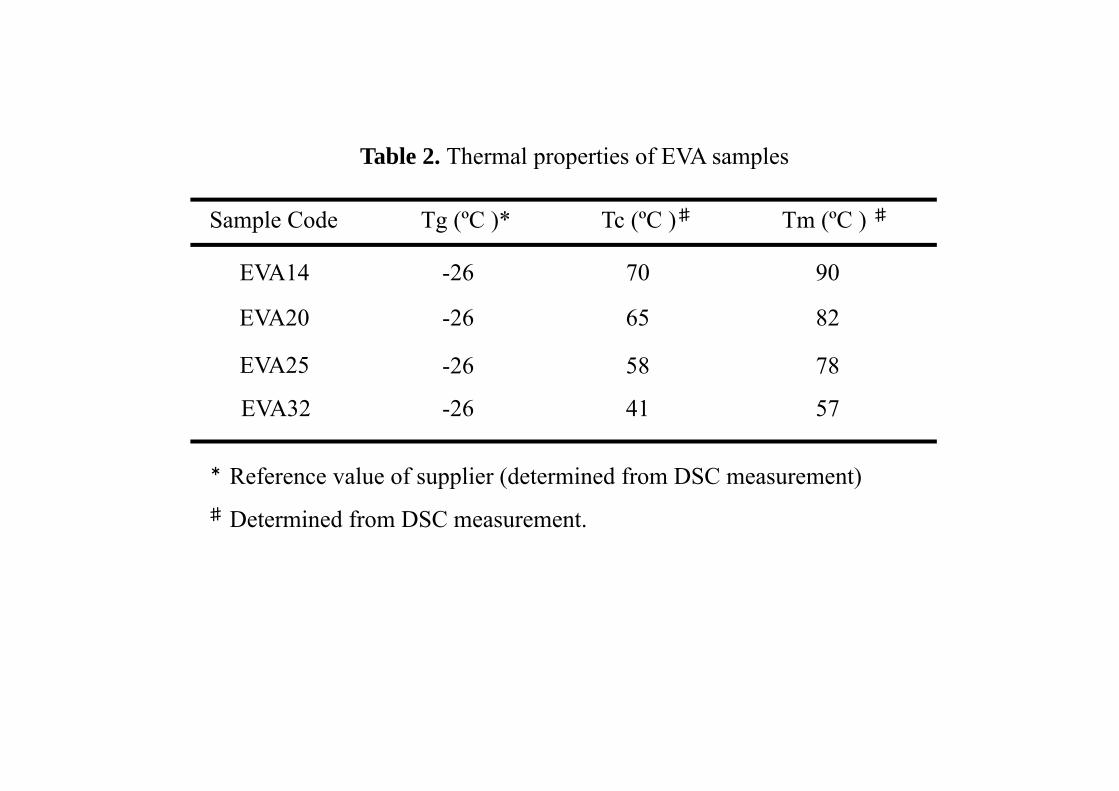
Table 2. Thermal properties of EVA samples
Sample Code Tg (ºC )*
EVA14
EVA25
EVA20
EVA32
Tc (ºC )♯ Tm (ºC ) ♯
-26 70 90
-26 65 82
-26 58 78
-26 41 57
* Reference value of supplier (determined from DSC measurement)
♯ Determined from DSC measurement.
0
20
40
60
80
100
10 15 20 25 30 35
Te
mp
era
ture
(ºC
)
VAc content (%)
Tm
Tc
Takahashi et al.,
Figure 1
1.46
1.47
1.48
1.49
1.50
1.51
1.52
0 10 20 30 40
VAc content (%)
Ref
ract
ive
Ind
ex
20ºC
PMMA
Takahashi et al.,
Figure 2
(a) PMMA/EVA14 (b) PMMA/EVA20
(c) PMMA/EVA25 (d) PMMA/EVA32
100μm20μm 20μm
20μm20μm
Takahashi et al.,
Figure 3
Takahashi et al.,
Figure 4
6
7
8
9
10
-100 -50 0 50 100 150
log
[E' (
Pa)
], lo
g [E
" (P
a)]
Temperature (ºC)
E"
E'10 Hz
E''/10 of PMMA
E''/10 of EVA14
Takahashi et al.,
Figure 5
Tra
nsm
ittan
ce (
%)
100
90
80
70
60
50
Temperature (ºC)604020 80 1000
Takahashi et al.,
Figure 6
0 20 40 60 80 100
Tra
nsm
ittan
ce (
%)
Temperature (ºC)
100
90
80
70
60
50
Temperature (ºC)
PMMA/EVA14/TCP
PMMA/EVA14
Takahashi et al.,
Figure 7
1.485
1.490
1.495
1.500
1.505
1.510
0 5 10 15 20TCP content (%)
Ref
ract
ive
inde
x
PMMA/TCP 20 ºC
PMMA/TCP 70 ºC
EVA14/TCP 70 ºC
EVA14/TCP 20 ºC
Takahashi et al.,
Figure 8
20 30 40 50 60 70 80
Lin
ear
Exp
ans
ion
Co
effic
ient
(
x 1
04 )
Temperature (oC)
PMMA/TCP
PMMA
20 30 40 50 60 70 800
5
10
15
20
1.480
1.485
1.490
1.495
1.500
1.505
20 30 40 50 60 70 80
Temperature (oC)
PMMA/TCP
PMMARef
ract
ive
inde
x
Takahashi et al.,
Figure 9
Takahashi et al.,
Figure 10
-100
-50
0
50
100
150
0 5 10 15 20
TCP content (%)
Te
mp
era
ture
(ºC
)
Tg of PMMA phase
Tg of EVA14 phase
20μm
Takahashi et al.,
Figure 11
Takahashi et al.,
Figure 12
6
7
8
9
10
-100 -50 0 50 100 150
log
[E' (
Pa)
], lo
g [E
" (P
a)]
Temperature (ºC)
E"
E'10 Hz
E''/10 of PMMA/TCP(90/10)
E''/10 of EVA14/TCP(95/5)