optical vector analysis based on optical double …...vector analysis based on optical...
TRANSCRIPT
> REPLACE THIS LINE WITH YOUR PAPER IDENTIFICATION NUMBER (DOUBLE-CLICK HERE TO EDIT) <
1
Abstract— Optical vector analysis (OVA) is of great importance
for the fabrication and application of optical devices. In this
project, we propose and demonstrate the high-resolution optical
vector analysis based on optical double-sideband (ODSB)
modulation. Different from the conventional OVA based on
optical single-sideband (OSSB) modulation, in which the
measurement range is limited by the bandwidth of microwave and
optoelectronic components and the measurement accuracy is
restricted by the high-order sidebands, the OVA based on ODSB
modulation measures the magnitude and phase responses by
taking use of both ±1st-order sidebands without spectrum
response aliasing. As a result, the measurement range is doubled,
and the high-order-sideband induced errors only appear at
specific frequencies which are predictable and removable.
Index Terms—optical vector analysis, optical double-sideband,
measurement error, measurement range, microwave photonics
I. INTRODUCTION
he rapid development of photonic systems requires high
speed and accurate measurement of frequency response of
optical devices with large measurement range. Several methods
were proposed to measure the frequency response, such as the
modulation phase-shift approach [1] and the interferometry
method [2], but the two methods rely on wavelength scan of a
laser source. Owing to the low wavelength accuracy and poor
wavelength stability of typical laser sources, the resolution of
the frequency response measurement schemes based on the two
methods could not be high (typically several hundreds of MHz).
To solve this problem, the method based on microwave
photonics was proposed [3], which has much higher resolution
(up to 78 kHz in [4]) and better stability. However, the
conventional microwave-photonic-based optical vector
analysis (OVA) is realized using optical single-sideband
(OSSB) modulation, which has many limitations. A number of
techniques have been reported to implement the OSSB
modulation, but few of them can meet the above requirements.
In addition, the OSSB-based OVA can only take use of one
sideband to scan one side, which limits the measurement range
to the bandwidth of the microwave and optoelectronic
This work was supported by the MTT-S Scholarship program.
The authors are with the Key Laboratory of Radar Imaging and
Microwave Photonics (Nanjing Univ. Aeronaut. Astronaut.), Ministry of Education, Nanjing University of Aeronautics and Astronautics, Nanjing
211106, China
(e-mail: [email protected], [email protected]).
components used in the system (typically less than 40 GHz).
Furthermore, the OSSB modulation would inevitably stimulate
high-order sidebands, especially when the phase modulation
index is large, which could introduce considerable
measurement errors. In this project, we propose and
demonstrate the high-resolution optical vector analysis based
on ODSB modulation [5, 6]. As compared with the OSSB
modulation, ODSB modulation is wideband, simple, and
efficient. However, when a conventional ODSB signal is sent
to a photodetector (PD), the ±1st-order sidebands are beat with
the optical carrier, generating RF signals with the same
frequency, by which the frequency responses carried by the two
sidebands cannot be differentiated. To solve this spectrum
response aliasing problem, we introduce a frequency-shifted
carrier to the measurement system. When the two sidebands
after propagating through the optical device-under-test (DUT)
and the frequency-shifted optical carrier are combined and beat
at a PD, two different frequency components are generated,
from which the optical spectral response carried by different
sidebands is extracted without aliasing.
II. OVA BASED ON BASED ON ODSB MODULATION
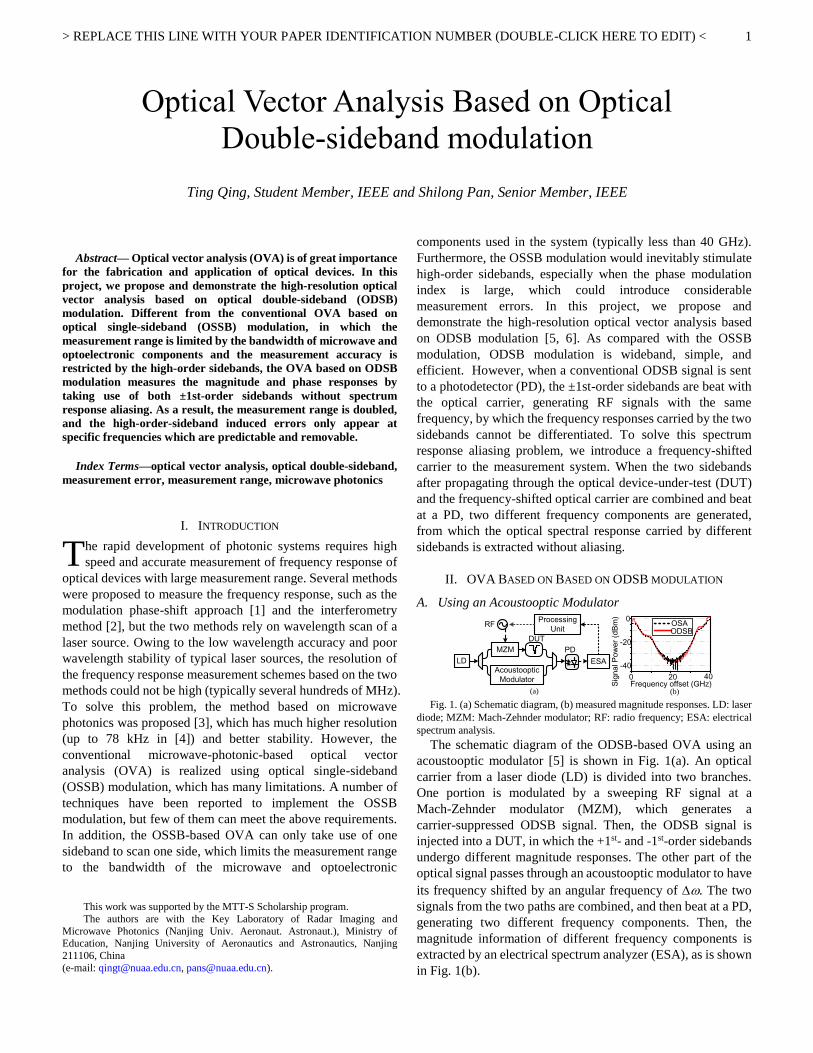
A. Using an Acoustooptic Modulator
ESA
RF
PD
Processing
Unit
DUT
(a)
LD-40
-20
0
0 20 40
Frequency offset (GHz)Sig
na
l P
ow
er
(dB
m)
OSAODSB
(b)
Acoustooptic
Modulator
MZM
Fig. 1. (a) Schematic diagram, (b) measured magnitude responses. LD: laser
diode; MZM: Mach-Zehnder modulator; RF: radio frequency; ESA: electrical
spectrum analysis.
The schematic diagram of the ODSB-based OVA using an
acoustooptic modulator [5] is shown in Fig. 1(a). An optical
carrier from a laser diode (LD) is divided into two branches.
One portion is modulated by a sweeping RF signal at a
Mach-Zehnder modulator (MZM), which generates a
carrier-suppressed ODSB signal. Then, the ODSB signal is
injected into a DUT, in which the +1st- and -1st-order sidebands
undergo different magnitude responses. The other part of the
optical signal passes through an acoustooptic modulator to have
its frequency shifted by an angular frequency of . The two
signals from the two paths are combined, and then beat at a PD,
generating two different frequency components. Then, the
magnitude information of different frequency components is
extracted by an electrical spectrum analyzer (ESA), as is shown
in Fig. 1(b).
Optical Vector Analysis Based on Optical
Double-sideband modulation
Ting Qing, Student Member, IEEE and Shilong Pan, Senior Member, IEEE
T

> REPLACE THIS LINE WITH YOUR PAPER IDENTIFICATION NUMBER (DOUBLE-CLICK HERE TO EDIT) <
2
B. Adopting the Stimulated Brillouin Scattering
(a)
TLS DPMZMo
EDFA
SMF
DUTPD1
PD2
LO RF
BPF
PMD
Reference
e
Processing
Unit
1
23
-20
0
Am
plit
ud
e(d
B)
-e e+e--40
2-2
-40 0 40
-100
0
100
Ph
ase
(°)
Frequency(GHz)
-e e+e-
(b)
MZM2
MZM1
OSAODSB
Fig. 2. (a) The schematic diagram and (b) the measured spectrum response.
TLS, tunable laser source; EDFA, erbium doped fiber amplifier; SMF,
single-mode fiber; BPF, band-pass filter; PMD, phase-magnitude detector.
The schematic diagram of the ODSB-based OVA adopting
the stimulated Brillouin scattering (SBS) [6] is shown in Fig.
2(a). A lightwave with an angular frequency of o is generated
by a tunable laser source (TLS) and then divided into two
portions by an optical splitter. One portion amplified by an
erbium-doped fiber amplifier (EDFA) is served as the
stimulated Brillouin scattering (SBS) pump signal. The other
part, in the lower path, incorporates a DP-MZM, which consists
of two sub-MZMs, i.e. MZM1 and MZM2. In MZM1, the
optical carrier is modulated by a frequency-swept RF signal
with a frequency of 𝜔e, producing two sweeping sidebands with
frequencies of o−e and o+e. In MZM2, the optical carrier
is modulated by a local oscillator (LO) signal with a fixed
frequency of ∆ω, which equals to the Brillouin frequency shift,
to produce two wavelength-fixed sidebands with frequencies of
o−∆ and o+∆. SBS is introduced to suppress one
wavelength-fixed sideband and enhance the other
wavelength-fixed sideband, so the remainder can serve as the
frequency-shifted carrier. In the experiment, the magnitude and
phase responses of the FBG under test are one-by-one mapped
in three segments by respectively detecting the components
with frequencies of e− (e>), −e (e<) and
e+. Then, stitching the measured responses together, the
spectral responses are achieved, as shown in Fig. 2(b). The
transmission response of a fiber Bragg grating (FBG), in a
range of 80 GHz, is measured with a resolution of less than 667
kHz by using 40-GHz microwave components.
C. Using a Dual-Drive Dual-Parallel Mach-Zehnder
Modulator
As can be seen in Fig. 3(a), the frequency-shifted carrier can
be generated by a dual-drive dual-parallel Mach-Zehnder
modulator (DD-DPMZM) and a 90° hybrid coupler. This
method can solve the spikes error problem in [6]. It has a much
simpler and more robust configuration as compared with the
previously-reported ODSB-based OVA.
TLS
MZM1
MZM2
DD-
DPMZM
ODSB
OSSB
90° Hybrid Coupler
A
B
DUT PD1C
PD2
D
LO
RF
BPF
PMD
Reference
(a)
Am
plit
ud
e
(dB
)
-e e+e-
-10
0
-20
0
60
120
Ph
ase
(°)
Frequency Offset (GHz)
-e e+e--40 -20 0 20 40
(b)
OSAODSB
Fig. 3. (a) The schematic diagram and (b) the measured spectrum response.
D. Adopting the Optical Comb
Fig. 4. The measured spectrum response in the frequency range of more than
1 THz.
Replacing the laser source with an optical comb and a
tunable optical filter in the proposed optical vector analyzer
based on ODSB modulation can measure both magnitude and
phase responses in a very broad measurement range. The
approach is experimentally demonstrated in the frequency
range of more than 1 THz, as can be seen in Fig. 4.
III. CONCLUSION
In this project, novel approaches to perform high-resolution
and high-accuracy optical vector analysis based on optical
double-sideband modulation and an acoustooptic modulator,
the stimulated Brillouin scattering, a DD-DPMZM and an
optical comb are proposed and experimentally demonstrated.
The proposed approaches have a doubled measurement range,
and better nonlinearity immunity which leads to a higher
accuracy and a larger dynamic range.
IV. ACKNOWLEDGMENT & CAREER PLANS
I would like to thank my adviser Prof. Pan for his guidance
on my research on microwave photonics. I would also like to
thank MTT-S society for providing me the scholarship, which
is really impressive and fruitful.
The MTT-S scholarship had a strong impact on me and
motivated me to pursue my PhD degree in the future.
REFERENCES
[1] T. Niemi, M. Uusimaa, and H. Ludvigsen, “Limitations of phaseshift
method in measuring dense group delay ripple of fiber Bragg gratings,” IEEE Photon. Technol. Lett., vol. 13, no. 12, pp. 1334–1336, 2001.
[2] G. D. VanWiggeren, A. R. Motamedi, and D. M. Baney, “Single-scan
interferometric component analyzer,” IEEE Photon. Technol. Lett., vol. 15, no. 2, pp. 263–265, 2003.
[3] E. Voges, O. Ostwald, B. Schiek, and A. Neyer, “Optical phase and
amplitude measurement by single sideband homodyne detection,” IEEE J. Quantum Electron., vol. 18, no. 1, pp. 124-129, 1982.
[4] Z. Z. Tang, S. L. Pan, and J. P. Yao, “A high resolution optical vector
network analyzer based on a wideband and wavelength-tunable optical single-sideband modulator,” Opt. Express, vol. 20, no. 6, pp. 6555–6560,
2012. [5] T. Qing, M. Xue, M. H. Huang and S. L. Pan, "Measurement of optical
magnitude response based on double-sideband modulation," Opt. Lett.,
vol. 39, no. 21, pp. 6174–6176, 2014. [6] T. Qing, S. P. Li, M. Xue and S. L. Pan, "Optical vector analysis based
on double-sideband modulation and stimulated Brillouin scattering,"
Optics Letters, vol. 41, no. 15, pp. 3671-3674, 2016.