optimal carbon storage and the choice between continuous cover
TRANSCRIPT
UNIVERSITY OF HELSINKI
FACULTY OF AGRICULTURE AND FORESTRY
DEPARTMENT OF ECONOMICS AND MANAGEMENT
Optimal carbon storage and the choice between
continuous cover forestry and clearcuts
Aino Assmuth
Master’s thesis
Environmental and Resource Economics September 2015
Tiedekunta/Osasto Fakultet/Sektion – Faculty
Faculty of Agriculture and Forestry
Laitos/Institution– Department
Department of Economics and Management
Tekijä/Författare – Author
Assmuth Aino Elina
Työn nimi / Arbetets titel – Title
Optimal carbon storage and the choice between continuous cover forestry and clearcuts
Oppiaine /Läroämne – Subject
Environmental and Resource Economics
Työn laji/Arbetets art – Level
Master’s thesis
Aika/Datum – Month and year
September 2015
Sivumäärä/ Sidoantal – Number of pages
84 p. + Appendices
Tiivistelmä/Referat – Abstract
This study applies two novel forest economic models to analyze the effect of optimal carbon
storage on the choice between clearcuts and continuous cover forestry. Unlike previous studies,
we determine the economically optimal management regime endogenously, by optimization.
We study a policy where the society pays forest owners a Pigouvian subsidy for the carbon that
is sequestered by the stand as it grows. The focus of our analysis is a subsidy system that also
takes into account the carbon both stored in and released from wood products.
In the first part of the thesis, the question of optimal carbon storage is studied using a
continuous time biomass model that does not include any a priori assumptions on clearcuts vs.
continuous cover forestry. We show analytically that subsidized carbon sequestration postpones
thinning and increases optimal stand volume along the rotation. With high carbon price the
shadow value of stand volume becomes negative. Numerical results show that carbon prices
within a realistic range may switch the optimal management regime from clearcuts to
continuous cover management. A higher interest rate can lead to a higher stand volume and a
longer optimal rotation, which contrasts the results of the classic Faustmann model.
Next, the question is studied applying a more detailed size-structured transition matrix model
based on empirically estimated Scandinavian growth data. This approach produces a more
accurate description of the complex dynamics of uneven-aged stands and optimization of
harvesting activities. According to numerical results, thinning is invariably carried out from
above, and the size of the harvested trees increases with carbon price. Optimal rotation age
increases with carbon price, and moderate carbon pricing is sufficient to switch the management
regime to continuous cover management. Optimal rotation age also increases with interest rate.
Clearcut management is the more competitive, the more productive is the site type. Both models suggest that carbon storage has a significant effect on optimal forest management,
and that it typically favors continuous cover forestry. Similar analysis on optimal carbon storage
in forestry has not been presented before. We also discuss various carbon subsidy systems in the
context of developing climate policy.
Avainsanat – Nyckelord – Keywords
carbon sequestration, continuous cover forestry, Faustmann model, optimal rotation, uneven-
aged forestry Säilytyspaikka – Förvaringställe – Where deposited
Viikki Science Library
Muita tietoja – Övriga uppgifter – Additional information
Tiedekunta/Osasto Fakultet/Sektion – Faculty
Maatalous-metsätieteellinen tiedekunta
Laitos/Institution– Department
Taloustieteen laitos Tekijä/Författare – Author
Assmuth Aino Elina
Työn nimi / Arbetets titel – Title
Optimaalinen hiilensidonta ja valinta jatkuvapeitteisen metsänhoidon ja päätehakkuiden välillä
Oppiaine /Läroämne – Subject
Ympäristö- ja luonnonvaraekonomia
Työn laji/Arbetets art – Level
Pro gradu
Aika/Datum – Month and year
Syyskuu 2015
Sivumäärä/ Sidoantal – Number of pages
84 s. + liitteet Tiivistelmä/Referat – Abstract
Tässä pro gradu -työssä tutkitaan kahdella uudenlaisella metsäekonomisella mallilla
optimaalisen hiilensidonnan vaikutusta siihen, kannattaako metsää päätehakata vai hoitaa
jatkuvapeitteisenä. Aiemmista tutkimuksista poiketen taloudellisesti optimaalinen valinta näiden
vaihtoehtojen välillä tehdään endogeenisesti optimoimalla. Tutkimuksessa yhteiskunta maksaa
metsänomistajalle Pigou-tukea metsän kasvun myötä sitoutuvasta hiilestä. Analyysi keskittyy
tukipolitiikkaan, joka huomioi myös puutuotteisiin sitoutuvan ja niistä vapautuvan hiilen.
Työn ensimmäisessä osassa kysymystä optimaalisesta hiilensidonnasta tutkitaan jatkuva-
aikaisella biomassamallilla, joka ei sisällä a priori oletuksia metsän päätehakkaamisen tai
jatkuvapeitteisyyden paremmuudesta. Analyyttiset tulokset osoittavat, että hiilensidonnasta
maksettu tuki lykkää harvennusten aloitusta ja kasvattaa optimaalista puuston tilavuutta yli
kiertoajan. Jos hiilen hinta on korkea, puuston tilavuuden varjohinta on negatiivinen.
Numeeristen tulosten mukaan metsän hoito jatkuvapeitteisenä muuttuu päätehakkaamista
kannattavammaksi, kun hiilen hintaa kasvatetaan. Korkeampi korko voi johtaa suurempaan
puuston tilavuuteen ja pidempään kiertoaikaan, mikä poikkeaa klassisella Faustmannin mallilla
saatavasta tuloksesta.
Seuraavaksi kysymystä tutkitaan hyödyntäen yksityiskohtaisempaa kokoluokkarakenteista
transitiomatriisimallia, joka perustuu pohjoismaisiin empiirisesti estimoituihin kasvufunktioihin.
Tämä lähestymistapa tuottaa biomassamallia tarkemman kuvauksen eri-ikäisrakenteisten
metsien dynamiikasta ja käsittelyn optimoinnista. Numeeristen tulosten mukaan kaikki
harvennukset tehdään yläharvennuksina ja puut korjataan sitä suurempina mitä korkeampi on
hiilen hinta. Hiilen hinnoittelu pidentää optimaalista kiertoaikaa, ja jo maltillinen hiilen hinta
muuttaa jatkuvapeitteisen metsänhoidon päätehakkaamista kannattavammaksi. Myös korkeampi
korko johtaa pidempään kiertoaikaan. Päätehakkaaminen on sitä kilpailukykyisempää mitä
tuottavampi kasvupaikka on.
Molempien mallien mukaan hiilensidonta vaikuttaa merkittävästi optimaaliseen
metsänkäsittelyyn ja tyypillisesti parantaa jatkuvapeitteisen metsänhoidon kilpailukykyä.
Vastaavaa analyysia optimaalisesta hiilensidonnasta metsätaloudessa ei ole aiemmin esitetty.
Lopuksi käsittelemme tutkimuksessa sovellettuja tukijärjestelmiä ilmastopolitiikan kehittämisen
näkökulmasta.
Avainsanat – Nyckelord – Keywords
eri-ikäisrakenteinen metsänhoito, Faustmannin malli, hiilensidonta, jatkuvapeitteinen
metsänhoito, optimaalinen kiertoaika
Säilytyspaikka – Förvaringställe – Where deposited
Viikin tiedekirjasto
Muita tietoja – Övriga uppgifter – Additional information
Acknowledgements
My deepest gratitude goes to Professor Olli Tahvonen for guiding and inspiring my work, and
for making me a member of his research group. M.Sc. Janne Rämö, M.Sc. Sampo Pihlainen
and M.Sc. Antti-Juhani Pekkarinen deserve my sincere thanks for their advice, comments and
friendship. I would also like to thank M.Sc. Emmi Haltia for encouragement. In addition, I
thank Professor Markku Ollikainen and the participants of his thesis seminar for valuable
comments.
Results from this thesis have been presented in the workshop “Economics of Renewable
Resources: Integrating Economics and Ecology” at the University of Kiel in December 2014,
in the 21st Annual Conference of the European Association of Environmental and Resource
Economists in June 2015, and in the 16th Symposium for Systems Analysis in Forest
Resources in August 2015. I thank the participants of these conferences for their comments.
Last but not least, I thank my spouse Sampsa Nisonen for unwavering support.
Table of Contents
1. Introduction ........................................................................................................................ 1
2. Biomass model for optimal thinning and rotation ............................................................... 7
2.1 The optimization problem............................................................................................. 7
2.2 Optimality conditions ................................................................................................. 11
2.3 Results ....................................................................................................................... 13
The properties of optimal thinning ................................................................................ 13
Comparative dynamics of optimal thinning .................................................................. 17
Numerical examples of optimal thinning ...................................................................... 20
Optimal rotation age ..................................................................................................... 21
Comparative statics of optimal rotation age .................................................................. 24
Supply of carbon storage and wood .............................................................................. 32
Optimal solution if only carbon storage matters ............................................................ 35
3. Size-structured transition matrix model for optimal thinning and rotation ......................... 38
3.1 The growth model and the optimization problem ........................................................ 38
3.2 Ecological and economic parameter values ................................................................. 43
3.3 Numerical optimization method.................................................................................. 45
3.4 Results ....................................................................................................................... 45
Optimal thinning and rotation ....................................................................................... 45
Optimal carbon storage................................................................................................. 54
Effect of the subsidy system ......................................................................................... 57
Effect of the site type.................................................................................................... 60
4. Discussion ........................................................................................................................ 63
5. Conclusions ..................................................................................................................... 75
References ........................................................................................................................... 76
Appendices .......................................................................................................................... 85
List of Figures
Figure 1. The growth function and singular solutions, with 3% interest rate and
carbon prices €0, €25 and €500 tCO2-1
. 16
Figure 2. The dependence of stand growth on stand age and volume, with 3%
interest rate and carbon prices €0 and €25 tCO2-1
. 21
Figure 3. The dependence of optimal rotation on the carbon price, with 3% interest
rate. 26
Figure 4. The dependence of optimal rotation on the carbon price, with 1–5%
interest rates. 28
Figure 5. The dependence of optimal rotation on the interest rate, with carbon
prices €0–€50 tCO2-1
. 30
Figure 6. The optimality of continuous cover forestry vs. clearcuts, with carbon
prices €0–€50 tCO2-1
. 31
Figure 7. Mean carbon storage in the stand as a function of carbon price, with
1–5% interest rates. 33
Figure 8. Mean annual wood supply as a function of carbon price, with 1–5%
interest rates. 34
Figure 9. Optimal stand volume development with 2% interest rate and carbon
prices €0–€40 tCO2-1
. 48
Figure 10. Optimal stand structure development with zero carbon price and 2%
interest rate. 50
Figure 11. Optimal stand structure development with a carbon price of €20 tCO2-1
and 2% interest rate. 51
Figures 12 a-b. Steady state stand structure and harvest with 2% interest rate and
carbon prices (a) €20 tCO2-1
and (b) €60 tCO2-1
. 52
Figure 13. The optimality of continuous cover forestry vs. clearcuts with carbon
prices €0–€40 tCO2-1
. 53
Figure 14. Total carbon storage, including carbon storage in the stand and in wood
products, with zero carbon price and 2% interest rate. 55
Figure 15. Total carbon storage, including carbon storage in the stand and in wood
products, with a carbon price of €20 tCO2-1
and 2% interest rate. 55
Figure 16. Optimal stand volume development under different subsidy systems
with 2% interest rate. 58
Figure 17. Optimal stand volume development under different subsidy systems
with 3% interest rate. 59
Figure 18. The optimality of continuous cover forestry vs. clearcuts for site types
SI = 11, SI = 15 and SI = 19.5. 62

List of Tables
Table 1. Size class specific parameter values, per tree. 44
Table 2. Optimal solutions with 1–3% interest rates and carbon prices €0–€60
tCO2-1
, under the product adjusted net subsidy system and for site type 15SI . 47
Table 3. Optimal solutions for site types SI = 11, SI = 15 and SI = 19.5, under the
product adjusted net subsidy system. 61
1
1. Introduction
As societies face the necessity of addressing climate change, the capacity of forests to act as
carbon sinks gains in importance (IPCC 2000, 2014). During the past few decades, as much as
30% of annual global anthropogenic CO2 emissions have been absorbed by forests (Pan et al.
2011). Further, the world’s forest ecosystems together hold more than double the amount of
carbon in the atmosphere (FAO 2006). Thus carbon sequestration benefits provided by forests
constitute a huge economic externality (Canadell and Raupach 2008) that calls for market
intervention like Pigouvian subsidies. As of yet, forest management is not targeted by any
climate policy instruments in the European countries. However, New Zealand has since 2008
applied a system where forest owners can earn carbon credits for the growth of their forests
within the framework of the internationally linked New Zealand Emissions Trading Scheme1
(see Adams and Turner 2012, Tee et al. 2014). Our study applies two novel forest economic
models to analyze the properties of optimal carbon storage in a generalized framework that
allows the optimal choice between plantation type of forestry based on clearcuts and
management that maintains forest cover continuously.
In most Nordic countries, forestry has since the 1930s been based on an officially promoted
rotation regime, where forest stands are artificially regenerated, thinned, and finally clearcut,
resulting in even-aged stands (Siiskonen 2007, Kotilainen and Rytteri 2011, Lundmark et al.
2013). Also Canadian forestry has traditionally been strongly oriented toward even-aged
management (Gauthier et al. 2009). However, criticism of clearcuts and discussion on
management alternatives, such as continuous cover forestry, has recently been on the rise in
all of these countries (Lämås and Fries 1995, Puettmann et al. 2009, Valkeapää and
Karppinen 2013). On the British Isles, forest authorities explicitly encourage foresters to
replace even-aged systems with more complex and diversified forests (Mason 2015).
Continuous cover forestry (or uneven-aged forest management) targets harvesting to the
1 Earning of carbon credits is restricted to forests that were not forest land in 1989 or were deforested between 1990 and 2007. Older forests are subject to emission offset regulation if they are deforested. (New Zealand
Ministry for Primary Industries 2015 a, b.)
2
largest tree-classes and utilizes natural regeneration, resulting in a heterogeneous size
distribution and lacking the expensive initial investment in artificial regeneration. Continuous
cover management attracts interest as an approach that allows a forest owner – or the society
at large – to combine timber production objectives with other goals: recreational use,
collecting non-timber forest products and maintenance of biodiversity (Cedergren 2008,
Thompson et al. 2009). In addition to being more favorable to many forest-dwelling species
(Dahlberg 2011, Calladine et al. 2015), uneven-aged forests are likely to be more resilient
against climate change and other threats than even-aged forests (Thompson et al. 2009, Ray et
al. 2010, Gauthier et al. 2015). In Finland, the Forest Act reform in January 2014 (MAF 2014)
expanded the set of permissible management options to allow continuous cover management
as an alternative to clearcuts. Meanwhile in Sweden, the forest authorities are working to
produce and disseminate information on the applicability of continuous cover management in
private as well as state owned forests (Cedergren 2008).
Recent research suggests that uneven-aged management may be economically competitive
compared to even-aged forestry (Haight and Monserud 1990, Tahvonen 2009, Tahvonen et al.
2010, Kuuluvainen et al. 2012). However, the common conception among silviculturalists and
many forest economists is that while continuous cover management may be preferable in
ecological and social terms, it remains economically inferior compared to clearcut
management (Cedergren 2008). This discrepancy largely follows from divergent research
methods. First, silvicultural studies, such as those referred in Cedergren (2008), typically do
not optimize uneven-aged management at all but merely simulate stand development under ad
hoc management strategies. Second, economic optimization of uneven-aged forestry has
suffered from prolonged theoretical confusions. The economics of uneven-aged forestry was
perhaps first studied by numerical nonlinear optimization in Adams and Ek (1974). Their
study and those that follow apply predetermined endpoints that the stand must reach through a
transition path (see discussion in Tahvonen 2009). This approach is criticized by Haight
(1985) and Haight and Getz (1987), who present the uneven-aged problem as an infinite time
horizon problem without endpoint restrictions. Since then, research on uneven-aged forestry
has branched off into two distinct approaches: the general dynamic approach in the vein of
Getz and Haight (1989), and the static investment efficient approach introduced in Adams
(1976).
3
The general dynamic approach consists of optimizing the management of a stand over an
infinite time horizon given any initial state. In contrast, the “investment efficient” (IE)
approach aims to define the optimal steady state stand stocking by understanding the
stumpage value of trees left unharvested in continuous cover cuttings as an investment cost
similarly as regeneration cost in even-aged forestry (Adams 1976). However, the stumpage
value of the residual trees represents an opportunity cost that occurs if the choice is a
continuous cover harvest instead of a clearcut. While the opportunity cost is relevant when
comparing the profitability of uneven- and even-aged management, it should not be included
in the optimization model when specifying economically optimal continuous cover
management (Rämö and Tahvonen 2014). Various other theoretical problems of the IE
approach have been discussed in Haight (1985), Getz and Haight (1989, p. 287–295),
Tahvonen and Viitala (2006) and Tahvonen (2011). Yet, the IE approach is widespread and
the most commonly applied model in forest economic and silvicultural literature on
continuous cover forestry; see e.g. Schütz (2012, p. 24–26).
Our study follows the general dynamic optimization train of thought. The general dynamic
approach has been combined with a (simplified) individual-tree model (Haight and Monserud
1990) and applied to examine the optimal choice between even- and uneven-aged forestry
(Tahvonen 2009). It has also been extended to an individual-tree model of Norway spruce
with five thermal zones (Tahvonen 2011) as well as single species Scots pine and birch forests
in Fennoscandia (Rämö and Tahvonen 2014).
The economic research on continuous cover forestry has been purely numerical, but very
recently it has turned out that the problem can also be studied analytically, either with a
discrete time size-structured model (Tahvonen 2015a) or with a continuous time biomass
model (Tahvonen 2015b). The latter approach extends the model by Clark (1976, p. 263) and
enables one to study analytical features of uneven-aged forestry and the choice between these
forest management alternatives. The first part of the present thesis extends this model by
including subsidized carbon storage.
Carbon storage has been studied mainly by the classic optimal rotation model. Van Kooten et
al. (1995) examine the effect of carbon taxes and subsidies on optimal rotation and supply of
carbon services. The authors write that the internalization of carbon benefits generally
4
increases rotation ages only moderately but might in some cases yield the result that it is
optimal never to harvest (clearcut) the stand. The study by van Kooten et al. (1995) and many
of their followers apply the simple rotation model where forests can be harvested by
clearcutting only. In e.g. Nordic context this is a strong simplification since more than 40% of
bare land value may originate from partial harvesting (i.e. thinning) before the clearcut
(Niinimäki et al. 2013). The problem of optimal carbon storage in even-aged forestry is
extended to include thinnings in Huang and Kronrad (2006) and in Pohjola and Valsta (2007).
Recent research on economically optimal carbon storage include Niinimäki et al. (2013) for
even-aged Norway spruce and Pihlainen et al. (2014) for even-aged Scots pine, both
computed using a detailed process-based model. The latter two studies show that changing
thinning strategies is at least as important as lengthening the rotation period for economically
efficient carbon storage.
Research on uneven-aged forest management with carbon storage is also emerging. Goetz et
al. (2010) present an integrated biophysical and economic model for determining the optimal
selective management (harvesting and planting) regime for Scots pine in Spain when
considering timber production and carbon sequestration in the biomass, wood products and
forest soil. They conclude that an increase in carbon price leads to a notable increase in the
number of trees, and that sequestration costs are significantly lower for changes in forest
management than for a change in land use.
Pukkala et al. (2011) compare uneven- and even-aged management systems “in spruce and
pine stands in terms of timber, carbon, and bilberry benefits”. Buongiorno et al. (2012)
present a compromise policy that maximizes carbon storage while maintaining a rate of return
on the capital of standing trees equal to the interest rate. However, both Pukkala et al. (2011)
and Buongiorno et al. (2012) apply the economically flawed IE approach. Parajuli and Chang
(2012), in turn, apply what they call “the generalized Faustmann formula” for uneven-aged
management with carbon sequestration. The formulation of the optimization problem is a
variation of the IE approach. According to their results, carbon subsidies will not alter the
optimal solutions for uneven-aged loblolly pine stands significantly.
In short, there is a solid body of research on economically optimal carbon storage in even-
aged forestry with and without optimized thinning. For uneven-aged forestry, the number of
5
such studies is quite limited, and most of the existing studies apply optimization methods that
leave considerable room for improvement. Furthermore, no analytical solutions have been
presented for the problem of uneven-aged forestry with carbon storage. Also completely
missing is a theoretically sound comparison of the optimality of the two management systems
when carbon storage is subsidized.
The objectives of this thesis are as follows: The aim is to present analytical and numerical
results on optimal carbon storage in boreal forestry based on dynamic optimization. Such
results have not been published for continuous cover forestry. Further, the aim is to obtain the
first results on how carbon storage changes the optimal choice between continuous cover
forestry and management based on clearcuts. In addition, by examining the same economic
question using first a stylized biomass harvesting model and then an ecologically and
economically more detailed size-structured model, we aim to highlight some merits and limits
of these two approaches. We limit our analysis to management choices of a price-taking forest
owner operating under perfect capital markets and perfect information on future economic
and ecological parameters. Carbon storage can be described in a very detailed manner, but in
this thesis it is restricted to cover carbon in living and dead trees and in wood products. Thus,
details related to soil carbon and branches, for example, are left out.
The economic model presented in the first part of this study is an extension of the model that
was introduced in Kilkki and Väisänen (1969), further developed in Clark (1976)2 and
revisited in Tahvonen (2015a, b). The model combines elements of the Schaefer biomass
harvesting model with the Faustmann rotation model (Schaefer 1957, Faustmann 1849). In
Tahvonen (2015a, b), the assumptions on the aging function are revised to account for natural
regeneration: the decreasing growth of the aging original trees is supplemented by the density
dependent growth of new, naturally regenerated trees. Thus, by approximating the dynamics
of uneven-aged forests, the stylized model enables the analysis of both uneven-aged forestry
and the choice between forest management alternatives. Our study adds subsidized carbon
sequestration following the van Kooten et al. (1995) formulation, where carbon subsidies
depend on the change in wood biomass.
2 The basic properties of the model have been further investigated in Cawrse et al. (1984) and Betters et al.
(1991).
6
In the second part of the thesis, the economic question is studied numerically using a size-
structured transition matrix model with empirically estimated Scandinavian growth data. This
approach is based on the general dynamic optimization model for uneven-aged forestry (cf.
Getz and Haight 1989, Haight and Monserud 1990) as extended in Tahvonen (2015a). Thus, it
produces a more accurate description of the complex dynamics of uneven-aged stands, their
internal structure, as well as the size of optimally harvested trees and the division of harvest to
saw timber and pulpwood, for example. Earlier results on carbon sequestration within this
research tradition have not been presented. The results produced by this detailed model will
be compared and interpreted against the analytical results and insight gained using the
continuous time biomass approach.
Finally, based on the analysis presented in this thesis, we discuss some current policy issues
relating to carbon storage in forestry. Specifically, we comment the questions of different
carbon subsidy systems and their effects on economically optimal forest management within
the context of climate policy and carbon accounting.
7
2. Biomass model for optimal thinning and rotation
2.1 The optimization problem
Studying the effects of carbon subsidization on optimal uneven-aged forest management,
including the choice between continuous cover forestry and clearcuts, necessitates a model
that can describe both management types and allows the superiority of either one to be
determined endogenously, by optimization. Such a model, a reformulation of the one
introduced in Kilkki and Väisänen (1969) and further developed by Clark (1976), is presented
in Tahvonen (2015a, b).
In this optimal rotation and thinning model, the goal of the forest owner is to maximize the
present value of net revenues from the next and all future rotations. Let x(t) denote the stand
volume (m3
ha-1
) and h(t) the rate of harvested volume (m3 a
-1 ha
-1) in thinning. Parameter 0x
denotes the initial stand volume while 0 0t is the initial moment. Additionally, w is the
regeneration cost, the annual interest rate, and p1 and p2 the stumpage prices for thinning
and clearcut, respectively. The stand can be thinned continuously until the moment T, when
the stand is clearcut. The optimal rotation T, however, might be infinitely long. The
optimization problem takes the form
1 2
, 0
max
T
t T
h t TV w p h t e dt e p x T V ,
subject to
0, ( ) ox g t f x t h t x t x ,
0, maxh h ,
where
8
1 20V
1
Tt T
T
w p h t e dt e p x T
e
denotes the value of bare land, and 0[ , )T t . The differential equation for stand volume
describes stand growth as a product of aging g t and density dependent growth f x . Clark
(1976) assumes that 0g' t and 0g t as t and that f is a single-peaked
function. These assumptions on aging are suitable for pure plantation forestry and yield
optimal finite rotation periods. Here we specify the functions to include natural regeneration,
i.e. g remains strictly positive as t . Thus, the growth and aging functions are assumed
to satisfy
0 0, 0, ˆ ˆ0, 0, 0f f x f x f x x x (A1)
0 0, 0, 0, lim 0t
g g t g t g t g
, (A2)
0g f , (A3)
as in Tahvonen (2015b). Natural regeneration implies that even if the stand is managed by
clearcuts, it will generally not be even-aged but consist of trees of different ages. An example
of such a growth function for Norway spruce on an average productivity site is shown in
Figures 1 and 2, based roughly on Bollandsås et al. (2008). If left undisturbed, the stand will
approach a volume of 370 m3 ha
-1. The growth of the stand is maximized at the volume of
approximately 181 m3 ha
-1 and the long run maximum sustained yield is about 7.0 m
3 a
-1 ha
-1.
Next we include carbon storage in the model. Following van Kooten et al. (1995) (see also
Amacher et al. 2009, p. 72–75), we study a policy where the society pays the forest owner a
Pigouvian subsidy for the carbon that is sequestered by the stand as it grows. Here the
external benefit is a function of the change in stand volume, not of the stand volume itself as
in the Hartman formulation (van Kooten et al. 1995, Hartman 1976). In order to achieve cost-
effectiveness, i.e. equal marginal costs for CO2 emission abatement across the economy, the
forestry carbon subsidy can be linked to a carbon price – assumed to be formed in an
9
emissions trading market – by multiplying the carbon price by the amount of carbon stored in
a wood volume unit. Present attempts to implement emission trading include various
problems and lately the EU ETS carbon price level has remained below €10 tCO2-1
(Edenhofer 2014). Influential estimates of the social cost of carbon, i.e. marginal economic
damage caused by an additional ton of carbon dioxide emissions (Nordhaus 2014), range from
$15 to $25–77 tCO2-1
, all expected to increase towards the year 2050 (Tol 2005, Dietz and
Stern 2015, respectively)3. However, costs arising from the small probability of catastrophic
damages are difficult to capture in such estimates, implying that the true social cost might be
even higher (Pindyck 2013, Weitzmann 2014). In this thesis, to cover the middle ground
between the estimated social cost and the current EU ETS carbon price, most computations
are carried out assuming a carbon price of €0–60 tCO2-1
. For simplicity, the carbon price is
assumed to be constant over time.
Harvesting wood from the stand may result in at least a part of the stored carbon being
released, and the subsidy should be cut (subtracted) accordingly. Thus we include a negative
term, where the harvest rate is multiplied by the carbon price, the carbon content of a wood
volume unit, and a constant which denotes the share of carbon content that is released as a
consequence of harvesting. (In the formulation of van Kooten et al. (1995), the forest owner
has to pay a tax for the released carbon, that is, the part of carbon that is not “pickled”.) The
value of is defined as 0 1. If the society acknowledges exclusively the carbon stored
in the forest stand, it is reasonable to subsidize the increase in stand volume net of harvesting.
This implies that the subsidies will be subtracted for the full amount of harvested volume
( 1) , which we call the net subsidy system. The underlying assumption, also employed in
the New Zealand subsidy system (Manley and Maclaren 2010), is that harvesting wood
biomass causes the instant release of all carbon stored within it. This could be the case if the
wood is burned for bioenergy and no substitution effects are taken into account.
However, if the carbon that remains stored in wood products is considered as well, subsidies
are subtracted only partially or not at all ( 0 1 ). If is zero, the society applies the
3 In 2014 US dollars, converted from 2004 (Tol 2005; assumed because not reported) and 2005 (Dietz and Stern
2015) US dollars.
10
gross subsidy system (Pihlainen et al. 2014). In this case, either it is known that no carbon is
released into the atmosphere as a consequence of harvesting because it is permanently stored
in wood products like buildings, or (more probably) the responsibility for releasing carbon is
thought to lie with the user of wood material instead of the forest owner (Tahvonen 1995).
Alternatively, the policy might rest on the assumption that the wood is used as a substitute for
a carbon-intensive input, e.g. as an energy source instead of fossil fuels or as construction
material in replacement of concrete.
Yet in reality, carbon neither stays in wood products forever nor is instantly fully released at
harvest. Instead, it is gradually released as each wood product is decomposed according to its
specific qualities (Pihlainen et al. 2014, cf. Goetz et al. 2010). Decisive, then, is how the flows
of released carbon occurring at different points in time are valued – which depends on the
interest rate (Pihlainen et al. 2014). Thus becomes a function of interest rate. Further, as it
is the society that defines ( ) , the interest rate in question does not necessarily have to be
the same as the one applied by the forest owner or any other market operator. However, to
facilitate the analysis, in the present part of the study is assumed a constant and
independent of any other parameters. Hence, within the biomass model the product adjusted
net subsidy system is approximated by setting 0 1 .
The problem of the forest owner is to maximize the net present value of the next and all future
rotations. The control variable is the harvest (or thinning) rate h(t). The state variable is the
stand volume, x(t). In addition, the problem is to choose the optimal rotation length T. Denote
the carbon price with cp and the amount of carbon sequestered in a wood volume unit with .
Now the problem takes the form
, 0
max
T
t T
c c ch t T
J w e ph t p g t f x t p h t dt e px T p x T V , (1)
s.t. 0 0, ( )x g t f x t h t x t x , (2)
0, maxh h , (3)
11
where
0V
1
Tt T
c c c
T
w e ph t p g t f x p h t dt e px T p x T
e
(4)
denotes the value of bare land.
In addition to assumptions (A1)–(A3) it is assumed that the stumpage price p in thinning
equals the stumpage price in clearcuts. In even-aged forestry with thinnings from below,
stumpage price is lower for thinnings than for clearcuts because the former are typically more
costly per m3 and yield mostly pulpwood. However, in the continuous time biomass
harvesting model thinning implicitly targets the largest trees of the stand, whereas in clearcuts
small trees are harvested as well as the large ones implying higher harvesting cost per m3
(Tahvonen 2011). This implies that the difference of stumpage prices is typically minor.
Moreover it is assumed that
0 , (A4)
0 1 , (A5)
0 . (A6)
2.2 Optimality conditions
The Hamiltonian function and its partial derivatives read as follows.
c cH p p h t p g t f x t g t f x h t , (5)
h cH p p ,
x cH g t f x p .
12
The Hamiltonian is linear in h(t) and the necessary optimality conditions take the form
(Seierstad and Sydsæter 1987, p. 397: theorem 16)
if 0, 0cp p h , (6a)
if 0, 0,c maxp p h h , (6b)
if 0, c maxp p h h , (6c)
x cH g t f x p , (7)
0, 0, 0c cT p p x T T p p x T , (8)
0.
c c
c
p p h T p g T f x T T g t f x T h T
p p x T V
(9)
To analyze the sufficiency of the necessary conditions, derive
20, '' , 0, 0 .hh xx c xh xx hh xhH H g t f x p H H H H
It is not possible to rule out 0cp a priori. Thus, Hamiltonian may not be concave in h
and x. However, by the sufficiency theorem of Arrow (Sydsæter et al. 2008, p. 332) the
necessary conditions are sufficient if maximized Hamiltonian is concave in x . By (6a, b) it
follows that if optimal h remains either in the singular solution or 0h regime, the
condition 0 c cp p p holds true implying that necessary optimality
conditions are sufficient for any fixed value of T . However, as emphasized by Sydsæter et al.
(2008, p. 336) the concavity of the maximized Hamiltonian does not imply sufficiency of the
necessary conditions when the final time is free. Thus, the sufficiency of the necessary
conditions in choosing the optimal T will be analyzed separately.
13
2.3 Results
The properties of optimal thinning
The switching function is cp p . To maintain the singular solution it must hold
that ... 0 . Differentiating with respect to time yields – 0 . Utilize (7) and
then (6b) to obtain
0cg t f x p .
Rearranging yields
(1 ) 0c cp p g t f x p p . (10)
Note that if cp is set to zero, equation (10) reads
0 0p pg t f x g t f x
as in Clark (1976, 265).
To characterize the stand volume along the singular solution, rearrange (10) into
(1 )
c
c
p pf x
p p g t
, (11)
where
0
(1 ) cp p g t
.
By assumptions on f we have 0ˆf x . Thus, the singular solution satisfies the properties
14
if
, ( ) 0 ,
, ( ) 0 ,
, ( ) 0
ˆ
ˆ
ˆ .
c
c
c
p p f x x
p p f x x
p xp
x
f x x
x
Hence the optimal volume on the singular path will be above the growth-maximizing level if
the stumpage price is sufficiently low relative to the carbon subsidy cutback, i.e. the carbon
price multiplied by the carbon content of wood volume unit and the share of carbon content
that is released as a consequence of harvesting.
To solve the optimal harvest on the singular path, differentiate (10) with respect to time:
(1 ) 0cg t f x g t f x x p p .
Utilizing (2) yields
(1 ) 0cg t f x g t f x g t f x h t p p ,
0g t f x h t g t f x g t f x g t f x ,
.
g t f xh t g t f x
g t f x
Combining with (10) yields
2(1 )
c
c
g tp ph t g t f x
p p g t f x
, (12)
where 2/ 0g t g t f x and (1 ) 0cp p . The first (positive) term of (12)
corresponds to stand growth at t. If stumpage price net of carbon subsidy cutback is positive,
the second term will be positive. In this case, thinning will exceed the stand growth and thus
the stand volume must decrease on the singular path (see Figure 1). If cp p , thinning
level will fall below the stand growth and the stand volume will increase on the singular path.
15
The special case cp p yields a singular path where 0f x , i.e. thinning keeps the
stand volume at the level x̂ where stand growth is maximized.
If cp p , then 0 and 0f x along the singular path. Thus if the carbon subsidy
cutback exceeds the stumpage price, the shadow price of the stand volume is negative. This is
because any increase in stand volume decreases stand growth ( 0f x , ˆx x ) and thus the
very valuable sequestration of carbon, and provides no additional benefit as the direct net
revenues from harvesting are negative. In this case, the scarce resource is not wood but the
remaining capacity for carbon sequestration. The negative shadow price explains the
seemingly counterintuitive finding that the optimal harvest rate can be positive even when the
direct net revenues from harvesting are negative: the stand volume is controlled in order to
maintain a sufficient rate of stand growth and carbon sequestration. As the carbon subsidy
cutback cp can never be larger than the carbon subsidy cp that is paid for the stand
growth, and the stand growth exceeds the harvest rate, the combined net revenues from
harvesting and carbon sequestration will actually be positive.
Given 0 0x it follows that 0 0cg t f x p by (7) and if
0 cp p then 0 0h by (6a). The correct choice of 0 implies that
1 ct p p at the same moment when the solution for x g t f x , 0 0x intersects
the singular solution in x, t plane and h jumps to the singular solution level defined by (12).
This means that initially, the stand is left to grow undisturbed because the net price for
harvesting is below the value of the co-state variable (the shadow price).
Next we show how carbon subsidization changes the stand volume on the singular path.
Equation (10) can be rearranged to
0.(1 )
c
c
p pf x g t
p p
(13)
16
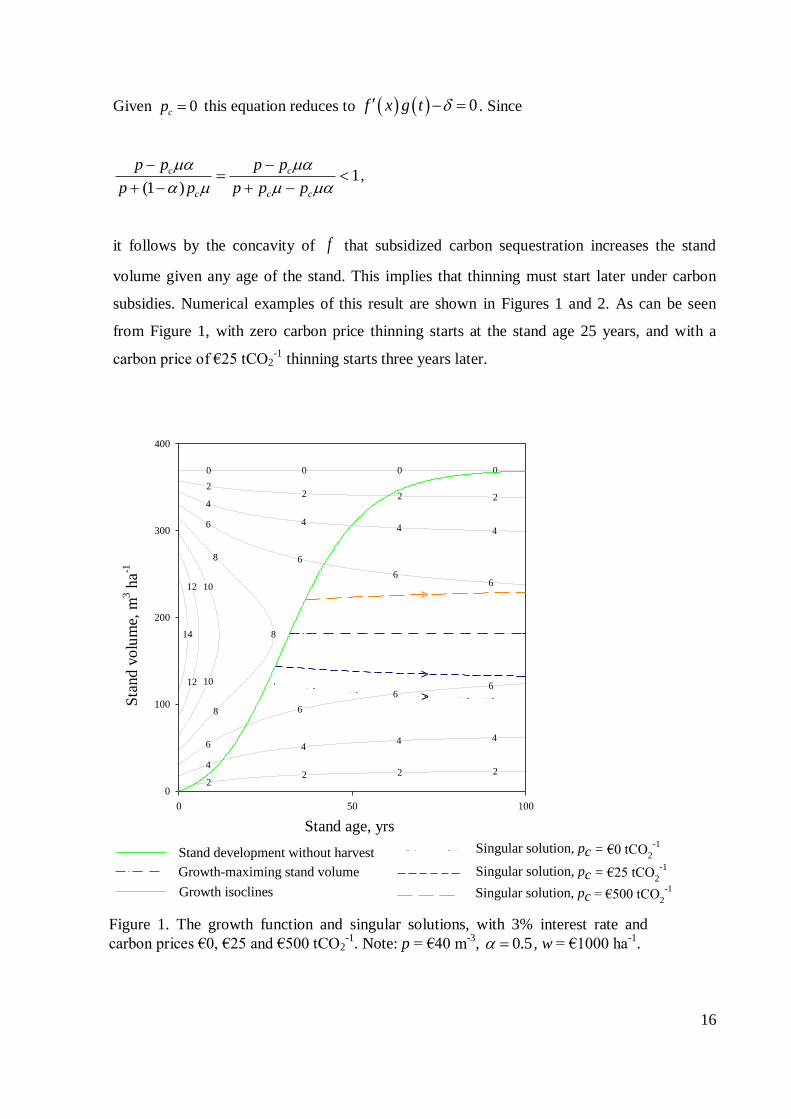
Given 0cp this equation reduces to 0f x g t . Since
1(1 )
c c
c c c
p p p p
p p p p p
,
it follows by the concavity of f that subsidized carbon sequestration increases the stand
volume given any age of the stand. This implies that thinning must start later under carbon
subsidies. Numerical examples of this result are shown in Figures 1 and 2. As can be seen
from Figure 1, with zero carbon price thinning starts at the stand age 25 years, and with a
carbon price of €25 tCO2-1
thinning starts three years later.
0 0 0 0
2222
444
4
66
6
6
66
6
6
4
44 4
2222
8
8
8
10
10
12
12
14
Figure 1. The growth function and singular solutions.
Note: p = €40 m-3, = 0.5, = 0.7.
Stand age yrs
0 50 100
Sta
nd v
olu
me
m3 h
a-1
0
100
200
300
400
>
>
>
Singular solution, pc = €0 tCO2
-1
Singular solution, pc = €25 tCO2
-1
Singular solution, pc = €500 tCO2
-1
Stand development without harvest
Growth-maximing stand volume
Growth isoclines
Figure 1. The growth function and singular solutions, with 3% interest rate and
carbon prices €0, €25 and €500 tCO2-1
. Note: p = €40 m-3
, 0.5 , w = €1000 ha-1
.
Stand age, yrs
Sta
nd v
olu
me,
m3 h
a-1
17
Comparative dynamics of optimal thinning
Define
(1 )
c
c
p p
p p
. (14)
By (13) 1 0x / / g t f , i.e. the smaller is , the higher is the stand volume along
the singular solution. Differentiation yields
2
0(1 )
c
c
p
p p p
.
Thus, 0x / p implying that the higher is p, the lower is stand volume along the singular
solution. When the stumpage price rises, the profitability of timber production relative to
carbon sequestration services increases. It thus becomes optimal to start the thinning earlier
and reach a lower stand volume. Next we obtain
2
0.(1 )c c
p
p p p
Thus, 0cx / p implying that the higher is cp , the higher is stand volume along the
singular solution. The effect is similar for , CO2 content of a timber volume unit. When the
carbon price increases, the profitability of timber production relative to carbon sequestration
is reduced, and it becomes optimal to start the thinning later and reach a higher stand volume.
Additionally, note that if 0 (no carbon is released back to the atmosphere from wood
products) we obtain from (13)
c
pf x g t
p p
.
18
Thus, when cp , it follows that 0f , i.e. the stand volume approaches the level that
produced the maximum growth. Thus an extremely high carbon price works in favor of a
growth-maximizing thinning solution under the gross subsidy system where no carbon is
returned to the atmosphere from harvested trees.
However, if 0 1 ,
(1 )
c
c
p pf x g t
p p
.
Now when / (1 ) / (1 ) 0,c c cp p p p p from above. Hence,
stand volume on the singular path rises above the growth-maximizing level and further
towards a level where / (1 )f x g t as the carbon price approaches infinity.
Under the product adjusted net subsidy system it becomes optimal to keep the stand level
above the level that maximizes forest growth when carbon price is very high.
If 1 (all carbon is released immediately to atmosphere at harvest),
cp p
f x g tp
implying that when , /c cp p p p . Under the net subsidy system, the stand
volume on the singular path rises above the growth-maximizing level and further towards the
carrying capacity as the carbon price approaches infinity, suggesting that thinning becomes
suboptimal.
Next we obtain
2
( )0.
(1 )
c c
c
p p
p p
19
Thus, 0x / implying that the higher is the released share of carbon content, the higher
is stand volume along the singular solution. When the harvesting of each wood unit causes a
larger release of carbon, and thus a larger subsidy subtraction, the profitability of wood
production relative to carbon sequestration is reduced. It becomes optimal to start the thinning
later and reach a higher stand volume.
Finally,
0(1 )
c
c
p p
p p
if cp p ,
0
if cp p ,
and 0
if cp p .
Thus, if cp p , then 0x / implying that the higher is , the lower is stand volume
along the singular solution. If the stumpage price net of carbon subsidy cutback is positive, a
rise in the interest rate makes it optimal to start thinning and thus the flow of stumpage
revenues earlier, leading to a lower stand volume on the singular path.
If cp p , then 0x / implying that the level of will not have any effect on the
stand volume along the singular solution. The net revenues from harvesting will be zero, and
the income will only consist of the subsidies that are paid according to the stand growth. Thus
it is optimal to reach and maintain the stand level that maximizes stand growth, irrespective of
the interest rate.
However, if cp p , then 0x / implying that the higher is , the higher is stand
volume along the singular solution. If stumpage price net of carbon subsidy cutback is
negative, it is worthwhile to utilize the high-growth early years of the stand exclusively for
carbon sequestration and to begin thinning only when the high volume of the stand starts to
become an impediment to its growth. A rise in the interest rate amplifies the preference for
20
current net subsidies versus future gains through enhanced growth, thus postponing the start
of thinning and leading to a higher stand volume on the singular path.
Numerical examples of optimal thinning
We apply a growth function specification for Norway spruce that is roughly in line with
Bollandsås et al. (2008) and assume
01.2
1.6 ( ) 8( ) [ ( )] 1 0.065[ ( ) 8] 1 , 0
1 0.04 378
x tg t f x t x t x
t
. (15)
In all our numerical examples, we set = 0.7 tCO2 m-3
(Niinimäki et al. 2013). Singular stand
volume paths with three different carbon prices are obtained as shown in Figure 1 (dotted line
and dashed lines), given a stumpage price of €40 m-3
and an annual interest rate of 3%.
Additionally, we assume that harvesting a timber volume unit releases half of its carbon
content ( 0.5 ). Assuming the specification (15), the differential equation
0/ ( ) [ ( )], 0dx dt g t f x t x can be solved analytically, and the solution is the light green
solid line in Figure 1. An interception point of a singular path and the undisturbed path is
denoted by 1t , which is the switching moment and the start of optimal thinning.
The lowest stand volume on the singular path follows with zero carbon price (Figure 1). With
a positive carbon price thinning starts later and the stand volume on the singular path is
higher. If the stumpage price is larger than the carbon subsidy cutback, the stand volume will
lie below the volume maximizing level and will decrease on the singular path. However, if the
carbon price is sufficiently large to render the term cp p negative, the stand volume will
be above the growth-maximizing level and keep on increasing while the stand is thinned.
The dependence of stand growth rate on stand age and volume is presented in three-
dimensional space in Figure 2. Growth is at its highest when the stand is young and decreases
as the stand ages. Given any stand age, the growth rate increases as the stand volume
approaches 181 m3 ha
-1 from below or above. The solid green line depicts the development of
an undisturbed stand: when the stand is 31 years old, it reaches the growth-maximizing
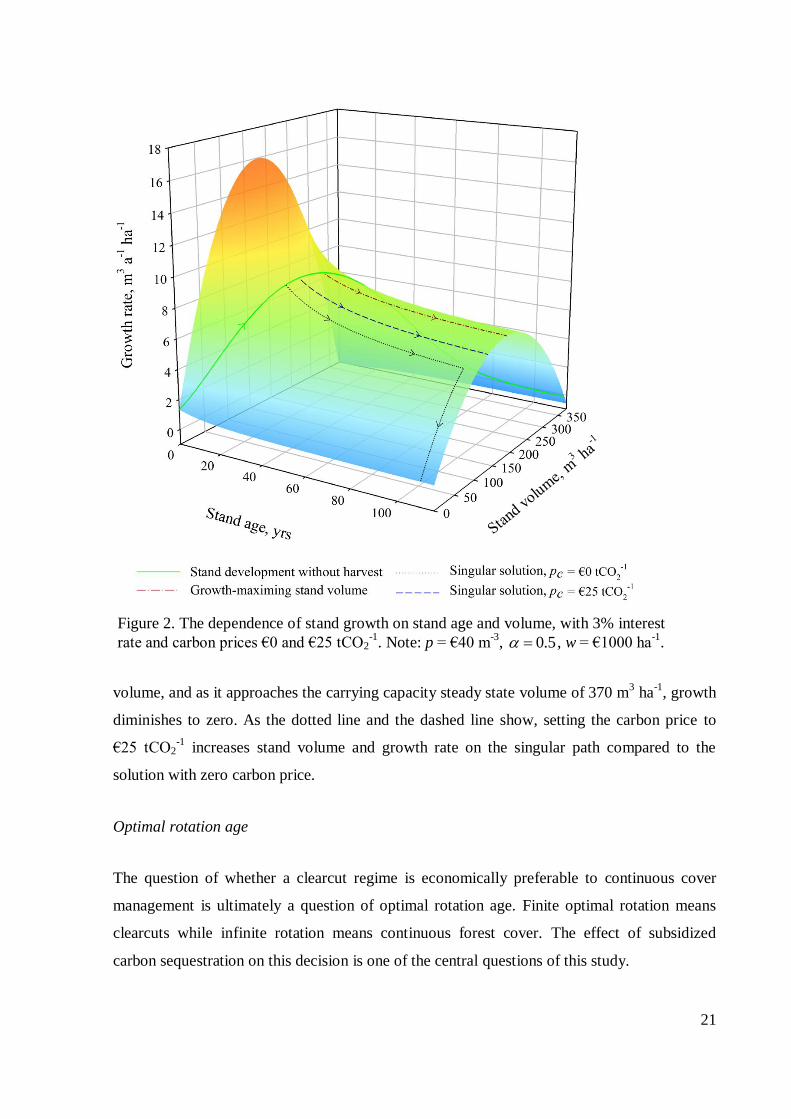
21
volume, and as it approaches the carrying capacity steady state volume of 370 m3 ha
-1, growth
diminishes to zero. As the dotted line and the dashed line show, setting the carbon price to
€25 tCO2-1
increases stand volume and growth rate on the singular path compared to the
solution with zero carbon price.
Optimal rotation age
The question of whether a clearcut regime is economically preferable to continuous cover
management is ultimately a question of optimal rotation age. Finite optimal rotation means
clearcuts while infinite rotation means continuous forest cover. The effect of subsidized
carbon sequestration on this decision is one of the central questions of this study.
Figure 2. The dependence of stand growth on stand age and volume, with 3% interest
rate and carbon prices €0 and €25 tCO2-1
. Note: p = €40 m-3
, 0.5 , w = €1000 ha-1
.
22
Following the singular path to the end of rotation satisfies (8) as an equality, i.e.
cT p p . Thus (9) can be given as
0
c c
c c
y T p p h T p g T f x T
p p g t f x T h T p p x T V
implying
1 0c cy T p p g T f x T p p x T V . (16)
Note that
1
10( )
V1
t Tt t T
c c c c
T
tw p g t f x e p p h t p g t f x t e dt p p xt T e
e
d
where h t , 1t t T is determined by the singular solution.
Assume that 1 0y t .4 If 0y T , the optimal finite T is unique. Differentiating y with
respect to T yields
( ) 01 ,
1 .
c cy T
c c
y T p p g T f x T g T f x x p p x V
p p g f gf x p p x
Rearranging (10) into (1 )c cp p g t f x p p , we can write
( ) 0
1 1 0.c cy Ty T p p g f gf x gf x p p g f
(17)
4 Thus we exclude the cases where the stand is clearcut before the singular path is reached, i.e. thinning is not
optimal (cf. Clark 1976, p. 267).
23
Because 1 cp p is positive and g f negative, y slopes monotonically downwards at
T . Thus given any finite T satisfying (16), the necessary conditions are sufficient for an
optimal finite rotation age, which is unique.
If no finite T satisfying (16) exists, it follows that 0y T when T . In these cases the
optimal rotation is infinite and one should carry on thinning forever without clearcuts. If
lim t
g t g
is very low and 0cp p x T V , then y(T) will be negative when T is
sufficiently large. Thus the optimal rotation will be finite if the long term yield from a
continuous cover forest is low enough and the sum of clearcut net revenues and bare land
value is positive. However,
1 0c cp p g T f x T p p x T
by (10) and the concavity of f. 5 This implies that if the bare land value is sufficiently small
(e.g. negative), then ( ) 0 for 0,y T T and the optimal rotation will be infinite.
Additionally, if ,cp p then the interest cost on the bare land value is the only potentially
negative element in ( )y T , and infinite rotation follows if
1 c cp p g T f x T p p x T V
for 0,T .
The interpretation of (16) can be facilitated by utilizing (2) and writing
1 ( ) ( )c cp p h T x T p p x T V . (18)
5 By (10),
1 1 ( ) .c c cp p g T f x T p p x T p p g T f x T f x T x T
The concavity of f implies that ( ( )) / ( ) 0f x T x T f x T and thus ( ) 0f x T f x T x T .
24
This implies that at the moment of the clearcut, the rate of timber and carbon revenues net of
their decrease equals the interest obtained on the sum of clearcut net revenues and the value of
bare land. Conversely, an infinite rotation is optimal if
1 ( ) ( ) 0c cp p h T x T p p x T V (19)
for all 0T , . By (A2), (2) and (12),
lim ( ) t
h t gf x h
(20)
and lim 0t
x t
. (21)
Thus when T , the inequality (19) can be given as
1 c
c
p p hp p x V
. (22)
This together with the uniqueness result (17) implies that it is optimal to never clearcut the
stand, if the present value of thinning and net carbon subsidy revenues over an infinite time
horizon exceeds the sum of clearcut net revenues and bare land value.
Comparative statics of optimal rotation age
To study the effect of Pigouvian carbon subsidies on the relative competitiveness of
continuous cover forestry and clearcuts, we start by considering whether an increase in carbon
price lengthens or shortens the optimal rotation. Taking into account that the solution satisfies
the singular condition (10), the derivative of (16) with respect to carbon price can be given in
the form
( )(1 ) ( ) ( ( )) ( )
c c
y T Vg T f x T x T
p p
, (23)
25
where the first two terms are positive and the third term is negative. The first term
(1 ) ( ) ( ( ))g T f x T represents an increase in the net carbon subsidy revenues at T as the
carbon price increases. The second term ( )x T represents a decrease in the interest cost on
the stand value right before the clearcut, because a higher carbon price translates to a larger
subtraction of subsidies when the stand is clearcut. On the other hand, the third term
/ cV p reflects an increase in interest cost through the increased bare land value. Since
carbon subsidies are an additional source of income to the forest owner, they can only
increase the bare land value. The sign of the partial derivative is determined by the relative
magnitudes of these three terms. Thus, a higher carbon price may lengthen or shorten the
optimal rotation age.
If 0 , the partial derivative reduces to
( )( ) ( ( ))
c c
y T Vg T f x T
p p
. (24)
Under the gross subsidy system, the carbon subsidy subtractions are not present and the sign
of the partial derivative depends on whether the increase in carbon subsidy revenues at T
dominates the increase in interest cost on the bare land value.
If 1 , the partial derivative takes the form
( )( )
c c
y T Vx T
p p
. (25)
In the case of immediate carbon release after harvest, a higher carbon price implies a longer
rotation, if the increase in the subsidies subtracted at clearcut is greater than the increase in the
bare land value.
Hence the effect of carbon price on optimal rotation age and whether the rotation is finite or
infinite will depend on the function specifications and parameter values. Given the growth
function specification (15), we obtain optimal rotation lengths shown in Figures 3 and 4.
26
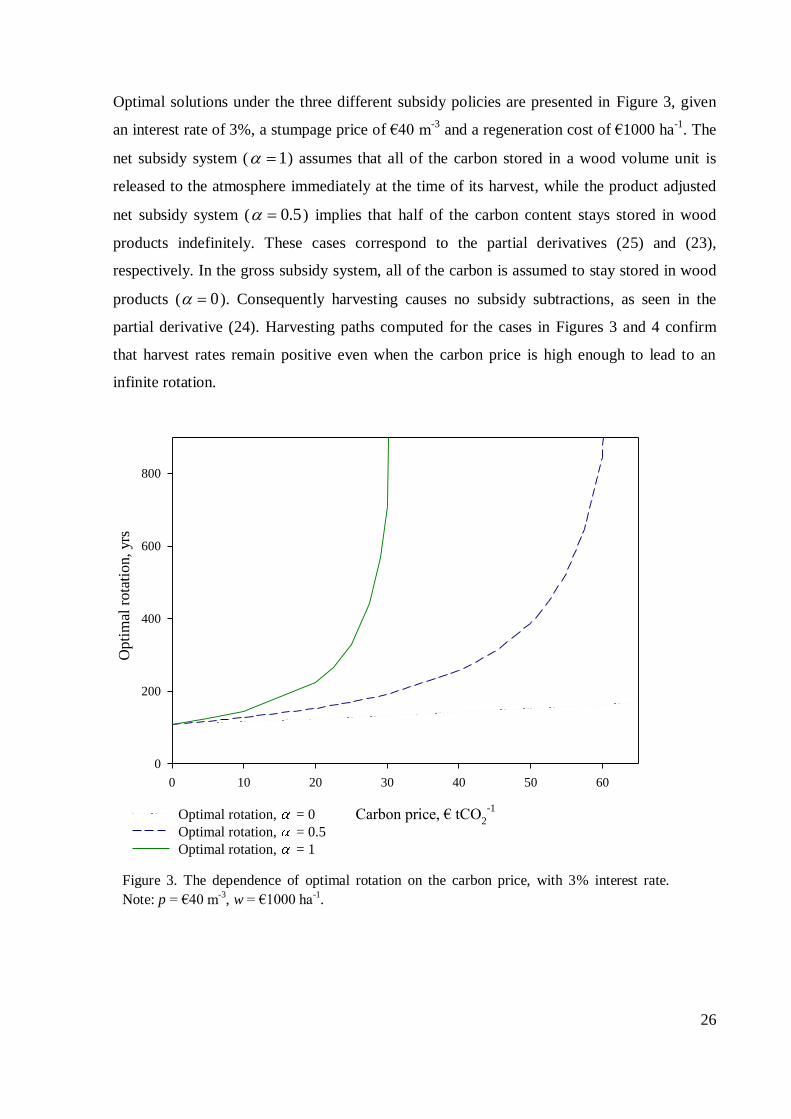
Optimal solutions under the three different subsidy policies are presented in Figure 3, given
an interest rate of 3%, a stumpage price of €40 m-3
and a regeneration cost of €1000 ha-1
. The
net subsidy system ( 1 ) assumes that all of the carbon stored in a wood volume unit is
released to the atmosphere immediately at the time of its harvest, while the product adjusted
net subsidy system ( 0.5 ) implies that half of the carbon content stays stored in wood
products indefinitely. These cases correspond to the partial derivatives (25) and (23),
respectively. In the gross subsidy system, all of the carbon is assumed to stay stored in wood
products ( 0 ). Consequently harvesting causes no subsidy subtractions, as seen in the
partial derivative (24). Harvesting paths computed for the cases in Figures 3 and 4 confirm
that harvest rates remain positive even when the carbon price is high enough to lead to an
infinite rotation.
0 10 20 30 40 50 60
0
200
400
600
800
Optimal rotation, = 0
Optimal rotation, = 0.5
Optimal rotation, = 1
Carbon price, € tCO2
-1
Opti
mal
rota
tion, yrs
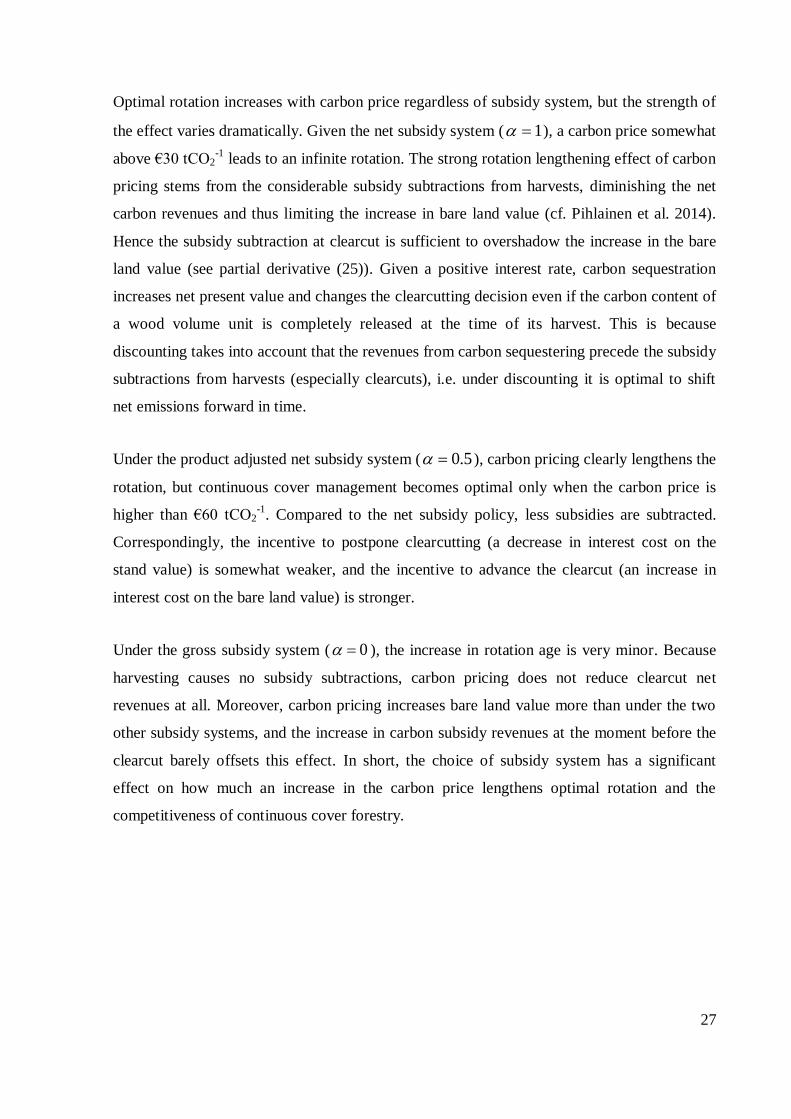
Figure 3. The dependence of optimal rotation on the carbon price, with 3 % interest rate.
Note: p = €40 m-3, = 0.7, w = 1000.
Figure 3. The dependence of optimal rotation on the carbon price, with 3% interest rate.
Note: p = €40 m-3
, w = €1000 ha-1
.
27
Optimal rotation increases with carbon price regardless of subsidy system, but the strength of
the effect varies dramatically. Given the net subsidy system ( 1 ), a carbon price somewhat
above €30 tCO2-1
leads to an infinite rotation. The strong rotation lengthening effect of carbon
pricing stems from the considerable subsidy subtractions from harvests, diminishing the net
carbon revenues and thus limiting the increase in bare land value (cf. Pihlainen et al. 2014).
Hence the subsidy subtraction at clearcut is sufficient to overshadow the increase in the bare
land value (see partial derivative (25)). Given a positive interest rate, carbon sequestration
increases net present value and changes the clearcutting decision even if the carbon content of
a wood volume unit is completely released at the time of its harvest. This is because
discounting takes into account that the revenues from carbon sequestering precede the subsidy
subtractions from harvests (especially clearcuts), i.e. under discounting it is optimal to shift
net emissions forward in time.
Under the product adjusted net subsidy system ( 0.5 ), carbon pricing clearly lengthens the
rotation, but continuous cover management becomes optimal only when the carbon price is
higher than €60 tCO2-1
. Compared to the net subsidy policy, less subsidies are subtracted.
Correspondingly, the incentive to postpone clearcutting (a decrease in interest cost on the
stand value) is somewhat weaker, and the incentive to advance the clearcut (an increase in
interest cost on the bare land value) is stronger.
Under the gross subsidy system ( 0 ), the increase in rotation age is very minor. Because
harvesting causes no subsidy subtractions, carbon pricing does not reduce clearcut net
revenues at all. Moreover, carbon pricing increases bare land value more than under the two
other subsidy systems, and the increase in carbon subsidy revenues at the moment before the
clearcut barely offsets this effect. In short, the choice of subsidy system has a significant
effect on how much an increase in the carbon price lengthens optimal rotation and the
competitiveness of continuous cover forestry.
28
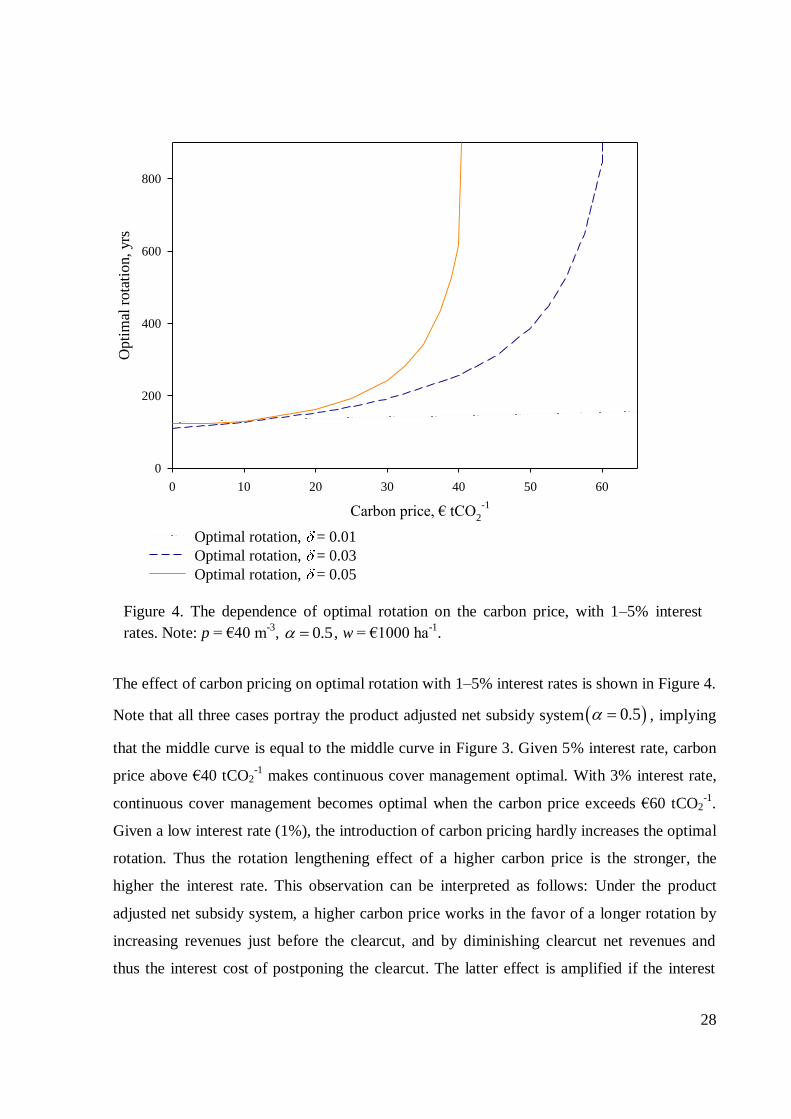
The effect of carbon pricing on optimal rotation with 1–5% interest rates is shown in Figure 4.
Note that all three cases portray the product adjusted net subsidy system 0.5 , implying
that the middle curve is equal to the middle curve in Figure 3. Given 5% interest rate, carbon
price above €40 tCO2-1
makes continuous cover management optimal. With 3% interest rate,
continuous cover management becomes optimal when the carbon price exceeds €60 tCO2-1
.
Given a low interest rate (1%), the introduction of carbon pricing hardly increases the optimal
rotation. Thus the rotation lengthening effect of a higher carbon price is the stronger, the
higher the interest rate. This observation can be interpreted as follows: Under the product
adjusted net subsidy system, a higher carbon price works in the favor of a longer rotation by
increasing revenues just before the clearcut, and by diminishing clearcut net revenues and
thus the interest cost of postponing the clearcut. The latter effect is amplified if the interest
0 10 20 30 40 50 60
0
200
400
600
800
Optimal rotation, = 0.01
Optimal rotation, = 0.03
Optimal rotation, = 0.05
Carbon price, € tCO2
-1
Op
tim
al r
ota
tio
n,
yrs
Figure 4. The dependence of optimal rotation on the carbon price, with 1–5 % interest rates.
Note: p = €40 m-3
, w = 1000Figure 4. The dependence of optimal rotation on the carbon price, with 1–5% interest
rates. Note: p = €40 m-3
, 0.5 , w = €1000 ha-1
.
29
rate is higher. On the other hand, additional income from carbon subsidization also increases
the cost of postponing the future rotations. However, the significance of these future revenues
is reduced by discounting – the more, the higher the interest rate.
Next, we will approach the problem from another direction by studying the comparative
statics of interest rate. We differentiate (16) with respect to interest rate and obtain
( ) ( ) ( ( )) ( )
(1 ) ( ) ( ) ( ) ,c c c
y T g T f x T x T Vp p p p x T p p V
which can by (10) be given as ( )
( ) ( )c
y T Vp p x T V
. (26)
The first term ( ) ( )cp p x T relates to the interest cost on the stand value at the moment
of the clearcut, and it is negative (positive) if stumpage price is higher (lower) than the carbon
subsidy cutback. The second term V is negative if the bare land value is positive. The third
term /V is positive given that an increase in interest rate decreases the bare land
value. The sign of the partial derivative remains a priori indeterminate, and hence it is well
possible that a higher interest rate lengthens optimal rotation. This result is in stark contrast to
the classic Faustmann case, where rotation invariably decreases with interest rate because a
higher interest rate leads to a higher interest cost on the stand value at the moment of the
clearcut (cf. Tahvonen 2015b).
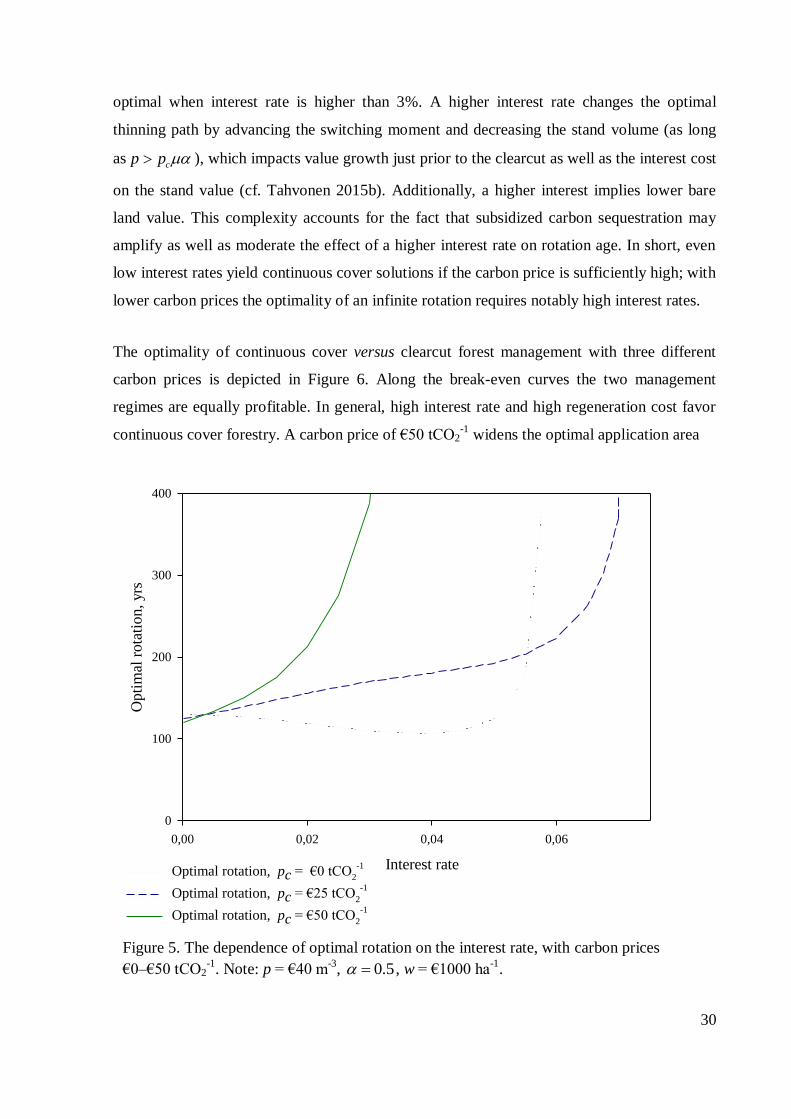
With carbon price set to zero, the optimal rotation age decreases slightly as the interest rate
increases to 4% and starts to increase thereafter, rising sharply after 5% (Figure 5). This is the
case portrayed in Tahvonen (2015b). When the interest rate is sufficiently high, it is optimal
to avoid the investment in artificial regeneration as natural regeneration keeps the stand
growing for free, albeit at a modest pace. Under the product adjusted net subsidy system
( 0.5) and a moderate carbon price ( cp €25 tCO2-1
), the optimal rotation age increases
with interest rate but becomes infinite only when the interest rate is above 7%. If the carbon
price is set higher, as in the third case ( cp €50 tCO2-1
), the optimal rotation age strongly
increases already as the interest rate increases to 2%, and continuous cover management is
30
optimal when interest rate is higher than 3%. A higher interest rate changes the optimal
thinning path by advancing the switching moment and decreasing the stand volume (as long
ascp p ), which impacts value growth just prior to the clearcut as well as the interest cost
on the stand value (cf. Tahvonen 2015b). Additionally, a higher interest implies lower bare
land value. This complexity accounts for the fact that subsidized carbon sequestration may
amplify as well as moderate the effect of a higher interest rate on rotation age. In short, even
low interest rates yield continuous cover solutions if the carbon price is sufficiently high; with
lower carbon prices the optimality of an infinite rotation requires notably high interest rates.
The optimality of continuous cover versus clearcut forest management with three different
carbon prices is depicted in Figure 6. Along the break-even curves the two management
regimes are equally profitable. In general, high interest rate and high regeneration cost favor
continuous cover forestry. A carbon price of €50 tCO2-1
widens the optimal application area
0,00 0,02 0,04 0,06
0
100
200
300
400
Optimal rotation, pc = €0 tCO2
-1
Optimal rotation, pc = €25 tCO2
-1
Optimal rotation, pc = €50 tCO2
-1
Figure 5. The dependence of optimal rotation on the interest rate, with carbon prices
€0– €50tCO2
-1. Note: p = €40 m
-3, = 0.7, w = 1000.
Op
tim
al r
ota
tio
n,
yrs
Interest rate
Figure 5. The dependence of optimal rotation on the interest rate, with carbon prices
€0–€50 tCO2-1
. Note: p = €40 m-3
, 0.5 , w = €1000 ha-1
.
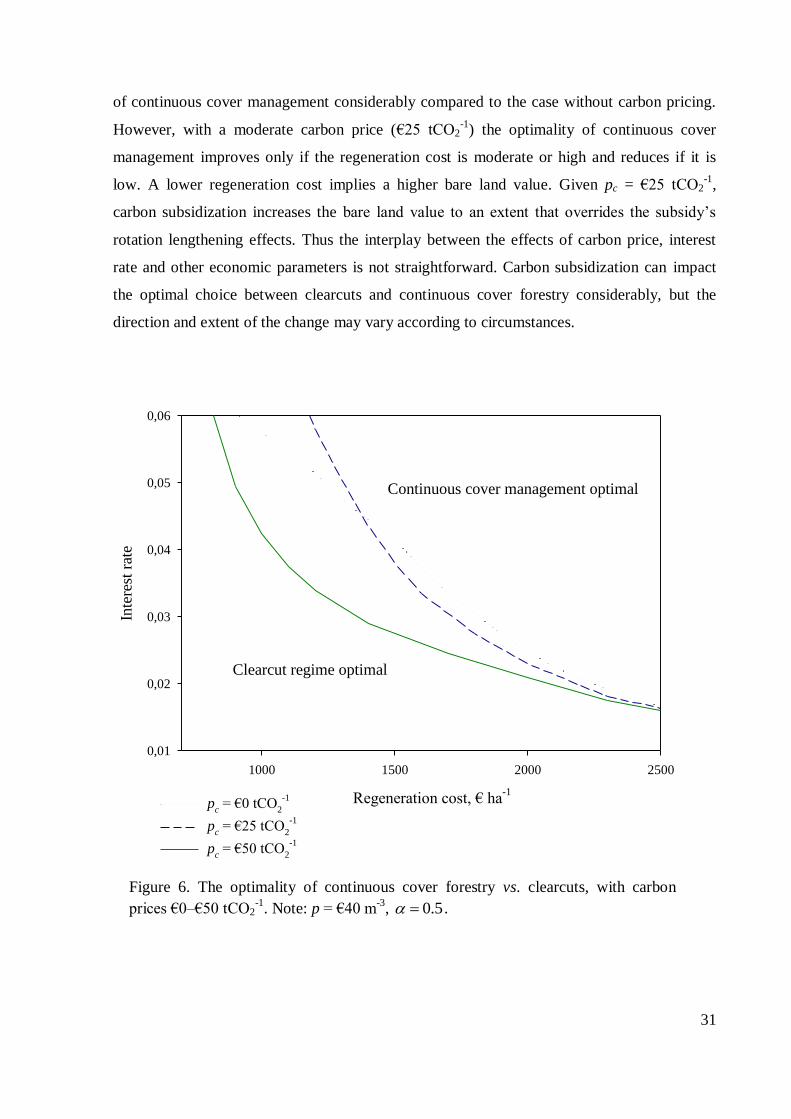
31
of continuous cover management considerably compared to the case without carbon pricing.
However, with a moderate carbon price (€25 tCO2-1
) the optimality of continuous cover
management improves only if the regeneration cost is moderate or high and reduces if it is
low. A lower regeneration cost implies a higher bare land value. Given pc = €25 tCO2-1
,
carbon subsidization increases the bare land value to an extent that overrides the subsidy’s
rotation lengthening effects. Thus the interplay between the effects of carbon price, interest
rate and other economic parameters is not straightforward. Carbon subsidization can impact
the optimal choice between clearcuts and continuous cover forestry considerably, but the
direction and extent of the change may vary according to circumstances.
1000 1500 2000 2500
Inte
rest
rat
e
0,01
0,02
0,03
0,04
0,05
0,06
pc = €25 tCO
2
-1
pc = €0 tCO
2
-1
pc = €50 tCO
2
-1
Regeneration cost, € ha-1
Figure 6. The optimality of continuous cover forestry vs. clearcuts, with carbon prices
€0 – €50 tCO2
-1. Note: p = €40 m
-3,
Continuous cover management optimal
Clearcut regime optimal
Figure 6. The optimality of continuous cover forestry vs. clearcuts, with carbon
prices €0–€50 tCO2-1
. Note: p = €40 m-3
, 0.5 .
32
Supply of carbon storage and wood
One possibility to describe the supply of carbon storage is to specify the average amount of
carbon stored in the stand as a function of carbon price. When clearcutting is optimal, the
average carbon stock over a rotation is
1
1
0,
c c
c
t p T
c
c
t
p
px t x
T
d t p dt
p
t . (27)
In the case of continuous cover solutions, i.e. infinitely long rotations, we are looking for the
optimal long-term carbon storage. As seen from (A2), (20) and (21), the assumptions on the
aging function g imply that the stand approaches a steady state as t approaches infinity. Thus
we can approximate the steady state carbon storage by evaluating the amount of carbon
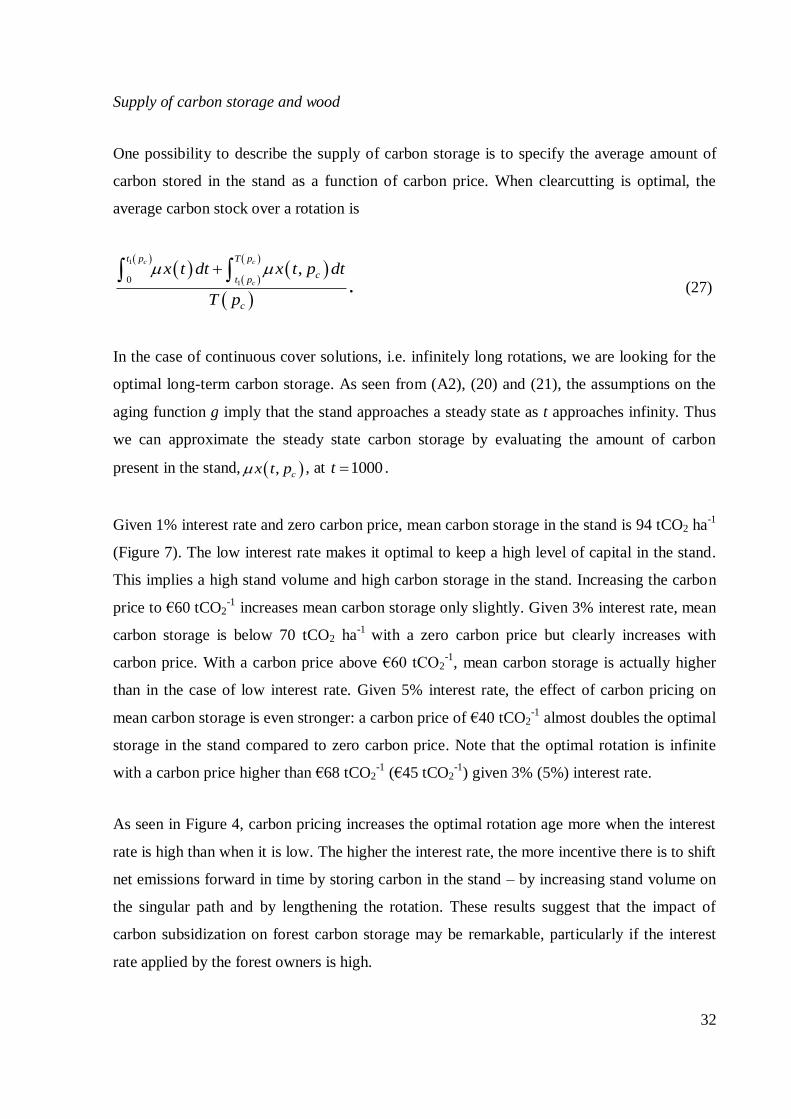
present in the stand, , cx t p , at 1000t .
Given 1% interest rate and zero carbon price, mean carbon storage in the stand is 94 tCO2 ha-1
(Figure 7). The low interest rate makes it optimal to keep a high level of capital in the stand.
This implies a high stand volume and high carbon storage in the stand. Increasing the carbon
price to €60 tCO2-1
increases mean carbon storage only slightly. Given 3% interest rate, mean
carbon storage is below 70 tCO2 ha-1
with a zero carbon price but clearly increases with
carbon price. With a carbon price above €60 tCO2-1
, mean carbon storage is actually higher
than in the case of low interest rate. Given 5% interest rate, the effect of carbon pricing on
mean carbon storage is even stronger: a carbon price of €40 tCO2-1
almost doubles the optimal
storage in the stand compared to zero carbon price. Note that the optimal rotation is infinite
with a carbon price higher than €68 tCO2-1
(€45 tCO2-1
) given 3% (5%) interest rate.
As seen in Figure 4, carbon pricing increases the optimal rotation age more when the interest
rate is high than when it is low. The higher the interest rate, the more incentive there is to shift
net emissions forward in time by storing carbon in the stand – by increasing stand volume on
the singular path and by lengthening the rotation. These results suggest that the impact of
carbon subsidization on forest carbon storage may be remarkable, particularly if the interest
rate applied by the forest owners is high.
33
Under carbon subsidization, the goal of a forest owner is to maximize the combined net
present revenues from timber production and carbon storage. We have shown that carbon
pricing changes the optimal thinning solution and rotation age, which in turn influences wood
production. To study the impacts of carbon subsidies on annual wood supply from a stand, we
write the mean amount of wood harvested over a rotation as a function of carbon price:
1
, ,c
c
T p
c c cp
c
th t p dt x T p p
T p
. (28)
In the case of continuous cover solutions, we approximate the steady state harvest rate by
evaluating , ch t p at 1000t .
Carbon price, € tCO2
-10 20 40 60
Mea
n c
arb
on
sto
rage
in t
he
stan
d,
tCO
2 h
a-1
20
40
60
80
100
120
= 0.01
= 0.03
= 0.05
Figure 7. Mean carbon storage in the stand as a function of carbon price, with 1–5% interest
rates. Note: p = €40 m-3, = 0.7, w = 1000.
Figure 7. Mean carbon storage in the stand as a function of carbon price, with 1–5%
interest rates. Note: p = €40 m-3
, 0.5 , w = €1000 ha-1
.
34
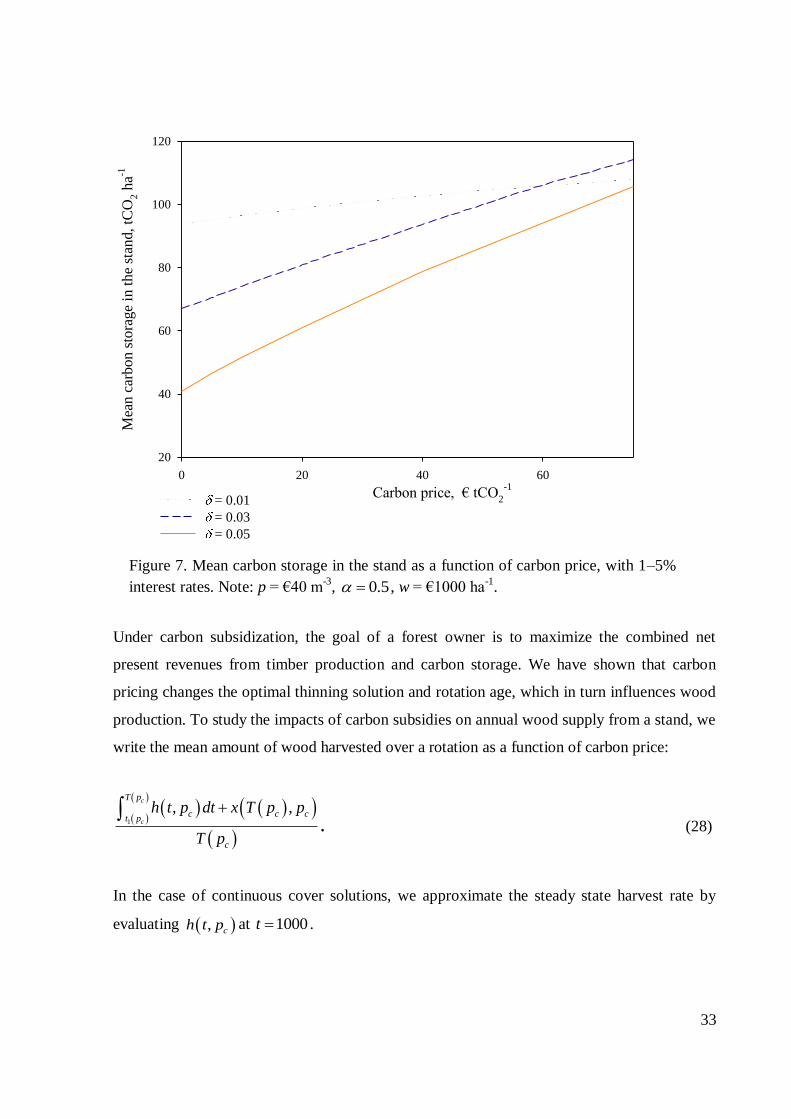
Figure 8 shows the effect of carbon price on the mean annual wood supply with three interest
rates. Given zero carbon price and 1% interest rate, the mean annual wood supply is as high as
6.9 m-3
. The low interest rate makes it optimal to reach a high stand volume and thus high
thinning yields (recall that if ,cp p then ( ) 0f x ). A higher interest rate, in turn, favors
advancing net revenues at the cost of yield maximization, implying lower mean annual wood
supply. As explained above, carbon subsidization impacts optimal thinning and rotation the
more, the higher the interest rate. Hence the impact of carbon pricing on the mean annual
wood supply is negligible given 1% interest rate but quite strong given 5% interest rate.
Given a moderate to high interest rate, carbon subsidization changes the mean wood supply
over a rotation through two opposing ways: on one hand it increases optimal stand volume
and thus the yield from thinning, but on the other hand it lengthens the optimal rotation. As
seen from the curves representing the solutions with 3% and 5% interest rates (Figure 8), the
Carbon price, € tCO2
-1
0 20 40 60
Mea
n a
nnual
wood s
upply
, m
3 a
-1 h
a-1
4,5
5,0
5,5
6,0
6,5
7,0
7,5
= 0.01
= 0.03
= 0.05
Figure 8. Mean annual wood supply as a function of carbon price, with 1–5 % interest rates.
Note: p = €40 m-3
, = 0.7, w = 1000.Figure 8. Mean annual wood supply as a function of carbon price, with 1–5% interest
rates. Note: p = €40 m-3
, 0.5 , w = €1000 ha-1
.
35
mean annual wood supply first increases with carbon price and begins to decrease when the
rotation lengthening effect starts to dominate the stand volume increasing effect. However,
the former effect disappears after the optimal management regime switches from clearcuts to
continuous cover. The regime shift is visible as a point of non-differentiability at cp €68
tCO2-1
(€45 tCO2-1
) given 3% (5%) interest rate. Thereafter the mean annual wood supply
increases with carbon price. Based on our results, carbon subsidization is likely to increase
wood supply from a stand, especially with high interest rates.
Optimal solution if only carbon storage matters
There is a theoretical interest to understand the behavior of the model in a case where carbon
price is very high compared to the price of timber. In van Kooten et al. (1995), this special
case is studied in the generic Faustmann framework without thinning and assuming timber
price is zero. Here it can be studied within a generalized setup.
Given 0p , the necessary conditions take the form
if 0, 0cp h , (29a)
if 0, 0,c maxp h h , (29b)
if 0, c maxp h h , (29c)
x cH g t f x p , (30)
0, 0, 0c cT p x T T p x T , (31)
0.
c c
c
p h T p g T f x T
T g t f x T h T p x T V
(32)
36
The switching function is cp . To maintain the singular solution it must hold that
0 . Differentiating with respect to time yields – 0 . Utilizing (30) and then (29b)
yields
(1 ) 0c cp g t f x p , (33)
which can also be given as (1 )
c
c
pf x
p g t
. (34)
As in the case with a strictly positive stumpage price, we set 0 cp . Thus 0 0h ,
implying that it is optimal to jump to a possible singular harvesting path no sooner than at t1
when 1 ct p and 0.f x
Given 0 1 , the singular solution exists if (34) is satisfied with some x x . Following
the singular path to the end of rotation satisfies (31) as an equality, i.e. cT p . Thus
(32) can be given as
0
c c
c c
y T p h T p g T f x T
p g t f x T h T p x T V
implying
(1 ) 0c cy T p g T f x T p x T V . (35)
The only potentially negative term in y(T) is V , meaning that if the bare land value is low
enough, a clearcut will never be optimal. Conversely, if the interest cost on bare land value is
higher than the sum of net subsidy revenues at the moment before clearcut and the interest on
the subsidy substraction caused by clearcutting, clearcutting will be optimal even when the
stumpage price is as low as zero. Such a solution can be reasonable because the early high-
growth years of the stand produce considerable carbon subsidy revenues, and these may
outweigh the subsidy subtraction caused by clearcutting as well as the regeneration cost.
37
If 0 (the gross subsidy system), equation (34) implies that 0f x and ˆx( t ) x on the
singular path. Respectively, ( )h t g t f x . This implies that the harvest rate equals the
stand growth and the stand maintains the growth-maximizing volume. When carbon subsidies
are the sole source of forestry income and harvesting is assumed to cause no release of
carbon, it is optimal to maximize the amount of carbon sequestered by the growing stand.
Note that under the gross subsidy system, the forest owner’s objective is not to maximize the
carbon stored in his forest stand. Instead, he is maximizing the combined carbon storage in the
stand and in harvested trees.
Given 0 , (35) reduces to
0cy T p g T f x T V . (36)
Thus, even when carbon is permanently stored in trees (the gross subsidy system),
clearcutting will never be optimal if the carbon subsidy revenues from thinning always exceed
the interest cost on all future subsidy revenues net of regeneration cost, and vice versa. Note
that when the interest rate is high enough, the bare land value necessarily becomes negative
implying that clearcutting is suboptimal. Since optimal rotation length depends on the interest
rate, the solution does not coincide with the maximum sustained yield solution, even though
thinnings follow the growth maximizing path.
In the net subsidy system the carbon content of harvested volume is released instantly, i.e.
1 . In this case, the equality (33) will never be satisfied and the singular path does not
exist. Hence if 1 , we must choose 0h t t , i.e. 0 is set at a level implying that
(29a) is never violated. This implies that the transversality condition (31) would only be
satisfied if 0x T , which cannot hold, because the volume of the undisturbed stand will be
strictly positive at any 0T . Thus the necessary conditions for a clearcutting solution cannot
be satisfied when 0p and 1 , implying that the remaining optimality candidate is a
solution with no thinning and no clearcut. Thus, the combination of no timber value and
complete carbon release at harvest represents a boundary case where the stand is neither
thinned nor clearcut.
38
3. Size-structured transition matrix model for optimal thinning and rotation
The analysis based on the continuous time biomass model shows that subsidized carbon
storage may have a significant effect on optimal forest management. Carbon subsidies
postpone the start of thinning and increase stand volume. Carbon subsidization typically
lengthens the rotation age and increases the competitiveness of continuous cover management
relative to clearcuts. However, the analytical insight reached by this method comes with a
price. The biomass model omits the internal structure of an uneven-aged forest stand.
Therefore, to see if our results hold also with a more detailed description of forest resources,
we will next numerically apply a size-structured growth model to a similar economic
problem.
3.1 The growth model and the optimization problem
We assume that the stand is artificially regenerated after a clearcut, and the time interval
between the regeneration activities and the ingrowth of trees into the smallest size class equals
some number of periods denoted by 0t . Thus, 0t periods after the artificial regeneration, we
have an initial stand composed of a given number of trees in size class 1. The stand is clearcut
if the rotation length 0T t , is finite. We denote the number of trees in size class s at the
beginning of period t by 0, 1,2,..., , ,...,stx s n t t T . Accordingly, the stand state at period
t can be given as 1 2, , ,t t t ntx x xx . Let us denote the fraction of trees moving to size class
1s at period t by , 1,2,...,s t s n x , and the natural mortality in size class s at period t
by , 1,2,...,s t s n x . Thus the fraction of trees staying in the same size class equals
1 , 1,2,...,s t s t s n x x . Ingrowth, i.e. new small trees, at the beginning of period t
is denoted by t x . Additionally, we denote the number of trees harvested from size class s
at the end of period t by 01,2,..., , ,...,, 1st s n t t Th . Hence, following Getz and Haight
(1989, p. 237–239), the stand development can be described by the difference equations
39
1, 1 1 1 1 11 ,t t t t t tx x h x x x (37)
1, 1 1 1 1, 1,1 , 1,2,...,n 2,s t s t st s t s t s t s tx x x h s x x x (38)
, 1 1 1, 1 ,n t n t n t n t nt ntx x x h x x (39)
where 0 ,...,t t T .
In Chapter 2 of the present study, the Kilkki-Väisänen-Clark biomass harvesting and rotation
model was applied with natural regeneration included. That model mimics the size-structured
dynamics given by (38)–(40).6
As with the biomass model, we maximize the present value of net revenues from the next and
all future rotations by utilizing the formula for the sum of geometric series. The optimized
variables are the number of harvested trees from each size class, sth , and the possible
clearcutting period, T. Following the setup in the first part of the thesis, the harvesting
revenues at period t are expressed using stumpage prices for sawlog and pulpwood:
0, ,
1
1,2,..., , ,., ..,n
t saw saw s pulp pulp s st
s
R p v p v h s n t t T
, (40)
where ,saw sv denotes the site index specific volume of sawlog in a tree of size class s. Let us
denote the discount factor by 1/ (1 )b , where refers to the annual interest rate. The
length (in years) of a period is denoted by parameter . In the previous part of this study, we
assumed that the stumpage prices in thinnings and clearcuts are equal, which is reasonable if
thinning targets only the largest trees of the stand whereas a clearcut removes the small trees
in addition to the large ones. However, harvesting costs might be lower in clearcuts also
because of economies of scale. This in mind, we use parameter 1 for taking into account
6 In contrast, the original KVC-model assumes no natural regeneration, which corresponds to the size-structured
framework with no ingrowth, i.e. 0 .
40
that stumpage prices in clearcuts may exceed those in thinning. We denote the cost of
artificial regeneration by w. Based on Tahvonen (2015a), the objective function without
carbon subsidization can be given as
0
1( 1) ( 1)
( 1),
max1st
Tt T
t T
t t
Th T
N
w b
P
R R b
Vb
(41)
s.t. (37), (38), (39) and
00, 0, 1,2,..., , ,...,st sth x s n t t T , (42)
,0sx given. (43)
As in Chapter 2, the optimal forest management regime is determined by the choice of T. If –
given optimized thinnings – the objective function is maximized by a finite rotation age,
clearcut management is optimal. If no finite optimal rotation age exists, it is optimal to apply
continuous cover management.
In the most general carbon subsidy setting, the society pays subsidies according to the amount
of CO2 that is absorbed as the stand grows, and charges economic agents for the amount of
carbon that is released as a consequence of harvesting and subsequent product decay, and
natural mortality. The carbon content of a wood unit is denoted by (tCO2 m-3
) and the
carbon price by cp (€ tCO2-1
). As mentioned in Chapter 2.1, logging will not instantly release
the carbon content of wood into the atmosphere because it is only gradually released from
wood products as they decay (Pihlainen et al. 2014). We denote the decay rate of a wood
assortment i ( ,i saw pulp ) by ig and the harvested amount by iY . The carbon stock in timber
products at moment , ( )iC , decreases according to
( ) ig
i iC Ye
. (44)
41
The increase in atmospheric carbon stock equals
( ) ig
i iA Y Ye
, (45)
implying that the emission level at moment equals
( )ig
i
dAg Ye
d
. (46)
The economic present value of emissions occurring at can be given as
( ) ig
c iE p g Y e e . (47)
Thus the present value of emissions over an infinite time horizon equals
( )
0
ig
c i iEPV p Y g e d
, (48)
( ) 0
0
1 1ig i
c i i c i i c i
i i i
gEPV p Y g e d p Y g e e p Y
g g g
.
Hence, per unit of timber assortment i, the present value of emissions due to product decay
can be given as
ii
i
g
g
, (49)
showing that it depends on the interest rate. Correspondingly, after the death of a tree, the
dead wood is gradually decomposed according to its decay rate mg (Pihlainen et al. 2014),
implying
mm
m
g
g
. (50)
42
Let , , ,1( )saw s pult p s s t
n
sv v x
denote stand volume in the beginning of period t. To
describe the net carbon sequestration during a period, we multiply by the period’s net
volume growth. Net volume growth, in turn, equals the increase in stand volume before
mortality and harvesting, net of the discounted future volume losses due to decay. We denote
the volume of sawlog and pulpwood harvested at the end of period t by
, 1 ,saw
n
saw t s s stv hy
and , 1 ,pulp s
n
pulp t s stv hy
,
respectively. In addition, we denote the volume of dead wood formed in period t by
, , ,,1( )saw s pulp s
n
t ts s ts tv v xm
x .
Thus carbon subsidies at t, paid at the end of the period, can be given as
1 , ,1 1 1 ,t c t t m t saw saw t pulp pulp tQ p m y y (51)
where 0 ,...,t t T . Here we call such a formulation of carbon payments the product adjusted
net subsidy (net subsidy in Pihlainen et al. 2014). This formulation is more detailed than the
one applied in van Kooten et al. (1995) and in the biomass model in Chapter 2 of this thesis.
We will concentrate most of our analysis on this subsidy system.
However, as discussed in Chapter 2.1, the society may acknowledge exclusively the carbon
stored in the forest stand and thus wish to subsidize only the increase in stand volume net of
any removals. In this case, the society sets 1saw pulp m (the net subsidy system). On
the other hand, the society may choose to assume that no carbon is released from harvested
wood, i.e. set 0i (the gross subsidy system).
Regardless of subsidy system, we also consider the carbon sequestration that takes place
during the planting delay, i.e. the amount of carbon stored in the initial stand at the beginning
of period 0t t . The corresponding carbon subsidy, given as 00 cQ p , is discounted to the
moment of regeneration. The objective function with subsidized carbon sequestration now
takes the form
43
0
0
1( 1) ( 1) ( 1)
0
( 1),
( )
max1st
Tt t T T
t t T T
t t
Th T
w Q b R Q b R b Q b
VNb
P
(52)
s.t. (37), (38), (39), (42) and (43). We optimize forest management under the three different
subsidy systems presented above: the product adjusted net subsidy system, the net subsidy
system, and the gross subsidy system.
3.2 Ecological and economic parameter values
We apply a growth model by Bollandsås et al. (2008). The study includes functions for
ingrowth, mortality and diameter increment for Norway spruce, Scots pine, birch and other
broadleaves under natural regeneration and uneven-aged structure. In the present study we
apply the functions for pure Norway spruce stands at three different site types, all at the
latitude of 61.9 ºN. At site SI = 11 the height of the dominant trees at the age of 40 (100) years
is 11 (21) meters. The corresponding figures are 15 (24) meters at site SI = 15 and 19.5 (30) at
site SI = 19.5. We use 12 size classes with diameters (midpoints) ranging from 7.5 cm to 62.5
cm with 5.0 cm intervals. The initial stand structure is given as x = [2000, 0, 0, …], i.e. after
artificial regeneration and the planting delay, 2000 trees will emerge in the smallest size class.
The length of a period is five years and the planting delays are 25, 20 and 15 years for SI =
11, SI = 15 and SI = 19.5, respectively.
The estimated natural mortality during the 5-year period t in size class s is given as
15 22.492 0.020 3.210 0.031
1st
s s td de
,
where sd is the diameter (midpoint) of size class s and tB the total stand basal area (m2 ha
-1)
in the beginning of period t . The estimated number of trees entering the smallest size class
during the 5-year period t is given as
0.3680.1
0.018 0.06
57
0 6.3911
54.563
t
t
t B SI
B a SI
e
.
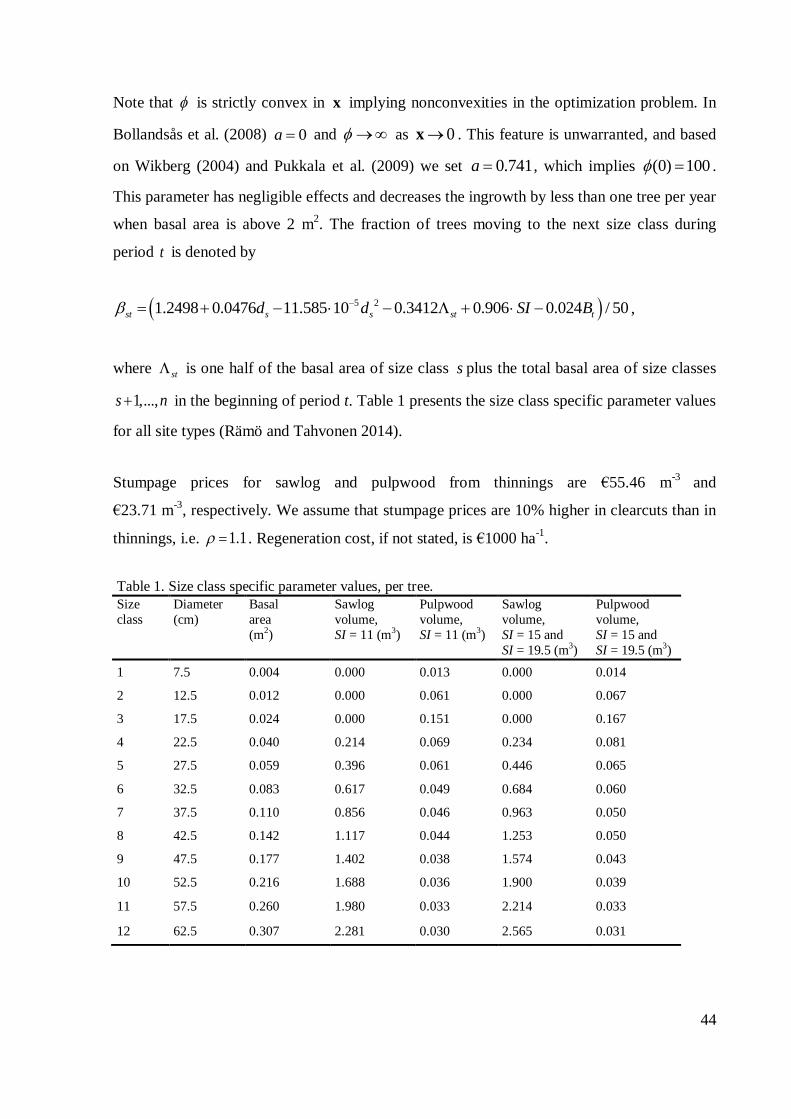
44
Note that is strictly convex in x implying nonconvexities in the optimization problem. In
Bollandsås et al. (2008) 0a and as 0x . This feature is unwarranted, and based
on Wikberg (2004) and Pukkala et al. (2009) we set 0.741a , which implies (0) 100 .
This parameter has negligible effects and decreases the ingrowth by less than one tree per year
when basal area is above 2 m2. The fraction of trees moving to the next size class during
period t is denoted by
5 20.0476 11.585 10 0.906 0.0241.2498 0.34 / 5012st s s st td d SI B ,
where st is one half of the basal area of size class s plus the total basal area of size classes
1,...,s n in the beginning of period t. Table 1 presents the size class specific parameter values
for all site types (Rämö and Tahvonen 2014).
Stumpage prices for sawlog and pulpwood from thinnings are €55.46 m-3
and
€23.71 m-3
, respectively. We assume that stumpage prices are 10% higher in clearcuts than in
thinnings, i.e. 1.1 . Regeneration cost, if not stated, is €1000 ha-1
.
Table 1. Size class specific parameter values, per tree.
Size
class
Diameter
(cm)
Basal
area
(m2)
Sawlog
volume,
SI = 11 (m3)
Pulpwood
volume,
SI = 11 (m3)
Sawlog
volume,
SI = 15 and
SI = 19.5 (m3)
Pulpwood
volume,
SI = 15 and
SI = 19.5 (m3)
1 7.5 0.004 0.000 0.013 0.000 0.014
2 12.5 0.012 0.000 0.061 0.000 0.067
3 17.5 0.024 0.000 0.151 0.000 0.167
4 22.5 0.040 0.214 0.069 0.234 0.081
5 27.5 0.059 0.396 0.061 0.446 0.065
6 32.5 0.083 0.617 0.049 0.684 0.060
7 37.5 0.110 0.856 0.046 0.963 0.050
8 42.5 0.142 1.117 0.044 1.253 0.050
9 47.5 0.177 1.402 0.038 1.574 0.043
10 52.5 0.216 1.688 0.036 1.900 0.039
11 57.5 0.260 1.980 0.033 2.214 0.033
12 62.5 0.307 2.281 0.030 2.565 0.031
45
Following Niinimäki et al. (2013), the carbon content of a wood unit, , is obtained by
multiplying the wood density factor of stemwood for Norway spruce (0.4 tonnes of dry matter
per cubic metre of fresh volume) with the share of carbon in biomass dry weight (0.5) and the
coefficient that converts tonnes of carbon to tonnes of CO2 (44/12). Thus we set 0.733
tCO2 m-3
. For the decay rate of dead wood we use the average value for boles of diameter
sizes 13 cm, 25 cm and 50 cm, i.e. gm = 0.05467 (Hyvönen and Ågren 2001). To obtain the
decay rates for sawlog and pulpwood we use data presented in Liski et al. (2001) on the
division of sawlog and pulpwood removals for production lines, and on the division within
these production lines into wood product lines with different life-spans. The obtained
parameter values are gsaw = 0.031383 and gpulp = 0.34832.
3.3 Numerical optimization method
This discrete time optimal control problem is solved as a large scale non-linear programming
problem applying Karush-Kuhn-Tucker theorem and Knitro optimization software (version
9.1). The software applies e.g. an advanced gradient-based interior point algorithm (Byrd et
al. 1999, 2006). We optimize harvests with each given rotation period, and increase the
rotation period to find the one that maximizes the value of the objective function. If the value
of the objective function keeps on increasing as the rotation period lengthens, the optimal
rotation is infinite and a continuous cover solution becomes optimal. The optimization codes
are given in Appendices 1–3.
3.4 Results
Optimal thinning and rotation
We first present the results for the average productivity site (SI = 15) under the product
adjusted net subsidy system. The optimal harvesting solutions, mean annual volume yields
and monetary revenues as well as the net present values for interest rates 1–3% and carbon
prices €0–€60 tCO2-1
are presented in Table 2. Optimal rotation age increases with interest
rate. With an annual interest rate of 1%, the rotation length without carbon pricing equals 145
years; with an interest rate of 2%, it is 175 years. With an annual interest rate of 3% or higher,
the optimal rotation is infinite regardless of carbon price. When the interest rate is higher, it is
46
optimal to postpone or avoid the investment in artificial regeneration, as natural regeneration
maintains a sufficient growth without costs. Additionally, the time delay between stand
regeneration and the first revenues from thinnings becomes costly when discounting is
heavier. Because of the strong effect of interest rate, the impact of carbon pricing on optimal
rotation age is only visible in the 1% and 2% interest rate cases, where the optimal rotation is
the longer, the higher the carbon price.
To study the effect of carbon pricing on the optimality of clearcuts versus continuous cover
forestry we will concentrate on the case of 2% interest rate, where carbon pricing causes a
management regime shift. With carbon price set to zero, it is optimal to clearcut the stand
when it is 175 years old, producing a mean annual total (sawlog) yield of 6.6 m3 ha
-1 (5.5 m
3
ha-1
) and a net present value of €8827 ha-1
. The notably long rotation age follows from
optimally utilizing natural regeneration during the rotation. When carbon price equals €20
tCO2-1
, the optimal rotation age is infinite, implying that continuous cover forestry is superior
to clearcutting. At the continuous cover steady state the annual total yield is 5.9 m3 ha
-1 which
is slightly lower than in the clearcut solution with zero carbon price. However, the annual
sawlog yield 5.4 m3 ha
-1 is almost the same as in the latter. The decrease in timber income is
more than compensated by the carbon subsidies, leading to a net present value of €11192 ha-1
.
A carbon price of €40 tCO2-1
also yields a continuous cover solution and a net present value
of €13653 ha-1
. Increasing the carbon price to €60 tCO2-1
further strengthens the
predominance of sawlog in the continuous cover steady state harvest (5.5 m3 ha
-1 of the total
5.9 m3 ha
-1) and raises the net present value to €16170 ha
-1.
Optimal thinning is invariably done from above, always fully cutting down the largest
harvested size class. The reason for this is threefold. Large trees yield mostly sawlog, which
has a notably higher stumpage price than pulpwood. The relative value growth is very high in
small trees, implying that it is optimal to postpone harvesting until they have grown bigger.
Additionally, ingrowth is the most important growth-limiting factor in boreal ecological
models, making thinning from below unreasonable.
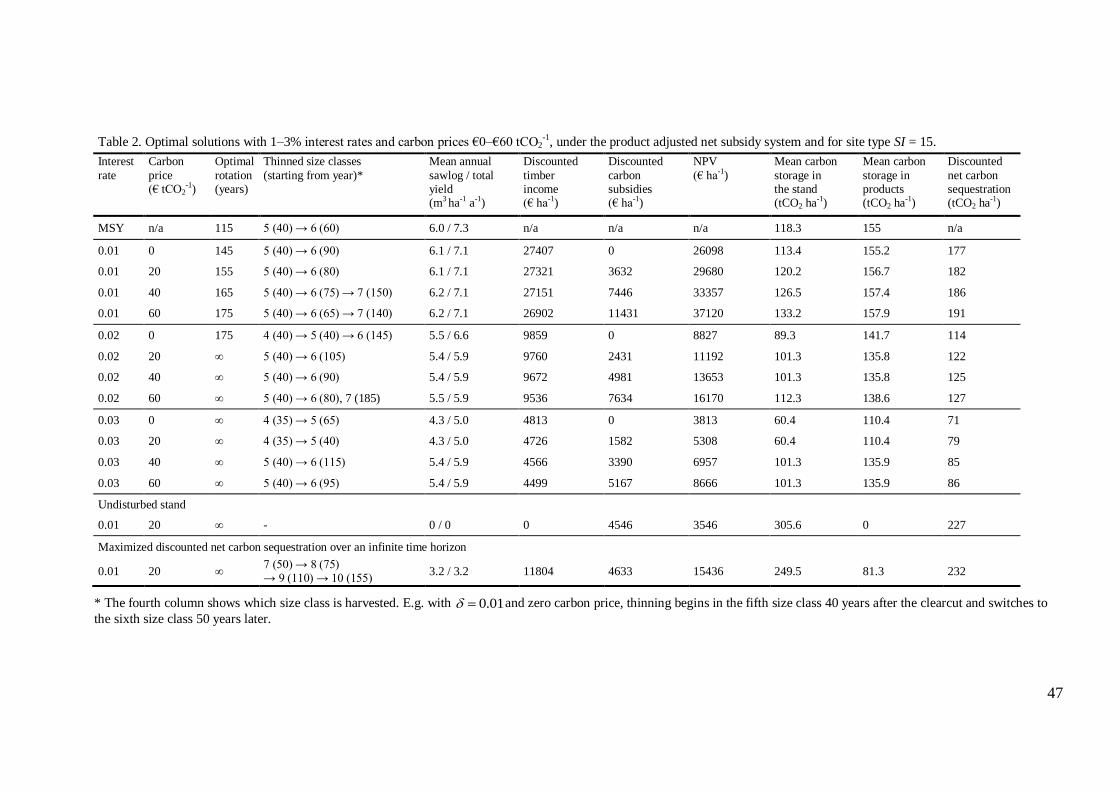
47
Table 2. Optimal solutions with 1–3% interest rates and carbon prices €0–€60 tCO2-1, under the product adjusted net subsidy system and for site type SI = 15.
Interest
rate
Carbon
price (€ tCO2
-1)
Optimal
rotation (years)
Thinned size classes
(starting from year)*
Mean annual
sawlog / total yield (m3 ha-1 a-1)
Discounted
timber income (€ ha-1)
Discounted
carbon subsidies (€ ha-1)
NPV
(€ ha-1)
Mean carbon
storage in the stand (tCO2 ha-1)
Mean carbon
storage in products (tCO2 ha-1)
Discounted
net carbon sequestration (tCO2 ha-1)
MSY n/a 115 5 (40) → 6 (60) 6.0 / 7.3 n/a n/a n/a 118.3 155 n/a
0.01 0 145 5 (40) → 6 (90) 6.1 / 7.1 27407 0 26098 113.4 155.2 177
0.01 20 155 5 (40) → 6 (80) 6.1 / 7.1 27321 3632 29680 120.2 156.7 182
0.01 40 165 5 (40) → 6 (75) → 7 (150) 6.2 / 7.1 27151 7446 33357 126.5 157.4 186
0.01 60 175 5 (40) → 6 (65) → 7 (140) 6.2 / 7.1 26902 11431 37120 133.2 157.9 191
0.02 0 175 4 (40) → 5 (40) → 6 (145) 5.5 / 6.6 9859 0 8827 89.3 141.7 114
0.02 20 ∞ 5 (40) → 6 (105) 5.4 / 5.9 9760 2431 11192 101.3 135.8 122
0.02 40 ∞ 5 (40) → 6 (90) 5.4 / 5.9 9672 4981 13653 101.3 135.8 125
0.02 60 ∞ 5 (40) → 6 (80), 7 (185) 5.5 / 5.9 9536 7634 16170 112.3 138.6 127
0.03 0 ∞ 4 (35) → 5 (65) 4.3 / 5.0 4813 0 3813 60.4 110.4 71
0.03 20 ∞ 4 (35) → 5 (40) 4.3 / 5.0 4726 1582 5308 60.4 110.4 79
0.03 40 ∞ 5 (40) → 6 (115) 5.4 / 5.9 4566 3390 6957 101.3 135.9 85
0.03 60 ∞ 5 (40) → 6 (95) 5.4 / 5.9 4499 5167 8666 101.3 135.9 86
Undisturbed stand
0.01 20 ∞ - 0 / 0 0 4546 3546 305.6 0 227
Maximized discounted net carbon sequestration over an infinite time horizon
0.01 20 ∞ 7 (50) → 8 (75) → 9 (110) → 10 (155)
3.2 / 3.2 11804 4633 15436 249.5 81.3 232
* The fourth column shows which size class is harvested. E.g. with 0.01 and zero carbon price, thinning begins in the fifth size class 40 years after the clearcut and switches to
the sixth size class 50 years later.
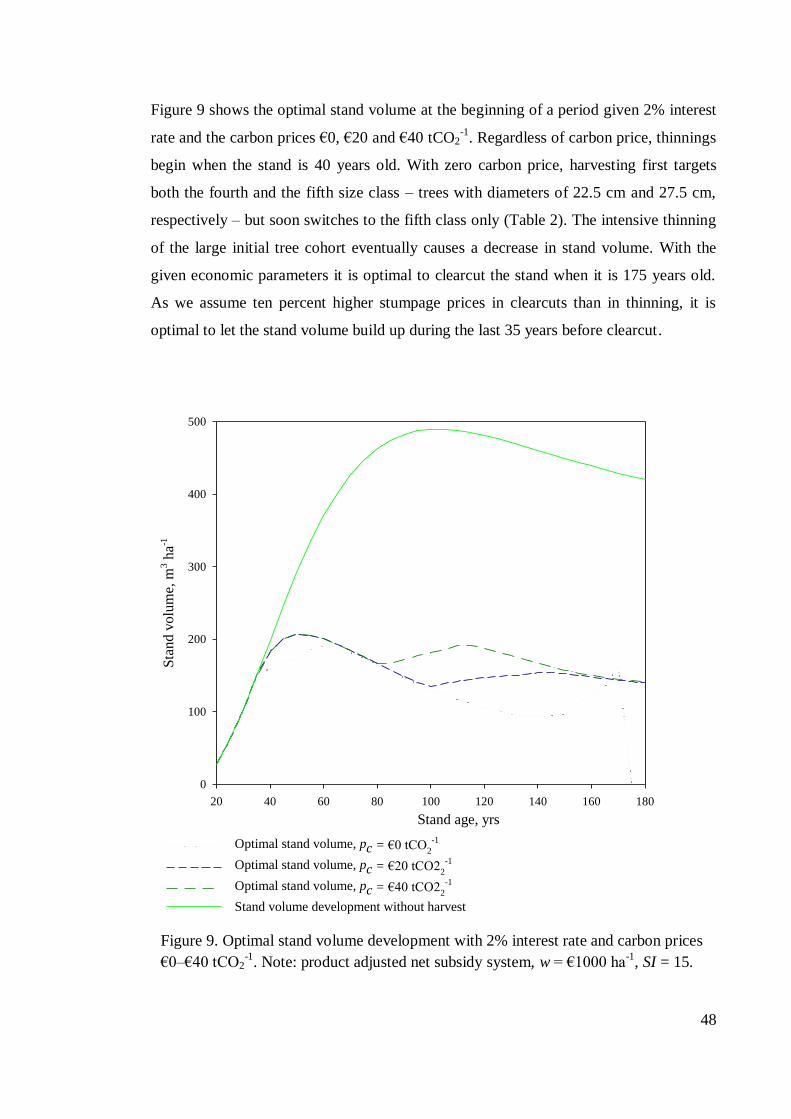
48
Figure 9 shows the optimal stand volume at the beginning of a period given 2% interest
rate and the carbon prices €0, €20 and €40 tCO2-1
. Regardless of carbon price, thinnings
begin when the stand is 40 years old. With zero carbon price, harvesting first targets
both the fourth and the fifth size class – trees with diameters of 22.5 cm and 27.5 cm,
respectively – but soon switches to the fifth class only (Table 2). The intensive thinning
of the large initial tree cohort eventually causes a decrease in stand volume. With the
given economic parameters it is optimal to clearcut the stand when it is 175 years old.
As we assume ten percent higher stumpage prices in clearcuts than in thinning, it is
optimal to let the stand volume build up during the last 35 years before clearcut.
Stand age, yrs
20 40 60 80 100 120 140 160 180
Sta
nd v
olu
me,
m3 h
a-1
0
100
200
300
400
500
Optimal stand volume, pc = €0 tCO2
-1
Optimal stand volume, pc = €20 tCO22
-1
Optimal stand volume, pc = €40 tCO22
-1
Stand volume development without harvest
Figure 9. Optimal stand volume development with 2 % interest rate and carbon prices
€0 – €40 tCO2
-1. Note: product adjusted net subsidy system, w = €1000 ha
-1, SI = 15.
Figure 9. Optimal stand volume development with 2% interest rate and carbon prices
€0–€40 tCO2-1
. Note: product adjusted net subsidy system, w = €1000 ha-1
, SI = 15.
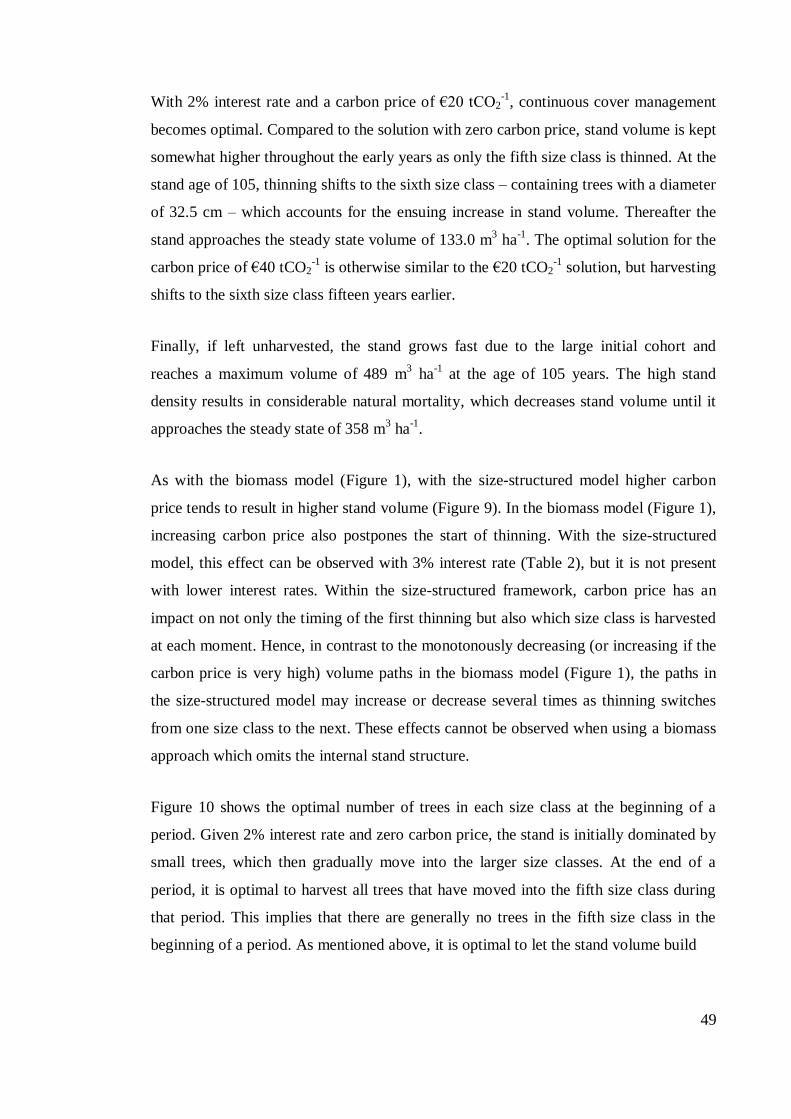
49
With 2% interest rate and a carbon price of €20 tCO2-1
, continuous cover management
becomes optimal. Compared to the solution with zero carbon price, stand volume is kept
somewhat higher throughout the early years as only the fifth size class is thinned. At the
stand age of 105, thinning shifts to the sixth size class – containing trees with a diameter
of 32.5 cm – which accounts for the ensuing increase in stand volume. Thereafter the
stand approaches the steady state volume of 133.0 m3 ha
-1. The optimal solution for the
carbon price of €40 tCO2-1
is otherwise similar to the €20 tCO2-1
solution, but harvesting
shifts to the sixth size class fifteen years earlier.
Finally, if left unharvested, the stand grows fast due to the large initial cohort and
reaches a maximum volume of 489 m3 ha
-1 at the age of 105 years. The high stand
density results in considerable natural mortality, which decreases stand volume until it
approaches the steady state of 358 m3 ha
-1.
As with the biomass model (Figure 1), with the size-structured model higher carbon
price tends to result in higher stand volume (Figure 9). In the biomass model (Figure 1),
increasing carbon price also postpones the start of thinning. With the size-structured
model, this effect can be observed with 3% interest rate (Table 2), but it is not present
with lower interest rates. Within the size-structured framework, carbon price has an
impact on not only the timing of the first thinning but also which size class is harvested
at each moment. Hence, in contrast to the monotonously decreasing (or increasing if the
carbon price is very high) volume paths in the biomass model (Figure 1), the paths in
the size-structured model may increase or decrease several times as thinning switches
from one size class to the next. These effects cannot be observed when using a biomass
approach which omits the internal stand structure.
Figure 10 shows the optimal number of trees in each size class at the beginning of a
period. Given 2% interest rate and zero carbon price, the stand is initially dominated by
small trees, which then gradually move into the larger size classes. At the end of a
period, it is optimal to harvest all trees that have moved into the fifth size class during
that period. This implies that there are generally no trees in the fifth size class in the
beginning of a period. As mentioned above, it is optimal to let the stand volume build
50
up prior to the clearcut. This is done by first shifting the harvests to target the sixth size
class and then forgoing harvesting entirely during the ten last years, as seen in the
emergence of the fifth and the sixth size class (Figure 10).
With 2% interest rate and a carbon price of €20 tCO2-1
, stand development in the
beginning is largely similar to the case with zero carbon price. However, with a carbon
price of €20 tCO2-1
the thinning effort switches to the sixth size class already at the
stand age of 105 years, as seen from the emergence of the fifth size class (Figure 11).
This effectively increases stand volume and thus the amount of carbon stored in the
stand. Additionally, the sawlog ratio is higher in larger trees, and taking into account
that the annual decay rate of sawlog is notably lower than that of pulpwood ( 3%
versus 35%), carbon pricing creates an incentive to harvest trees from larger size
classes.
Figure 10. Optimal stand structure development with zero carbon price and 2% interest
rate. Note: product adjusted net subsidy system, w = €1000 ha-1
, SI = 15.
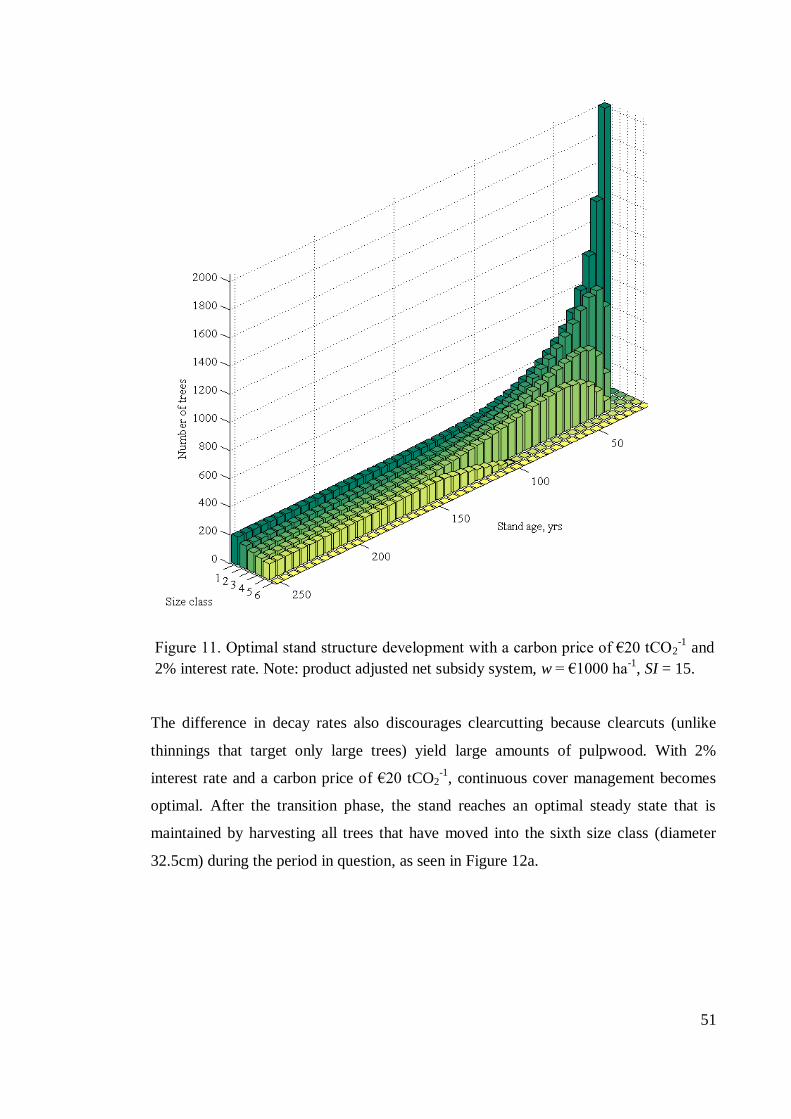
51
The difference in decay rates also discourages clearcutting because clearcuts (unlike
thinnings that target only large trees) yield large amounts of pulpwood. With 2%
interest rate and a carbon price of €20 tCO2-1
, continuous cover management becomes
optimal. After the transition phase, the stand reaches an optimal steady state that is
maintained by harvesting all trees that have moved into the sixth size class (diameter
32.5cm) during the period in question, as seen in Figure 12a.
Figure 11. Optimal stand structure development with a carbon price of €20 tCO2-1
and
2% interest rate. Note: product adjusted net subsidy system, w = €1000 ha-1
, SI = 15.
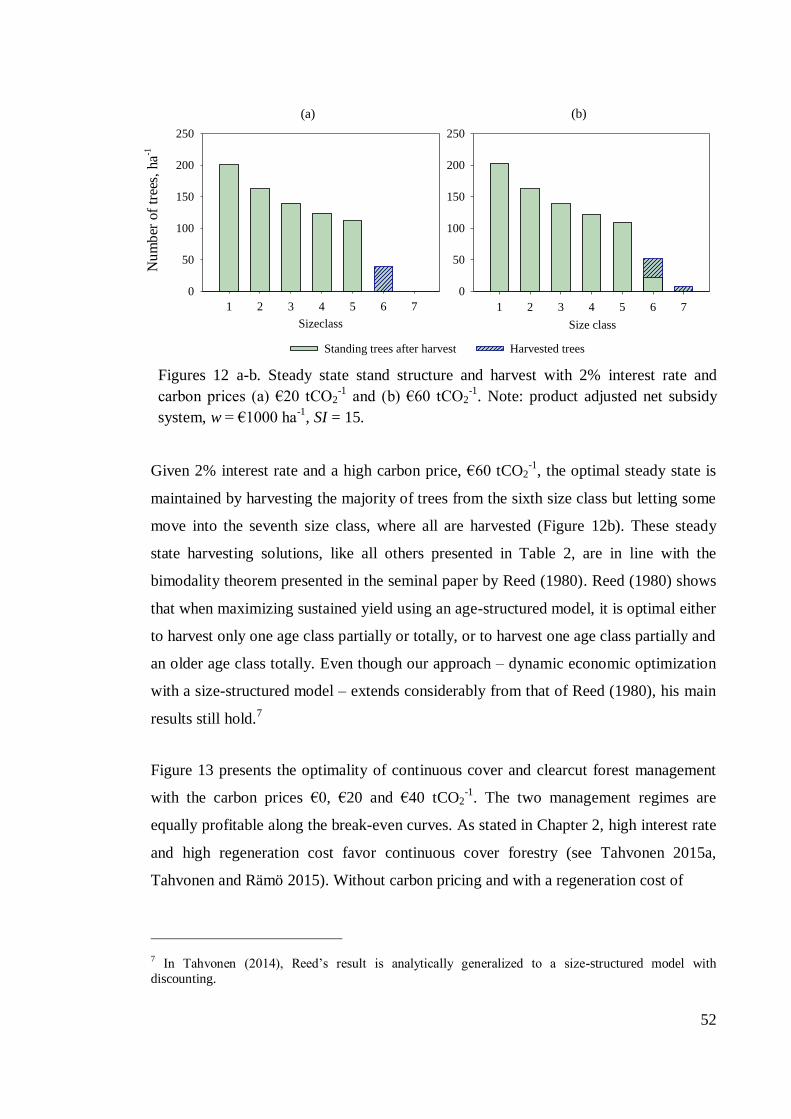
52
Given 2% interest rate and a high carbon price, €60 tCO2-1
, the optimal steady state is
maintained by harvesting the majority of trees from the sixth size class but letting some
move into the seventh size class, where all are harvested (Figure 12b). These steady
state harvesting solutions, like all others presented in Table 2, are in line with the
bimodality theorem presented in the seminal paper by Reed (1980). Reed (1980) shows
that when maximizing sustained yield using an age-structured model, it is optimal either
to harvest only one age class partially or totally, or to harvest one age class partially and
an older age class totally. Even though our approach – dynamic economic optimization
with a size-structured model – extends considerably from that of Reed (1980), his main
results still hold.7
Figure 13 presents the optimality of continuous cover and clearcut forest management
with the carbon prices €0, €20 and €40 tCO2-1
. The two management regimes are
equally profitable along the break-even curves. As stated in Chapter 2, high interest rate
and high regeneration cost favor continuous cover forestry (see Tahvonen 2015a,
Tahvonen and Rämö 2015). Without carbon pricing and with a regeneration cost of
7 In Tahvonen (2014), Reed’s result is analytically generalized to a size-structured model with
discounting.
Size class
1 2 3 4 5 6 7
Nu
mb
er o
f tr
ees
0
50
100
150
200
250
Sizeclass
1 2 3 4 5 6 7
Nu
mb
er o
f tr
ees
0
50
100
150
200
250
Standing trees after harvest Harvested trees
Figures 12 a-b. Steady state stand structure and harvest with 2 % interest rate and carbon prices
(a) €20 tCO2
-1 and (b) €60 tCO
2
-1. Note: product adjusted net subsidy system, w = €1000 ha
-1, SI = 15.
(b)(a)
Figures 12 a-b. Steady state stand structure and harvest with 2% interest rate and
carbon prices (a) €20 tCO2-1
and (b) €60 tCO2-1
. Note: product adjusted net subsidy
system, w = €1000 ha-1
, SI = 15.
Nu
mb
er o
f tr
ees,
ha
-1
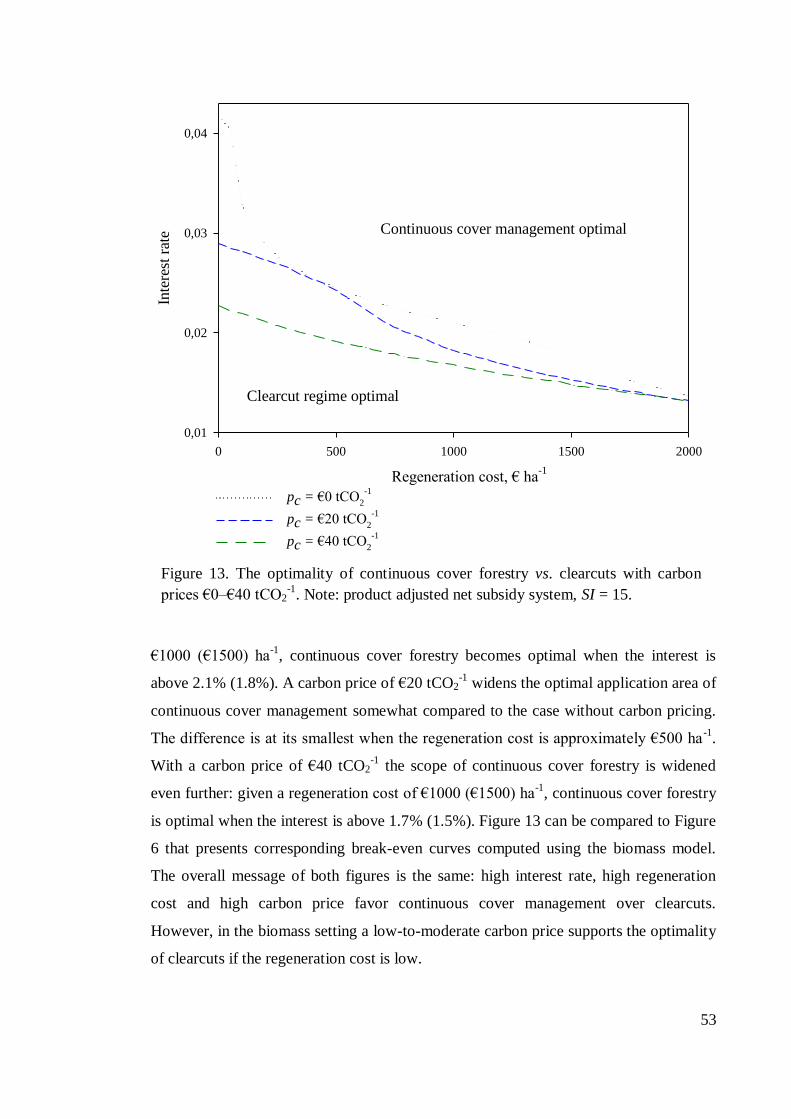
53
€1000 (€1500) ha-1
, continuous cover forestry becomes optimal when the interest is
above 2.1% (1.8%). A carbon price of €20 tCO2-1
widens the optimal application area of
continuous cover management somewhat compared to the case without carbon pricing.
The difference is at its smallest when the regeneration cost is approximately €500 ha-1
.
With a carbon price of €40 tCO2-1
the scope of continuous cover forestry is widened
even further: given a regeneration cost of €1000 (€1500) ha-1
, continuous cover forestry
is optimal when the interest is above 1.7% (1.5%). Figure 13 can be compared to Figure
6 that presents corresponding break-even curves computed using the biomass model.
The overall message of both figures is the same: high interest rate, high regeneration
cost and high carbon price favor continuous cover management over clearcuts.
However, in the biomass setting a low-to-moderate carbon price supports the optimality
of clearcuts if the regeneration cost is low.
Regeneration cost, € ha-1
0 500 1000 1500 2000
Inte
rest
rat
e
0,01
0,02
0,03
0,04
pc = €0 tCO2
-1
pc = €20 tCO2
-1
pc = €40 tCO2
-1
Figure 13. The optimality of continuous cover forestry vs. clearcuts with carbon
prices €0 – €40 tCO2
-1. Note: product adjusted net subsidy system, SI = 15.
Continuous cover management optimal
Clearcut regime optimal
Figure 13. The optimality of continuous cover forestry vs. clearcuts with carbon
prices €0–€40 tCO2-1
. Note: product adjusted net subsidy system, SI = 15.
54
In the maximum sustained yield solution (Table 2), thinning targets first the fifth and
then the sixth size-class, and the stand is clearcut at the age of 115 years. The result is a
mean annual total yield of 7.3 m3 ha
-1. The economic loss caused by following the yield
maximizing principle instead of economic optimization may be up to 28% of the net
present value, depending on interest rate and carbon price. The undisturbed stand
depicts a case where the stand is artificially regenerated and then develops without
harvesting. Given 1% interest rate and a carbon price of €20 tCO2-1
, such a choice will
yield a net present value of €3546 ha-1
.
The solution that maximizes discounted net carbon sequestration represents a case
where the only forestry objective is to abate climate change. To approximate a positive
but low time preference for net emissions, we assume a 1% interest rate. In this case,
continuous cover management is optimal and the steady state is maintained by
harvesting only the trees that have moved into the tenth size class (diameter 52.5 cm).
This results in an annual yield of 3.2 m3 ha
-1, almost all of which is sawlog. Given a
carbon price of €20 tCO2-1
, the net present value amounts to €15436 ha-1
– about half of
the net present value generated under a profit maximization objective.
Optimal carbon storage
Carbon storage in the stand includes the carbon stored both in living and dead trees, and
it follows the development of stand volume (Figures 9, 14 and 15). In economically
optimal solutions, however, natural mortality remains low and hence almost all of the
carbon storage in the stand is in living trees.
Carbon storage in wood products develops according to harvests and decay rates, both
specified separately for sawlog and pulpwood. Clearcutting eliminates the carbon
storage in the stand but causes a strong increase in carbon storage in products (Figure
14). The latter, however, quickly decreases as a consequence of product decay, since
about one third of the yield from the clearcut is pulpwood. The carbon storage in
products accumulates from one rotation to the next, but the accumulation is limited by
exponential decay. As a result, the initial carbon storage in products reaches a steady
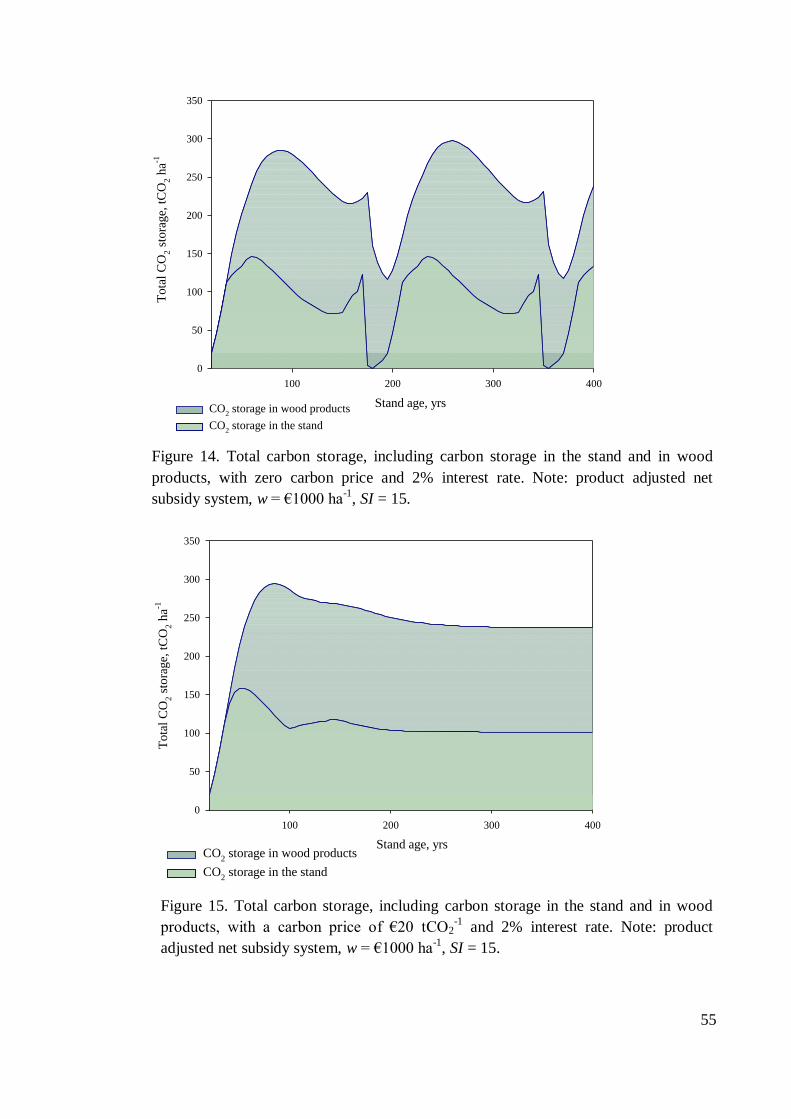
55
100 200 300 400
0
50
100
150
200
250
300
350
CO2 storage in wood products
CO2 storage in the stand
Stand age, yrs
Tota
l C
O2 s
tora
ge,
tC
O2 h
a-1
Figure 14. Total carbon storage, including carbon storage in the stand and in wood products,
with zero carbon price and 2 % interest rate. Note: product adjusted net subsidy system,
w = €1000 ha-1
, SI = 15.
Stand age, yrs
100 200 300 400
Tota
l C
O2 s
tora
ge,
tC
O2 h
a-1
0
50
100
150
200
250
300
350
CO2 storage in wood products
CO2 storage in the stand
Figure 15. Total carbon storage, including carbon storage in the stand and in wood products,
with a carbon price of €20 tCO2
-1and 2 % interest rate. Note: product adjusted net subsidy
system, w = €1000 ha-1
, SI = 15.
Figure 14. Total carbon storage, including carbon storage in the stand and in wood
products, with zero carbon price and 2% interest rate. Note: product adjusted net
subsidy system, w = €1000 ha-1
, SI = 15.
Figure 15. Total carbon storage, including carbon storage in the stand and in wood
products, with a carbon price of €20 tCO2-1
and 2% interest rate. Note: product
adjusted net subsidy system, w = €1000 ha-1
, SI = 15.
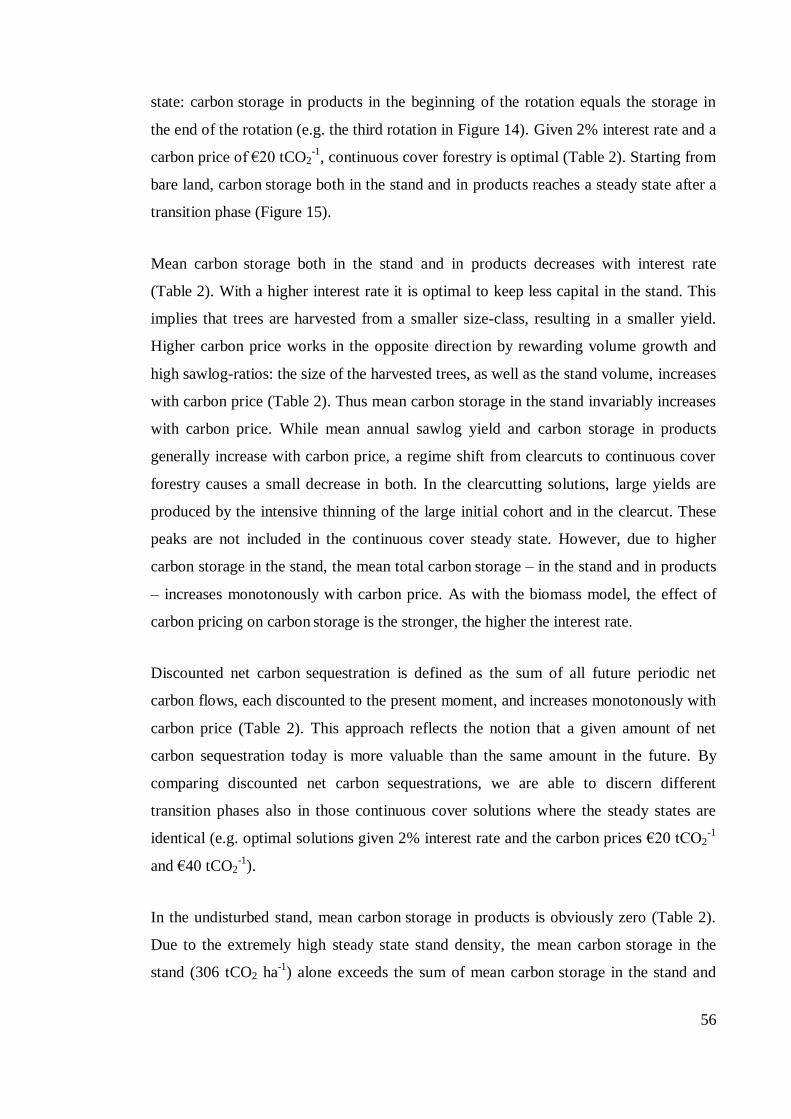
56
state: carbon storage in products in the beginning of the rotation equals the storage in
the end of the rotation (e.g. the third rotation in Figure 14). Given 2% interest rate and a
carbon price of €20 tCO2-1
, continuous cover forestry is optimal (Table 2). Starting from
bare land, carbon storage both in the stand and in products reaches a steady state after a
transition phase (Figure 15).
Mean carbon storage both in the stand and in products decreases with interest rate
(Table 2). With a higher interest rate it is optimal to keep less capital in the stand. This
implies that trees are harvested from a smaller size-class, resulting in a smaller yield.
Higher carbon price works in the opposite direction by rewarding volume growth and
high sawlog-ratios: the size of the harvested trees, as well as the stand volume, increases
with carbon price (Table 2). Thus mean carbon storage in the stand invariably increases
with carbon price. While mean annual sawlog yield and carbon storage in products
generally increase with carbon price, a regime shift from clearcuts to continuous cover
forestry causes a small decrease in both. In the clearcutting solutions, large yields are
produced by the intensive thinning of the large initial cohort and in the clearcut. These
peaks are not included in the continuous cover steady state. However, due to higher
carbon storage in the stand, the mean total carbon storage – in the stand and in products
– increases monotonously with carbon price. As with the biomass model, the effect of
carbon pricing on carbon storage is the stronger, the higher the interest rate.
Discounted net carbon sequestration is defined as the sum of all future periodic net
carbon flows, each discounted to the present moment, and increases monotonously with
carbon price (Table 2). This approach reflects the notion that a given amount of net
carbon sequestration today is more valuable than the same amount in the future. By
comparing discounted net carbon sequestrations, we are able to discern different
transition phases also in those continuous cover solutions where the steady states are
identical (e.g. optimal solutions given 2% interest rate and the carbon prices €20 tCO2-1
and €40 tCO2-1
).
In the undisturbed stand, mean carbon storage in products is obviously zero (Table 2).
Due to the extremely high steady state stand density, the mean carbon storage in the
stand (306 tCO2 ha-1
) alone exceeds the sum of mean carbon storage in the stand and
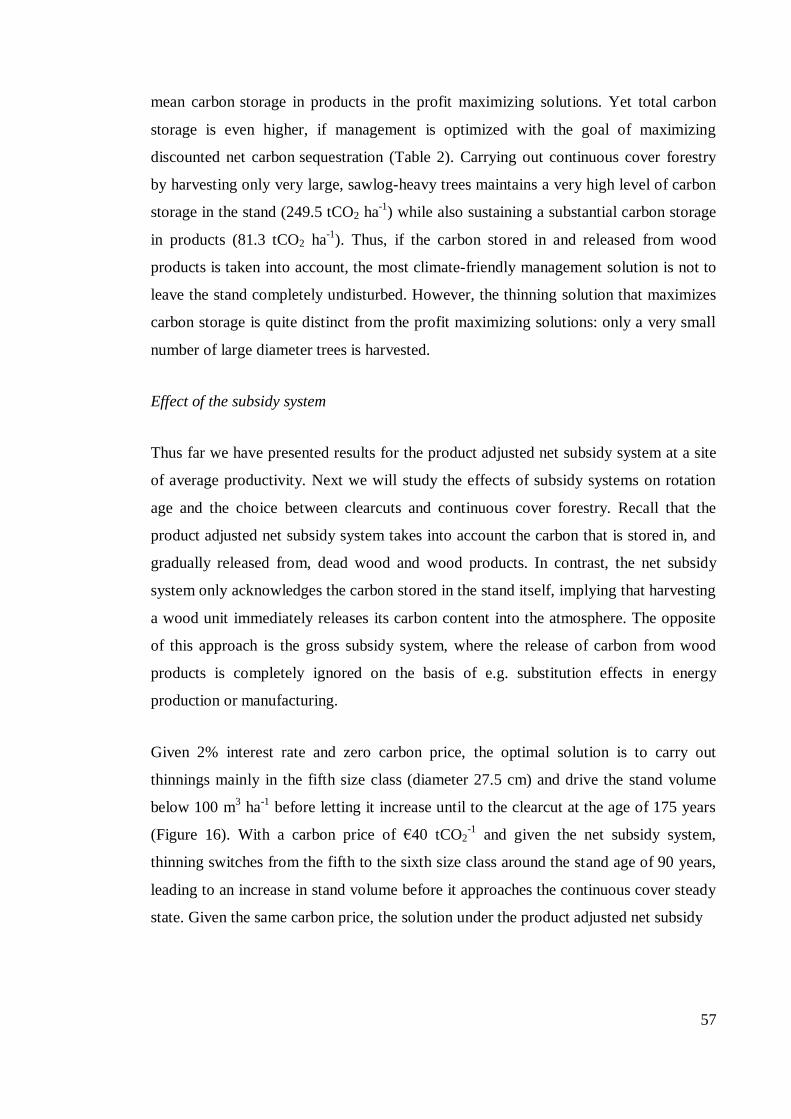
57
mean carbon storage in products in the profit maximizing solutions. Yet total carbon
storage is even higher, if management is optimized with the goal of maximizing
discounted net carbon sequestration (Table 2). Carrying out continuous cover forestry
by harvesting only very large, sawlog-heavy trees maintains a very high level of carbon
storage in the stand (249.5 tCO2 ha-1
) while also sustaining a substantial carbon storage
in products (81.3 tCO2 ha-1
). Thus, if the carbon stored in and released from wood
products is taken into account, the most climate-friendly management solution is not to
leave the stand completely undisturbed. However, the thinning solution that maximizes
carbon storage is quite distinct from the profit maximizing solutions: only a very small
number of large diameter trees is harvested.
Effect of the subsidy system
Thus far we have presented results for the product adjusted net subsidy system at a site
of average productivity. Next we will study the effects of subsidy systems on rotation
age and the choice between clearcuts and continuous cover forestry. Recall that the
product adjusted net subsidy system takes into account the carbon that is stored in, and
gradually released from, dead wood and wood products. In contrast, the net subsidy
system only acknowledges the carbon stored in the stand itself, implying that harvesting
a wood unit immediately releases its carbon content into the atmosphere. The opposite
of this approach is the gross subsidy system, where the release of carbon from wood
products is completely ignored on the basis of e.g. substitution effects in energy
production or manufacturing.
Given 2% interest rate and zero carbon price, the optimal solution is to carry out
thinnings mainly in the fifth size class (diameter 27.5 cm) and drive the stand volume
below 100 m3 ha
-1 before letting it increase until to the clearcut at the age of 175 years
(Figure 16). With a carbon price of €40 tCO2-1
and given the net subsidy system,
thinning switches from the fifth to the sixth size class around the stand age of 90 years,
leading to an increase in stand volume before it approaches the continuous cover steady
state. Given the same carbon price, the solution under the product adjusted net subsidy
58
system is very similar: harvesting switches to the sixth size class five years later, but the
continuous cover steady state is the same (see previous chapter for a more detailed
analysis). Under the gross subsidy system, stand volume is kept somewhat higher than
in the case without carbon pricing. However, unlike under the other systems,
clearcutting is preferred to continuous cover management, and the rotation becomes
shorter, not longer, than in the case with zero carbon price.
A 3% interest rate is sufficiently high to render continuous cover forestry optimal under
all subsidy systems as well as with zero carbon price (Figure 17). However, the effects
of different carbon subsidy systems are visible in the steady states and the transitions
Stand age, yrs
20 40 60 80 100 120 140 160 180
Sta
nd
vo
lum
e, m
3 h
a-1
0
50
100
150
200
250
pc = €0 tCO
2
-1
pc = €40 tCO
2
-1, net subsidy
pc = €40 tCO
2
-1, product adjusted net subsidy
pc = €40 tCO
2
-1, gross subsidy
Figure 16. Optimal stand volume development under different subsidy systems with 2 %
interest rate. Note: w = €1000 ha-1
, SI = 15.
Figure 16. Optimal stand volume development under different subsidy systems with
2% interest rate. Note: w = €1000 ha-1
, SI = 15.
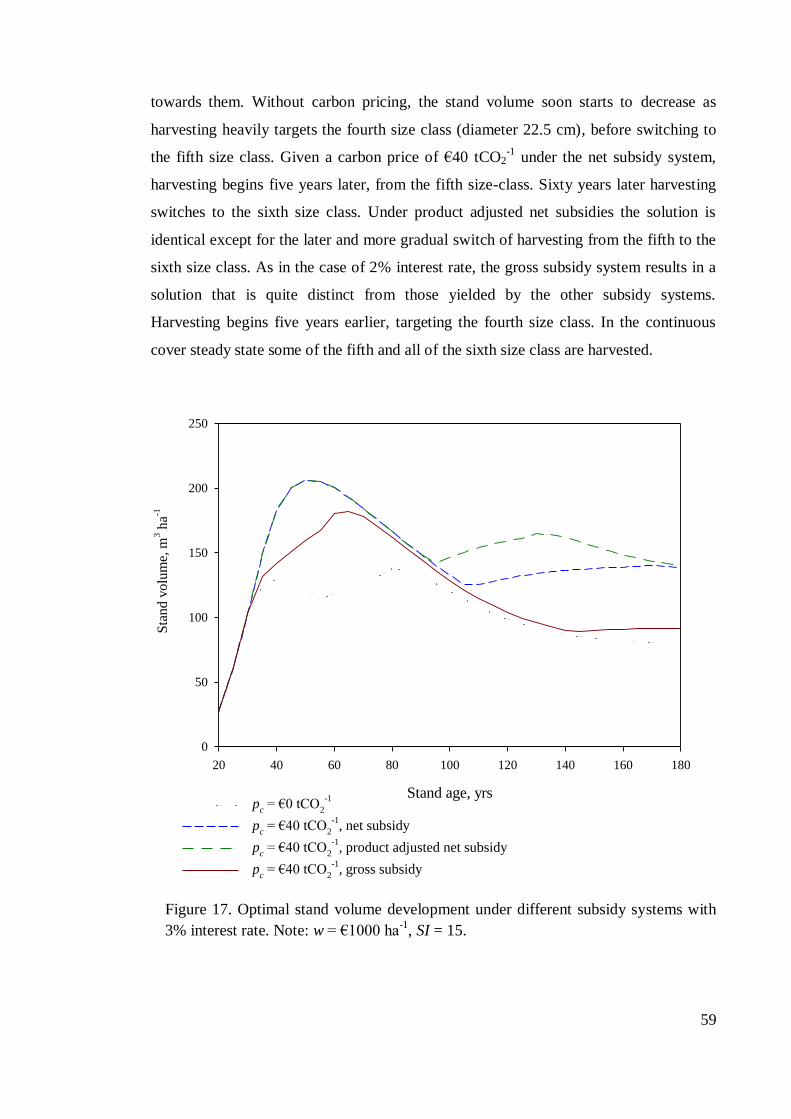
59
towards them. Without carbon pricing, the stand volume soon starts to decrease as
harvesting heavily targets the fourth size class (diameter 22.5 cm), before switching to
the fifth size class. Given a carbon price of €40 tCO2-1
under the net subsidy system,
harvesting begins five years later, from the fifth size-class. Sixty years later harvesting
switches to the sixth size class. Under product adjusted net subsidies the solution is
identical except for the later and more gradual switch of harvesting from the fifth to the
sixth size class. As in the case of 2% interest rate, the gross subsidy system results in a
solution that is quite distinct from those yielded by the other subsidy systems.
Harvesting begins five years earlier, targeting the fourth size class. In the continuous
cover steady state some of the fifth and all of the sixth size class are harvested.
Stand age, yrs
20 40 60 80 100 120 140 160 180
0
50
100
150
200
250
pc = €0 tCO
2
-1
pc = €40 tCO
2
-1, net subsidy
pc = €40 tCO
2
-1, product adjusted net subsidy
pc = €40 tCO
2
-1, gross subsidy
Sta
nd v
olu
me,
m3 h
a-1
Figure 17. Optimal stand volume development under different subsidy systems with 3 %
interest rate. Note: w = €1000 ha-1
, SI = 15.Figure 17. Optimal stand volume development under different subsidy systems with
3% interest rate. Note: w = €1000 ha-1
, SI = 15.
60
These observations can be explained as follows. Under the net subsidy system,
harvesting causes costs by subtracting the subsidies for the full amount of harvested
volume. This creates a disincentive to harvest and decreases carbon revenues compared
to the other subsidy systems. Taking into account the carbon stored in and released from
wood products and any dead trees, as is done under the product adjusted net subsidy
system, adds incentive to harvest only larger, sawlog-heavy trees. The gross subsidy
system rewards gross volume growth, i.e. volume growth before harvesting. Thus
carbon pricing gives incentive to enhance the growth of the stand as well as its yield.
This is done by keeping more capital in the stand, compared to the solution without
carbon pricing (Figures 16 and 17). Additionally, gross carbon subsidies increase the
bare land value considerably and may, given a low interest rate, encourage clearcutting
in order to advance the future rotations.
In short, the effects of carbon subsidies on optimal stand management are sensitive to
the subsidy system chosen. Optimal management solutions under the net subsidy system
and the product adjusted net subsidy system resemble one another closely, but are
clearly different from those under the gross subsidy system.
Effect of the site type
To study the effects of site type on the relative profitability of continuous cover and
clearcuts, solutions were computed for three site types: SI = 11 representing poor
growth conditions, SI = 15 representing an average productivity site (see previous
chapter for a more detailed analysis), and SI = 19.5 representing a very productive site.
Table 3 shows that the optimal solutions for the low, average and high productivity site
differ considerably from each other (Table 2 shows more detailed results for the average
productivity site). On the low productivity site, rotations are finite (though extremely
long) when the interest rate is 1% and the carbon price below €40 tCO2-1
. Higher
interest rates and carbon prices render clearcutting suboptimal. The long planting delay
and modest growth capacity translate to lower timber income and carbon subsidies and
thus a lower net present value compared to the more productive sites. The opposite is
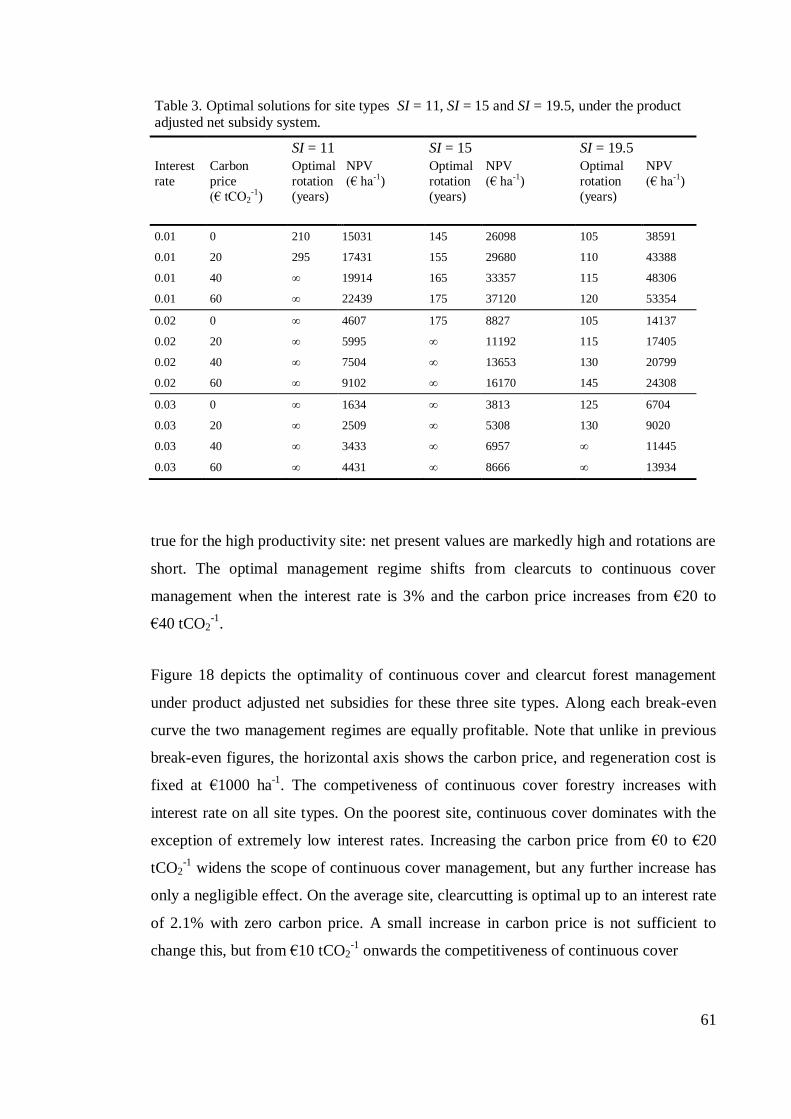
61
Table 3. Optimal solutions for site types SI = 11, SI = 15 and SI = 19.5, under the product adjusted net subsidy system.
SI = 11 SI = 15 SI = 19.5
Interest
rate
Carbon
price
(€ tCO2-1)
Optimal
rotation
(years)
NPV
(€ ha-1)
Optimal
rotation
(years)
NPV
(€ ha-1)
Optimal
rotation
(years)
NPV
(€ ha-1)
0.01 0 210 15031 145 26098 105 38591
0.01 20 295 17431 155 29680 110 43388
0.01 40 ∞ 19914 165 33357 115 48306
0.01 60 ∞ 22439 175 37120 120 53354
0.02 0 ∞ 4607 175 8827 105 14137
0.02 20 ∞ 5995 ∞ 11192 115 17405
0.02 40 ∞ 7504 ∞ 13653 130 20799
0.02 60 ∞ 9102 ∞ 16170 145 24308
0.03 0 ∞ 1634 ∞ 3813 125 6704
0.03 20 ∞ 2509 ∞ 5308 130 9020
0.03 40 ∞ 3433 ∞ 6957 ∞ 11445
0.03 60 ∞ 4431 ∞ 8666 ∞ 13934
true for the high productivity site: net present values are markedly high and rotations are
short. The optimal management regime shifts from clearcuts to continuous cover
management when the interest rate is 3% and the carbon price increases from €20 to
€40 tCO2-1
.
Figure 18 depicts the optimality of continuous cover and clearcut forest management
under product adjusted net subsidies for these three site types. Along each break-even
curve the two management regimes are equally profitable. Note that unlike in previous
break-even figures, the horizontal axis shows the carbon price, and regeneration cost is
fixed at €1000 ha-1
. The competiveness of continuous cover forestry increases with
interest rate on all site types. On the poorest site, continuous cover dominates with the
exception of extremely low interest rates. Increasing the carbon price from €0 to €20
tCO2-1
widens the scope of continuous cover management, but any further increase has
only a negligible effect. On the average site, clearcutting is optimal up to an interest rate
of 2.1% with zero carbon price. A small increase in carbon price is not sufficient to
change this, but from €10 tCO2-1
onwards the competitiveness of continuous cover
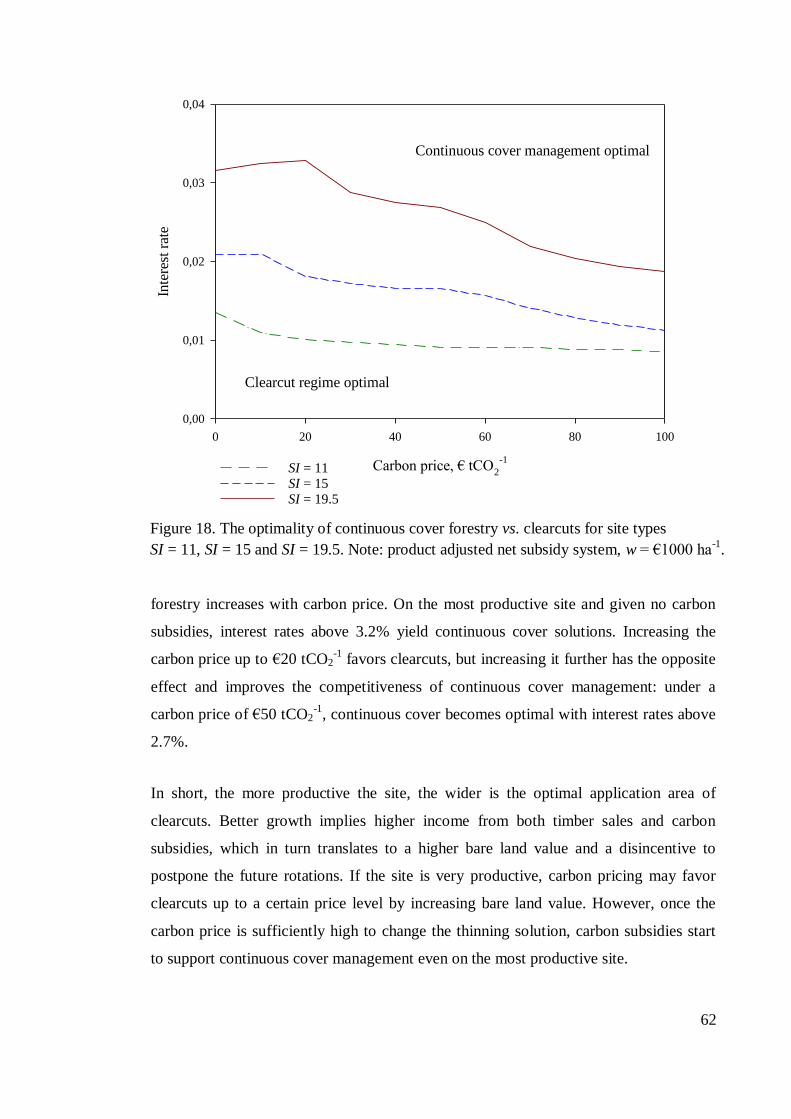
62
forestry increases with carbon price. On the most productive site and given no carbon
subsidies, interest rates above 3.2% yield continuous cover solutions. Increasing the
carbon price up to €20 tCO2-1
favors clearcuts, but increasing it further has the opposite
effect and improves the competitiveness of continuous cover management: under a
carbon price of €50 tCO2-1
, continuous cover becomes optimal with interest rates above
2.7%.
In short, the more productive the site, the wider is the optimal application area of
clearcuts. Better growth implies higher income from both timber sales and carbon
subsidies, which in turn translates to a higher bare land value and a disincentive to
postpone the future rotations. If the site is very productive, carbon pricing may favor
clearcuts up to a certain price level by increasing bare land value. However, once the
carbon price is sufficiently high to change the thinning solution, carbon subsidies start
to support continuous cover management even on the most productive site.
Carbon price, € tCO2
-1
0 20 40 60 80 100
Inte
rest
rat
e
0,00
0,01
0,02
0,03
0,04
SI = 11SI = 15SI = 19.5
Figure 18. The optimality of continuous cover forestry vs. clearcuts for site types SI = 11,
SI = 15 and SI = 19.5. Note: product adjusted net subsidy system, w = €1000 ha-1
.
Continuous cover management optimal
Clearcut regime optimal
Figure 18. The optimality of continuous cover forestry vs. clearcuts for site types
SI = 11, SI = 15 and SI = 19.5. Note: product adjusted net subsidy system, w = €1000 ha-1
.
63
4. Discussion
In this thesis we have analyzed the optimality of clearcuts versus continuous cover
forestry in a setting where the society applies Pigouvian carbon subsidies to internalize
carbon storage benefits of forestry. In the first section, the problem was approached
using a continuous time biomass model that combines Schaefer-style biomass
harvesting with the Faustmann rotation model (Schaefer 1957, Faustmann 1849). In the
second section, the economic problem was studied using a detailed size-structured
transition matrix model with empirically estimated growth functions.
Following van Kooten et al. (1995), our carbon subsidy formulation allows us to take
into account that while carbon is stored in living trees, it may also be stored in wood
products to some extent. Within the size-structured setting, we add detail to this
formulation by considering the specific rates for carbon release from dead wood, sawlog
and pulpwood products over time (cf. Pihlainen et al. 2014). This approach, the product
adjusted net subsidy, is the focus of our analysis. However, we make comparisons to
two further subsidy policy possibilities: the gross subsidy system under which timber
harvesting is assumed to cause no release of carbon, and the net subsidy system that
only acknowledges carbon present in the living trees.
Within the biomass setting, we show analytically that subsidized carbon storage
postpones the start of thinning and increases the optimal stand volume. We also present
numerical examples of this effect. If the carbon price is very high relative to stumpage
price, it is optimal to begin thinning when the stand volume has already surpassed the
growth-maximizing level. In this case the shadow value of stand volume and the direct
net revenues from thinning are negative, and the stand is harvested in order to maintain
optimal stand growth and carbon sequestration revenues.
Within the size-structured setting, in addition to the timing of the first thinning, the
harvesting solution adapts to carbon subsidization by changing the size class that is
targeted at each moment. Thinning is invariably done from above, and the size of the
harvested trees increases with carbon price. As it is always optimal to fully harvest the
largest size class, this implies that stand volume increases with carbon price. These
64
effects cannot be observed when using the biomass approach which omits the internal
stand structure. In other words, the main results on optimal thinning from the biomass
approach are in line with those from the more realistic size-structured approach, but lack
the latter’s concreteness and precision. The optimal paths of stand volume are within the
same range in both models (see e.g. Figures 1 and 17).
According to the analytical results from the biomass approach, carbon subsidization
increases value growth at the moment of clearcut and decreases the interest cost on
clearcut net revenues. This implies an incentive to postpone clearcutting (possibly ad
infinitum). On the other hand, carbon subsidies increase bare land value and thus give
incentive to advance the clearcut. The relative magnitudes of these opposite effects
determine whether carbon subsidies lengthen or shorten the optimal rotation – and
further, whether carbon subsidies favor continuous cover management or clearcuts.
Numerical examples of the biomass approach suggest that rotation age tends to increase
with carbon price. Under the product adjusted net subsidy system and given 3% (5%)
interest rate, continuous cover management becomes optimal when the carbon price is
€60 tCO2-1
(€40 tCO2-1
) or above. The results from the size-structured approach confirm
that rotation age increases with carbon price. Given 2% interest rate, increasing the
carbon price from €0 to €20 tCO2-1
is sufficient to switch the management regime from
clearcuts to continuous cover forestry.
The carbon price required to make continuous cover forestry optimal is lower within the
size-structured than the biomass framework. This can be attributed to several
differences in the economic-ecological setup. One important reason is that the size-
structured model enables us to target thinning to trees of specific size, thus making use
of the fact that large trees yield relatively more sawlog than small trees. Sawlog, in turn,
is superior to pulpwood not only in terms of stumpage price but also in its ability to
store carbon for extended periods. In clearcuts such targeted harvesting is by definition
impossible. Thus the incentive to avoid clearcutting is stronger within the size-
structured setting. In this sense, a biomass model that omits the size-structure of the
stand cannot fully capture the economic advantages of continuous cover forestry.
65
For the biomass model, the comparative statics of rotation age were analyzed also with
respect to interest rate. Unlike in the case of the generic Faustmann formulation, a
higher interest rate can lead to a longer as well as to a shorter rotation. Numerical
examples suggest that rotation age increases with interest rate when carbon
sequestration is subsidized. This is also confirmed by the results of the size-structured
approach: when the interest rate is 3% or higher, continuous cover management is
optimal regardless of carbon price. High interest rate makes it optimal to postpone or
avoid the investment in artificial regeneration and to rely on natural regeneration.
In a more general sense the optimal choice between clearcuts and continuous cover
management depends on the combination of economic and ecological parameters.
Within both the biomass and the size-structured framework, continuous cover
management is the more competitive, the more expensive is artificial regeneration.
Additionally, results from the size-structured approach show that the optimal scope of
continuous cover management is the wider, the less productive is the site type. This is
because a lengthy planting delay and moderate growth of the initial cohort discourage
clearcutting.
We show that the effect of carbon subsidization on the supply of wood and carbon
storage in the stand is the more pronounced, the higher the interest rate. The higher the
interest rate, the more profitable it is to shift net emissions forward in time by adapting
management choices. Within the biomass framework and given interest rates ranging
from 1% to 5%, low to moderate carbon prices increase mean annual wood supply from
the stand.
Results from the size-structured approach show that mean annual supply of wood,
especially of sawlog, generally increases with carbon price. The only exception is the
case where carbon pricing causes a switch from a clearcut regime to a continuous cover
regime. Further, mean total carbon storage (in the stand and in products) increases
monotonously with carbon price. Leaving the stand completely undisturbed – no
thinning and no clearcuts – is economically suboptimal but results in the highest mean
carbon storage in the stand. Given the product adjusted net subsidy system and positive
time preference, mean total carbon storage would be maximized by a continuous cover
66
management solution where only a very small number of large diameter trees is
harvested.
Results from both the biomass and the size-structured approach suggest that optimal
management is sensitive to the choice of carbon subsidy system. Within the biomass
framework, all three systems yield distinctive results. Increasing the carbon price
switches the optimal management regime from clearcuts to continuous cover under both
the net subsidy and the product adjusted net subsidy system. However, under the gross
subsidy system carbon pricing has little effect on rotation age. Within the size-
structured framework, solutions computed under the net subsidy system and the product
adjusted net subsidy system resemble each other closely: carbon pricing changes the
volume and structure of the stand significantly and supports continuous cover forestry
instead of clearcuts. Under the gross subsidy system, carbon pricing increases stand
volume slightly and may even shorten the optimal rotation compared to the solution
with zero carbon price. Also noteworthy is that the forest owner’s income is
dramatically higher under the gross subsidy system.
Both our models differ from that of van Kooten et al. (1995) (and many similar models
published later) since we include thinning and the possibility of continuous cover
forestry. According to the numerical results of van Kooten et al. (1995), carbon
subsidies increase rotation age, but with plausible carbon prices the effect is usually
moderate. Our numerical results confirm that rotation age tends to increase with carbon
price. However, our findings suggest that when thinning is taken into account, carbon
prices within a realistic range may lengthen the rotation period considerably and lead to
infinite rotations, i.e. to a switch from plantation type of forestry to continuous cover
forestry. Based on numerical results, van Kooten et al. (1995) point out that the optimal
rotation age can be infinite, if timber has no commercial value and releases all of its
stored carbon at the time of harvest. Indeed, our analysis shows that if stumpage price is
zero and carbon is completely released at harvest, it is optimal to neither thin nor
clearcut the stand even when the model includes the option of thinning. However, we
show that this is not the case when carbon is stored permanently in wood products or
when wood is used as bioenergy and is a perfect substitute for fossil fuels.
67
Huang and Kronrad (2006) examine timber production with carbon subsidization in
even-aged loblolly pine plantations. They optimize both rotation age and thinnings,
although they set considerable restrictions on allowable thinnings. The applied carbon
subsidy system includes subsidy subtractions according to mortality and harvested
volume. However, no subtractions are made for merchantable portions of pulpwood and
sawtimber because they are both assumed to be made into long-lived wood products.
The authors state that the effect of carbon pricing on the optimal rotation age and the
relative gain in net present value is larger on low-productivity sites than on high-
productivity sites, and larger for high interest rates than for low interest rates. Our
results are in line with these findings (Table 3).
Pohjola and Valsta (2007) study timber production and carbon sequestration in even-
aged Scots pine and Norway spruce stands, optimizing both rotation age and thinnings.
Their subsidy/tax design assumes “that all the carbon is released to the atmosphere
immediately after harvesting, excluding thus the carbon storages in wood products”
(Pohjola and Valsta 2007), which corresponds to our net subsidy system. According to
their results for Norway spruce, carbon pricing increases the rotation age, which
matches our results. However, unlike in our solutions, carbon subsidization has only a
slight effect on optimal thinning. Pohjola and Valsta (2007) also find that moderate
carbon prices have a positive impact on the average timber yield.
Pihlainen et al. (2014) and Niinimäki et al. (2013) study timber production and carbon
storage in artificially regenerated even-aged stands of Scots pine and Norway spruce,
respectively. Both use numerical optimization based on very detailed ecological models
and take into account carbon stored in the stand and in timber products. Pihlainen et al.
(2014) additionally consider the whole aboveground tree biomass including dead trees.
The authors optimize rotation length, initial stand (planting) density and the number,
intensity, timing and type of thinnings. According to the results in Pihlainen et al.
(2014), carbon subsidization increases initial stand density. In general, stand volume
throughout the rotation is the higher, the higher is the carbon price, which is in line with
our results. The authors also find that carbon pricing lengthens the optimal rotation.
Pihlainen et al. (2014) observe distinct solutions for net subsidy (which corresponds to
our product adjusted net subsidy) systems and gross subsidy systems, implying that the
68
product decay rate has a significant effect on optimal management. Our results support
this finding.
According to Niinimäki et al. (2013), a “higher CO2 price tends to postpone harvests
and increase basal area and standing volume”, which matches our results. Given the
average productivity spruce site (SI = 15 approximates H100=24) and 1% interest rate,
the authors report optimal rotation periods that range from 134 to 170 years for a carbon
price range of €0 to €60 tCO2-1
. These rotations are somewhat shorter than the optimal
solutions in the present study, computed using a size-structured model. Given 3%
interest rate, the rotations presented in Niinimäki et al. (2013) are even shorter, whereas
ours are all infinitely long, i.e. continuous cover solutions. A likely reason for this is
that the process-based model used in Niinimäki et al. (2013) omits the emergence of
new trees via natural regeneration, implying that the growth of a stand decreases
significantly as it ages. Hence clearcutting is eventually necessary to maintain a flow of
forestry income. The approach of the present study, in turn, entails optimally utilizing
natural regeneration as well as the option of postponing the clearcut indefinitely. In the
case of the high fertility site (H100=30), the authors observe two tendencies that are
prevalent also in our solutions: higher interest rate increases optimal rotation length, and
carbon pricing amplifies this effect.
However, in Niinimäki et al. (2013) the stand is allowed to reach a much higher volume
than in our solutions. Therefore the average carbon storage in the stand is somewhat
lower in our solutions. Norway spruce is a shade tolerant species and thus under even-
aged management and artificial regeneration thinnings can start substantially later than
in our case, where the optimal utilization of natural regeneration requires controlling the
stand volume from quite early on. Given the average productivity site, Niinimäki et al.
(2013) report that the first thinning takes place when the stand is 63–97 years old
(depending on interest rate and carbon price); we find that it is optimal to start thinning
the stand when it is only 35–40 years old.
Goetz et al. (2010) seems to be the first paper to study the economics of uneven-aged
forestry with carbon sequestration. The authors state that their framework could be
extended to naturally reproducing stands, but their “theoretical and empirical analysis is
69
framed within the context of a completely managed forest” where new trees are planted
in pursuance of thinning (Goetz et al. 2010). The empirical model focuses on Scots pine
in a Mediterranean context. According to their numerical results, an increase in carbon
price leads to an increase in the number of trees in the stand through increased planting
and decreased logging. The effect on the stand volume is not reported. Based on a
sensitivity analysis, Goetz et al. (2010) find that the decay of carbon from wood
products does not noticeably alter the optimal solutions. This is in contrast with our
results as well as those presented in Pihlainen et al. (2014). The option of shifting to
clearcut management is not considered in the paper.
Pukkala et al. (2011) compare uneven- and even-aged management systems numerically
in terms of timber, carbon and bilberry services. However, their approach differs from
ours because of their use of the problematic “investment efficient” (IE) approach. The
authors report the net present values and physical yields from optimized uneven- and
even-aged management as well as those resulting from currently recommended even-
aged management. The effect of carbon pricing on optimal uneven-aged management is
not explicitly addressed. For Norway spruce, they find uneven-aged management to be
more profitable than even-aged regardless of carbon price, but the difference decreases
when the carbon price is higher. For Scots pine, they find that increasing the carbon
price from €15 to €30 tCO2-1
actually makes even-aged management by far more
profitable. Pukkala et al. (2011) state that “the superiority of uneven-aged management
increases with increasing discount rate”; and on the other hand, “increasing the discount
rate shortens the optimal rotation lengths in even-aged management”. These findings are
contradictory from the perspective of our setup, where an infinite rotation age implies
optimality of continuous cover management, and the difference probably results from
their very different model setup.
Also Buongiorno et al. (2012) apply the IE approach for numerically optimizing the
steady-state uneven-aged management for carbon sequestration and timber production.
The study concentrates on comparing the IE objective and stand characteristics given a
cutting cycle of 5 or 20 years. When maximizing the IE objective including combined
carbon storage and timber production, they find that stand basal area and volume
increase with carbon price. This is, despite of the divergent optimization method, in line
70
with the analytical and numerical results of the present study. The authors also state that
as the carbon price increases from zero to NOK 300 tCO2-1
( €36 tCO2-1
), both annual
harvest volume and carbon storage increase; with higher carbon prices harvest volume
decreases. At first sight, this resembles our result that wood supply generally increases
with carbon price but may decrease when carbon pricing extends the still finite rotation
(Table 2, Figure 8). However, while our result follows from the opposing effects of
increased mean stand volume and lengthened rotation, the latter effect cannot explain
the result of Buongiorno et al. (2012), because their optimization framework does not
include the option of clearcutting. Hence the observed conflict between carbon storage
and wood production must, in their case, follow from exceeding the growth-maximizing
stand volume.
Parajuli and Chang (2012) apply the “generalized Faustmann formula”, a variation of
the IE approach, to study uneven-aged management of loblolly pine stands with carbon
sequestration. Because of the aforementioned optimization method and other
problematic features, the results of Parajuli and Chang (2012) should be interpreted with
some caution. To determine the optimal cutting cycle and residual growing stock for
joint production of timber and carbon sequestration the authors try out different
combinations of cutting cycles within a time interval that equals the least common
multiple of each potential cutting cycle and the optimal timber-only cutting cycle of 10
years. The value of the cutting cycles that succeed the said time interval is claimed to be
captured by a “future land value”, which is varied in sensitivity analysis. According to
the authors, including carbon sequestration benefits did not alter the optimum
management regimes significantly. Parajuli and Chang (2012) compute the carbon
benefits by comparing the joint production solution to the timber-only solution, whereas
our study takes into account the positive externality of carbon sequestration in its
entirety.
The role of forest management choices in climate change mitigation, as well as the need
for improved carbon accounting and policies, are subjects of ongoing discussion
(Ellison et al. 2011, Malmsheimer et al. 2011, Bellassen and Luyssaert 2014). One of
the intensively discussed questions has been whether the use of forestry biomass for
energy or products is carbon neutral. The carbon neutrality view is based on the notion
71
that losses of carbon caused by harvesting are offset by new biomass regrowth (cf.
Holtsmark 2015, 20–24). We will next explain why this assumption is problematic and
how it is connected to international climate policy.
First, it is argued that wood use is physically carbon neutral if the forest carbon stock is
stable or increasing within a relevant spatial and temporal frame, but it is unclear how
that frame should be defined. One of the arguments presented against biomass use
carbon neutrality is carbon debt (Lamers and Junginger 2013, Kallio et al. 2013). The
time span between the emissions from wood use (e.g. combustion or product decay) and
the eventual re-sequestration of the released carbon through biomass growth may be
considerable. This lag is made significant by the urgency of mitigating climate change.
In a more general sense, CO2 sequestration and emissions take place at different points
of time, and making the social benefits and damages associated with these flows
commensurable requires some form of discounting. Instead of referring to carbon debt
and comparing various payback times as in Pingoud et al. (2012) and Zanchi et al.
(2012), we find it useful to track the values of both carbon sequestration and emissions
dynamically over an infinite time horizon by discounting their social values to the
present moment.
Using the Faustmann model, McDermott et al. (2015) show that carbon neutrality of
biomass use can be refuted by comparing the optimal solutions with and without carbon
pricing: the difference between the net present values of these solutions is the negative
externality associated with harvesting wood for energy production. Similarly, but with a
model that includes thinning and the option of applying continuous cover management,
we have shown that pricing carbon according to its social value impacts optimal
management solutions, and from the economic point of view carbon neutrality may
occur only accidentally. Thus, there is a strong argument for Pigouvian policies to
internalize the benefits and costs caused by forest management. Next, we will briefly
comment on whether such policies are applied within the existing climate policy
framework and how the situation might be improved.
The political designation of biomass use as carbon neutral was originally motivated by
the IPCC accounting principles: “any excess of releases over regrowth will show up as a
72
loss of C [carbon] stock and will be accounted for in the land use sector” (Zanchi et al.
2012). In this framework, the assumption of carbon neutral biomass use is necessary to
avoid double counting (IPCC 2015). Thus the notion of carbon neutrality is inherently
tied to a complete carbon accounting system for the land use sector, but such a system
does not exist on the global or EU level (Zanchi et al. 2012). Currently the European
Union Emissions Trading Scheme lists “leaves, wood, roots, stumps and bark” as
biomass considered carbon neutral (European Commission 2007).8 Thus the ETS
creates incentive to substitute wood products for fossil inputs. However, as there is no
corresponding pricing mechanism in place for carbon stored in and removed from
forests, the system fails to account for the changes in forest carbon stocks and cannot
guarantee that regrowth equals harvests (cf. Ellison et al. 2014, McDermott et al. 2015).
In fact, if wood is to be completely exempted from CO2 emission liabilities at the point
of its use, it should be subject to emissions policy at the point of its removal from the
forest. In terms of the carbon subsidy formulations presented in this thesis, this would
mean applying the net subsidy system, where subsidies are paid or subtracted according
to the change in stand volume. The problem with this approach is that it treats wood
used for durable goods (e.g. construction) identically to wood burned for energy, even
though the former may store carbon for considerable periods of the time and the latter
causes instant emissions.
The first-best solution would be to treat emissions as emissions independently of their
origin. Emissions – from fossil or renewable sources – would be priced where and when
they occur: at the point of combustion or product displacement and decay. This implies
that carbon storage in forestry would be subsidized according to the gross subsidy
system, i.e. no subsidy subtractions for harvested volume, and emission liabilities would
be assigned to wood users instead, as in the general equilibrium framework in Tahvonen
(1995). However, such a system might be unfeasible for practical reasons.
8 This premise is refuted e.g. in a recent Joint Research Centre technical report for the European Commission, asserting that “the assumption of biogenic carbon neutrality is not valid under policy
relevant time horizons - - if carbon stock changes in the forest are not accounted for”. (Agostini et al.
2013, p. 18.)
73
To understand the effects of carbon storage on forest management and how this depends
on the utilization of wood we apply various carbon subsidy systems. Our results suggest
that the design of the subsidy policy may have considerable impacts on forest
management choices, forestry income as well as government expenditure. However,
these differences may be partly due to assuming exogenous prices. For example, were
the gross subsidy system applied in the context where wood product users are liable for
the emissions caused by combustion or decay, demand for different wood product types
would be very likely to change. This in turn, would alter the optimal management
solutions. Hence the understanding of the effects of subsidy policies would be deepened
by using a model that includes market interactions. However, such analysis is not
possible without a framework for studying management choices on the stand level. To
this end, we have presented a way to optimize forest management – including the choice
between clearcuts and continuous cover forestry – under carbon subsidization.
In Finland, arguments have been presented that maximizing sustained yield
simultaneously maximizes the carbon stored in forests (Kauppi and Mäntyranta 2014).
Such an outcome is clearly impossible even if wood is used in bioenergy and fully
replaces emissions that otherwise occur in burning of fossil fuels. More generally,
volume maximization arguments neglect discounting, failing to appreciate that carbon
storage through forestry essentially means shifting net emissions – and damages –
forward in time. Additionally, these arguments are based on an unnecessarily narrow
forestry framework, where the option of switching to continuous cover management is
excluded from the outset.
International climate policy and carbon accounting rules are still taking form.
Furthermore, the status of forestry within this context is subject to negotiation, and we
hope to contribute to that discussion in a way that may facilitate policy design. Hence,
we utilize a carbon subsidy formulation that is general enough to accommodate different
assumptions on product decay and time preference. By applying the product adjusted
net subsidy system, we show that when the carbon both stored in and released from
wood products is taken into account, carbon pricing favors neither maximal forest
resource utilization nor complete protection. Instead, higher stand density, long
rotations and a possible switch to continuous cover management, with an emphasis on

74
harvesting large trees with a high sawlog ratio, represent the economically efficient
methods to decrease net carbon emissions. The optimal regime shift between forestry
based on clearcuts and maintaining continuous forest cover is a completely new result in
the carbon sequestration discussion. The importance of this extension is further
underlined by the recent views that forests heterogeneity (age, size and species
structure) may play a central role in maintaining forest resilience under disturbances
caused by climate change (Gamfeldt et al. 2015, Gauthier et al. 2015).
75
5. Conclusions
In this thesis, we have presented a way to study economically optimal forestry with
carbon storage by determining the optimal management system endogenously: Unlike
previous studies, we do not limit the analysis to even-aged or, alternatively, uneven-
aged forestry, or to a comparison of the two based on two distinctive models. Instead,
we use a coherent optimization framework that allows us to show how changes in
various economic and ecological parameters may bring about management regime
shifts. We demonstrate that using a continuous time biomass model, the effects of
carbon subsidies on optimal clearcut and continuous cover forest management can be
studied analytically as well as numerically. The results produced by this approach are
economically intuitive and can be compared to results from existing numerical studies,
many of which they support. However, the analytical results reached by this model
setup come with a price, because the biomass model represents a strong simplification
of the complex dynamics of uneven-aged forest stands. Thus, we have proceeded to
study a similar economic problem with a more realistic ecological model, a size-
structured transition matrix model. The results obtained by this approach are largely
consistent with those from the biomass approach, but paint a considerably more realistic
picture of stand development and optimal harvesting. Objectives for further study
include a more detailed economic setup with fixed harvesting costs, variable harvesting
intervals and multiple species stands.
76
References
Adams, D.M. and Ek, A.R. 1974. Optimizing the management of uneven-aged forest
stands. Canadian Journal of Forest Research 4(3): 274–287.
Adams, D.M. 1976. A Note on the Interdependence of Stand Structure and Best
Stocking in a Selection Forest. Forest Science 22(2): 180–184.
Adams, T. and Turner, J.A. 2012. An investigation into the effects of an emissions
trading scheme on forest management and land use in New Zealand. Forest Policy
and Economics 15: 78–90.
Agostini, A., Giuntoli, J. and Boulamanti, A. 2013. Carbon accounting of forest
bioenergy. Conclusions and recommendations from a critical literature review.
European Commission Joint Research Centre Technical Reports, Report EUR
25354 EN. Publications Office of the European Union, Luxembourg. 87 p.
Amacher, G.S., Ollikainen, M. and Koskela, E. 2009. Economics of Forest Resources.
The MIT Press, Cambridge. 397 p.
Bellassen, V. and Luyssaert, S. 2014. Managing forests in uncertain times. Nature 506:
153–155.
Betters, D.R., Steinkamp, E.A. and Turner, M.T. 1991. Singular Path Solutions and
Optimal Rates for Thinning Even-Aged Forest Stands. Forest Science 37(6):
1632–1640.
Bollandsås, O.M., Buongiorno, J. and Gobakken, T. 2008. Predicting the growth of
stands of trees of mixed species and size: A matrix model for Norway.
Scandinavian Journal of Forest Research 23: 167–178.
Buongiorno, J., Halvorsen, E.A., Bollandsås, O.M., Gobakken, T. and Hofstad, O. 2012.
Optimizing management regimes for carbon storage and other benefits in uneven-
aged stands dominated by Norway spruce, with a derivation of the economic
supply of carbon storage. Scandinavian Journal of Forest Research 27(5): 460–
473.
77
Byrd, R.H., Hribar, M.E. and Nocedal, J. 1999. An interior point algorithm for large
scale nonlinear programming. SIAM Journal on Optimization 9: 877–900.
Byrd, R.H., Nocedal J. and Waltz, R.A. 2006. KNITRO: An integrated package for
nonlinear optimization. In: di Pillo G. and Roma, M. (eds.) Large-Scale Nonlinear
Optimization. Springer, US. p. 35–59.
Calladine, J., Bray, J., Broome, A. and Fuller, R.J. 2015. Comparison of breeding bird
assemblages in conifer plantations managed by continuous cover forestry and
clearfelling. Forest Ecology and Management 344: 20–29.
Canadell, J.G. and Raupach, M.R. 2008. Managing Forests for Climate Change
Mitigation. Science 320: 1456–1457.
Cawrse, D.C., Betters, D.R. and Kent, B.M. 1984. A Variational Solution Technique for
Determining Optimal Thinning and Rotational Schedules. Forest Science 30(3):
793–802.
Cedergren, J. 2008. Kontinuitetsskogar och hyggesfritt skogsbruk. Skogsstyrelsen,
Jönköping. 90 p.
Clark, C.W. 1976. Mathematical Bioeconomics. The optimal management of renewable
resources. Wiley, New York. 352 p.
Dahlberg, A. 2011. Kontinuitetsskogar och hyggesfritt skogsbruk. Slutrapport för
delprojekt naturvärden. Skogsstyrelsen, Jönköping. 86 p.
Dietz, S. and Stern, N. 2015. Endogenous growth, convexity of damage and climate
risk: how Nordhaus’ framework supports deep cuts in carbon emissions. The
Economic Journal 125(583): 574–620.
Edenhofer, O. 2014. Reforming emissions trading. Nature Climate Change 4: 663–664.
Ellison, D., Lundblad, M., and Peterson, H. 2011. Carbon accounting and the climate
politics of forestry. Environmental Science & Policy 14(8): 1062–1078.
Ellison, D., Lundblad, M. and Petersson, H. 2014. Reforming the EU approach to
LULUCF and the climate policy framework. Environmental Science & Policy 40:
1–15.
78
European Commission. 2007. Commission Decision of 18 July 2007 establishing
guidelines for the monitoring and reporting of greenhouse gas emissions pursuant
to Directive 2003/87/EC of the European Parliament and of the Council (notified
under document number C(2007) 3416) (2007/589/EC). Accessed 24 August
2015. http://eur-lex.europa.eu/legal-content/EN/TXT/?uri=celex:32007D0589
FAO. 2006. Global Forest Resources Assessment 2005. Progress towards sustainable
forest management. FAO Forestry paper 147. Food and Agriculture Organization
of the United Nations, Rome. 320 p.
Faustmann, M. 1849. Berechnung des Werthes, welchen Waldboden, sowie noch nicht
haubare Holzbestände für die Waldwirthschaft besitzen. Allgemeine Forst- und
Jagd-Zeitung 25: 441–455.
Gamfeldt, L., Snäll, T., Bagchi, R., Jonsson, M., Gustafsson, L., Kjellander, P., Ruiz-
Jaen, M.C., Fröberg, M., Stendahl, J., Philipson, C.D., Mikusinski, G., Andersson,
E., Westerlund, B., Andrén, H., Moberg, F., Moen, J. and Bengtsson, J. 2013.
Higher levels of multiple ecosystem services are found in forests with more tree
species. Nature Communications 4(1340): 1–8.
Gauthier, S., Vaillancourt, M-A., Kneeshaw, D., Drapeau, P., De Grandpré, L., Claveau,
Y., and Paré, D. 2009. Forest Ecosystem Management: Origins and Foundations.
In: Gauthier, S., Vaillancourt, M-A., Leduc, A., De Grandpré, L., Kneeshaw, D.,
Morin, H., Drapeau, P., and Bergeron, Y. (eds.) Ecosystem Management in the
Boreal Forest. Presses de l’Université du Québec, Quebec. p. 13–37.
Gauthier, S., Bernier, P., Kuuluvainen, T., Shvidenko, A.Z. and Schepaschenko, D.G.
2015. Boreal forest health and global change. Science 349 (6250): 819–822.
Getz, W.M. and Haight, R.G. 1989. Population Harvesting: Demographic Models for
Fish, Forest and Animal Resources. Princeton University Press, New Jersey. 408
p.
Goetz, R-U., Hritonenko, N., Mur, R.J., Xabadia, A. and Yatsenko, Y. 2010. Forest
Management and Carbon Sequestration in Size-Structured Forests: The Case of
Pinus sylvestris in Spain. Forest Science 56: 242–256.
79
Haight, R.G. 1985. Comparison of Dynamic and Static Economic Models of Uneven-
aged Stand Management. Forest Science 31: 957–974.
Haight, R.G. and Getz, W.M. 1987. Fixed and equilibrium endpoint problems in
uneven-aged stand management. Forest Science 33: 903–931.
Haight, R.G. and Monserud, R. 1990. Optimizing any-aged management of mixed-
species stands: II. effects of decision criteria. Forest Science 36(1): 125–144.
Hartman, R. 1976. The Harvesting Decision When a Standing Forest Has Value.
Economic Inquiry 14(1): 52–58.
Holtsmark, B. 2015. Seven essays on policies and international cooperation to abate
emissions of greenhouse gases. Statistics Norway. 210 pp.
Huang, C-H. and Kronrad, G.D. 2006. The Effect of Carbon Revenues on the Rotation
and Profitability of Loblolly Pine Plantations in East Texas. Southern Journal of
Applied Forestry 30(1): 21–29.
Hyvönen, R. and Ågren, G. 2001. Decomposer invasion rate, decomposer growth rate,
and substrate chemical quality: how they influence soil organic matter turnover.
Canadian Journal of Forest Research 31: 1594–1601.
IPCC. 2000. Land Use, Land-Use Change and Forestry. Watson, R., Noble, I., Bolin,
B., Ravindranath, N., Verardo, D. and Dokken, D. (eds.). Cambridge University
Press, UK. 375 p.
IPCC. 2014. Summary for Policymakers. In: Core Writing Team, Pachauri, R.K. and
Meyer, L.A. (eds.) Climate Change 2014: Synthesis Report. Contribution of
Working Groups I, II and III to the Fifth Assessment Report of the
Intergovernmental Panel on Climate Change. IPCC, Switzerland. p. 2–31.
IPCC. 2015. Frequently Asked Questions, Q2-10. Accessed 24 August 2015.
http://www.ipcc-nggip.iges.or.jp/faq/faq.html
Kallio, A.M.I., Salminen, O. and Sievänen, R. 2013. Sequester or substitute —
Consequences of increased production of wood based energy on the carbon
balance in Finland. Journal of Forest Economics 19: 402–415.
80
Kauppi, P. and Mäntyranta, H. 2014. Hakata vai säästää ‒ metsät ja ilmastonmuutos.
Suomen Metsäyhdistys ry. 56 p.
Kilkki, P. and Väisänen, U.1969. Determination of the optimal policy for forest stands
by means of dynamic programming. Acta Forestalia Fennica 102: 100–112.
Kotilainen, J. and Rytteri, T. 2011. Transformation of forest policy regimes in Finland
since the 19th century. Journal of Historical Geography 37: 429–439.
Kuuluvainen, T., Tahvonen, O. and Aakala, T. 2012. Even-aged and uneven-aged forest
management in boreal Fennoscandia: a review. Ambio 41(7): 720–737.
Lamers, P. and Junginger, M. 2013. The ‘debt’ is in the detail: A synthesis of recent
temporal forest carbon analyses on woody biomass for energy. Biofuels,
Bioproducts and Biorefining 7(4): 373–385.
Liski, J., Pussinen, A., Pingoud, K., Mäkipää, R. and Karjalainen, T. 2001. Which
rotation length is favourable to carbon sequestration? Canadian Journal of Forest
Research 31: 2004–2013.
Lundmark, H., Josefsson, T., and Östlund, L. 2013. The history of clear-cutting in
northern Sweden. Driving forces and myths in boreal silviculture. Forest Ecology
and Management 307: 112–122.
Lämås, T., and Fries, C. 1995. Emergence of a Biodiversity Concept in Swedish Forest
Policy. In: Apps, M.J., Price, D.T., and Wisniewski, J. (eds.). Boreal Forests and
Global Change. Springer, Netherlands. p. 57–66.
MAF, Finnish Ministry of Agriculture and Forestry. 2014. Forest Act (1093/1996;
amendments up to 1085/2013 included). Unofficial translation, accessed 17
August 2015.
http://www.mmm.fi/attachments/metsat/lainsaadanto/xYu2E9F6x/ForestAct.pdf
Malmsheimer, R.W., Bowyer, J.L., Fried, J.S., Gee, E., Izlar, R.L., Miner, R.A., Munn,
I.A., Oneil, E. and Stewart, W.C. 2011. Managing Forests because Carbon
Matters: Integrating Energy, Products, and Land Management Policy. Journal of
Forestry 109(7S): S7–S50.
Manley, B. and Maclaren, P. 2010. Harvested Wood Products in the ETS. What would
be the Impact? NZ Journal of Forestry 55(3): 20–26.
81
Mason, W. 2015. Implementing Continuous Cover Forestry in Planted Forests:
Experience with Sitka Spruce (Picea Sitchensis) in the British Isles. Forests 6:
879–902.
McDermott, S.M., Howarth, R.B. and Lutz, D.A. 2015. Biomass Energy and Climate
Neutrality: The Case of the Northern Forest. Land Economics 91(2): 197–210.
New Zealand Ministry for Primary Industries. 2015 a. Post-1990 Forest. Last updated
15 June 2015, accessed 30 August 2015.
http://archive.mpi.govt.nz/forestry/forestry-in-the-ets/post-1989-forest
New Zealand Ministry for Primary Industries. 2015 b. Pre-1990 Forest. Last updated 15
June 2015, accessed 30 August 2015.
http://archive.mpi.govt.nz/forestry/forestry-in-the-ets/pre-1990-forest
Niinimäki, S., Tahvonen, O., Mäkelä, A. and Linkosalo, T. 2013. On the economics of
Norway spruce stands and carbon storage. Canadian Journal of Forest Research
43(7): 637–648.
Nordhaus, W. 2014. Estimates of the Social Cost of Carbon: Concepts and Results from
the DICE-2013R Model and Alternative Approaches. Journal of the Association
of Environmental and Resource Economists 1(1): 273–312.
Pan, Y., Birdsey, R., Fang, Y., Houghton, R., Kauppi, P., Kurz, W., Phillips, O.,
Shvidenko, A., Lewis, S., Canadell, J., Ciais, P., Jackson, R., Pacala, S., McGuire,
McGuire, A.D., Piao, S., Rautiainen, A., Sitch, S., Hayes, D. 2011. A Large and
Persistent Carbon Sink in the World’s Forests. Science 333: 988–993.
Parajuli, R. and Chang, S.J. 2012. Carbon sequestration and uneven-aged management
of loblolly pine stands in the Southern USA: A joint optimization approach.
Forest Policy and Economics 22: 65–71.
Pihlainen, S., Tahvonen, O. and Niinimäki, S. 2014. The economics of timber and
bioenergy production and carbon storage in Scots pine stands. Canadian Journal
of Forest Research 44(9): 1091–1102.
Pindyck, R. 2013. Pricing Carbon When We Don’t Know the Right Price. Regulation
36(2): 43–46.
82
Pingoud, K., Ekholm, T. and Savolainen, I. 2012. Global warming potential factors and
warming payback time as climate indicators of forest biomass use. Mitigation and
Adaptation Strategies for Global Change 17(4): 369–386.
Pohjola, J., and Valsta, L. 2007. Carbon credits and management of Scots pine and
Norway spruce stands in Finland. Forest Policy and Economics 9(7): 789–798.
Puettmann, K.J., Coates, K.D., and Messier, C. 2009. A critique of silviculture:
managing for complexity. Island Press, Washington DC. 208 p.
Pukkala, T., Lähde, E. and Laiho, O. 2009. Growth and yield models for uneven-sized
forest stands in Finland. Forest Ecology and Management 258: 207–216.
Pukkala, T., Lähde, E., Laiho, O., Salo, K. and Hotanen, J-P. 2011. A multifunctional
comparison of even-aged and uneven-aged forest management in a boreal region.
Canadian Journal of Forest Research 41(4): 851–862.
Ray, D., Morison, J. and Broadmeadow, M. 2010. Climate change: impacts and
adaptation in England’s woodlands. Forest Research Note 201: 1–16.
Reed, W. 1980. Optimum Age-Specific Harvesting in a Nonlinear Population Model.
Biometrics 36(4): 579–593.
Rämö, J. and Tahvonen, O. 2014. Economics of harvesting uneven-aged forest stands in
Fennoscandia. Scandinavian Journal of Forest Research 29(8): 777–792.
Schaefer, M.B. 1957. Some Considerations of Population Dynamics and Economics in
Relation to the Management of the Commercial Marine Fisheries. Journal of the
Fisheries Research Board of Canada 14(5): 669–681.
Schütz, J., Pukkala, T., Donoso, P. and von Gadow, K. 2012. Chapter 1: Historical
Emergence and Current Application of CCF. In: Pukkala, T. and von Gadow, K.
(eds.) Managing Forest Ecosystems 23: Continuous Cover Forestry. Springer,
Netherlands. p. 1–28.
Seierstad, A. and Sydsæter, K. 1987. Optimal control theory with economic
applications. Elsevier, Amsterdam. 462 p.
Siiskonen, H. 2007. The conflict between traditional and scientific forest management
in 20th century Finland. Forest Ecology and Management 249: 125–133.
83
Sydsæter, K., Hammond, P., Seierstad, A. and Strom, A. 2008. Further Mathematics for
Economic Analysis. Prentice Hall, Essex. 632 p.
Tahvonen, O. 1995. Net national emissions, CO2 taxation and the role of forestry.
Resource and Energy Economics 17(4): 307–315.
Tahvonen, O. 2009. Optimal choice between even- and uneven-aged forestry. Natural
Resource Modeling 22(2): 289–321.
Tahvonen, O. 2011. Optimal structure and development of uneven-aged Norway spruce
forests. Canadian Journal of Forest Research 41: 2389–2402.
Tahvonen, O. 2014. Optimal harvesting of size-structured biological populations. In:
Moser, E., Semmler, W., Tragler, G. and Velinov, V.M. (eds.) Dynamic
Optimization in Environmental Economics. Springer Verlag, Berlin. 355 p.
Tahvonen, O. 2015a. Economics of naturally regenerating heterogeneous forests.
Journal of the Association of Environmental and Resource Economists 2(2): 309–
337.
Tahvonen, O. 2015b. Economics of rotation and thinning revisited: the optimality of
clearcuts versus continuous cover forestry. Forest Policy and Economics, in print.
Tahvonen, O. and Viitala, E.J. 2006. Does Faustmann rotation apply to fully regulated
forests? Forest Science 52(1): 23–30.
Tahvonen, O., Pukkala, T., Laiho, O., Lähde, E., and Niinimäki, S. 2010. Optimal
management of uneven-aged Norway spruce stands. Forest Ecology and
Management 260: 106–115.
Tahvonen, O. and Rämö, J. 2015. Optimality of continuous cover vs. clearcut regimes
in managing forest resources. Manuscript, University of Helsinki.
Tee, J., Scarpa, R., Marsh, D. and Guthrie, G. 2014. Forest Valuation under the New
Zealand Emissions Trading Scheme: A Real Options Binomial Tree with
Stochastic Carbon and Timber Prices. Land Economics 90(1): 44–60.
Thompson, I., Mackey, B., McNulty, S., Mosseler, A. 2009. Forest Resilience,
Biodiversity, and Climate Change. A synthesis of the Biodiversity / Resilience /
84
Stability Relationship in Forest Ecosystems. Technical Series no. 43. Secretariat
of the Convention on Biological Diversity, Montreal. 67 p.
Tol, R. 2005. The marginal damage costs of carbon dioxide emissions: an assessment of
the uncertainties. Energy Policy 33: 2064–2074.
Valkeapää, A. and Karppinen, H. 2013. Citizens' view of legitimacy in the context of
Finnish forest policy. Forest Policy and Economics 28: 52–59.
van Kooten, G., Binkley, C. and Delcourt, G. 1995. Effect of Carbon Taxes and
Subsidies on Optimal Forest Rotation Age and Supply of Carbon Services.
American Journal of Agricultural Economics 77(2): 365–374.
Weitzman, M. 2014. Fat Tails and the Social Cost of Carbon. The American Economic
Review 104 (5): 544–546.
Wikberg, P-E. 2004. Occurrence, morphology and growth of understory saplings in
Swedish forests. Acta Universitatis Agriculturae Suecica. Silvestria 322. 73 p.
Zanchi, G., Pena, N. and Bird, N. 2012. Is woody bioenergy carbon neutral? A
comparative assessment of emissions from consumption of woody bioenergy and
fossil fuel. GCB Bioenergy 4: 761–772.
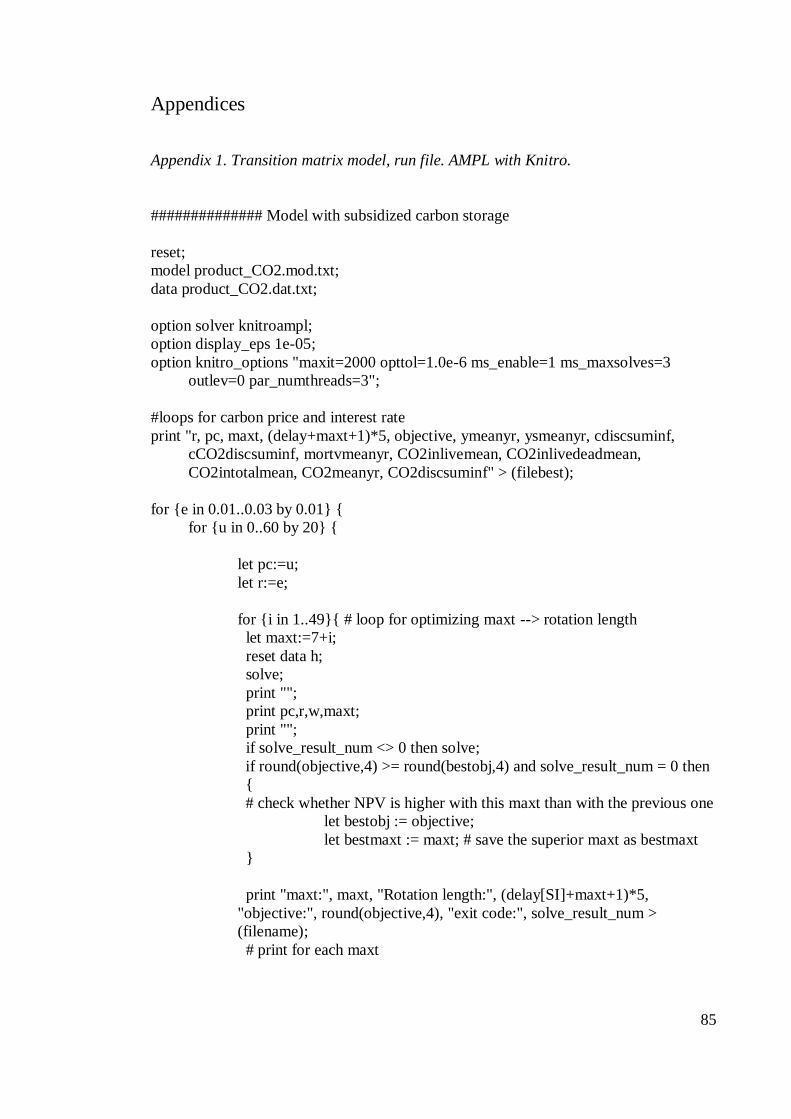
85
Appendices
Appendix 1. Transition matrix model, run file. AMPL with Knitro.
############## Model with subsidized carbon storage
reset;
model product_CO2.mod.txt;
data product_CO2.dat.txt;
option solver knitroampl;
option display_eps 1e-05;
option knitro_options "maxit=2000 opttol=1.0e-6 ms_enable=1 ms_maxsolves=3
outlev=0 par_numthreads=3";
#loops for carbon price and interest rate
print "r, pc, maxt, (delay+maxt+1)*5, objective, ymeanyr, ysmeanyr, cdiscsuminf,
cCO2discsuminf, mortvmeanyr, CO2inlivemean, CO2inlivedeadmean,
CO2intotalmean, CO2meanyr, CO2discsuminf" > (filebest);
for {e in 0.01..0.03 by 0.01} {
for {u in 0..60 by 20} {
let pc:=u;
let r:=e;
for {i in 1..49}{ # loop for optimizing maxt --> rotation length
let maxt:=7+i;
reset data h;
solve;
print "";
print pc,r,w,maxt;
print "";
if solve_result_num <> 0 then solve;
if round(objective,4) >= round(bestobj,4) and solve_result_num = 0 then
{
# check whether NPV is higher with this maxt than with the previous one
let bestobj := objective;
let bestmaxt := maxt; # save the superior maxt as bestmaxt
}
print "maxt:", maxt, "Rotation length:", (delay[SI]+maxt+1)*5,
"objective:", round(objective,4), "exit code:", solve_result_num >
(filename);
# print for each maxt
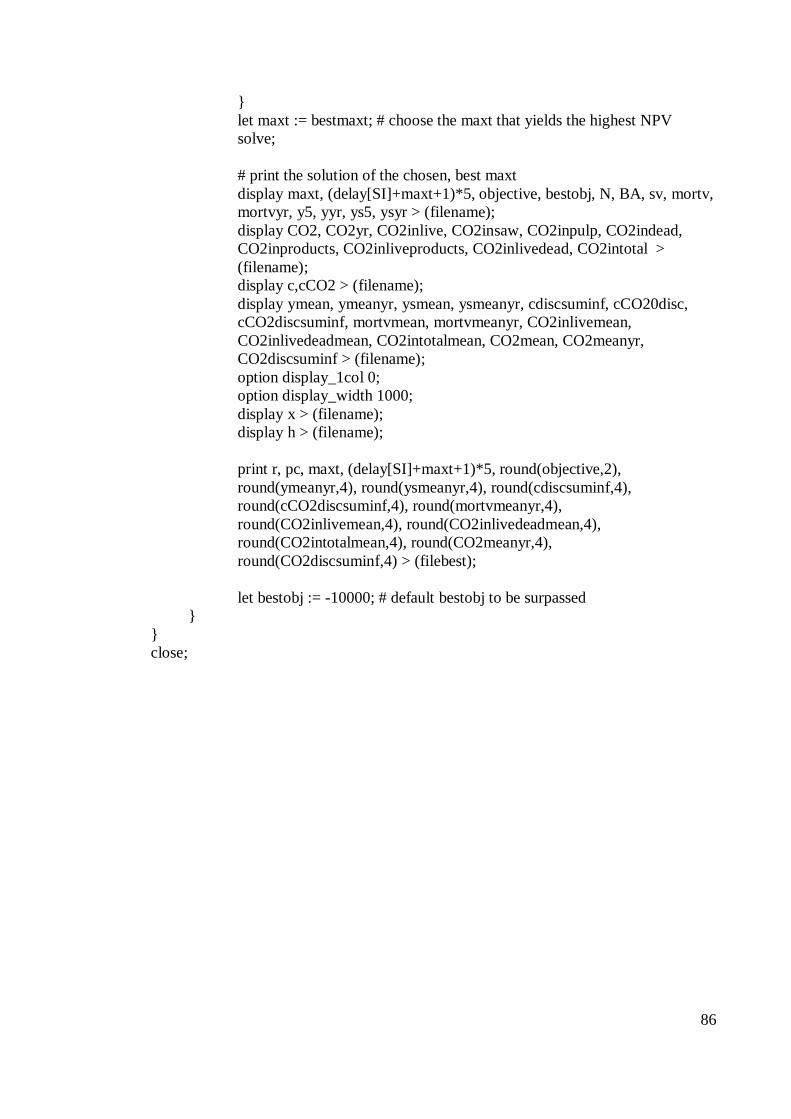
86
}
let maxt := bestmaxt; # choose the maxt that yields the highest NPV
solve;
# print the solution of the chosen, best maxt
display maxt, (delay[SI]+maxt+1)*5, objective, bestobj, N, BA, sv, mortv,
mortvyr, y5, yyr, ys5, ysyr > (filename);
display CO2, CO2yr, CO2inlive, CO2insaw, CO2inpulp, CO2indead,
CO2inproducts, CO2inliveproducts, CO2inlivedead, CO2intotal >
(filename);
display c,cCO2 > (filename);
display ymean, ymeanyr, ysmean, ysmeanyr, cdiscsuminf, cCO20disc,
cCO2discsuminf, mortvmean, mortvmeanyr, CO2inlivemean,
CO2inlivedeadmean, CO2intotalmean, CO2mean, CO2meanyr,
CO2discsuminf > (filename);
option display_1col 0;
option display_width 1000;
display x > (filename);
display h > (filename);
print r, pc, maxt, (delay[SI]+maxt+1)*5, round(objective,2),
round(ymeanyr,4), round(ysmeanyr,4), round(cdiscsuminf,4),
round(cCO2discsuminf,4), round(mortvmeanyr,4),
round(CO2inlivemean,4), round(CO2inlivedeadmean,4),
round(CO2intotalmean,4), round(CO2meanyr,4),
round(CO2discsuminf,4) > (filebest);
let bestobj := -10000; # default bestobj to be surpassed
}
}
close;
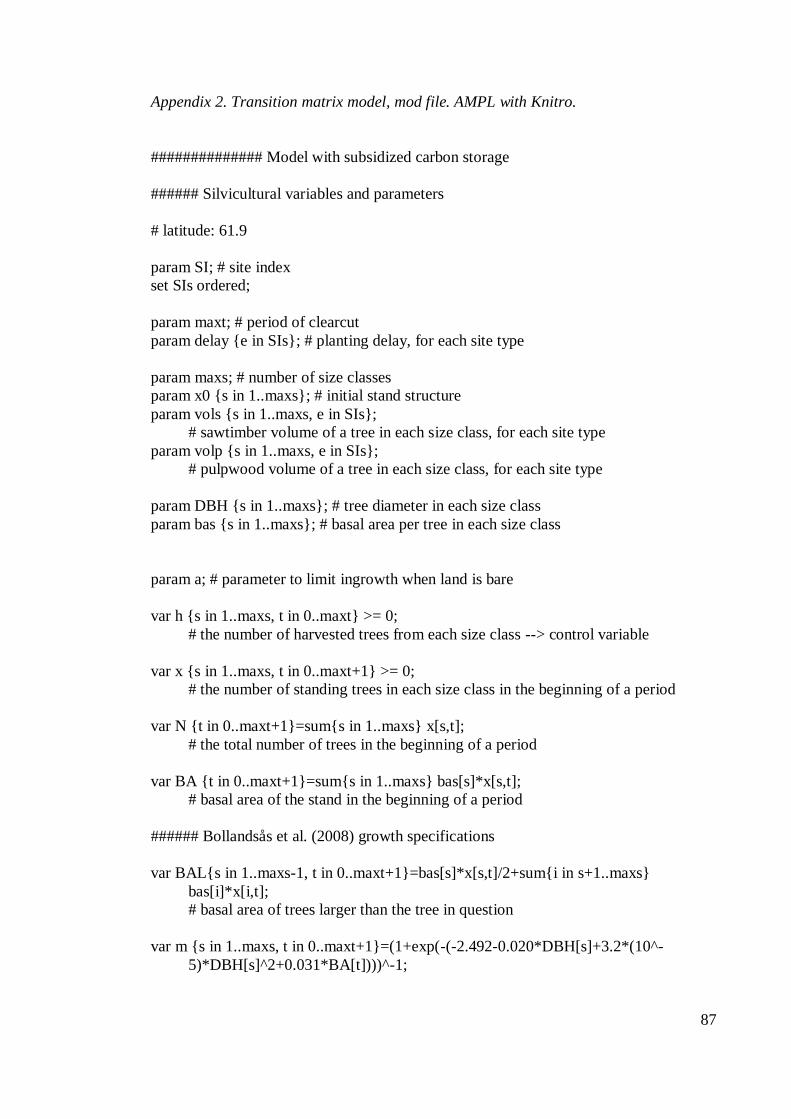
87
Appendix 2. Transition matrix model, mod file. AMPL with Knitro.
############## Model with subsidized carbon storage
###### Silvicultural variables and parameters
# latitude: 61.9
param SI; # site index
set SIs ordered;
param maxt; # period of clearcut
param delay {e in SIs}; # planting delay, for each site type
param maxs; # number of size classes
param x0 {s in 1..maxs}; # initial stand structure
param vols {s in 1..maxs, e in SIs};
# sawtimber volume of a tree in each size class, for each site type
param volp {s in 1..maxs, e in SIs};
# pulpwood volume of a tree in each size class, for each site type
param DBH {s in 1..maxs}; # tree diameter in each size class
param bas {s in 1..maxs}; # basal area per tree in each size class
param a; # parameter to limit ingrowth when land is bare
var h {s in 1..maxs, t in 0..maxt} >= 0;
# the number of harvested trees from each size class --> control variable
var x {s in 1..maxs, t in 0..maxt+1} >= 0;
# the number of standing trees in each size class in the beginning of a period
var N {t in 0..maxt+1}=sum{s in 1..maxs} x[s,t];
# the total number of trees in the beginning of a period
var BA {t in 0..maxt+1}=sum{s in 1..maxs} bas[s]*x[s,t];
# basal area of the stand in the beginning of a period
###### Bollandsås et al. (2008) growth specifications
var BAL{s in 1..maxs-1, t in 0..maxt+1}=bas[s]*x[s,t]/2+sum{i in s+1..maxs}
bas[i]*x[i,t];
# basal area of trees larger than the tree in question
var m {s in 1..maxs, t in 0..maxt+1}=(1+exp(-(-2.492-0.020*DBH[s]+3.2*(10^-
5)*DBH[s]^2+0.031*BA[t])))^-1;
88
# fraction of trees that die during the period, for each size class
var g {s in 1..maxs-1, t in 0..maxt+1}=(17.839+0.0476*DBH[s]-11.585*(10^-
5)*DBH[s]^2-0.3412*BAL[s,t]+0.906*SI-0.024*BA[t]-0.268*61.9)/50;
# fraction of trees that move into the next size class during the period, for each size class
var ING {t in 0..maxt+1}=(43.142*(BA[t]+a)^(-0.157)*SI^0.368*100^0.051)/(1+exp(-
1*(-2.291-0.018*BA[t]+0.066*SI+0.019*100)));
# ingrowth: number of new trees entering the smallest size class
# var ING {t in 0..maxt+1}=0; # to follow Kilkki-Väisänen-Clark model with no natural
regeneration
###### Silvicultural variables and parameters, cont.
var y5{t in 0..maxt} = sum {s in 1..maxs} (vols[s,SI]+volp[s,SI])*h[s,t];
#total yield in a 5yr period
var yyr{t in 0..maxt} = sum {s in 1..maxs} (vols[s,SI]+volp[s,SI])*h[s,t]/5;
# annual total yield
var ys5{t in 0..maxt} = sum {s in 1..maxs} (vols[s,SI])*h[s,t];
# sawtimber yield in a 5yr period
var yp5{t in 0..maxt} = sum {s in 1..maxs} (volp[s,SI])*h[s,t];
# pulpwood yield in a 5yr period
var ysyr{t in 0..maxt} = ys5[t]/5; # annual sawtimber yield
var ymean=(sum{t in 0..maxt}y5[t])/(maxt+delay[SI]+1);
# mean periodic total yield over a rotation
var ymeanyr=ymean/5; # mean annual total yield over a rotation
var ysmean=(sum{t in 0..maxt}ys5[t])/(maxt+delay[SI]+1);
# mean periodic sawtimber yield over a rotation
var ysmeanyr=ysmean/5; # mean annual sawtimber yield over a rotation
var sv{t in 0..maxt+1} = sum {s in 1..maxs} (vols[s,SI]+volp[s,SI])*x[s,t];
#stand volume m3
var dsv{t in 1..maxt}=(sv[t]-sv[t-1])/5; # annual stand growth
var mortv {t in 0..maxt}=sum {s in 1..maxs} m[s,t]*x[s,t]*(vols[s,SI]+volp[s,SI]);
# volume of new dead wood in period t
var mortvyr{t in 0..maxt} = mortv[t]/5; # annual volume of new dead wood in period t
var mortvmean = (sum{t in 0..maxt}mortv[t])/(maxt+delay[SI]+1);
# mean periodic mortality over a rotation
var mortvmeanyr = mortvmean/5; # mean annual mortality over a rotation
var dsvgross {t in 0..maxt}=(sv[t+1]+mortv[t]+y5[t]-sv[t]);
#stand growth before mortality and harvest in 5yr period
###### Economic variables and parameters
param r; # interest rate
param b:=(1/(1+r))^5; # discrete time discount factor
param cc; # clearcut stumpage prices > thinning stumpage prices
89
param ps; # stumpage price for sawtimber
param pp; # stumpage price for pulpwood
param w; # regeneration cost
var c {t in 0..maxt}>=0; # timber revenues received in the end of period t
var cdiscsuminf = (b^delay[SI]*(sum{t in 0..maxt-1}
b^(t+1)*c[t]+cc*c[maxt]*b^(maxt+1)))/(1-b^(maxt+1+delay[SI]));
# discounted timber revenues over the infinite time horizon
###### Carbon storage
param pc; # carbon price
param myy; # amount of CO2 stored in volume unit of wood
### The product adjusted net subsidy system:
param gs; # decay rate of sawtimber products
param gp; # decay rate of pulpwood products
param gd; # decay rate of dead wood
param alfas:=gs/(gs+r); #rate of carbon release after harvest for sawtimber
param alfap:=gp/(gp+r); #rate of carbon release after harvest for pulpwood
param alfad:=gd/(gd+r); #rate of carbon release after harvest for dead wood
### The net subsidy system:
# param alfas:=1;
# net subsidy system: rate of carbon release after harvest for sawtimber
# param alfap:=1;
# net subsidy system: rate of carbon release after harvest for pulpwood
# param alfad:=1;
# net subsidy system: rate of carbon release after harvest for dead wood
### The gross subsidy system:
# param alfas:=0;
# gross subsidy system: rate of carbon release after harvest for sawtimber
# param alfap:=0;
# gross subsidy system: rate of carbon release after harvest for pulpwood
var CO2inlive {t in 0..maxt+1}= myy*sv[t];
# CO2 stock in living stand
var cCO2 {t in 0..maxt};
# carbon subsidy revenues in period t
var cCO20disc = b^(delay[SI])*(pc*CO2inlive[0]);
# carbon sequestration subsidies for the planting delay, discounted
var CO2 {t in 0..maxt}= myy*(sv[t+1]-sv[t]+(1-alfad)*mortv[t]+(1-alfas)*ys5[t]+(1-
alfap)*yp5[t]);
# CO2 net sequestration in period t
90
var CO2yr {t in 0..maxt}= CO2[t]/5;
# annual CO2 net sequestration
var CO2sum = CO2inlive[0]+sum{t in 0..maxt} CO2[t];
# sum of CO2 sequestration over a rotation
var CO2mean = CO2sum/(maxt+delay[SI]+1);
# mean periodic CO2 sequestration over a rotation
var CO2meanyr = CO2sum/(5*(maxt+delay[SI]+1));
# mean annual CO2 sequestration per year over a rotation
var CO2discsuminf = (b^delay[SI]*(CO2inlive[0]+(sum{t in 0..maxt}
b^(t+1)*CO2[t])))/(1-b^(maxt+1+delay[SI]));
# discounted CO2 net sequestration flow over the infinite time horizon (sequestration
during delay included)
var cCO2discsuminf = (cCO20disc+b^delay[SI]*sum{t in 0..maxt}
b^(t+1)*cCO2[t])/(1-b^(maxt+1+delay[SI]));
# discounted carbon revenues over the infinite time horizon (sequestration during delay
included)
var CO2insaw {t in 0..maxt+1}; # CO2 stock in sawtimber products
var CO2inpulp {t in 0..maxt+1}; # CO2 stock in pulpwood products
var CO2indead {t in 0..maxt+1}; # CO2 stock in dead wood
var CO2inproducts {t in 0..maxt+1} = CO2insaw[t]+CO2inpulp[t];
# CO2 stock in wood products
var CO2inliveproducts {t in 0..maxt+1} = CO2insaw[t]+CO2inpulp[t]+CO2inlive[t];
# CO2 stock in living stand and products
var CO2inlivedead {t in 0..maxt+1} = CO2inlive[t]+CO2indead[t];
# CO2 stock in living and dead trees
var CO2intotal {t in 0..maxt+1} = CO2insaw[t]+CO2inpulp[t]+CO2inlive[t]+
CO2indead[t];
# CO2 stock in living and dead trees and products
var CO2inlivemean = sum{t in 0..maxt+1} CO2inlive[t]/(maxt+delay[SI]+1); # mean
CO2 stock in living trees over one rotation
var CO2inlivedeadmean = sum{t in 0..maxt+1} CO2inlivedead[t]/(maxt+delay[SI]+1);
# mean CO2 stock in living and dead trees over one rotation
var CO2intotalmean = sum{t in 0..maxt+1} CO2intotal[t]/(maxt+delay[SI]+1); # mean
total CO2 stock over one rotation
###### Parameters for the optimal rotation loop
param bestobj default -10000;
param bestx {s in 1..maxs, t in 0..maxt+1};
param besth {s in 1..maxs, t in 0..maxt};
param bestmaxt;
91
###### The economic problem
maximize objective:
(-w+cCO20disc+b^delay[SI]*(sum{t in 0..maxt-1}
b^(t+1)*(c[t]+cCO2[t])+cc*c[maxt]*b^(maxt+1)+cCO2[maxt]*b^(maxt+1)))/(1-
b^(maxt+1+delay[SI]));
# maximize the present value of net revenues from this and all future rotations
#(sum{t in 0..maxt}y5[t])/(maxt+delay[SI]+1); # MSY objective function
subject to restriction1 {t in 0..maxt}:
x[1,t+1]=ING[t]+(1-m[1,t]-g[1,t])*x[1,t]-h[1,t];
# trees in the smallest size class in the beginning of period t+1
subject to restriction2 {s in 1..maxs-2, t in 0..maxt}:
x[s+1,t+1]=g[s,t]*x[s,t]+(1-m[s+1,t]-g[s+1,t])*x[s+1,t]-h[s+1,t];
# trees in size class 2...maxs-1 in the beginning of period t+1
subject to restriction3 {t in 0..maxt}:
x[maxs,t+1]=g[maxs-1,t]*x[maxs-1,t]+(1-m[maxs,t])*x[maxs,t]-h[maxs,t];
# trees in the largest size class in the beginning of period t+1
subject to restriction4 {t in 0..maxt}:
c[t] = sum {s in 1..maxs} (ps*vols[s,SI]+pp*volp[s,SI])*h[s,t];
# timber revenues received in the end of period t
subject to restriction5 {s in 1..maxs}:
x[s,0] = x0[s];
# initial stand structure
subject to restriction6 {s in 1..maxs, t in 0..maxt+1}:
x[s,t]>=0;
# non-negative number of trees in each size class
subject to restriction7 {t in 0..maxt}:
cCO2[t] = pc*myy*(sv[t+1]-sv[t]+(1-alfad)*mortv[t]+(1-alfas)*ys5[t]+(1-
alfap)*yp5[t]);
# carbon net subsidies received in the end of period t
subject to restriction8a:
CO2insaw[0] = 0;
#initial CO2 stock in sawtimber products
subject to restriction8b {t in 0..maxt}:
CO2insaw[t+1] = CO2insaw[t]*(1-gs)^5+myy*ys5[t];
#carbon stock in sawtimber wood products in the beginning of period t + 1
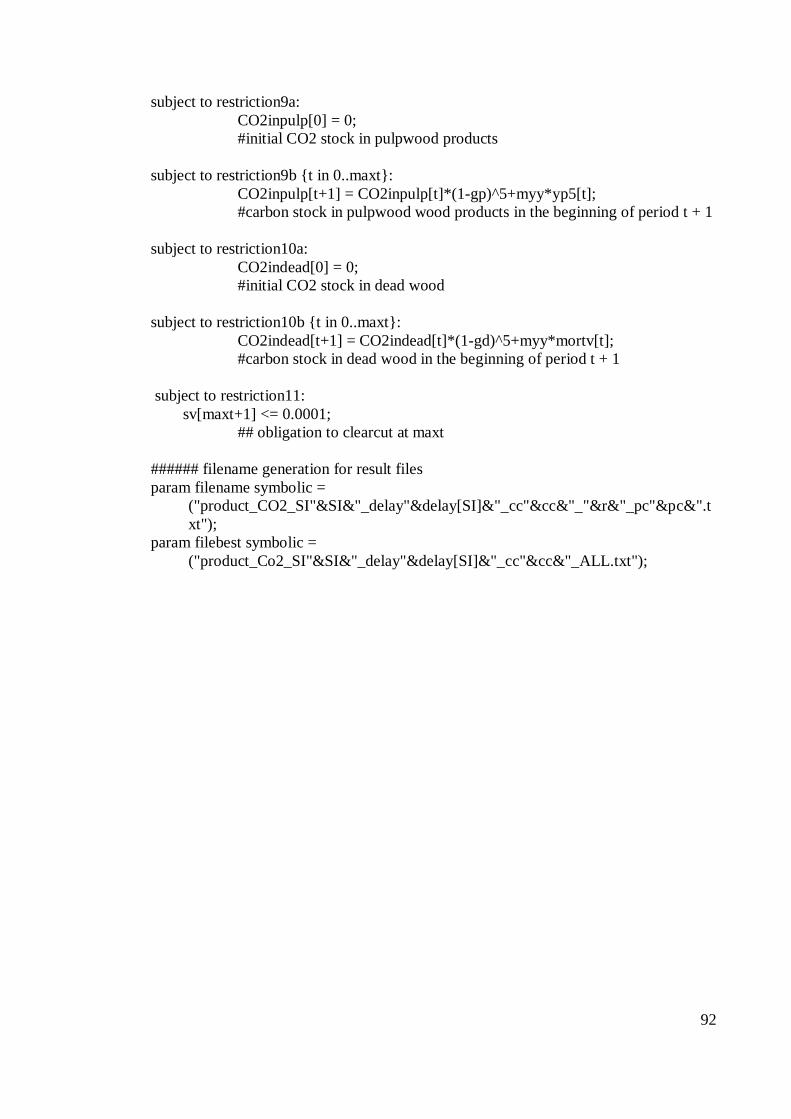
92
subject to restriction9a:
CO2inpulp[0] = 0;
#initial CO2 stock in pulpwood products
subject to restriction9b {t in 0..maxt}:
CO2inpulp[t+1] = CO2inpulp[t]*(1-gp)^5+myy*yp5[t];
#carbon stock in pulpwood wood products in the beginning of period t + 1
subject to restriction10a:
CO2indead[0] = 0;
#initial CO2 stock in dead wood
subject to restriction10b {t in 0..maxt}:
CO2indead[t+1] = CO2indead[t]*(1-gd)^5+myy*mortv[t];
#carbon stock in dead wood in the beginning of period t + 1
subject to restriction11:
sv[maxt+1] <= 0.0001;
## obligation to clearcut at maxt
###### filename generation for result files
param filename symbolic =
("product_CO2_SI"&SI&"_delay"&delay[SI]&"_cc"&cc&"_"&r&"_pc"&pc&".t
xt");
param filebest symbolic =
("product_Co2_SI"&SI&"_delay"&delay[SI]&"_cc"&cc&"_ALL.txt");
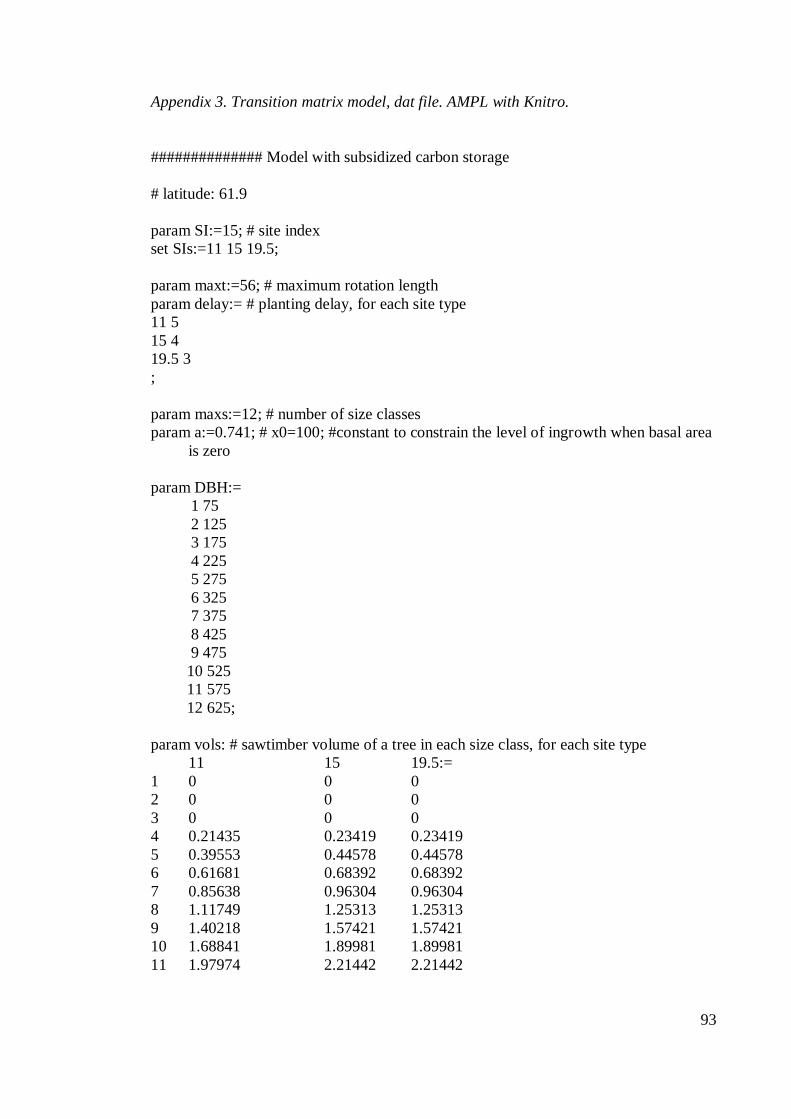
93
Appendix 3. Transition matrix model, dat file. AMPL with Knitro.
############## Model with subsidized carbon storage
# latitude: 61.9
param SI:=15; # site index
set SIs:=11 15 19.5;
param maxt:=56; # maximum rotation length
param delay:= # planting delay, for each site type
11 5
15 4
19.5 3
;
param maxs:=12; # number of size classes
param a:=0.741; # x0=100; #constant to constrain the level of ingrowth when basal area
is zero
param DBH:=
1 75
2 125
3 175
4 225
5 275
6 325
7 375
8 425
9 475
10 525
11 575
12 625;
param vols: # sawtimber volume of a tree in each size class, for each site type
11 15 19.5:=
1 0 0 0
2 0 0 0
3 0 0 0
4 0.21435 0.23419 0.23419
5 0.39553 0.44578 0.44578
6 0.61681 0.68392 0.68392
7 0.85638 0.96304 0.96304
8 1.11749 1.25313 1.25313
9 1.40218 1.57421 1.57421
10 1.68841 1.89981 1.89981
11 1.97974 2.21442 2.21442
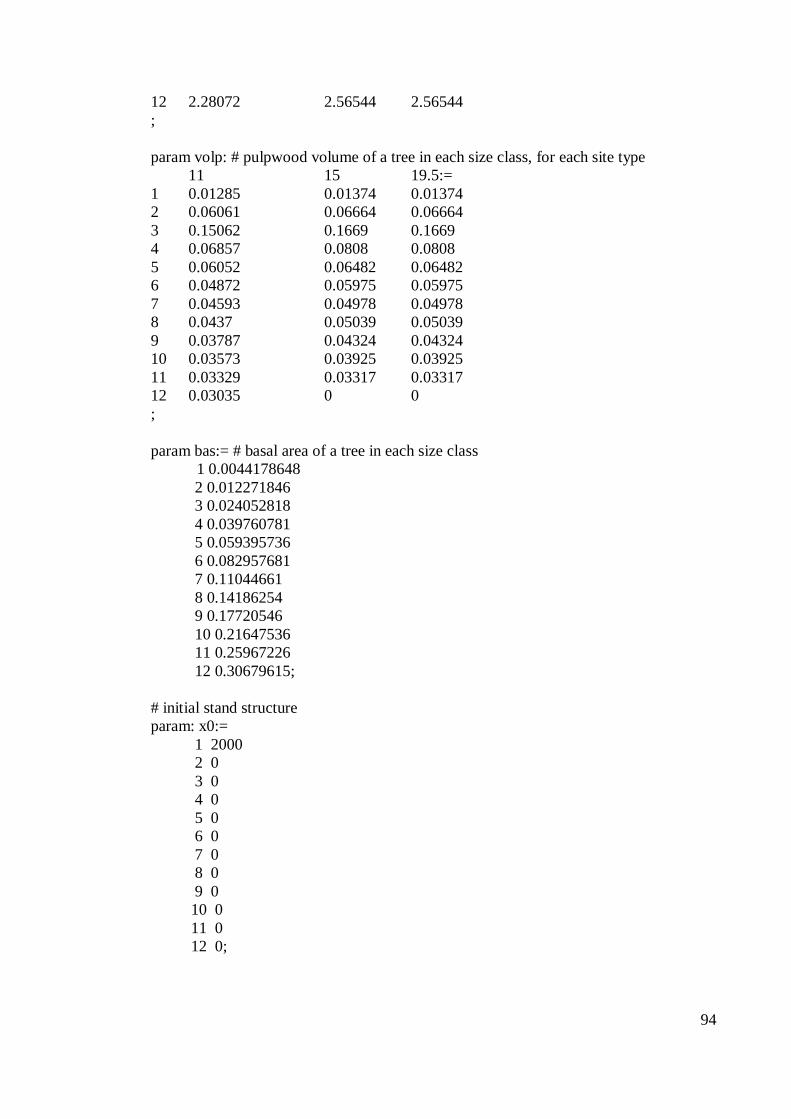
94
12 2.28072 2.56544 2.56544
;
param volp: # pulpwood volume of a tree in each size class, for each site type
11 15 19.5:=
1 0.01285 0.01374 0.01374
2 0.06061 0.06664 0.06664
3 0.15062 0.1669 0.1669
4 0.06857 0.0808 0.0808
5 0.06052 0.06482 0.06482
6 0.04872 0.05975 0.05975
7 0.04593 0.04978 0.04978
8 0.0437 0.05039 0.05039
9 0.03787 0.04324 0.04324
10 0.03573 0.03925 0.03925
11 0.03329 0.03317 0.03317
12 0.03035 0 0
;
param bas:= # basal area of a tree in each size class
1 0.0044178648
2 0.012271846
3 0.024052818
4 0.039760781
5 0.059395736
6 0.082957681
7 0.11044661
8 0.14186254
9 0.17720546
10 0.21647536
11 0.25967226
12 0.30679615;
# initial stand structure
param: x0:=
1 2000
2 0
3 0
4 0
5 0
6 0
7 0
8 0
9 0
10 0
11 0
12 0;
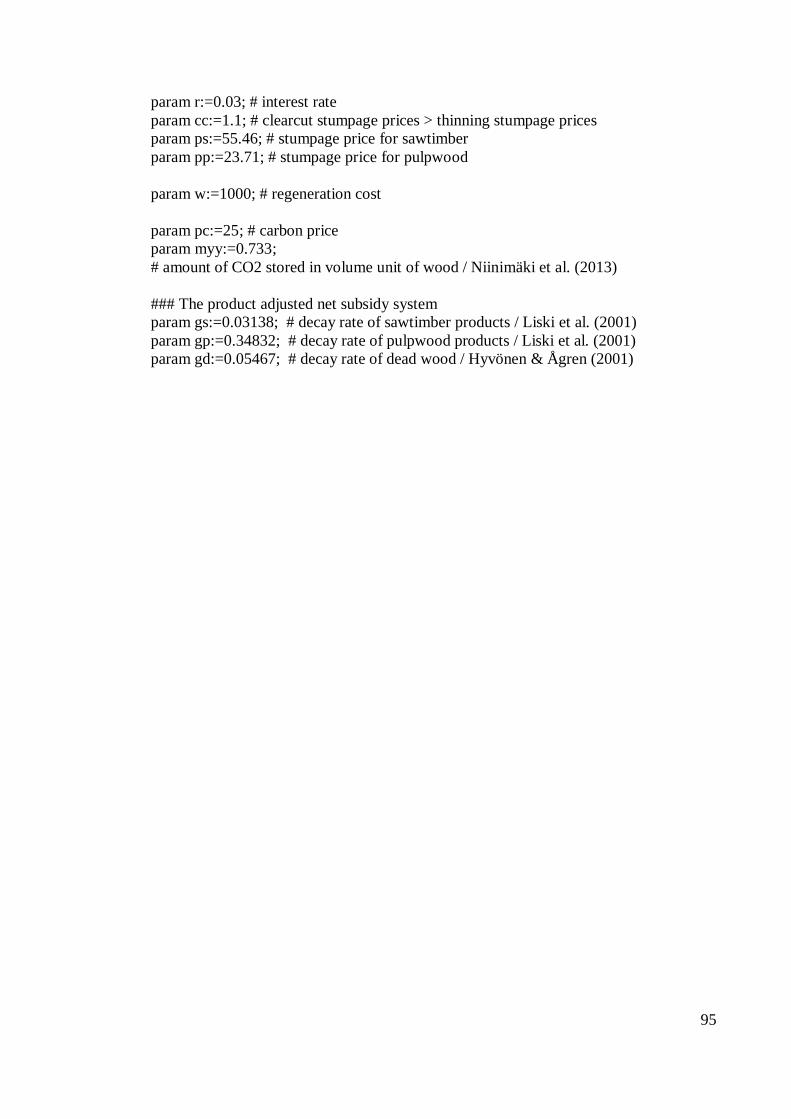
95
param r:=0.03; # interest rate
param cc:=1.1; # clearcut stumpage prices > thinning stumpage prices
param ps:=55.46; # stumpage price for sawtimber
param pp:=23.71; # stumpage price for pulpwood
param w:=1000; # regeneration cost
param pc:=25; # carbon price
param myy:=0.733;
# amount of CO2 stored in volume unit of wood / Niinimäki et al. (2013)
### The product adjusted net subsidy system
param gs:=0.03138; # decay rate of sawtimber products / Liski et al. (2001)
param gp:=0.34832; # decay rate of pulpwood products / Liski et al. (2001)
param gd:=0.05467; # decay rate of dead wood / Hyvönen & Ågren (2001)