optimal competitive marketing behavior in oligopoly
TRANSCRIPT


LIBRARY
OF THE
MASSACHUSETTS INSTITUTE
OF TECHNOLOGY


OPTIMAL COMPETITIVE fJARKETING BEHAVIORIN OLIGOPOLY
6A3-73
Jean-Jacques Lambin*, Philippe A. Naert**and Alain V. Bultez***
January, 1973
MASSACHUSET-
INSTITUTE 01 ECHNOLOG
50 MEMORIAL DRIVE


f..1ASS.

. Z_..
RECEIVED
APR 11 1973
M. I. T. LIBRARIES

INTRODUCTION
The problem of marketing mix optimization has received
considerable attention in the literature. For the profit maximizing
firm such an optimization is the extension of the "marginal revenue
equals marginal cost" rule to determine optimal levels for all mar-
keting instruments rather than just price. Dorfman and Steiner deri-
ved an optimization rule for a monopolistic firm [9], which was sub-
sequently applied by Palda [27l and Lambin [20l in empirical studies.
A large number of normative models of competitive mar-
keting behavior in oligopolistic markets have also been formulated.
Various assumptions related to industry demand (stable versus expan-
sible) and to the type of competitive reaction (follower versus lea-
der) have lead to a large variety of models. Many of these are theo-
retical in nature and have not been directly applied, such as the
competitive models, by Mills [231, Gupta and Krishnan [14. 15, 19],
Shakun [29l. Baligh and Richartz [2], Kotler [161. Naert [241. and
others. Examples of empirical studies dealing with stable industry
sales are Lambin ( fo 1 lower- type reaction) [221 and Telser (leader-
typp reaction) [sol, and with expansible industry sales are Schultz
(follower) [231 and Bass (follower) [3].
In those studies where competitive reaction is explicit-
ly taken into account (leader), it is implicitly assumed that compe-
titors react with the same marketing instrument as the one which
C37234


causes their reactions, that is, they react to a change in prices
by a change in price, to a change in advertising by a change in ad-
vertising. We will identify this kind of reaction with the simple
competitive reaction case. It is more realistic, however, and more
1
in the spirit of the very concept of marketing mix , to consider what
we will call multiple competitive reaction , that is for example, a
competitor may react to a change in price not just by changing his
price, but also by changing his advertising and, possibly other mar-
keting instruments as well. To our knowledge no optimality condi-
tions have been derived yet for the multiple competitive reaction
case .
In this paper we will remain within the realm of static
analysis. First, we will derive profit maximization conditions for
the multiple competitive reaction case. We will then demonstrate
through a series of corollaries how optimization rules, previously
developed, are special cases of our more general rule. The second
part of this article will be devoted to the estimation problems ari-
sing in a multiple competitive reaction framework. Through the ana-
lysis of the data collected on a stable industry demand market, evi-
dence of the importance of considering multiple competitive reactions
will be presented.


I. PROFIT rAXiniZATION : A GENERALIZATION
First, we will derive optimality conditions in terms of
the vector of total sales elasticities E . We will then show howq .u
to decompose E in its various components related to industry sa-q.u
les effects and marKet share effects. The notation adopted is defi-
ned in Tab le I
.
INSfRT TABLE I 430UT HERE
3
Consider the following company profit function
(1) Tr = q.[p-c.(q,x}]-s
For the profit maximizing producer, optimality conditions are obtai-
ned by setting the derivative of it v/ith respect to each of the deci-
sion variables equal to zero . Let u' = (p,s,x].
Sir 8q 9P 9C 9c gq 3s= (p - c) q-( - ^ • ) =
3u 9u 9u 9u 9q 9u 9u
Let D be a (n X n) - here (3x3] - diagonal matrix of the elementsu
^
of vector u. Premu 1 1 ip ly i ng 9tt/9u by D /q,
3c^ D 9q 9p 9c. 9s(p. c -q .-1] . -i^ .— . D D
i- -ii ._ =
9q q 9u " 9u "^ 9u q 9u
With marginal cost MC


-— • -r— •= E the following optimality condition obtc. ins3q 3u q. u & ^ j
12)9c.
E • (P - no + I* Ip. -s/q. -Xq.U ^H H
g^
where I is the identity matrix. From which can deduct
(3)
Equation (3) is generally known as the Dorf man -S t e i ner theorem (or
rule]. In fact, it merely states that at optimality. marginal reve-
5
nue must equal marginal cost for each marketing instrument . The
Dorf man-St ei ner rule is generally written in the following form :
(4) P 1n °ij =
ri ._ = —q.p q.x X ,.
. 8q _,• 9q/3x c
ihere p = p • —• , and n = v , ^
' • -ds q,x 3c/ 9x q
Equation (4) holds, sine
IBR .
pq s 9q 9qn = ^^-^ • — • — = p • ~ = V , and
s q.s s q 3s '^9s
£ . q> X _ p ^ 3q/ 9x . x^ _ £ .•
X * 9c/3x "X
* 3c/3x * q'
x* "^q.x
Equations t3) and (4) are thus equivalent.


l-rcm equation (2) one can easily dei'ivethe optimal values for the
decision variables. In vector notation, we obtain :
(5J u = \t-^ 1• D^ . h. -q .
q.u
where D^ is a diagonal matrix of the elements of vector EE q.uq.u ^
We now want to show how the vector E of total salesq. u
elasticities can be decomposed into various elements in the case of
an oligopoly. First, \-je can distinguish between a market share effect
and an industry sales effect. And secondly, we can separate direct
effects (assuming no competitive reaction) from indirect effect (com-
petitive reaction effects). The theorem proposed below traces the
linKs between tctal sales elasticities, industry demand, market share,
and competitive reaction elasticities.
THEOREM
The vector of elasticities of company sales with respect
to its decision variables is equal to a matrix partitioned into an
identity matrix and the matrix of competitive reaction elasticities
postmultiplied by the sum of the vectors of industry sales and mar-
ket share elasticities, i.e. E = [lyR] • [F„ + E ]
Proof : Company sales can be written as industry sales times market
share :


q = • m
q = Q^ (u, U. 2) ' m^ (u,U)
The derivative of q with respect to the decision vector u is
3Q, 9U 8(
3u 9U 9u
3U 3m
•—
—
-
9u 9U
9u
9U, 9U.
9u 9u
9Ur
du
Premu 1 1 ip 1 y i ng by D /q.
we obtain
D 9q D^ 9Q^ D^ 3U 30^ ^9m^
^9U 9m^
"q" Tu ~Q
* 9u "q" * Tu *'9 U
"'
m *u
'
3u m *u
*"Fu ' 9lj
whi ch reduces to
(6) E = E_ R • E„,, E + R • E
q .1 u 0- . u 0-p . U m.,u ni.,U
(7) E = [I.R] • [E^ * E ]
q.u Ot m '
The optimality conditions are then obtained by substituting the ele-
ments on the right hand side of equation (7) for the elempnts of E
in equation (2 ) .
q.u


COROLLARIES
The optimization rules used in the empirical studies re-
ferred to in the introduction can be derived very easily from corol-
laries to the theorem. In deriving these corollaries, we will use
both forms of the theorem as obtained in equations (6) and (7). When
we use the phrase "no competitive reaction" we mean that the company
in deciding on values for its decision variables assumes no change in
the values of competitors' decision variables. That is the case of a
follower or a Cournot-type oligopolist. "Competitive reaction" will
refer to the case where competitive reactions are explicitly taken
into account in determining values for the decision variables. This
7
is the case of a leader, as defined by Stackelberg .
MON_OPOLY_AN_D_MONOPOLlST_IC_ COMPETITION^
Coro 1 lary 1 : In monopoly q = 0, and U and R do not exist. It follows
that :
(6) E = E„q, u 0^, u
In a monopolistic competition situation, each firm faces its own de-
mand curve and no industry demand is defined. This is the case deri-
ved by Dorfman and Steiner [9], and applied by Palda \27], and Feld"
stein [13] to study cases of monopolistic competition in the drug
industry, and by Lambin for a frequently purchased consumer product
[20].


OLiGOPOLi a;:p S_TAB_LE INDUSTR1'_D,MAND (E = 0)Qrp
elasticities R = 0. In which case :
(9) E = F
Wit. a .ultlpllctlvs „..Ket sH.re function of t.o -roUowln, t
n * PI
ype
s i. .1211 i
It is easil y seen that
(ID) E = - E - F
Equation (7) then reduces to
Mn E = Eq. u m . u
This has been used by Lambin in
consumer durable good [22].
a study of a low price
Sometimes one use'- r^^r<-c=^ ~kJSB. market share functions with the de-cision variables in share form. e...
P P
'm^.pOm. , s'


9.
For this type of marKet share function it is ea-ily
shown that
(12) ^m^.U " °U° * ^mj.u°
where D q is a diagonal matrix of the elements of vector
-^^ ^ ^ ' ^2 ^ ^2^n ^ ^
Equation (9) can then be written as
''^' ^.u = %o 'E^^^^.
Equation (13) is appropriate for Cowling and Cubbin's study of the
car market in the United Kingdom [8], altough they implicitly assu-
med Eq . u m , u'
Corollary 3 : Simple Competitive Reaction
R * R^, where R. has the same diagonal elements as Rd d
but has zero off-diagonal entries. Equation (7) becomes :
(14) E = [I'R^l • Eq, u d I
and in the special case of a market share function in relative form,


(15) E = [I - R^] • E
since according to equation (10'
10,
E = [I.R,]q, u d
[I.R^l .
an expression equivalent to equation (15). Telser, in his study of
advertising in the cigarette industry [30], derived a relation bet-
ween absolute advertising elasticity r\ and relative elasticity
n * , which is the advertising equation in (15). For a comparison
of Lambin's results [221, and Telser's findings, see Naert [251.
We may also observe that for all cases with stable in-
dustry demand :
E = Eq, u m , u
Using this in equation (15) gives
flS^ E^,
= [I - R^l • E^ ,
m,
u
d m . , u
which is the form actually used by Telser.
Coro 1 lary 4 : Multiple Competitive Reaction
Only En = 0, end hence


11.
(17) E = [I.R] • Eq.u m^
or with the market share function in relative form
(IB) E = [I - R] • Eq.u I
The special case of equation (IB) has been derived by Bultez [6]
We refer to section II for an empirical example.
OLI_GOPqLY_ AND EXPAllSI_BLE_INDUST_RY_ DEMAND (E ^ 0)
Corollary 5 : No Competitive Reaction. R = 0, and equation (6) beco-
mes :
(19) E = E„ + Eq.u 0- . u m . ,
u
With the market share function in relative form this becomes
(20) E = E„ * Eq.u 0-p . u m , u
The study by Bass on advertising and cigarettes is of this kind [3].
Given a market share function with the decision variables
In share f orm, eoua t i on (19) can be written as :
(21) E = E^ D,,o • E^ _nq.u 0^ . u U m , u


12
Equation (21) is thp relevant form of equation (6) for Schultz' stu-
dy of competition between airlines in a two-city market [28].
Corollary 6 : Simple Competitive Reaction. R = R , and equation (5)
(22) E^,,
= n.R.l • [E * E^ ]q » u d m
Telser's study of advertising and cigarettes contains a relation equi-
valent to (22) for advertising [3D]. This equivalence is demonstrated
intheappendix.
With the market share function in relative form one gets
(23) E_ = [I.R^] • E„ * [I - R^] • E^ .*q , u d'i'
Core 1 lary 7 : Oligopoly - Expansible Industry Demand - Multiple Com-
petitive Reaction - Specific Functional Form for Market Share.
The theorem holds for any kind of market share function-
In the special case of a market share function with the decision va-
riables in relative form, we find :
(24) E = [I.R] • E„ + [I - R] • E i
q I u Q_ m . , u
a result also derived by Bultez [6].


13
The theorem and corollaries 2 to 6 are succintly summa-
rized in Tab le II .
INSERT TABLE I I ABOUT HERE
Corollaries 2 to 7 demonstrate how total sales elasti-
cities relate to industry sales and market share elasticities for
various kinds of competitive reaction in different types of oligopo-
lies. In each case, we have presented this relationship in general,
and also for specific forms of the market share function. For each
corollary wo have referred to at least one application, except for
the multiple competitive reaction cases. Empirical evidence demons-
trating the importance of considering multiple competitive reaction
will be presented in the following section.
Figure 1 illustrates the explicit decomposition of nq , s
for the cases considered in this section.
INSERT FIGURE 1 ABOUT HERE


14.
II. THE EMPIRICAL STUDY
The objective of this section is to present an empiri-
cal application of the multiple competitive reaction concept intro-
duced in the first part of this paper. The product studied is a low
price consumer durable good having reached the saturation phasis on
its life cycle curve. The market is dominated by three brands which
represent altogether approximately 90 % of total industry sales.
Firms A, B and C manufacture different brands of the same general
product category. They do not offer, however, identical quality nor
do they charge identical prices. Advertising expenditures represent
in each case a significant but variable proportion of total sales
revenue. Since primary demand is stable, all the increased sales of
a given firm come necessarily at the expenses of its rivals and con-
sequently the degree of recognition of mutual interdependence is very
high. Thus, the market has the structural characteristics of a diffe-
rentiated oligopoly.
The data available for this study are fairly reliable.
Market shares, retail prices and distribution rates come from a
dealer panel. These panel data, which are purchased by the three
firms are available on a quarterly basis from 1960 to 1966 and over
four geographic regions. Company sales data come from company sour-
ces and total industry sales can also be estimated through statistics
published by governmental agencies. Media advertising expenditures
(press, radio and television) per brand, month and region are provi-
ded by a commercial service from which monitors the media and values


15
time and space at the rate card list price. Point of sales promo-
tion expenditures arc not included in the sample. Nedia expenditures
represent about 85 \ of total advertising outlays. Each brand quali-
ty is estimated by a synthetic index, derived from a semantic diffe-
rential scale [26] ; empirically selected product attributes where
then subjectively rated, period by period, by the marKeting staff
of one of the firms.
Bain [1] suggests that product differentiation inhibits
changes in the percent of the market held by the oligopolistic firms
In contradiction with this view, a high degree of market share ins-
tability is observed in this market during the period under study.
10The estimated indices of market share instability are presented
for each region in Table III. In 1960, the partition of the market
among the three firms - the others not included - was as follows :
30.2 %, 37.9 % and 31.9 \ for firms A, B and C respectively. The
dominant fact of the 1962-66 period is the aggressive and successful
marketing strategy of firm B, whose market share increased from
32.8 \ in 1962 to 66.1 % in 1966. As a result of firm B aggressive
policy, drastic changes occurred in the degree of market concentra-1 1
tion. The Herfindahl index of Table III, graphically represented
on figure 2, illustrates this fact
INSERT TABLE III AND FIGURE 2 ABOUT HERE


16,
In acsuming the leadership of the market, firm 3 pla-
ced heavy emphasis on advertising a"d its share of total industry
advertising expenditures increased from 18.9 % in 1962 to 61.7 %
in 1965. Because of the ratchet nature of advertising and of reac-
tions from the competing firms, total (deflated) industry adverti-
sing expenditures have dramatically escalated and were four times
higher by the end of the period studied. The advert i si ng- sa Ics ra-
tios of the firms are presented in Table IV. They show that adver-
tising has been particularly instrumental in the growth of firm's
B marKet position and present evidence of strong competition by
means of advertising.
INSERT TABLE IV ABOUT HERE
Selected ordinary 1 eas t - square s estimates of market
share elasticities with respect to price, quality and advertising
are also presented in Table V. These results suggest that price
and quality have also played a significant role since a significant
part of the firms market share variance can be associated, not only
with changes in advertising intensities as expected in oligopoly,
but also with price and quality adjustments. Thus, the firms stra-
tegy has been that of tne marketing mix. In view of this comptiliti-
ve situation it is of interest to see how the competing firms have
reacted to the aggressive policy of firm B and, successfully or not,
adjusted their own marketing variables to the new competitive situa-
tion created by the leader. The multiple reaction functions concept


17
should be a „ instructive analytical tool for that purpose,
INSERT TABLE V ABOUT HERE
ESTIMAlIOJ^_Ol THE C_OrFETlTlVl RJAJTJOJJLASTICIJIJS,
AS pointed out Oy Bre.s [Si. e.poctod rival re^pons. Is
„„oertaln ..d Has o tl.o dl.snslon as .ell as an e.t.ot dimension.
0. th. two o.estlons, .ow will t.o rival --espood and How soon will
.e respond, the latter Is not less relevant tHan the for.er. T.e
tl„ln, o. expected oo.petitlve reaction to price cnan.es Is .ad>ca-
,, different fro™ the tl.ln. of expected rival reactions to cnan.es
in tne non-price variables sucH as advertising and puaUtv Price
,hile variations in
variations can be put into action immediately, wt
.ality attributes often require technological research. Similarly,
limitations and of the time required for theq
because of media spac
preparation of an advertising ca»pal.n, competitive reaction Pv
„eans of advertising are generally slower than price reactions.
Thus, the functions are as follows :
"P.P 'P.=. x"'"-"
Pt V Pt =t "t
and sl^llarlv. Put la..ed. for advertising and duality. The douPle
.o.arlth.lc for™ is adopted here to cope explicitly with the inter
,,,,„, pattern existing amon, the .arKetin, varlaOles. Thus, the
matr IX of reaction elasticities [R]. is constant


The periodicity of the data used to estjma'.^ t h r- Key-
porameters is annual because sales being very concentrated in one pe-
riod of the year, it is practically impossible for competition to re-
act within a shorter period of time. By pooling the data over time
and regions we obtain a total of 28 yearly observations. However, sin-
ce the quality of products and the prices charged to the consumers
are identical across regions, we only have 7 degrees of freedom left
for these variables.
On the basis of the 1 eade r- f o 1 1 ower reaction theory we
designed various simultaneous equation models and estimated them usinj
12the well-known two-stage le as t
- squares method in order to test one
major assumption, namely : interdependence between P, S and X, which
would result from the followers full marketing mix orientation. Becau-
se of the postulated fundamental dependence of P, S and X on the same
three leader's decision variables p, s and x, we wondered whether the
detected dependence between P. S and X might not merely be due to a
1 3
spurious correlation effect. The test we devised was unconclusive
Furthermore, the contemporaneous covariances of the residuals across
equations were not sufficiently high to justify the application of
the joint generalized least- squares technique [32, pp. 295-311].
As a result of this preliminary and rather unsuccessful
econometric investigation, we turned back to a much simpler set of
independent equations to estimate [R]. We used then the Cochrane-
Orcutt [CDRO iterative procedure [32, pp. 253-256]. The results are
presented in Table VI.


19.
INSERT TABLE VI A30UT HERE
The direct reaction elanticities cre all three positive
and statistically significant at the 97.5 per cent level or higher. Their
order of magnitude imply fairly strong response from rivals to the lea-
der's moves in price and quality. As expected in the phase of innova-
tive maturity the high quality reaction elasticity suggests an almost
explosive reaction pattern in terms of product quality adjustments.
Significant support is also given to the multiple reac-
tion concept, since three out of six indirect reaction elasticities
( of
f
-diagona 1 cellsJ are significant. The most significant indirect
reaction elasticities are observed in the quality reaction function
(despite the number of degrees of freedom left}. The signs of the pri-
ce and advertising variables are as expected. They indicate that brand
B's competitors not only have reacted in terms of product quality ad-
justments to the leader's move In quality, but also to the leader's
move in price and advertising. In the advertising reaction function,
the positive sign of the price variable is surprizing at first sight.
We may have expected, indeed, a reverse counteraction, i.e. an In-
crease in competitor's advertising to annihilate the leader's aggres-
siveness in price. In fact, this non - i n t ui t i ve result is simply the
manifestation of brand B's competitors failure to counteract effi-
ciently. During the period under stuay, brand B has consistently do-
minated his rivals not cnly in terms of his pr oduct - qua 1 1 ty ratio,
but also in terms of its advertising intensity. Thus, this positive


20,
sign may sirr.ply reflect the passivity of brand B's competitors who
r.over succeeded to fill up their gap vis-^-vis the leader. By drama-
tically Increasing itz share of total Industry advertising expendi-
ture (up to 65 %) . brand B has prevented its rivals from effective
conteraction by means of advertising. In other words, competition
was unable to follow the advertising escalation in order to compen-
sate for this price-quality gap. A further confirmation of the inter-
pretation is given by the modest order of magnitude of the direct ad-
vertising reaction elasticity.
Thus, those results seem to be consistent with the com-
peting firms actual marketing behavior. They also support the propo-
sition that the firm competitive behavior must be analyzed within
the context of the whole marketing mix.
ESTIHAT I ON_0F T^HE LEADER^S_S ALE_SJ^ LA ST I_CIT I_E S_
We now report results obtained when we assume a simul-
taneous dependence between the level of advertising expenditures and
the level of sales or market share since the industry demand is sta-
ble. A static and a dynamic version of the model were estimated using
the instrumental variables method (equivalent to the two-stage least-
squares in this case). Brand B's market share elasticities are repor-
ted in Table VII.
INSERT TABLE VII ABOUT HERE


21.
In both static and dynamic versions tlie signs and ab-
solute values of fr.s oaramcters are as expected and are comparable
with the ordinary leas t- squares estimates of Table V. They are all
msignificant at the 95 per cent level or higher . In the static mo-
del, the test for serial correlation is performed by calculating the
Durbin statistic d based on the residuals from the multiple regres-
sion of [ m T) .• s ] on all the predetermined variables of them , s « t
system, whether or not they occur in the fitted equation with non-
zero coefficients [10, p. 377]. Referring to Durbin and Watson ta-
ble [32, pp. 724-725], we realize that d indicates a positive auto-
correlation. In the dynamic version, the test for serial correlation
is carried out by testing the significance of the lagged residuals
in the regression of the residuals on the lagged residuals and the
explanatory variables [33, pp. 420-421]. The d statistic of the dy-
namic market share model is in fact the t statistic corresponding to
the lagged residuals coefficient. We can thus conclude that the residuals of
1 5
the dynamic market share model are uncorrelated • From a statisti-
cal specification point of view, the dynamic version of the model
seems preferable to the static version. However, given the charac-
teristics of the market and the periodicity of the data used, the
static version is subjectively perfectly acceptable. As both versions
have their merits we will continue to take both of them into account
for the rest of the analysis.
Having ascertained the validity of the empirical re-
sults we may now return to the theorem we proposed in the first sec-


22
tlon of this paper. The leader's sales elasticities are to h"^ deri-
ved. In this case, from the application of corollary 4, i.e.
E = [I - R] • E ^. Table VIII shows how from the [R] matrix
of table VI and the E ^, vectors extracted from table VII, the re-m . u*
suiting E vectors arc obtained. Equilibrium long-run market share
elasticities, defining the full impact over time of changes in price16
advertising and quality, wers also computed . Except for product-
quality, no important disparity appears between these long-run elas-
ticities derived from the dynamic model and the elasticities deri-
VRd from the static model.
INSERT TABLE VIII ABOUT HERE
ECONOMIC INTERPRETATION OF THE RESULTS
The E vector contains the total sales elasticities
taking into account the reactions of competitors while the elements
of vector E^ ^* are the total sales elasticities when competitors
do not reoct . This can easily be proven since if competitors do
not react [R] = [0] and ^n ^"^
^m * * ^^^^ important feature ena-
bles us to visualize the demand for the leader's products as a kin-
ked resrcnsc curve, drawn on figure 3.
INSERT FIGURE 5 ABOUT HERE
It is worth noting that these estimates of sales elas-
ticities (E 1 are significantly different from the market shareq » u ^ '
elasticities (E *). Thus, any judgment on the firms' behavior ba-rn ,, u
J ~i t^


23.
sed on the E * vector would have been roriously bifjsed. Fcr exam-m , u
'
pie, the leader's monopoly power would have been underestimaL--^:
If we asc'jme prof i t -maximi z i ng behavior, then our estimate of the
potential degree of monopoly power, 100 • — the percentage
marK-up on marginal cost, is equal to [-100/(1 + n )]. Our estima-
tes of price elasticities are -1.673 in the case of the static
version and -1.734 in the case of the dynamic version. This gives
a percentage mark-up of price above marginal cost of 114.54 % or
136.29 %, respectively and the corresponding percentages of gross
margin are 5 3.39 % and 57.68 % . To appreciate the welfare loss
attribuable to this monopoly power the ratio of competitive price
(nC] to moriopoly price (p) is also very instructive : it is a de-
creasing function of the price elasticity : (1 1/n ). The ratio
estimates are 0.46G1 and 0.4232 in this case. All these results con-
firm the high degree of market concentration observed by the end
of 1966.
As far as the advertising policy of the leader's is
concerned, we can compute the value of the adve r t i s i ng- sa 1 es ratio
at optimum derived from the Dorf man- S t ei ner rule, according to equa-
tion [3] :
thus at optimum


24.
The static model give^ in estimate of a equal to
0.063 and the dynamic form an estimate equal to 0.002. r> cc^n,-? rl son
of these values v/ith the observed advertising-sales ratios, the
mean of which is 0.0B8, shows that although firm B had been over-
spending from 1363 to 1965, on the average, its advertising beha-
vior had been rational. An adriitionnal confirmation of this fact
is obtained when the firm's marginal return on advertising is com-
puted:
MRA (p - no . -^
on the ave raj
MRA = (p - noq.s
(q/s)
Assuming a 53 ^ gross margin and using the static version estimatrs,
we get : _. _-
MRA =(10.71) • (0.118) • (983,000/1,407.257) = $ 0.6B3
Thus the last dollar spent in advertising produces approximately
1 8
a net return of 88 cents
If we rely on the dynamic version estimates we should
19take the long-term impact of advertising into account . The long-
term marginal cost marginal revenue equality rule in actualized
formthen becomes:
(25) z (p - nc1=
3qZ (1 + r)
1=


25
20
where r is the cut-off rate. Assumiriji price and quality fixea ,
^t*B = "^ • ^*, t +
8
q . s m , s^
n s
T=0 t+B-T-1
Y = 1/(1 - A)
Thus,
(26)^ ^^t^B
'i'
for B =
[n - (1 -X) n *] .when B /q , s m . . s
Substituting the value of —z extracted from (26) into equation (25)
'^m^.s*'^t
(1-A) -n,
1 r "t*6
At equilibrium.
(28) li-n ts ] = (p - MC:t-coo
(1 * r - A)


26
and as a consequenci
(29) (p - MO • Q • k
n r • nq.s m^ , s
1 r - X
where 6
1 - Y . n,
The long-run optimal equilibrium value of the
advertising expenditures is thus equal to :
s =I(11 .57) • (2.100,0003 • (0. 149 1 .524 , 0.093 + r X 0. 147
1 + r - 0.344
(1.524) • (0.093)
To discount the flov; of returns produced by the advertising invest-
ment various interest rates may be considered. Yield on shares in
the same industry would give an idea of profit opportunities offernd
to the firm by alternative investment decisions. However over the
period studied, dividends were not high enough to compensate for
the going down stocks so that yield on shares is not indicative cf
the external investment opportunities. As a result we turn to tha
interest borne by commercial bills over the same period. A 6.5 '<.
average rate was observed and the corresponding long-run optimal


27,
levGl of tht; advertising expenditures amounts to s =$1,424,079 wM.h
should be cor,.p::rBd with firm B's real expenditures "s = $ 1 , 407 , 257 . Al-
though the average amount spent is ^clov; s we are, once again, indu-
ced to conclude that firm B has b een overspend i ng over the 1964-
1966 period. A sensivity analysis of the long-r'jn equilibrium level
s to the discount ratee
rather insensitive to r,
INSERT TABLF IX ABOUT HERE


28
CONCLUSIOi\.
In this paper we first generalized the well known
Dorfman-St ei ner theorem in considering explicitly the multiple compe-
titive reaction case. We then reviewed the literature through a se-
ries of corollaries. On the basis of the theorem we developed, we
attempted to shed light on an oligopolistic market over a period cha-
racterized by the rapid raise of a leader. To estimate the key-para-
meters we turned to a very simple model. The shortage of degrees of
freedom prevented us from trying any more complex form. Hov/ever weak
the statistical properties of some of our estimates might be we are
nevertheless confident in their descriptive as well as in their nor-
mative value. Indead they seem to perfectly describe the firms' com-
petitive behavior and reflect our subjective a priori feelings about
the market. From a predictive point of view, the competitive reac-
tion elasticities should probably be Judgmental ly guessed and a Justed2 1
rathEir than econometrically aerived . In our case. Judgmental and
econometric estimates were converging.


29,
.S ^"-..S


30.
EVOLUTION OF MARKET CONCENTRATION
0, 33


FIGIJRF 3 ESTITATEn KINrFO RESPONSE CURVEJ
5 X - 4 X - 3 « - ?
q = f (s/p,
)
NO COWETITIVE RtAC


32
c
* 3 3-- 3-


33,
TABLE II
DECnnPOSITION OF TOTAL SALES ELASTICITIES E
IN OLIGOPOLY
No competitivereaction


SfLECTEO INDICATOR'S OF MARKET STR'JCTURE
IN'OICATGRS

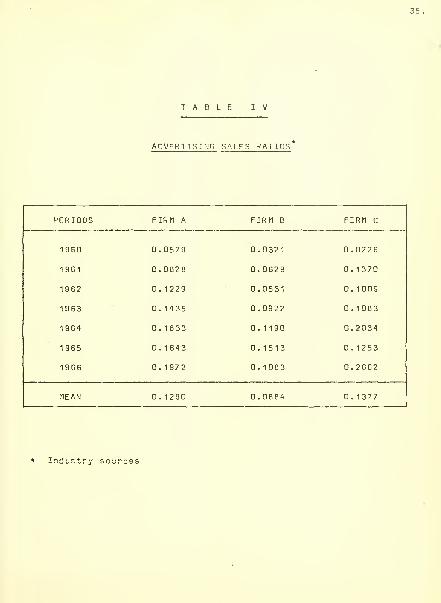
TABLE I V
ADVERTISING SALES RATIOS'
PERIODS


36
TABLE V
SELECTED MARKET SHAP^ ELASTICITIES


O O CvJ
lo


TABLE VIII
TOTAL SALES ELASTICITIES
39
0.273
-0.774
0.023'
0.901
Static nodcl
5.543
0.503
Short -run
m . 1
1 . u
Dynamic riodel
-3.726'
0. 147'
0.583*
Long-run
rL-R
i , u
5.676
0.223
0.667
1 .673
0. 116
0. 188
,L-R
q.u
-1 . 138
0.093
0. 171
L-R
1 .734
0. 142
0.261

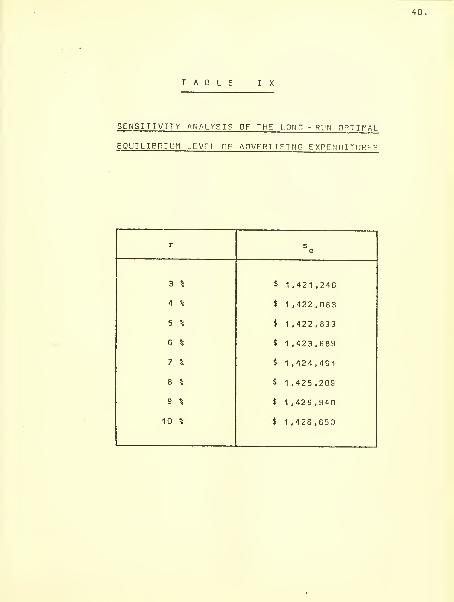
TABLE I X
SENSITIVITY ANALYSIS OF THE LONG - RUN OPTIMAL
EQUILIBRIUn LEVEL OF ADVERTISING EXPENDITURES
r


41
APPENDIX
Tslser derived the following relation (translated in
I
• our notation) between the various elasticities with respect to ad-
vertising
(A.I] n = (1m, s
m) •{ n - Hn 5 = n ,
q , s , s m , s " - »S.s'
In fact, this should have been written as two separa-
te equalities because they result from different assumptions. First,
let us take
(A. 2) n„ = nm, s m . , s
(1'S.s
This holds in the case of an oligopoly with stable in-
dustry sales, simple competitive reaction and the marKet share func-
tion in relative form (see equation (15]).
On the other hand ,
(A. 3) ^^ - "^^ • ^\.s - -^q ,s
Is the advertising equivalent of equation (22), that is an oligopo-
ly with expansible industry demand, simple competitive reaction and
the marKet share function in general form. This equivalence will
now be demonstrated.


Equation (A. 3} can be written as
1-m m,s q,s O.s
(A. 4} n = Ti„ +77q . s ^r' ^
with = q + Q
12.
30(A. 5] n
CO s 3rn s 3m
q,s Q 3s m 9s m 33
(A. 6]
3rq/ (q+0 n 3q q
3s 3s
3q 30 3q q 30c I
3s 3s
Substituting (A.B) in the second term of (A. 5)
30 ^ 30 -s _ c _^ B^ _ 3^ _ q » s
^c _s ^
_3_m
I 3s m 3sc
q.s 3s 3s
S ^ C , r,, _ £-1y 1 . Is. + 1 i In
* 3s * 3s * m * 3s
nee [1 - Hi = ^
_s _3_0 £ ,_3n^
'q.s 3s m 3s
q.s ' 3s 3S 3s m 3s m 3S 3s


^^•^^ %,s ° ^0^,s * ^S,s • ^Q^.S * "^m^.s * Ps.s * ^m^.S
which is the advertising equation from vector equation (22


FOOT N' DIES
^ For a presentation of the marKeting mix concept, see Borden [
^ Some reactions may be virtually instantaneous, v/hile others may
occur after a considerable time lag. For example, price reactions
are often almost immediate. Advertising reactions, however, usual-
ly involve substantial time lags. So, p
'\.t "K.t-1 ,.
, Whereas p
k.t-1 ^k.t ^l'"l
could be defined as
3u^^^^^^^ %,.u. '"^2ht be ~ 1 ,t
l.t
1 .t
l.t
^ A more general profit function could be considered including dis-
tribution, markup, etc. This simple form is used here to establish
a link with Dorfman and Steiner's work.
** Throughout we will assume that the second order conditions are
satisfied.
^ For a comparison of alternative models of determinants of marke-
ting expenditures in the firm, see Elliott [121.
6 30t/3U is an (n x 1) vector, and 3U/3u is an (n x n) matrix.
To be conformable for multiplication we should write 30t
^ For a basic discussion of the Cournot and Stackelberg competitivf
reaction models, see for example Intriligator [17, pp. 205-19].


45.
The direct elasticity (i.e. not taking into account possibli
competitive reaction^ of market share with respect to price3m .
has been defined as • — . i.e.3pm
m .p* m p* m .5* m .x
£ ^i _ >• i
^
m 3p
a .(p*)*^ i'm, .p'
(s*) (X*)
which simplifies to.
'i'
Similarly one obtains
n r, = " n 1m^.P m^.p''
Analogous results obtain for the other decision variables and in
vector notation we can write
E =-E M = E *m , u m , U m , u
^ The direct elasticity of market share with respect to price is
then
P- a'n„P .^m '
3p
i.P
m. ,pP I i'
p*P(p + P)
o n 1
m_, . X
I
m .s ,
(s°) ^ .(x°] ^
p*P
m . , X
(x°)


which reduces to.
"^m^.p " '^m^.p° ' tP^P
n _o • Pm , p m , p
Similarly one obtains
n „ = n o • Pm^.P m^.p
More generally, we can writi
m , u m . , U U m , u
1° An index devised by Hymer and Pashigian [161. I^ and I^ are res-
pectively the unv/eighted and weighted sum of absolute changes
in market shares :
1=7; W '^.T - '"i.ii
•2 =
J^I^.T - ^.ll • %.1
where m is the marKet share of brand i. at time t
n is the number of competing brands.


47
t is the extent of the observation period.
I is an average instability index computed over the whole period
1 1T n
of Observation, i.e. I ^= ^^ . - .
j ^
^E^ jm^^^ - m^^^_J .
Hymer and Pashigian's indices. However, they were computed as
^^ For a comparison of the merits of the Herfindahl index with those
of the entropy measure - also computed and reported in Table III,
see Theil [31, pp. 316-18].
^^ These simultaneous equation models are discussed in Bultez \ 7 ] ,
X , P , S , s and m were the jointly dependent variables, x ,
^ -» x^ - » s^ ^, P^ ^, S^ ^ and m^ ^ the predetermined va-t-1 t-1 t-1 t-1 t-1 t-1
riables .
So few degrees of freedom were left in the estimation that the
results are not worth reporting
If we are willing to accept that the t^ statistic computed here
is distributed according to a Student's density function, an
assumption, which may be asymptotically valid in the case of
simultaneous equation model.


48
'^ Note thrit the new Durbin statistic tests the non-autocorrelation
against the alternative hypothesis of a first-order Markov de-
pendence scheme. In the case of a KoycK model where the original
disturbances are independent, when we apply Koyck's transiforma-
tion the resulting error terms get correlated according to a
first-order moving average scheme and thus the Durbin statistic
is ir re levant .
Moreover, this asymptotically valid test has been desi-
gned for single equation regression model. Its performance is un-
known when we apply it to residuals from one equation which is
part of a system.
^^ The long term market share elasticities are the elements of
1the vector • E * , where X is the coefficient of the
m , u
(log rn ) variable, i.e. 0.344.
The significance of the E estimator is unknown and depends
critically on the statistical properties of the [R] and E^ ^'i
'
estimators. However the distribution of such an estimator may
be empirically approximated by Monte Carlo experiments with
various sample sizes.
^^ Assuming a 58 % gross margin and using the dynamic ver<=inn short-
run estimates, we obtain :
MRA^'^ = (11 .57) (0.093] • (963,000/1 ,407,2571 = $ 0.752


49
*^ A detailed demonstration of the long-run result may be found
in BULTEZ [7].
20 Since we expect <_ X < 1 . I X*^ = 1/(1 - A)
T =
2^ Since we need a long period of stable competitive behavior to
estimate them.


REFERENCES
[l] BAIN, J.S., Industrial Organizations . John Wiley and Sons. New
York, 1959.
[2] BALIGH, H.H. and L.E. RICHARTZ. "Varl ah 1 e-Sum Game flodels of
Marketing Problems". Journal of Marketing Research . Vol. IV,
No 2 (May, 1967), pp. 173-1B3.
[3] BASS, P.M., "A Simultaneous Equation Regression Study of Adver-
tising and Sales of Cigarettes", Journal of Marketing Research
.
Vol. VI. No 3 (August. 1969), pp. 291-300.
[4] BORDEN, N.H., "The Concept of the Marketing Mix", Journal of Ad-
vertising Research . Vol. 4, No 2 (June, 1964), pp. 2-7.
[5] BREMS, H., "Price, Duality and Rival Response", in : KJAER -
HANSEN, M. (ed.). Readings in Danish Thcorij of Marketing . North-
Holland Publishing Company, Amsterdam, 1966, pp. 149-159.
[B] BULTEZ, A., "Leader's Marketing Behavior in Oligopoly", C.I.M.
Working Paper 6-71, College I
n
teruni vers i t aire d'§tudes doctora-
cicr.ccs du Msnagcment (C.I.M.), Eru; ine 197 1
[7] BULTEZ, A., Competitive Strategy for Interrelated Markets, Un'
published Ph. D. dissertation, Louvain University, in process


51.
[ol COWLING, K. and J. CUBBIN. "Pr::ce, Quality and Advertising
Competition : An Econometric Investigation of the United King-
dom Car Market", Economica , Vol. XXXVIII, No 152 (November,
1971), pp. 376-394.
[9] DORFriAN, R. and P.O. STEINER, "Optimal Advertising and Optimal
Quality", American Economic Review. Vol. XLIV, No 5 (December,
1954), pp. 626-836.
[10] DURBIN, J., "Testing for Serial Correlation in Systems of Si-
multaneous Regression Equations", Biometvika . Vol. 44 (1957),
pp. 370-377.
[11] DURBIN, J., "Testing for Serial Correlation in L eas t- Squares
Regression when Some of the Regressors are Lagged Dependent
Variables". Econometvica , Vol. 38. No 3 (hay. 1970). pp. 410-429
[12] ELLIOTT, J.W., "A Comparison of Models of Marketing Investment
in the Firms", Quarterly Review of Economics and Business
,
Vol. II (September, 1971). pp. 53-70.
[13] FELDSTEIN, M.S., "Advertising Research and Profits in the Drug
Industry", The Southern Economic Journal , Vol. 35, No 3 (Janua-
ry. 1969). pp. 239-243.
[14] GUPTA. S.K. and K.S. KRISHNAN, "Differential Equation Approach
to Marketing", Operations Research. Vol. 15, No 6 (Nov. -Dec,
1967), pp. 1030-1039.


[15] GUPTA, S.K. and K.S. KRISHNAN, "Mathematical Models in MarKe-
ting". Operations Research, Vol. 15, No 6 (Nov. -Dec, 1967),
pp. 1040-1050.
[16] HYMER, S. and P. PASHIGIAN, "Turnover of Firms as a Measure of
Market Behavior", The Review of Economics and Statistics , Vol.
XLIV, No 1 (February, 1952), pp. 82-87.
[17] INTR ILIGATOR , V\ .G ., "Mathematical Optimization and Economic
Theory". Prentice-Hall. Inc.. Englewood Cliffs, N.J., 1971.
[18] KOTLER, P., "Competitive Strategies for New Product Marketing
over the Life Cycle", Management Science , Vol. 12, No 4 (Oe-
cember, 1955), pp. 104-119.
[19] KRISHNAN. K.S. and S.K. GUPTA, "Mathematical Model for a Duo-
"polistic Market", Management Science, Vol. 13, No 7 (March,
1967), pp. 568-583.
[20] LAMBIN, J.J., "Measuring the Profitability of Advertising : An
Empirical Study", Journal of Industrial Economics , Vol. XVII,
No 2 (April, 1959), pp. 86-103.
[21] LAMBIN, J.J., "Advertising and Competitive Behavior", Applied
Eoor.omics. Vol. 2, No 4 (1970), pp. 231-251.


53,
[22] LAflBIN, J.J., "Optimal Allocation of Competitive HarKeting
Efforts", Journal of Business , Vol. 43, No 4 (October, 1970),
pp. 466-484.
[23] MILLS. H.D., "A Study in Promotional Competition". In F.M. BASS
et al. (eds]. Mathematical Models and Methods in Marketing,
R.D. Irwin, Inc., Homewood, Illinois, 1961, pp. 245-269.
[24] NAERT, P. A., "Optimi^inp; Consumer Advertising, Intermediary
Advertising and Markup in a Vertical Market Structure", Mana-
gement Science, Vol. 16, No 4, Pt. II (December, 1971). pp.
90-101
.
[25] NAERT, P . A . ., "Optimizing Marketing Mix Decisions: An Economic
Analysis," in David C. Murphy (ed.), Recent Developments in the Decision
Sciences, Proceedings of the American Institute for Decision Sciences
Northeast Regional Conference, 1972, pp. .1-8.
[26] OSGOOD, C.B., G.J. SUCI and P.H. TANNENBAUM, The Measurement
of Meaning , University of Illinois Press, Urbana, 1957.
[27] PALDA, K.S., The Measurement of Cumulative Advertising Effects,
Prentice-Hall, Inc., Englewood Cliffs, N.J., 1954.
[28] SCHULTZ, R.L., "Market Measurement and Planning with a Simul-
taneous Equation Model", Journal of Marketing Research , Vol.
VIII. No 2 (May, 1971], pp. 153-164.


54.
[29] SHAKUN, n.F., "A Dynamic nodel Tor Competitive MarKeting in
Coupled Markets", Management Science, Vol. 12, No 12 (August,
1966), pp. 525-529.
[30] TELSER. L.J., "Advertising and Cigarettes", Journal of Politi-
cal Economy , Vol. LXX, No 5 (October, 1962), pp. 471-499.
[31] THEIL, H., Economics and Information Theory, North -Ho 1 land
Publishing Company, Amsterdam, 1967.
[32] THEIL, H., Principles of Econometrics , John Wiley S Sons, Inc
New York, 1971.


OCT 2 8 '77
0G15'89
APR 3 ZOdl
MOV 1 1"81
SEP 11
W

mmmmii ....
3 TD60 003 702 2*=I4 ,^^
4^^-)^
3 TOaO 003 b71 507
3 TDfiO 003 t.71 4fil
3 lOfiO 003 b71 M40
3 TDfiO 003 b71 mb
llllliilllilllll!:il!liiil!li:l!;!lll!illlllini 6^/7-73
3 TOaO 003 70S 4bfi
3 TDfiO 003 70E 47b
>1
I
