optimal illumination-detection distance and detector …beers... · optimal illumination-detection...
TRANSCRIPT

1
Optimal illumination-detection distance and detector size for predicting Braeburn apple maturity from Vis/NIR laser
reflectance measurements
Robbe Van Beers a,*, Ben Aernouts a, Lorenzo León Gutiérrez a,b, Chyngyz Erkinbaev a, Koen Rutten a, Ann Schenk c, Bart Nicolaï a,c, Wouter Saeys a
a KU Leuven Department of Biosystems, MeBioS, Kasteelpark Arenberg 30, 3001 Leuven, Belgium
b Instituto de Investigaciones Agropecuarias, INIA Quilamapu (VIII Región), Avda. Vicente Méndez 515, Chillán, Chile
c VCBT - Flanders Centre of Postharvest Technology, Willem de Croylaan 42, 3001 Leuven, Belgium
* Email: [email protected] Tel: +32 (0) 16 37 71 32 Fax: +32 (0) 16 32 19 94
Abstract
The storage potential of apples highly depends on the maturity at harvest. Optical
methods have been proposed to measure maturity in a fast, reliable and non-destructive
way. However, the signal is often composed of photons with different penetration depths into
the material. An attempt to separate these photons might result in more precise correlations
with quality attributes, as these could relate to a specific layer/depth into the sample.
Therefore, a Vis/NIR spatially resolved laser reflectance setup was used, combining a
supercontinuum laser and a monochromator to illuminate samples with a monochrome
focused beam in the 550-1000 nm wavelength range. A panchromatic camera was used to
obtain diffuse reflectance profiles at each wavelength. In the period starting 50 days before
until 11 days after commercial harvest, 320 Braeburn apples were measured. Partial least
squares regression models were developed to relate apple maturity/quality to the diffuse
reflectance spectra at different distances from the illumination point. The effect of detector
size (spatial bandwidth) was also evaluated. A bandwidth of 0.82 mm in combination with a
parameter specific illumination-detection distance, gave the best results. Using an internal
test set, an R2 of prediction of 0.98 and 0.93, and a ratio of prediction to performance (RPD)
of 5.84 and 3.42, predicting respectively the Streif index and starch conversion values was

2
obtained. The predictions of soluble solids content (SSC) (R2 of 0.81 – RPD of 2.04) and
firmness (R2 of 0.65 – RPD of 1.66) were less accurate. Also, worse predictions were
obtained using an external test set.
Keywords: Hyperspectral, Spatially Resolved Spectroscopy, Laser reflectance, Apple,
Maturity, Streif index
1. Introduction
The manual picking of fruits is a labor intensive operation and, hence, one of the major
costs in fruit production (Sarig, 1993). As a result, mechanical harvesting of fruits has been
investigated extensively (Baeten et al., 2008; De-An et al., 2011; Peterson, 2005). However,
mechanical harvesting is only a part of the challenge as it introduces several new challenges,
including automatic fruit maturity detection. Moreover, the variability in individual fruit maturity
often limits the potential to perform a bulk mechanical harvest operation (Peterson, 2005).
Nowadays, apple harvest relies on the subjective maturity decision of each individual picker,
which can lead to highly heterogeneous end products or postharvest disorders. The fruit
maturity at harvest has a large influence on quality attributes afterwards. For example,
apples picked before the optimal date are small, do not develop a good taste and have a
higher probability of developing storage disorders such as superficial scald. On the other
hand, fruits picked too late tend to become mealy and are more susceptible to internal
breakdown (Peirs et al., 2002). To determine the maturity stage of fruits, both physical and
chemical quality parameters have to be monitored. Common attributes measured to follow up
the maturation process of fruits are firmness, starch content, sugar content, acidity and
ethylene production. Of these parameters, the first three are key parameters in consumer
acceptance and are, therefore, often used to determine apple quality (Bobelyn et al., 2010;
Harker et al., 2008; Pissard et al., 2012). Streif (1996) introduced the so-called “Streif index”,
which combines these three parameters. Using this index, a cultivar specific maturity
3
threshold can be obtained which can be used to determine the optimal maturity stage of a
fruit, depending on the target market (internal consumption, export or long term storage).
The maturity of apples indicated by the Streif index has already been predicted directly in
other studies using electronic nose measurements (Pathange et al., 2006; Saevels et al.,
2003) and optical measurement techniques like Vis/NIR spectroscopy (Peirs et al., 2001) or
time resolved spectroscopy (Vanoli et al., 2011). Optical techniques show advantages in
automated mechanical harvesting as the apple maturity can be detected under field
conditions in a fast, reliable and non-destructive way. Hereby, the apples in different
orchards can be harvested with optimal conditions both from a consumption and/or storage
potential point of view. Nevertheless, standard optical techniques often obtain a mix of
photons carrying information of different layers or depths of the fruit. In this way, photons that
have interacted less and penetrated less deep might dominate the measured signals as
these photons have less chance of being absorbed. As a result, the majority of the measured
photons would have interacted with the superficial layer(s) of the sample such as the
epidermis and hypodermis, while they might not be the most informative. Other optical
measurement techniques, such as hyperspectral imaging (Baiano et al., 2012), spatially
resolved spectroscopy (Cen et al., 2012; Lu & Peng, 2006; Nguyen Do Trong et al., 2014),
time resolved spectroscopy (Torricelli et al., 2013; Vanoli et al., 2011) and fluorescence
measurements (Kolb et al., 2006), have also been used to determine quality attributes of
different fruits. However, most of these techniques cannot be used in field conditions and
often lack discrimination power as they do not provide enough information about the inside of
the fruit.
Several researchers have reported on the potential of Vis/NIR spectroscopy for the
prediction of quality parameters of different kinds of fruit (Lammertyn et al., 2001; McGlone et
al., 2002; Nicolaï et al., 2007; Peirs et al., 2001). This technique can already be used online
in a contactless, fast and robust way (Nicolaï et al., 2007). However, the obtained spectra
often contain unneeded information on scattered photons, which can eventually affect the
4
obtained result. The spectra consist of information on both absorption and scattering, while
mostly absorption information is desired (Lu, 2004). When determining chemical properties
like SSC, the scattering of light caused by non-uniformities in refractive index inside the
sample and thus giving information on physical properties, is often seen as a disturbing
factor (Lammertyn et al., 2000). On the other hand, when determining physical properties,
the effect of scattering is often difficult to determine. As physical properties like cell size and
porosity will change during the maturation on the tree, the scattering effect will be of
importance. Furthermore, photons which have interacted with different parts or layers of the
sample are gathered in only one output signal. For example, as we are mostly interested in
the properties of the fruit flesh, photons which have interacted with the fruit flesh are of
particular interest, while they are dominated and masked by photons that only penetrated
superficially in the fruit skin.
In Vis/NIR scatter imaging, on the other hand, a laser or focused beam point source is used
to illuminate the sample, while a panchromatic camera collects the spatially resolved diffuse
reflectance (Romano et al., 2011). As a result, spatial information on the diffuse reflectance
can be obtained for a single or multiple wavelength(s). This spatial information enables to
distinguish between photons which have interacted with different parts of the fruit material
(Zamora-Rojas et al., 2014). Moreover, the photons which propagated through and
interacted with the layer of interest will be most dominant at a specific distance between the
illumination and detection point. Consequently, quality attributes which are related to that
specific sample layer or depth are expected to follow a stronger correlation with the
measured photons at the aforementioned illumination-detection distance. Although including
spatial information can result into better comprehension of the obtained reflectance values,
care has to be taken when measuring the spatially resolved reflectance. For a point
illumination, the signal of the diffuse reflectance, and with that the signal-to-noise ratio
(SNR), decreases with increasing distance from the illumination spot. On the other hand,
photons which have penetrated deeper into the sample will exit the sample at further
5
distances from the illumination spot. Therefore, due to the importance of both SNR and
penetration depth, an optimal source-detector distance will likely exist. In contrast, the signal
level and SNR can be increased by increasing the size of the detector such that it will
capture more photons. Nevertheless, a larger detector collects photons at a larger range of
illumination-detection distances, and thus penetration depths, together in one signal. The
optimal detector size and illumination-detection distance is, therefore, highly dependent on
the sample properties and the quality parameters of interest. Furthermore, optimization of the
sensor design, taking into account the above-mentioned parameters could improve the
quality of the obtained reflectance signal, in comparison to Vis/NIR spectroscopy.
Therefore, the main goal of this research was to determine the optimal source-detector
distance and detector size for diffuse Vis/NIR reflectance measurements in order to predict
maturity-related quality parameters of Braeburn apples picked at different maturity stages.
2. Materials and methods
2.1 Apple samples and destructive reference analyses
A total of 480 apples of the cultivar Braeburn were harvested in the 2013 season in
Belgium, of which 300 at the research station of fruit growing (pcfruit vzw) in Sint-Truiden
(50°46'21.9"N 5°09'35.8"E) and 180 at the ‘Fruitteeltcentrum’ in Rillaar (50°57'49.0"N
4°52'51.8"E). The apples from Sint-Truiden were considered the main dataset, while the
apples from Rillaar were used for validation purposes. Weekly, starting 50 days before and
ending 11 days after commercial harvest, apples were harvested at both locations. The
apples from Rillaar could only be harvested until one week before commercial harvest. The
apples in Sint-Truiden could be tested after the commercial harvesting period as well. The
Belgian harvest window for Braeburn apples in 2013 was between the 24th and 28th of
October, as determined by the Flanders Centre for Postharvest Technology (VCBT) based
on the evolution of firmness, starch index, SSC, acidity, size, background color and Streif
index in comparison to historical records. On every picking date, 30 apples were sampled in

6
the mid-section of the tree of which 20 apples were optically measured and 10 apples were
used for the destructive determination of the mean starch conversion value (S) for that
specific picking date. The mean starch value per picking date is used as a value for the 20
apples which were measured optically. To determine this mean starch value, the 10 apples
per picking date were cut equatorially and dipped in a KI/I2 solution to stain the starch
particles (lugol test). The starch index was determined visually by comparing the staining
patterns of the fruit with a reference color chart (Starch Conversion Chart, scale from 1 to 10,
Ctifl, Paris, France).
Of the 30 apples picked on every picking date, the remaining 20 apples were optically
measured (described in next paragraph). After this optical measurement, the firmness and
soluble solids content of these individual apples were destructively measured in the
laboratory of VCBT. The firmness was determined using a universal testing machine (LRX,
LLOYD Instruments Ltd., Hampshire, UK), which uses an 11 mm diameter plunger and
punctures the fruit for 8 mm (8 mm/s). The maximum force (F - kg/cm2) is used as a measure
of fruit firmness. The soluble solids content (SSC - °Brix) was measured with a digital
refractometer (PR-101α, Atago, Tokyo, Japan) using a drop of fruit juice extracted during the
firmness puncture test. These destructive measurements were performed at two opposite
equatorial positions of the fruit surface and were averaged, resulting in one value per fruit.
Finally, the three obtained destructive values were combined in one maturity parameter,
known as the Streif index (Streif, 1996):
(1)
In this formula both F and SSC are apple specific parameters, while S is a mean value
obtained per picking date. A logarithmic transform of the Streif index was used to stabilize
the variance over the measured period (Peirs et al., 2005). By using this transform, the
variability in the early maturity stages decreases, whereas the variability in the later stages
increases. For the further analysis of the Streif index and the starch conversion value, only

7
the data starting from 40 days before harvest were included. The first two measurement days
were excluded as the starch measurement on immature apples is unreliable and, therefore,
causes irregularities in the calculated Streif index (Peirs et al., 2002). On the other hand, the
values for firmness and SSC were determined accurately over the entire test period such that
all data points could be used in the analysis.
2.2 Spatially resolved laser reflectance setup
To acquire the Vis/NIR laser reflectance at multiple source-detector distances
simultaneously and with high spatial resolution, a measurement setup was developed as
illustrated in Figure 1. A monochrome laser illumination was obtained by combining a
supercontinuum laser (SC450-4, Fianium Ltd., Southampton, UK), which has a total output of
4 W and a spectral broadening over the range from 450 to 2400 nm, with a monochromator
(Oriel Cornerstone 260 ¼ m, Newport, Irvine, USA). The monochrome tunable light is
obtained by using a 0.1 mm monochromator output slit width, resulting in a spectral
resolution of 0.31 nm. This outgoing monochrome beam is then split by a polka dot beam
splitter (Type 4-9101, Optometrics, Massachusetts, USA) which sends 10% of the power to a
reference detector (PDA100A, Thorlabs Inc., New Jersey, USA) to monitor the stability of the
illumination system. This part of the setup and all used components are described in detail in
Aernouts et al. (2013).
The remaining 90% of the monochrome light from the monochromator is focused into an
optical fiber (multimode, NA 0.22, 200 µm core diameter) and guided towards the second
part of the setup. The light leaving the optical fiber is focused (COL-UV/VIS, Avantes BV,
Apeldoorn, The Netherlands) onto the sample under an angle of 20° with respect to the
vertical axis to avoid specular reflected light to be measured by the camera (Mollazade et al.,
2012). The diffuse reflectance caused by the incoming light is captured by a 12 bit
panchromatic CCD camera (TXG-14NIR, Baumer, Frauenfeld, Switzerland) with a resolution
of 1392 x 1040 pixels (8.98 mm x 6.70 mm) and an exposure time of 32 ms, located above
the sample (Van Beers et al., 2013). The CCD camera is used with a 16 mm monofocal

8
manual iris lens (C1614A, Pentax, Tokyo, Japan) in combination with an extender (10 mm)
(2-EX, Pentax, Tokyo, Japan). The interaction of the light with the sample results in a diffuse
reflectance glow spot (Figure 2 (a)), which represents the photons leaving the sample after
one or more scattering events. For each wavelength, a clear decrease of the diffuse
reflectance values with increasing distance can be observed. This can be explained by the
fact that the radial area increases with increasing distance from the point of illumination.
Furthermore, the photons exiting the sample at a further distance from the point of
illumination have travelled a longer path through the sample and thus have had a higher
chance of being scattered and/or absorbed. As a result, both the absorption and scattering
properties of the sample at the considered wavelength influence the diffuse reflectance glow
spot. In this study, only reflectance signals up to 5 mm from the spot edge have been
considered as the signal to noise ratio becomes too low at larger distances.
The automatic control of all the components used (supercontinuum laser, monochromator,
CCD camera, filter wheel and Silica detector) and the measurement procedure have been
programmed in LabView 8.5 (National Instruments Corporation, Texas, USA).
2.3 Optical measurements
As mentioned earlier, 30 apples were sampled from the tree, of which 10 apples were
used to obtain a mean starch value while 20 were used for the optical measurements. The
diffuse reflectance spot in the 550 nm to 1000 nm range with a step size of 5 nm was
measured on the sun exposed side (blush side) of each of the bicolored apples, resulting in
91 images per apple. This red side will mostly be encountered when measuring apples in the
field. The apples were placed on a sample holder, which assured a constant distance from
the apple to the CCD camera (12.4 cm) using a vertical translational stage. The obtained raw
profiles were dark corrected using a dark image. To convert the raw images into relative
reflectance profiles, a white reference measurement was made by directing the beam into an
integrating sphere with a diameter of 50 mm (AvaSphere-50-REFL, Avantes BV, Apeldoorn,

9
The Netherlands) and measuring the diffuse reflectance coming out of the sphere port (1 cm
Ø).
2.4 Data processing
At each wavelength, the image taken was first corrected using the dark and white
image (Figure 2 (a)). Hereafter, the images were radially averaged by taking the mean of the
intensities at equal distances from the center of illumination. Per wavelength, an SRS profile
with relative reflectance as a function of the distance from the illumination center was
obtained, as shown in Figure 2 (b). By combining all wavelengths, a reflectance spectrum at
several distances from the illumination spot edge could be obtained. The illumination-
detection distance is defined as the distance from the illumination spot edge to the point at
which a reflectance spectrum is taken. Using Partial Least Squares (PLS) regression, the
obtained reflectance spectra were used to predict the measured destructive parameters.
Additionally to the effect of source-detector distance, also the effect of the detector size was
investigated. This detector size is defined as the size of the CCD detector used to derive the
diffuse reflectance. Therefore, the detector size is directly related to the pixel size of the
camera as one pixel on the camera corresponds to the smallest detector unit possible. The
camera has a resolution of 1392 x 1040 pixels resulting in a smallest detector size of 0.023
mm for this setup configuration. By increasing the number of pixels included, different
detector sizes can be investigated. Different bandwidths, averaging information of adjacent
distances from the illumination spot edge, were used to estimate the importance of the
detector size. For this, PLS models were built using different bandwidths - ranging from the
reflectance of all distances together (4.9 mm bandwidth) to only the reflectance at a single
distance (0.023 mm bandwidth or one pixel) - and different distances of these intervals from
the illumination spot edge. As an example, a detector size of 0.82 mm at a distance of 3.69
mm from the illumination spot edge is shown as the gray band in Figure 2 (b).
10
To study the effect of illumination-detection distance and detector size/bandwidth on the
prediction performance of the PLS models, the dataset from Sint-Truiden was used in
combination with mean centering as a spectral preprocessing step and a maximum of 8
latent variables (LV’s) for the PLS models. The dataset used was split into a test set (3
measurement days of 20 measurements) and a calibration set (the remaining samples). The
apples for the calibration and test set were chosen such that the apples were grouped over
the days to make the validation as independent as possible. In this way, the risk of
overoptimistic models due to the modelling of time-dependent measurement effects, rather
than the parameter of interest, are avoided (Kemps et al., 2010). The start and end day were
not included in the test set to avoid extrapolation problems.
In a second step, the best combination of distance and bandwidth was chosen based
on the R2 of prediction in the obtained PLS models. This was done for the Streif index, as
well as for the parameters that define this index (equation (1)). These optimized parameter
specific distances and detector size were used to build new PLS models to predict the
separate destructive parameters. To simplify the models built, a forward interval PLS (iPLS)
algorithm was used to reduce the number of variables (wavelengths) used. Using iPLS, six
intervals consisting of five variables were selected using a maximum of 10 latent variables.
Like this, the variables selected give an idea of which wavelengths are most important for
building the PLS models.
After reducing the number of wavelengths used, the data were extensively
preprocessed. These preprocessing steps were determined based on the prediction
performance of the calibration samples in cross-validation by comparing several
combinations of preprocessing methods (Aernouts et al., 2011). The optimal number of LV’s
was chosen for each parameter separately, based on the first local minimum of the residual
variance curves of the used calibration set. First, the dataset from Sint-Truiden was split into

11
separate calibration and test sets like in the previous analysis. The PLS analysis was
performed using a contiguous blocks cross-validation with the groups corresponding to the
measurement days, again to prevent the risk of overoptimistic models due to the modelling of
time-dependent measurement effects (Kemps et al., 2010). The ratio of performance to
deviation (RPD) was calculated as the standard deviation on the predicted data (SDP) divided
by the root mean square error of prediction (RMSEP) (Chang et al., 2001). This value gives
the potential of the model to predict a parameter of interest. An RPD value between 5 and 8
is adequate for quality control, while values higher than 2.5 are satisfactory for screening
purposes. These values, however, also depend on the application used. An RPD value of 1
means the model is not capable of predicting the parameter in an accurate way (Williams &
Sobering, 1993). Thereafter, the models built on the data from Sint-Truiden were evaluated
on the independent validation set from Rillaar.
Finally, an extra model was built to predict the Streif index around harvest, to
investigate the potential to classify apples into different maturity classes. For this analysis,
the apple dataset from Sint-Truiden was used, only taking into account the last 5
measurement days, representing 100 apples close to harvest. The 100 apples were divided
into two sets: three measurement days for the calibration of the PLS model and two days for
the validation. Because of the smaller dataset used, splitting into groups containing a
complete measurement day for cross-validation becomes difficult. Therefore, a contiguous
blocks cross-validation with 12 splits was used, resulting in 12 groups of 5 measurements
consecutively taken out to cross-validate the model. As the apple dataset from Rillaar only
contained immature apples (Figure 3), the model could not be evaluated on this independent
dataset.
All data processing algorithms were implemented in Matlab (version 7.10, The Mathworks
Inc., Massachusetts, USA) and the PLS toolbox (Eigenvector Research Inc., Wenatchee,
WA, USA) was used to construct the PLS models.

12
3. Results and discussion
3.1 Physiological parameters and their relation with SRS spectra
In Figure 3 the destructively measured Streif index values are shown for the different
measurement days, with a mean value and standard deviation. The measurements started
50 days before and ended 11 days after the start of commercial harvest (CH). The start and
end of this harvest window are indicated in Figure 3 as vertical dashed lines. The horizontal
dashed lines show the optimal maturity boundaries for harvesting Braeburn apples,
expressed in terms of the Streif index. The upper and lower boundaries are 0.20 and 0.14 kg
cm-2 °Brix-1, respectively (Kompetenzzentrum Obstbau-Bodensee, 2011).
A sigmoidal trend can be noticed in the Streif data, which is caused by the varying starch
conversion values, ranging from a score 1 pre-harvest to a score around 8-9 at harvest
(Peirs et al., 2002). It should be noted that the Streif index data in Figure 3 are shown on a
logarithmic scale such that the trend seems to be more linear. As can be seen, the estimated
harvest window did not correspond exactly with the optimal maturity range for Braeburn
apples. This harvest window was set based on a prediction model comparing the time course
of SSC, acidity, starch conversion value, background color, size, firmness and Streif index
with historical data from different harvest locations (Peirs et al., 2005). This advised harvest
window is the same for different harvest locations in Belgium and is set several days before
the actual harvest. At the determined harvest window, the apples from Rillaar were still
immature, while those from Sint-Truiden were already beyond optimal maturity.
In Figure 4 a typical SRS surface plot is shown for a measurement with the laser reflectance
setup on the red side of an apple. The obtained SRS profiles at single wavelengths (Figure 2
(b)) are combined for multiple wavelengths to obtain the SRS surface plot (Figure 4),
showing the behavior at all measured wavelengths.

13
In this figure some general absorption features of apples can be clearly observed as
decreases in the reflectance value (black arrows). Light with a wavelength around 550 nm
will be absorbed by anthocyanin pigments, causing the red color of apples (Lancaster et al.,
1994; Merzlyak et al., 2003). During maturation on the tree, this pigment increases due to
sun light exposure, causing the absorption to increase. The second absorption peak around
678 nm is caused by chlorophyll (mainly chlorophyll a), the green pigment present in apples.
The absorption by chlorophyll decreased slightly during maturation. These observations are
in good agreement with previous studies (Knee, 1972; McGlone et al., 2002). The last
absorption feature visible is the water absorption peak around 970 nm, which corresponds to
the 2nd overtone of O-H.
The SRS profiles at the different wavelengths show an exponential decay in function of
the distance from the illumination center. The further away from the illumination center, the
lower the number of photons that exits the sample. This is caused by an increase in radial
area with the increasing source-detector distance and by the effects of both scattering and
absorption. A longer travelling path of the photons through the sample, and with that a
deeper penetration, results in an increased chance for absorption, while the actual path of
the photon is determined by the scattering properties of the tissue. Absorption inside the
apple is related to chemical properties, for example the absorption by molecules like
anthocyanin, chlorophyll, sugars and water. On the other hand, scattering in biological
tissues is related to its physical properties, for example the number of air pores, cell size,
flesh density, cell organelles,… (Lu, 2004; Nicolaï et al., 2007), that drastically change during
the maturation process.
3.2 Optimizing the illumination-detector distance
In Figure 5 the result of the PLS models built on the apple data from Sint-Truiden are
shown. These results serve to study the effect of the illumination-detection distance and the
bandwidth (detector size). The R2 values shown in Figure 5 have been obtained by applying
the PLS models for predicting the test set from Sint-Truiden.

14
Figure 5 shows a good correlation of the optical signals with Streif index, starch and SSC
values, while the prediction of firmness results in lower R2 values. It is clear that the distance
from the illumination spot edge and the spatial bandwidth used has a significant effect on the
eventual prediction performance of the quality attributes. The color bars in Figure 5
correspond to the performance expressed relative to the prediction value of the model using
only one interval (bandwidth of 4.91 mm). This value has been set as the color bar minimum;
as this is the model which best represents the prediction obtained by normal Vis/NIR
spectroscopy. In this way, settings which result in better prediction models become visible.
It should be noted that the prediction performance is generally poor close to the
illumination spot. Close to the point of illumination, the reflectance is dominated by photons
which only interacted superficially with the sample. The limited penetration depth of these
photons might be the reason for the poor prediction performance. On the other hand, if the
illumination-detection distance is long (> 3.5 – 4 mm), the signals are weak, resulting in a low
SNR. This is probably the main cause for the reduced prediction accuracy at longer
distances. Finally, the models which use all spatial information (bandwidth of 4.91 mm in
Figure 5) tend to have prediction performances which are amongst the poorest. Therefore,
selection of the optimal illumination-detection distance and detector size is rewarding.
As the bandwidth decreases, the prediction patterns start to change. To predict the SSC
value, mostly information is used close to the edge of the illumination spot (Figure 5 b). This
indicates more information is used of photons which interacted less with the tissue. This
means mostly information is used from the apple skin or just below the skin. So, the chemical
composition of the skin appears to be correlated with the changes in SSC values (Peng & Lu,
2008). The starch prediction shows that information further from the illumination spot can be
used to build good prediction models. For example, when only using two intervals, the model
which uses the information from 2.5 mm until 5 mm can be used. As the light has to interact
with the starch in the amyloplasts present in the fruit cortex tissue, further distances from the
illumination could have been expected to be more informative. Light at further distances will

15
have penetrated deeper into the cortex tissue and will contain more information of it in
comparison to shorter distances. Note that starch conversion starts at the center of the fruit
and then gradually proceeds outward. The firmness is a physical attribute related to the
microstructure of the fruit cortex tissue. Therefore, better predictions were expected for
further distances as well. Figure 5 c) shows better predictions further away from the spot in
comparison to the SSC predictions. Also, better correlations with firmness are made if a
larger detector size is used at a larger distance from the illumination (for example using a
bandwidth of 0.82 mm in Figure 5 c). The Streif index is a combination of the three
parameters described above, so a combination of the prediction patterns of the individual
parameters is expected. As a result, the prediction of the Streif index is best in the middle
part of the spatial profile.
From Figure 5 it can also be seen that both for medium and small bandwidths good
correlations can be found, depending on the distance from the illumination spot edge.
Increasing the bandwidth seems to result in more robust predictions, while the performances
of neighboring distances are highly correlated. This positive effect of increasing the
bandwidth could be related to an increased SNR of the detector signal thanks to the effect of
spectral averaging. The smallest bandwidths correspond to only one pixel in the
corresponding image, by which CCD noise can have a large influence. With larger
bandwidths, the effect of this noise is reduced due to the averaging over neighboring pixel
values. However, if the bandwidth is above a certain value, this effect reduces. This is
probably because information from a large range of illumination-detection distances is
combined into a single reflectance spectrum. Moreover, the photons exiting the sample at
very short illumination-detection distances will dominate this signal, while these are in many
cases the least informative. As a result, the optimal bandwidth was found to be somewhere
in the middle of the two extremes. The same detector size (0.82 mm), showing good
predictions performances, was chosen as the optimal for all four quality parameters (white
arrows in Figure 5). The optimal illumination-detection distance (center of the bandwidth) was

16
different for the Streif index and its consisting parameters. Moreover, this optimal distance
was located at 2.87 mm, 1.23 mm, 3.69 mm and 2.05 mm from the illumination spot edge
(white arrows in Figure 5) for respectively the Streif index, SSC value, starch content and
firmness value. In future applications where the apple maturity is to be estimated, the
prediction of the Streif index itself might be sufficient. In this case only one illumination-
detection distance is needed. However, if also the separate parameters are to be known, a
more elaborate system will have to be considered to implement multiple illumination-
detection distances.
3.3 Calibration models for predicting apple quality parameters
3.3.1 Calibration and validation using apple data from Sint-Truiden (internal validation)
The optimal configuration from section 3.2 was used to build improved PLS models
(with a variable selection and extensive preprocessing) to predict the different quality
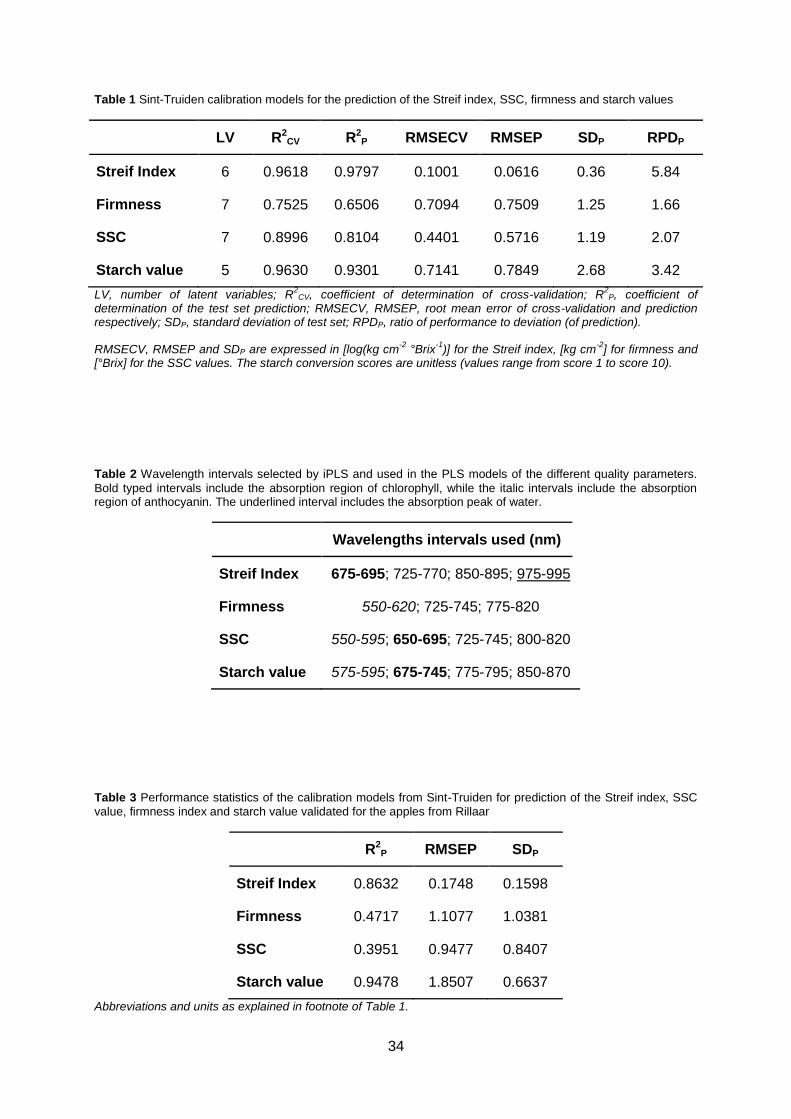
parameters. The prediction results of these models are summarized in Table 1. The selected
preprocessing steps for the prediction of the starch content were (1) a baseline correction
(weighted least squares) followed by (2) an External Parameter Orthogonalization (EPO –
one principal component). For the prediction of Firmness only an EPO was applied, while for
predicting the SSC values a standard normal variate (SNV) scaling was used. Finally, for the
prediction of the Streif index a Savitzky-Golay 1st order derivative with a 3 point window (10
nm) was applied. After these preprocessing steps, the data was always mean centered
before building the PLS models. The prediction performance of each of these models was
evaluated in a cross-validation and on a separate test set. The results of this evaluation have
been summarized in Table 1.
From Table 1 it is clear that both the Streif index and the starch values are well predicted,
with high R2P values and RPD values of 5.84 and 3.42, respectively. This indicates that these
models are adequate for quality control (Williams & Sobering, 1993). The prediction of the
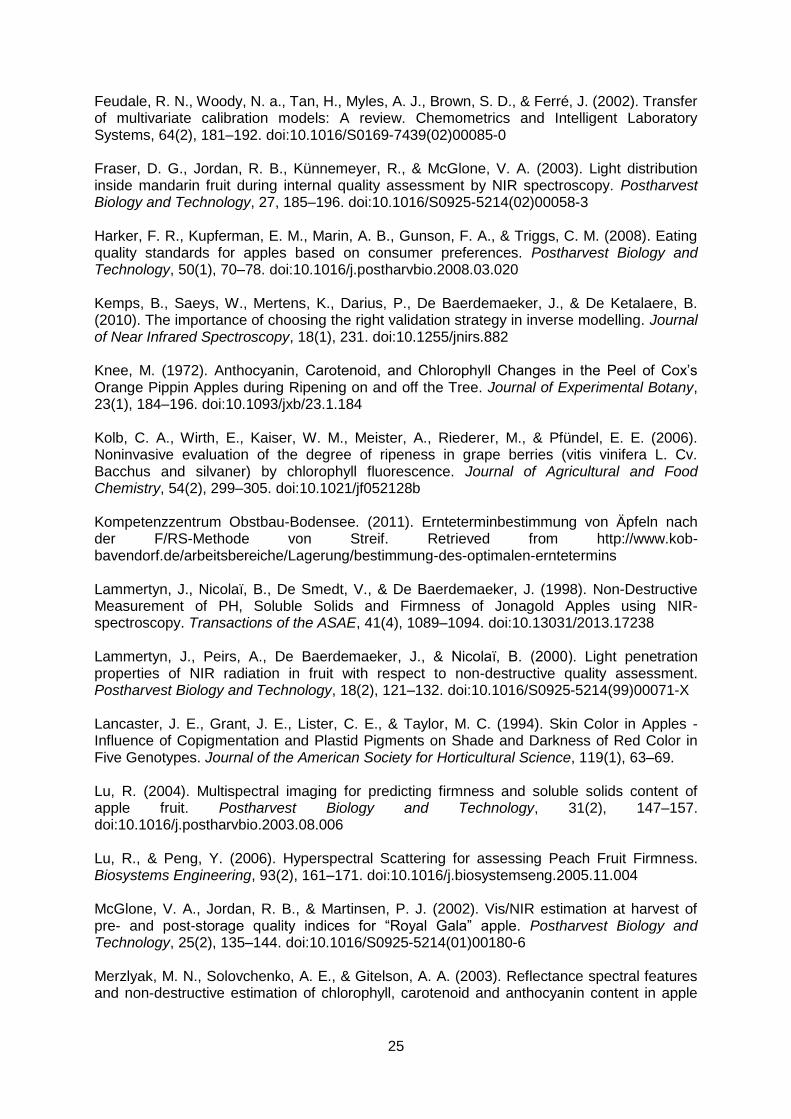
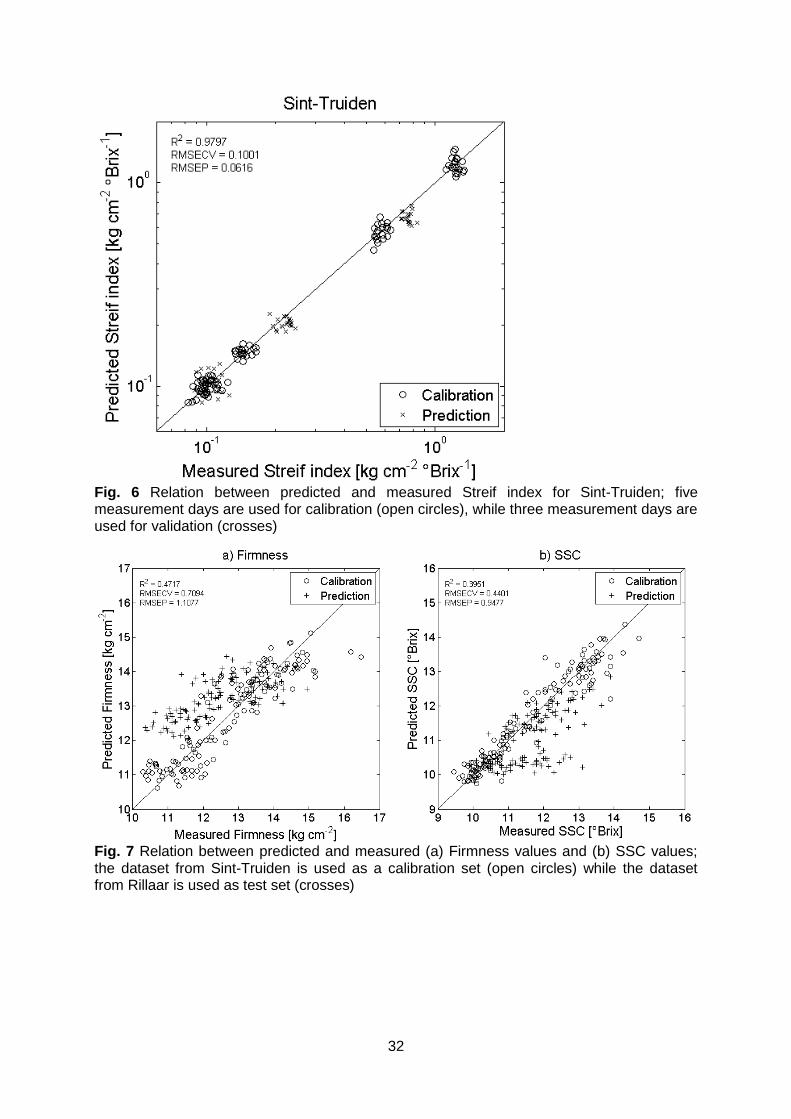
Streif index as a function of the reference values is illustrated in Figure 6.

17
In the data of the Streif index and starch value, there are distinct groups which belong to
specific measurement days. As a result of the measurements over time, a cross-validation
was performed which sequentially leaves out one measurement day for validation (Kemps et
al., 2010). Because there is only little or no overlap between the data of consecutive
measurement days, leaving out the first/last measurement day forces the model to
extrapolate. This causes the R2 of the cross-validation and the RMSECV values in Table 1 to
be sometimes worse in comparison to the internal validation on the test set. Other cross-
validation techniques could provide better results. However, they might be overoptimistic as
they would include samples harvested on the same day both in the calibration and the
validation set. Nevertheless, the evaluation on the test set shows that the developed models
are robust.
The prediction of firmness and SSC values is more difficult. The prediction of SSC values
shows an R2P of 0.81 and an RPD value of 2.07, which is still acceptable for rough screening
purposes (Williams & Sobering, 1993). In the case of firmness the prediction performance is
even worse with an R2P of 0.65 and an RPD value of 1.66.
To better understand the correlations in the obtained models, the wavelength
intervals selected by the forward iPLS algorithm are summarized in Table 2. Ultimately, 30
wavelengths of the total of 91 wavelengths were retained.
It should be noted that PLS models built for the different quality parameters use different
parts of the spectrum. However, all parameters use information from the broad absorption
peaks of the pigments present in the apple skin (Figure 4). Information on the redness of the
apple, due to absorption around 550 nm by anthocyanin pigments, by all models except for
the Streif index prediction. On the other hand, also the absorption by chlorophyll seems to be
important for predicting quality. This can be explained by the fact that the evolution of the
predicted quality parameters is correlated with changes in the apple color, as these
processes occur simultaneously. However, also information in the near infrared part of the

18
spectrum is used. The water peak round 970 nm (2nd overtone of O-H) is used for the
prediction of the Streif index. For the prediction of physiological maturity (number of days
before the optimal harvest date), Peirs et al. (2005) found a correlation with the overtone
absorption bands of O-H bonds. The authors suggested this could be due to the deterioration
of the cell walls during ripening, causing water molecules to enter the intercellular spaces.
The water hereby changes the refractive index at the cell walls and therefore also the
scattering properties inside the apple tissue (Peirs et al., 2005). However, this hypothesis no
longer stands as it was shown that no liquid water is present in the intercellular spaces of
apples (Verboven et al., 2008).
3.3.2 External validation of the models using apple data from another orchard
In the following analysis, the models built on the data from Sint-Truiden were used to
predict the different parameters for the apples from the other orchard location (Rillaar). The
results of this external validation have been summarized in Table 3.
The results in Table 3 show predictions with higher RMSEP values. Moreover, because of
the smaller variation in the predicted data (SDP), the RPD values will be much lower
compared to the validation on data from Sint-Truiden (Table 1).The SDP and RMSEP values
are close to each other, resulting in RPD values close to 1. This implies that the models are
not capable of predicting the parameter of interest in an accurate way (Williams & Sobering,
1993). A possible explanation could be that the data from Rillaar consists of only four
measurement days and shows a different development in time (Figure 3). The ripening in
Rillaar was slower compared to Sint-Truiden causing the model to have problems predicting
this course. Looking at the predictions of the Streif index and the starch conversion values,
mostly one measurement day is badly predicted, causing the high RMSEP values (data not
shown). The prediction of SSC and firmness values is shown in Figure 7.
From Figure 7 it is clear that the apple quality parameters are difficult to predict if the model
has been built on data from another orchard. Firmness values seem to be overestimated,

19
while the SSC values are mostly underestimated. Additionally, this orchard-specific effect is
probably season dependent, as was also shown in previous studies (Peirs et al., 2003). The
prediction models might potentially be improved by using calibration transfer techniques, in
which a model is transferred between different conditions (Feudale et al., 2002). Typical
examples of such conditions can be changes in the physical and/or chemical constitution of
the samples, changes in the instrumental response function or changes in the instrument’s
environment, etc.. Several techniques have been proposed by different authors, but
nevertheless, a future measuring system should be robust and should be able to cope with
this variability. In this research, the main variation expected in the data is attributed to a
difference in the maturity stage at the different orchards. The sensor and calibration of the
sensor is identical in both the data from Sint-Truiden and Rillaar, as the samples are
measured within a time span of 2 days on the same laboratory setup. Therefore, more
measurements at different locations are needed to build robust calibration models, useful to
predict quality parameters in consecutive years (Bobelyn et al., 2010).
3.4 Grouping apples into maturity classes
As maturity determination in future field applications is one of the eventual goals, the
possibility of predicting the maturity stage of an apple close to harvest was studied more in
detail. The preprocessing applied for predicting the Streif index was the same as used in the
previous analysis: a Savitzky-Golay 1st order derivative and mean centering. In Figure 8 the
predicted Streif index values for the measurements close to harvest have been plotted
against their measured values.
The R2 of prediction of 0.86 and an RMSEP of 0.0534 shows that a good prediction of the
Streif index close to harvest is possible. However, the RPD of prediction for this model using
7 latent variables is only 1.47. In Figure 8 the maturity boundaries for Braeburn apples are
indicated with dashed lines. A Streif index higher than 0.2 indicates that the apples are not
mature yet, while a Streif index lower than 0.14 means the apples are beyond the optimal
harvest maturity. All the apples from the last three measurement days are predicted correctly
20
as being too mature. At the maturity boundaries some errors occurred, but in total only
12.5% of the test set measurements were misclassified.
3.5 General discussion
Pathange et al. (2006) used electronic nose measurements to classify Gala apples
into three maturity classes based on the Streif index, with a classification error of 17%.
Similar measurements by Saevels et al. (2003) showed good correlations when predicting
the Streif index of Braeburn apples (R=0.96). However, the authors found difficulties with the
external validation over the years, showing again the importance of robust calibration models
(Saevels et al., 2003). Yet, these measurements require an extensive sample preparation
and are difficult to perform on apples in the orchard, on the tree. Optical measurements using
Vis/NIR spectroscopy gave good validation correlations (0.85-0.90) when predicting the Streif
index pre-harvest (Peirs et al., 2001). However, in Vis/NIR spectroscopy measurements, the
prediction is often based on an average reflectance value from multiple spatial locations. The
presented results suggest that the choice of the distance from illumination and the used
detector size is important to improve Vis/NIR reflectance results. By using different
bandwidths and distances from illumination and thus optimizing the measurement
configuration, more information can be retrieved. Both the comprehensibility of the results
and the relation with destructive parameters are improved.
The correlations with the Streif index as a maturity indicator show good results, but there are
some limitations as well. The Streif index is only as accurate as the parameters from which it
is calculated. Especially the starch conversion value is a rather subjective and important
parameter. A value between 1 and 10 is given based on the visual comparison of the
generated apple color pattern and a color chart. This scoring is subjective and can differ
between different operators and even for an operator measuring the same apple (Peirs et al.,
2002). The determination of firmness and SSC are both susceptive to apple variations as
well, but the measurement techniques are more reliable. Therefore two measurements on
opposite equatorial positions of the apple were averaged to eventually have one overall
21
maturity parameter per fruit. Another source of variation is the optical measurement itself. As
it is a point measurement, only one part of the apple is monitored. However, a measurement
is always taken at the red side, giving information on the apple like it would be encountered
in the field. At last, the Streif index maturity window chosen for the maturity determination of
Braeburn apples differs depending on the consulted source as this parameter is region
dependent (Streif, 1996). Nevertheless, the obtained result in paragraph 3.4 shows the
potential of predicting the maturity class, regardless of the chosen harvest window.
A further improvement of the obtained images could possibly be made by incorporating a
distortion correction to compensate for the curvature of the apple. Peng & Lu (2006) and Qin
& Lu (2008) showed that a correction based on the (modified) Lambertian cosine law
improved their prediction results. However, as a larger effect is expected at larger distances
form the illumination spot, here the improvement might be less as in this research only a
glow spot diameter of about 10 mm is obtained. Moreover, these distortion correction
techniques assume that the apple is spherical. As this is not always the case, an
improvement of the results might not be achieved.
Although information at different distances from the illumination has been considered, the
potential of the obtained diffuse reflectance images has not yet been fully exploited. In this
study, a distinction has been made between photons which have interacted with different
parts of the sample. However, the diffuse reflectance profiles also combine information on
the absorption and scattering phenomena inside the different parts of the apple. Models that
theoretically describe light propagation through multilayered tissues could be used to extract
the absorption and scattering properties of each of the separate tissue layers (Aernouts et
al., 2013; Fraser et al., 2003; Watté et al., 2013). This information could be beneficial in
predicting specific quality attributes. Chemical properties (e.g. SSC) are expected to show a
higher correlation with the pure absorption, while physical properties (e.g. firmness) could be
related to the scattering properties of the material.

22
It should be noted that the main interest of this article was to investigate the
possibilities of the measurement technique in a laboratory environment. Before an evolution
towards a mechanical harvesting system for apples is possible, measurements have to be
performed in the orchard. To use the laser reflectance technique in field conditions a
transition from a lab setup towards a field setup should be made. The setup currently uses
the combination of a supercontinuum laser with a monochromator. This setup configuration is
expensive, slow and above all not designed to be used in field conditions (vibrations, stray
light, temperature variations,…). These problems could be solved by going from a
hyperspectral setup towards a multispectral setup (using only a few wavelengths). For this, a
more extensive variable selection (wavelength selection) should be performed resulting in a
low number of wavelengths to be retained for a good prediction of the maturity. Furthermore,
this technology has the potential for quality monitoring of other fruits and vegetables. Other
researchers have used a similar technique based on backscattered photons to measure
tomatoes (Tu et al., 2000), peaches (Lu & Peng, 2006), drying banana slices (Romano et al.,
2008) and bell pepper (Romano et al., 2012), showing the wider applicability of the studied
technique.
However, before taking the step towards field applications, more measurements have to be
performed including apples from different orchards, cultivars and measurement years. In this
way, better calibration models can be obtained, capable of predicting the maturity stage of an
apple during the next harvesting season.
4. Conclusions
A spatially resolved laser reflectance measurement setup, operating in the Vis/NIR
range (550 – 1000 nm) and measuring the diffuse reflectance at different distances from the
illumination, was elaborated in this study. First, the distance from illumination and the
bandwidth of this distance information was varied to build PLS models. SSC values were
best predicted using information closer to the illumination spot, mainly related to the photons
23
which only interacted with the fruit skin. Other parameters, like the starch value required
information further away from the illumination spot, where photons have interacted more with
the fruit flesh. Also for firmness, which is mostly related to the fruit flesh, larger distances
from the illumination compared to the SSC prediction distances showed better correlations.
For the prediction of the Streif index itself, an intermediate distance was found to be optimal.
This could have been expected as this parameter is a combination of the others. Eventually,
a detector size of 0.82 mm at parameter specific distances was chosen to predict apple
quality for this measurement configuration.
A reduction from 91 wavelengths to 30 wavelengths was made using a forward iPLS
variable selection algorithm. The selected wavelength intervals indicate that the fruit
pigments (anthocyanin, chlorophyll) and water are important parameters in predicting apple
quality. When using data of only one orchard (internal test set), the Streif index and starch
values were predicted well, with an R2 of prediction of 0.98 and 0.93 respectively. SSC and
firmness values were predicted less accurately with an R2P value of 0.81 and 0.65
respectively. Using an external test set, with apples from a different orchard, the predictions
were less accurate with RPD values around 1. The main cause was the low initial variation in
the test data set combined with a different ripening course. More measurements from
different orchard locations and different seasons could help in improving these calibration
models.
When focusing on the prediction of maturity (Streif index) around harvest, results
showed that a maturity decision: unripe, ripe or overripe can be made with a misclassification
rate of 12.5%. While these results are promising, several steps are still required before this
system can be used in the field.
Acknowledgements
This research was funded by the European Commission in the 7th Framework Programme
(CROPS GA no 246252). Robbe Van Beers is a PhD student funded by the Institute for the
24
Promotion of Innovation through Science and Technology in Flanders (IWT-Flanders, grant
131777). Ben Aernouts has been funded as an aspirant of the Research Foundation-
Flanders (FWO-Flanders, grant 11A4813N). The authors gratefully acknowledge the support
of the Flanders Centre of Postharvest Technology (VCBT). The co-workers of VCBT, Bert
Verlinden, Elfie Dekempeneer, Bert Vandebosch and Sofie Mannaerts are acknowledged for
assisting with destructive measurements and picking of the apples. The experimental
stations in Sint-Truiden (pcfruit vzw) and the ‘Fruitteeltcentrum’ in Rillaar (both in Belgium)
are acknowledged for providing the apples.
5. References
Aernouts, B., Polshin, E., Lammertyn, J., & Saeys, W. (2011). Visible and near-infrared spectroscopic analysis of raw milk for cow health monitoring: reflectance or transmittance? Journal of Dairy Science, 94(11), 5315–29. doi:10.3168/jds.2011-4354 Aernouts, B., Zamora-Rojas, E., Van Beers, R., Watté, R., Wang, L., Tsuta, M., Lammertyn, J., & Saeys, W. (2013). Supercontinuum laser based optical characterization of Intralipid® phantoms in the 500-2250 nm range. Optics Express, 21(26), 32450–67. doi:10.1364/OE.21.032450 Baeten, J., Donné, K., Boerdrij, S., Beckers, W., & Claesen, E. (2008). Field and Service Robotics. In C. Laugier & R. Siegwart (Eds.), Field and Service Robotics: Results of the 6th international Conference, Chamonix, France (Vol. 42, pp. 531–539). Heidelberg: Springer-Verlag Berlin. doi:10.1007/978-3-540-75404-6 Baiano, A., Terracone, C., Peri, G., & Romaniello, R. (2012). Application of hyperspectral imaging for prediction of physico-chemical and sensory characteristics of table grapes. Computers and Electronics in Agriculture, 87, 142–151. doi:10.1016/j.compag.2012.06.002 Bobelyn, E., Serban, A.-S., Nicu, M., Lammertyn, J., Nicolai, B. M., & Saeys, W. (2010). Postharvest quality of apple predicted by NIR-spectroscopy: Study of the effect of biological variability on spectra and model performance. Postharvest Biology and Technology, 55(3), 133–143. doi:10.1016/j.postharvbio.2009.09.006 Cen, H., Lu, R., Mendoza, F. A., & Ariana, D. P. (2012). Assessing multiple quality attributes of peaches using optical absorption and scattering properties. Transactions of the ASABE, 55(2), 647–658. Chang, C.-W., Laird, D. A., Mausbach, M. J., & Hurburgh Jr., C. R. (2001). Near-Infrared Reflectance Spectroscopy - Principal Components Regression Analyses of Soil Properties. Soil Sci. Soc. Am. J., 65, 480–490. doi:10.2136/sssaj2001.652480x De-An, Z., Jidong, L., Wei, J., Ying, Z., & Yu, C. (2011). Design and control of an apple harvesting robot. Biosystems Engineering, 110(2), 112–122. doi:10.1016/j.biosystemseng.2011.07.005
25
Feudale, R. N., Woody, N. a., Tan, H., Myles, A. J., Brown, S. D., & Ferré, J. (2002). Transfer of multivariate calibration models: A review. Chemometrics and Intelligent Laboratory Systems, 64(2), 181–192. doi:10.1016/S0169-7439(02)00085-0 Fraser, D. G., Jordan, R. B., Künnemeyer, R., & McGlone, V. A. (2003). Light distribution inside mandarin fruit during internal quality assessment by NIR spectroscopy. Postharvest Biology and Technology, 27, 185–196. doi:10.1016/S0925-5214(02)00058-3 Harker, F. R., Kupferman, E. M., Marin, A. B., Gunson, F. A., & Triggs, C. M. (2008). Eating quality standards for apples based on consumer preferences. Postharvest Biology and Technology, 50(1), 70–78. doi:10.1016/j.postharvbio.2008.03.020 Kemps, B., Saeys, W., Mertens, K., Darius, P., De Baerdemaeker, J., & De Ketalaere, B. (2010). The importance of choosing the right validation strategy in inverse modelling. Journal of Near Infrared Spectroscopy, 18(1), 231. doi:10.1255/jnirs.882 Knee, M. (1972). Anthocyanin, Carotenoid, and Chlorophyll Changes in the Peel of Cox’s Orange Pippin Apples during Ripening on and off the Tree. Journal of Experimental Botany, 23(1), 184–196. doi:10.1093/jxb/23.1.184 Kolb, C. A., Wirth, E., Kaiser, W. M., Meister, A., Riederer, M., & Pfündel, E. E. (2006). Noninvasive evaluation of the degree of ripeness in grape berries (vitis vinifera L. Cv. Bacchus and silvaner) by chlorophyll fluorescence. Journal of Agricultural and Food Chemistry, 54(2), 299–305. doi:10.1021/jf052128b Kompetenzzentrum Obstbau-Bodensee. (2011). Ernteterminbestimmung von Äpfeln nach der F/RS-Methode von Streif. Retrieved from http://www.kob-bavendorf.de/arbeitsbereiche/Lagerung/bestimmung-des-optimalen-erntetermins Lammertyn, J., Nicolaï, B., De Smedt, V., & De Baerdemaeker, J. (1998). Non-Destructive Measurement of PH, Soluble Solids and Firmness of Jonagold Apples using NIR-spectroscopy. Transactions of the ASAE, 41(4), 1089–1094. doi:10.13031/2013.17238 Lammertyn, J., Peirs, A., De Baerdemaeker, J., & icola , . ( 000). Light penetration properties of NIR radiation in fruit with respect to non-destructive quality assessment. Postharvest Biology and Technology, 18(2), 121–132. doi:10.1016/S0925-5214(99)00071-X Lancaster, J. E., Grant, J. E., Lister, C. E., & Taylor, M. C. (1994). Skin Color in Apples - Influence of Copigmentation and Plastid Pigments on Shade and Darkness of Red Color in Five Genotypes. Journal of the American Society for Horticultural Science, 119(1), 63–69. Lu, R. (2004). Multispectral imaging for predicting firmness and soluble solids content of apple fruit. Postharvest Biology and Technology, 31(2), 147–157. doi:10.1016/j.postharvbio.2003.08.006 Lu, R., & Peng, Y. (2006). Hyperspectral Scattering for assessing Peach Fruit Firmness. Biosystems Engineering, 93(2), 161–171. doi:10.1016/j.biosystemseng.2005.11.004 McGlone, V. A., Jordan, R. B., & Martinsen, P. J. (2002). Vis/NIR estimation at harvest of pre- and post-storage quality indices for “Royal Gala” apple. Postharvest Biology and Technology, 25(2), 135–144. doi:10.1016/S0925-5214(01)00180-6 Merzlyak, M. N., Solovchenko, A. E., & Gitelson, A. A. (2003). Reflectance spectral features and non-destructive estimation of chlorophyll, carotenoid and anthocyanin content in apple

26
fruit. Postharvest Biology and Technology, 27(2), 197–211. doi:10.1016/S0925-5214(02)00066-2 Mollazade, K., Omid, M., Tab, F. A., & Mohtasebi, S. S. (2012). Principles and Applications of Light Backscattering Imaging in Quality Evaluation of Agro-food Products: a Review. Food and Bioprocess Technology, 5(5), 1465–1485. doi:10.1007/s11947-012-0821-x Nguyen Do Trong, N., Erkinbaev, C., Tsuta, M., De Baerdemaeker, J., Nicolaï, B., & Saeys, W. (2014). Spatially resolved diffuse reflectance in the visible and near-infrared wavelength range for non-destructive quality assessment of “ raeburn” apples. Postharvest Biology and Technology, 91, 39–48. doi:10.1016/j.postharvbio.2013.12.004 Nicolaï, B. M., Beullens, K., Bobelyn, E., Peirs, A., Saeys, W., Theron, K. I., & Lammertyn, J. (2007). Nondestructive measurement of fruit and vegetable quality by means of NIR spectroscopy: A review. Postharvest Biology and Technology, 46(2), 99–118. doi:10.1016/j.postharvbio.2007.06.024 Pathange, L. P., Mallikarjunan, P., Marini, R. P., O’Keefe, S., & Vaughan, D. ( 006). on-destructive evaluation of apple maturity using an electronic nose system. Journal of Food Engineering, 77(4), 1018–1023. doi:10.1016/j.jfoodeng.2005.08.034 Peirs, A., Lammertyn, J., Ooms, K., & Nicolaï, B. M. (2001). Prediction of the optimal picking date of different apple cultivars by means of VIS/NIR-spectroscopy. Postharvest Biology and Technology, 21(2), 189–199. doi:10.1016/S0925-5214(00)00145-9 Peirs, A., Scheerlinck, ., erna Pere , A., Jancs k, P., & icola , . M. ( 00 ). ncertainty analysis and modelling of the starch index during apple fruit maturation. Postharvest Biology and Technology, 26(2), 199–207. doi:10.1016/S0925-5214(02)00038-8 Peirs, A., Schenk, A., & icola , . M. ( 00 ). ffect of natural variability among apples on the accuracy of VIS-NIR calibration models for optimal harvest date predictions. Postharvest Biology and Technology, 35(1), 1–13. doi:10.1016/j.postharvbio.2004.05.010 Peirs, A., Tirry, J., Verlinden, ., Darius, P., & icola , . M. ( 00 ). ffect of biological variability on the robustness of NIR models for soluble solids content of apples. Postharvest Biology and Technology, 28(2), 269–280. doi:10.1016/S0925-5214(02)00196-5 Peng, Y., & Lu, R. (2006). Improving apple fruit firmness predictions by effective correction of multispectral scattering images. Postharvest Biology and Technology, 41(3), 266–274. doi:10.1016/j.postharvbio.2006.04.005 Peng, Y., & Lu, R. (2008). Analysis of spatially resolved hyperspectral scattering images for assessing apple fruit firmness and soluble solids content. Postharvest Biology and Technology, 48(1), 52–62. doi:10.1016/j.postharvbio.2007.09.019 Peterson, D. L. (2005). Harvest Mechanization Progress for Fresh Market Quality Deciduous Tree Fruits. Hort Technology, 15(1), 72–75. Pissard, A., Baeten, V., Romnée, J., Dupont, P., Mouteau, A., & Lateur, M. (2012). Classical and NIR measurements of the quality and nutritional parameters of apples: a methodological study of intra-fruit variability. Biotechnology, Agronomy, Society and Environment (BASE), 16(3), 294–306.

27
Qin, J., & Lu, R. (2008). Measurement of the optical properties of fruits and vegetables using spatially resolved hyperspectral diffuse reflectance imaging technique. Postharvest Biology and Technology, 49(3), 355–365. doi:10.1016/j.postharvbio.2008.03.010 Romano, G., Argyropoulos, D., Nagle, M., Khan, M. T., & Müller, J. (2012). Combination of digital images and laser light to predict moisture content and color of bell pepper simultaneously during drying. Journal of Food Engineering, 109(3), 438–448. doi:10.1016/j.jfoodeng.2011.10.037 Romano, G., Baranyai, L., Gottschalk, K., & Zude, M. (2008). An Approach for Monitoring the Moisture Content Changes of Drying Banana Slices with Laser Light Backscattering Imaging. Food and Bioprocess Technology, 1(4), 410–414. doi:10.1007/s11947-008-0113-7 Romano, G., Nagle, M., Argyropoulos, D., & Müller, J. (2011). Laser light backscattering to monitor moisture content, soluble solid content and hardness of apple tissue during drying. Journal of Food Engineering, 104(4), 657–662. doi:10.1016/j.jfoodeng.2011.01.026 Saevels, S., Lammertyn, J., Berna, A. Z., Veraverbeke, E. A., Di Natale, C., & Nicolaï, B. M. (2003). Electronic nose as a non-destructive tool to evaluate the optimal harvest date of apples. Postharvest Biology and Technology, 30(1), 3–14. doi:10.1016/S0925-5214(03)00059-0 Sarig, Y. (1993). Robotics of Fruit Harvesting: A State-of-the-art Review. Journal of Agricultural Engineering Research, 54(4), 265–280. doi:10.1006/jaer.1993.1020 Streif, J. (1996). Optimum harvest date for different apple cultivars in the “ odensee” area. In A. de Jager & D. Johnson (Eds.), The Postharvest Treatment of Fruit and Vegetables: Determination and Prediction of Optimum Harvest Date of Apple and Pears. COST 94 (pp. 15–20). Brussels, Belgium. Torricelli, A., Spinelli, L., Vanoli, M., Leitner, M., Nemeth, A., Nguyen Do Trong, N., Nicolaï, B., & Saeys, W. (2013). Optical coherence tomography (OCT), space-resolved reflectance spectroscopy (SRS) and time-resolved reflectance spectroscopy (TRS): principles and applications to food microstructures (pp. 132–162). Elsevier. doi:10.1533/9780857098894.1.132 Tu, K., Jancsok, P., Nicolai, B., & De Baerdemaeker, J. (2000). Use of laser-scattering imaging to study tomato-fruit quality in relation to acoustic and compression measurements. International Journal of Food Science and Technology, 35(5), 503–510. doi:10.1046/j.1365-2621.2000.00407.x Van Beers, R., Aernouts, B., De Baerdemaeker, J., & Saeys, W. (2013). Apple ripeness detection using hyperspectral laser scatter imaging. In Proceedings of SPIE (p. 5). doi:10.1117/12.2030569 Vanoli, M., Rizzolo, A., Grassi, M., Farina, A., Pifferi, A., Spinelli, L., & Torricelli, A. (2011). Time-resolved reflectance spectroscopy nondestructively reveals structural changes in “Pink Lady®” apples during storage. Procedia Food Science, 1, 81–89. doi:10.1016/j.profoo.2011.09.014 Verboven, P., Kerckhofs, G., Mebatsion, H. K., Ho, Q. T., Temst, K., Wevers, M., Cloetens, P., & Nicolaï, B. M. (2008). Three-dimensional gas exchange pathways in pome fruit characterized by synchrotron x-ray computed tomography. Plant Physiology, 147(June), 518–527. doi:10.1104/pp.108.118935

28
Watté, R., Nguyen Do Trong, N., Aernouts, B., Erkinbaev, C., De Baerdemaeker, J., Nicolaï, B., & Saeys, W. (2013). Metamodeling approach for efficient estimation of optical properties of turbid media from spatially resolved diffuse reflectance measurements. Optics Express, 21(26), 32630. doi:10.1364/OE.21.032630 Williams, P. C., & Sobering, D. C. (1993). Comparison of commercial near infrared transmittance and reflectance instruments for analysis of whole grains and seeds. J. Near Infrared Spectrosc., 1, 25–32. doi:10.1255/jnirs.3 Zamora-Rojas, E., Garrido-Varo, A., Aernouts, B., Pérez-Marín, D., Saeys, W., Yamada, Y., & Guerrero-Ginel, J. E. (2014). Understanding Near-Infrared Radiation Propagation in Pig Skin Reflectance Measurements. Innovative Food Science & Emerging Technologies. doi:10.1016/j.ifset.2014.01.006

29
Fig. 1 Schematic overview of the setup used for Vis/NIR hyperspectral spatially resolved laser reflectance measurements in the 550-1000 nm range; BS = Polka-dot beam splitter; CCD = charge-coupled device; D = Silica detector; DAQ = data acquisition card; F = Filter; FW = Filter Wheel; L = Lens; M = Mirror
Fig. 2 a) Image of an apple glow spot at 750 nm expressed after dark and white correction; the black circle indicates a distance of 0.63 mm from the illumination spot edge; b) SRS profile after radial averaging of the dark and white corrected image at 750 nm; the vertical dashed line indicates a distance of 0.63 mm from the illumination spot edge (0,0); the grey marked area is located at 3.69 mm from the illumination spot edge and corresponds to a detector size of 0.82 mm

30
Fig. 3 Streif index starting at 40 days before commercial harvest, in both Sint-Truiden and Rillaar, on a logarithmic scale; the dotted horizontal lines indicate the optimal maturity range for picking Braeburn apples; the dotted vertical lines indicate the harvesting window for the 2013 season of Braeburn apples.
Fig. 4 SRS profiles for the different wavelengths measured with the laser reflectance setup on the red side of an apple; the black arrows indicate the main absorption features which correspond from left to right to anthocyanins, chlorophyll and water.

31
Fig. 5 R2 of prediction for the different destructive parameters as a function of the distance from the illumination spot edge (Y-axis). The X-axis shows the bandwidth or detector size used in the analysis. Both (a) the Streif Index and (b-d) its individual parameters are shown. The white arrows indicate the best combination of illumination-detection distance and bandwidth (used in further analysis).
32
Fig. 6 Relation between predicted and measured Streif index for Sint-Truiden; five measurement days are used for calibration (open circles), while three measurement days are used for validation (crosses)
Fig. 7 Relation between predicted and measured (a) Firmness values and (b) SSC values; the dataset from Sint-Truiden is used as a calibration set (open circles) while the dataset from Rillaar is used as test set (crosses)

33
Fig. 8 Relation between predicted and measured Streif index on a logarithmic scale for Sint-Truiden; the dashed lines represent the maturity thresholds for Braeburn (Streif index of 0.2 and 0.14)
34
Table 1 Sint-Truiden calibration models for the prediction of the Streif index, SSC, firmness and starch values
LV R2CV R2
P RMSECV RMSEP SDP RPDP
Streif Index 6 0.9618 0.9797 0.1001 0.0616 0.36 5.84
Firmness 7 0.7525 0.6506 0.7094 0.7509 1.25 1.66
SSC 7 0.8996 0.8104 0.4401 0.5716 1.19 2.07
Starch value 5 0.9630 0.9301 0.7141 0.7849 2.68 3.42
LV, number of latent variables; R2
CV, coefficient of determination of cross-validation; R2
P, coefficient of determination of the test set prediction; RMSECV, RMSEP, root mean error of cross-validation and prediction respectively; SDP, standard deviation of test set; RPDP, ratio of performance to deviation (of prediction).
RMSECV, RMSEP and SDP are expressed in [log(kg cm-2
°Brix-1
)] for the Streif index, [kg cm-2
] for firmness and [°Brix] for the SSC values. The starch conversion scores are unitless (values range from score 1 to score 10).
Table 2 Wavelength intervals selected by iPLS and used in the PLS models of the different quality parameters.
Bold typed intervals include the absorption region of chlorophyll, while the italic intervals include the absorption region of anthocyanin. The underlined interval includes the absorption peak of water.
Wavelengths intervals used (nm)
Streif Index 675-695; 725-770; 850-895; 975-995
Firmness 550-620; 725-745; 775-820
SSC 550-595; 650-695; 725-745; 800-820
Starch value 575-595; 675-745; 775-795; 850-870
Table 3 Performance statistics of the calibration models from Sint-Truiden for prediction of the Streif index, SSC
value, firmness index and starch value validated for the apples from Rillaar
R2P RMSEP SDP
Streif Index 0.8632 0.1748 0.1598
Firmness 0.4717 1.1077 1.0381
SSC 0.3951 0.9477 0.8407
Starch value 0.9478 1.8507 0.6637
Abbreviations and units as explained in footnote of Table 1.