optimal seism pbd of rc blgs using pushover anal -05
TRANSCRIPT
8/8/2019 Optimal Seism PBD of RC Blgs Using Pushover Anal -05
http://slidepdf.com/reader/full/optimal-seism-pbd-of-rc-blgs-using-pushover-anal-05 1/14
Engineering Structures 27 (2005) 1289–1302
www.elsevier.com/locate/engstruct
Optimal seismic performance-based design of reinforced concretebuildings using nonlinear pushover analysis
X.-K. Zou, C.-M. Chan∗
Department of Civil Engineering, Hong Kong University of Science and Technology, Kowloon, Hong Kong, China
Received 29 April 2004; received in revised form 23 March 2005; accepted 4 April 2005
Available online 10 May 2005
Abstract
Performance-based design using nonlinear pushover analysis, which generally involves tedious and intensive computational effort, is a
highly iterative process needed to meet designer-specified and code requirements. This paper presents an effective computer-based technique
that incorporates pushover analysis together with numerical optimization procedures to automate the pushover drift performance design of
reinforced concrete (RC) buildings. Steel reinforcement, as compared with concrete materials, appears to be the more cost-effective material,
that can be effectively used to control drift beyond the occurrence of first yielding and to provide the required ductility of RC building
frameworks. In this study, steel reinforcement ratios are taken as design variables during the design optimization process. Using the principle
of virtual work, the nonlinear inelastic seismic drift responses generated by the pushover analysis can be explicitly expressed in terms of
element design variables. An optimality criteria technique is presented in this paper for solving the explicit performance-based seismic
design optimization problem for RC buildings. Two building frame examples are presented to illustrate the effectiveness and practicality of
the proposed optimal design method.
© 2005 Elsevier Ltd. All rights reserved.
Keywords: Performance-based design; Pushover analysis; Virtual work; Plastic hinge; Structural optimization design; Optimality criteria method
1. Introduction
Performance-based design appears to be the future
direction of seismic design codes [1–3]. In the newly
developed performance-based seismic design approach,
nonlinear analysis procedures become important in iden-
tifying the patterns and levels of damage for assessing a
structure’s inelastic behavior and for understanding the fail-
ure modes of the structure during severe seismic events.
Pushover analysis is a simplified, static, nonlinear procedurein which a predefined pattern of earthquake loads is applied
incrementally to framework structures until a plastic col-
lapse mechanism is reached. This analysis method generally
adopts a lumped-plasticity approach that tracks the spread of
inelasticity through the formation of nonlinear plastic hinges
∗ Corresponding author. Tel.: +852 2358 7173; fax: +852 2358 1534.E-mail address: [email protected] (C.-M. Chan).
0141-0296/$ - see front matter © 2005 Elsevier Ltd. All rights reserved.
doi:10.1016/j.engstruct.2005.04.001
at the frame element’s ends during the incremental loading
process.
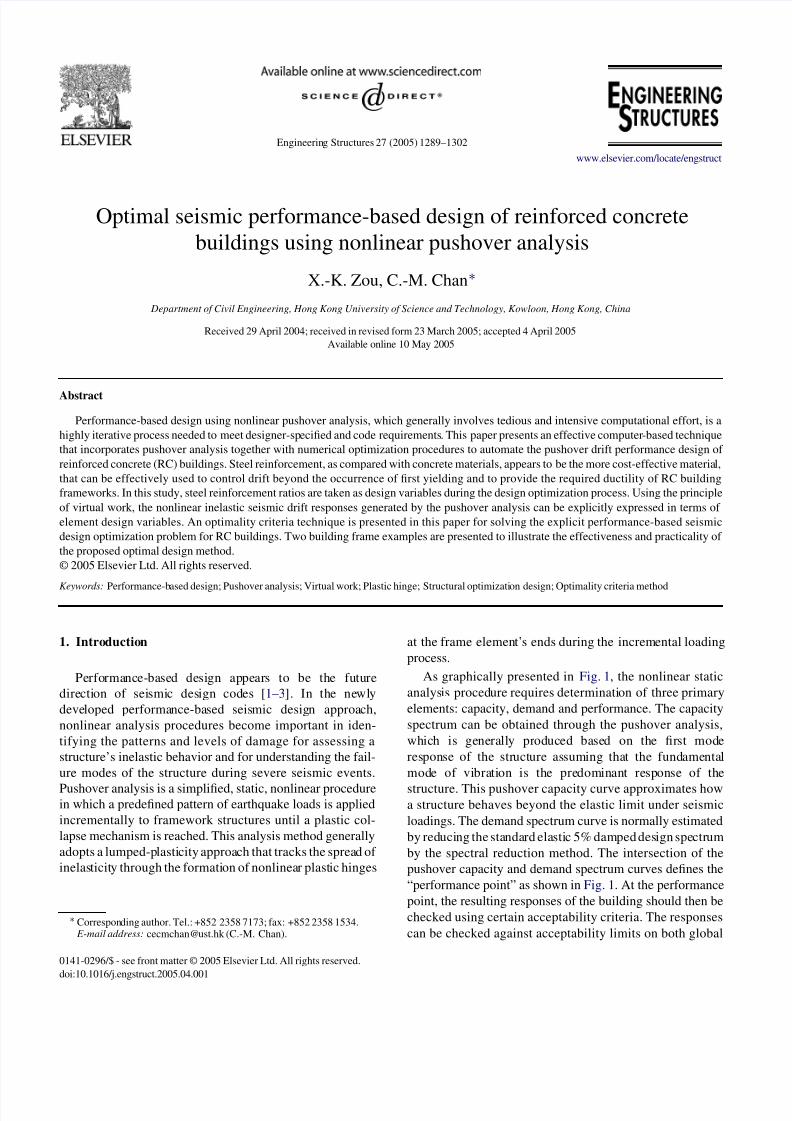
As graphically presented in Fig. 1, the nonlinear static
analysis procedure requires determination of three primary
elements: capacity, demand and performance. The capacity
spectrum can be obtained through the pushover analysis,
which is generally produced based on the first mode
response of the structure assuming that the fundamental
mode of vibration is the predominant response of the
structure. This pushover capacity curve approximates howa structure behaves beyond the elastic limit under seismic
loadings. The demand spectrum curve is normally estimated
by reducing the standard elastic 5% damped design spectrum
by the spectral reduction method. The intersection of the
pushover capacity and demand spectrum curves defines the
“performance point” as shown in Fig. 1. At the performance
point, the resulting responses of the building should then be
checked using certain acceptability criteria. The responses
can be checked against acceptability limits on both global
8/8/2019 Optimal Seism PBD of RC Blgs Using Pushover Anal -05
http://slidepdf.com/reader/full/optimal-seism-pbd-of-rc-blgs-using-pushover-anal-05 2/14
1290 X.-K. Zou, C.-M. Chan / Engineering Structures 27 (2005) 1289–1302
Fig. 1. Nonlinear analysis procedure.
system levels (such as the lateral load stability and theinterstory drift) and local element levels (such as the
element strength and the sectional plastic rotation) [2].
When the responses of a structure do not meet the targeted
performance level, the structure needs to be resized and
the design process repeated until a solution for the desired
performance level is reached. In general, the determination
of the satisfactory performance response that fulfills both the
system level response and element level response requires a
highly iterative trial-and-error design procedure even with
the aid of today’s engineering computer software.
It has been recognized that the interstory drift perfor-
mance of a multistory building is an important measure of structural and non-structural damage of the building under
various levels of earthquake motion [4]. In performance-
based design, interstory drift performance has become a
principal design consideration [1,2]. The system perfor-
mance levels of a multistory building are evaluated on the
basis of the interstory drift values along the height of the
building under different levels of earthquake motion [5]. The
control of interstory drift can also be considered as a means
to provide uniform ductility over all stories of the building.
A large story drift may result in the occurrence of a weak
story that may cause catastrophic building collapse in a seis-
mic event. Therefore, a uniform story ductility over all sto-
ries for a multistory building is usually desired in seismic
design [6].
Although lateral drift performance is a principal concern
in the seismic design of structures, economically designing
elements of building structures for various levels of elastic
and inelastic lateral drift performance under multiple
levels of earthquake load is generally a rather difficult
and challenging task. Lateral drift design requires the
consideration of a proper distribution of the stiffness of all
structural elements and, in a severe seismic event, also the
occurrence and redistribution of plasticity in the structural
elements. Structural engineers are faced with the problem
of efficiently proportioning structural materials throughoutthe building to limit the inelastic seismic drift responses of
a structure. Due to the lack of an automated optimization
technique, performance-based seismic drift design is usually
carried out by trial-and-error methods based on intuition and
experience.
Numerous studies on structural optimization in the
seismic design of structures have been published in the past
two decades, including Cheng and Botkin [7], Feng et al.
[8], Bhatti and Pister [9], Balling et al. [10], Cheng and
Truman [11], Arora [12]. However, most of these previous
research efforts were concerned with optimization through
prescriptive-based design concepts. Recently, Beck and hisassociates [13] developed an optimization methodology for
performance-based design of structural systems operating
in an uncertain dynamic environment. Ganzerli et al. [14]
presented an optimal performance-based design method for
a reinforced concrete (RC) frame, in which performance-
based constraints were implemented in terms of plastic
rotations of the beams and columns of the frame. Foley [15]
provided a review of current state-of-the-art seismic
performance-based design procedures and presented the
vision for the development of performance-based design
optimization. It has been recognized that there is a pressing
need for developing optimized performance-based design
procedures for seismic engineering of structures [15,16].
Chan [17,18] developed an efficient computer-based
optimization technique for lateral stiffness design of tall
buildings. The optimization technique, developed on the
basis of a rigorously derived Optimality Criteria (OC)
approach, is capable of optimizing large-scale tall steel
and/or reinforced concrete buildings subject to multiple
static wind drift and dynamic wind-induced vibration
design constraints. The effectiveness of the state-of-the-art
optimization technique has been demonstrated through its
actual design application to a number of the tall buildings
in Hong Kong [18]. It should be noted that the research has
8/8/2019 Optimal Seism PBD of RC Blgs Using Pushover Anal -05
http://slidepdf.com/reader/full/optimal-seism-pbd-of-rc-blgs-using-pushover-anal-05 3/14
X.-K. Zou, C.-M. Chan / Engineering Structures 27 (2005) 1289–1302 1291
been primarily focused on the wind-induced serviceability
performance design of tall buildings. Much effort is needed
to extend the current optimization technique to inelastic
seismic design of multistory buildings.
This paper presents an effective optimization technique
for the inelastic drift performance design of RC building
frames under pushover loading. Attempts have been madeto automate the performance-based seismic design of RC
buildings using an optimization procedure. The quantities of
steel reinforcement, the only effective material that provides
ductility to RC building frameworks, are considered as
design variables in the inelastic seismic drift optimization.
With careful tracking of the location and extent of plastic
hinge occurrence, the pushover drift can be explicitly
expressed in terms of the steel reinforcement sizing variables
using the principle of virtual work. The optimization
methodology for the solution of the nonlinear seismic drift
design of buildings is fundamentally based on an OC
approach. Two RC building frame examples are presented
in this paper. A simple, one-story, one-bay frame is firstpresented to verify the inelastic drift formulation. A ten-
story, two-bay planar frame building is then presented to
illustrate the details of the OC optimization method for
inelastic seismic drift performance-based design.
2. Optimal inelastic seismic design problem
2.1. Implicit design optimization problem
In seismic design, it is commonly assumed that a
building behaves linear-elastically under minor earthquakes
and may respond nonlinear-inelastically when subjectedto moderate and severe earthquakes. Under such an
assumption, the entire design optimization process can
therefore be decomposed into two phases [19–21]. In the
first phase, the structural concrete cost is minimized subject
to elastic drift responses under minor earthquake loading
using elastic response spectrum analysis. In this phase,
concrete member sizes are considered as the only design
variables since the concrete material plays a more dominant
role in improving the elastic drift performance of the
building. Once the optimal structural member sizes are
determined at the end of the first phase of the optimization,
the steel reinforcement quantities can then be consideredas design variables in the second phase. In controlling the
inelastic drift responses, steel reinforcement is the only
effective material that provides ductility to an RC building
structure beyond first yielding. In this second design phase,
the member sizes are kept unchanged and the cost of the steel
reinforcement is minimized subject to design constraints on
inelastic interstory drift produced by the nonlinear pushover
analysis. The emphasis of this paper is on the second phase
of the design optimization, the inelastic seismic drift design
optimization. The details of the first phase of the design
optimization (i.e., elastic seismic drift design optimization)
can be found in the work of Zou [21,22].
For an RC building having i = 1, 2, 3, . . . , N i members
and 2N i plastic hinges (assuming one hinge at each end of
a member), the tension steel reinforcement ratio, ρi , and the
compression steel reinforcement ratio, ρ
i, for a rectangular
cross section are taken as design variables in the design
optimization, whereas the member sizes, Bi (width) and Di
(depth), are fixed. If the topology of a building’s structuralsystem is predefined, the steel reinforcement cost of the RC
framework is minimized as
Minimize: steel cost =
N ii=1
wsi (Lsi ρi + Lsi ρ
i) (1)
where wsi is the cost coefficient for steel reinforcements;
and Lsi and L
si are respectively the lengths of the tension
and compression steel reinforcements for member i , which
can be predefined on the basis of code requirements. Only
the longitudinal flexural reinforcement of member sections
is considered as a design variable in this study, while the
transverse shear reinforcement is considered invariant underthe assumption that adequate shear capacity strength is
provided for each member.
In the performance-based design, it is necessary to
check the “capacity” of a structure against the “demand”
of an earthquake at the performance point. In this study,
the interstory drift responses of a building, generated
by a specified earthquake demand, are checked against
appropriate limits corresponding to a given performance
level. That is, for a multistory building structure, the
interstory drift ratio caused by pushover loading should
comply with the following requirement:
u j
h j=
u j − u j −
1h j
≤ d U j (2)
where u j is the interstory drift of the j th story; u j
and u j −1 are the respective story displacement of the two
adjacent j and j − 1 floor levels; h j is the j th story
height; and d U j is the specified interstory drift ratio limit
representing the damage threshold for the j th story.
Besides checking the interstory drift responses discussed
above, local response quantities (i.e., sectional plastic
rotation and strength of all members) at the performance
point also must not exceed appropriate response limits.
Therefore, the plastic rotation, θph , at the hth end of member
i (where the subscript h represents one end of a member andh = 1, 2) should be constrained in the optimization by
θph ≤ θU p (3)
where θU p is the rotation limit of member i for a specific
performance level. Once the designer determines the per-
formance levels of the structure (e.g., immediate occupancy,
life safety, collapse prevention), the corresponding limiting
value of θU p is then determined. Unless specific design crite-
ria are stated, ATC-40 [2] and FEMA-273 [3] provide guide-
lines for estimating the limiting values of plastic rotation
of the flexural members for various levels of performance
criteria of an RC frame. In practical multistory building
8/8/2019 Optimal Seism PBD of RC Blgs Using Pushover Anal -05
http://slidepdf.com/reader/full/optimal-seism-pbd-of-rc-blgs-using-pushover-anal-05 4/14
1292 X.-K. Zou, C.-M. Chan / Engineering Structures 27 (2005) 1289–1302
structures, an excessive number of design constraints may
create enormous increases in computational effort. In order
to reduce the practical building design problem to a manage-
able size, the strength design of each member is not consid-
ered explicitly as a design constraint; rather, the strength-
based steel reinforcement ratios in accordance with code
specifications are first calculated and these values are thentaken as the lower size bound for each member in the inelas-
tic seismic drift design optimization [21,22].
In addition to the design performance constraints on the
system-level story drift and element-level sectional plastic
rotation, the steel reinforcement variables are constrained
within the minimum and maximum steel reinforcement
ratios as
ρLi ≤ ρi ≤ ρU
i ; (4a)
ρLi ≤ ρ
i ≤ ρU i (4b)
where the superscripts L and U denote the minimum and
maximum limits of the design variables, ρi and ρ
i .In order to facilitate a numerical solution of the drift
design problem, it is necessary that the implicit story
drift constraint (Eq. (2)) and the plastic rotation constraint
(Eq. (3)) be expressed explicitly in terms of the design
variables, ρi and ρi .
2.2. Explicit drift formulation
Before the drift formulation is discussed, three assump-
tions must be made. The first is that all the inelastic defor-
mation is assumed to occur at the plastic hinges, which are
located at the ends of each frame member and members arefully elastic between the plastic hinges. Secondly, the plastic
hinges are assumed to be frictionless and have zero length.
The third assumption is that beam–column joints are much
stronger than any adjacent framing components so that the
joint region may be modelled as a stiff or rigid zone.
On the basis of the internal element forces and moments
of the structure obtained from the pushover analysis at
the performance point, the principle of virtual work can
be employed to express the pushover displacement. The
pushover story displacement, u j , at the performance point
is equal to the sum of the virtual work, u j,memb, produced
by the structural members and the virtual work, u j,hinge,generated by the plastic hinges. That is,
u j = u j,memb + u j,hinge (5)
in which
u j,memb =
N ii=1
Li
o
F X f X j
E A X
+F Y f Y j
G AY
+F Z f Z j
G A Z
+M X m X j
G I X
+M Y mY j
E I Y
+M Z m Z j
E I Z
dx
i
(6)
u j,hinge =
N i
i
=1
2
h
=1
m0p j hθph
i
. (7)
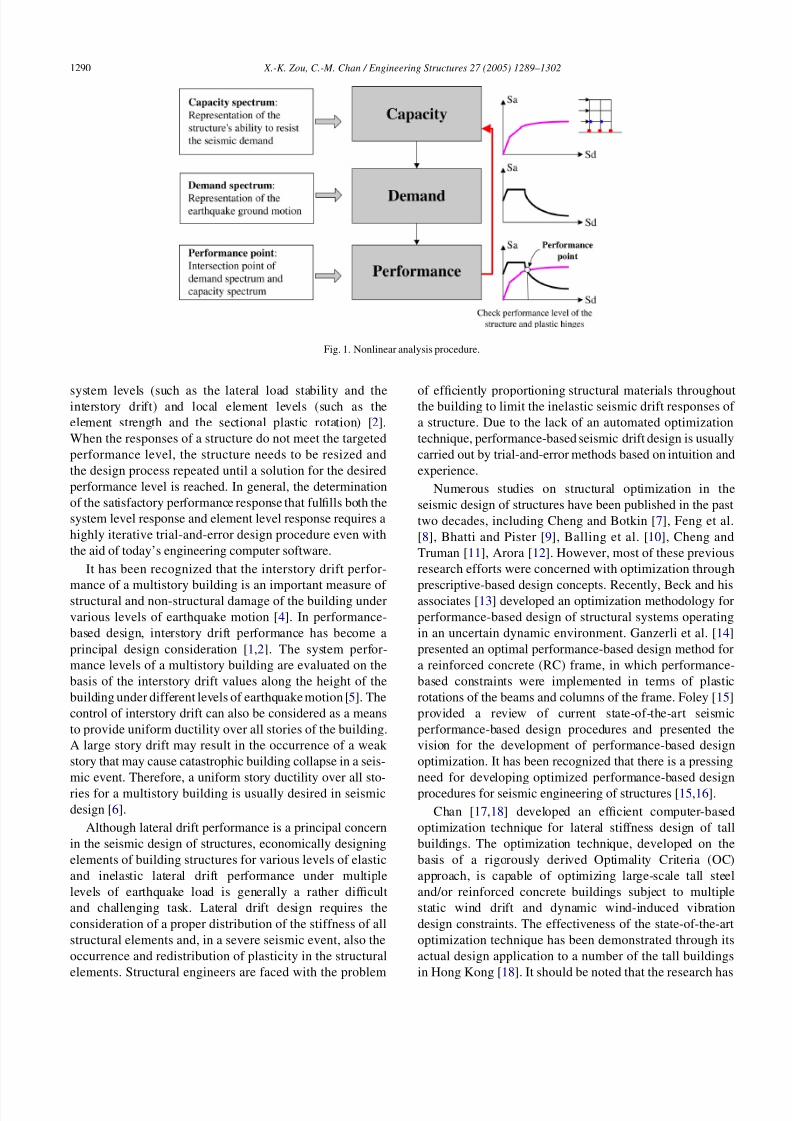
Fig. 2. Definition of local coordinate system.
In Eq. (6), Li is the length of member i ; E and G are the
axial and shear elastic material moduli; A X , AY and A Z are
the axial and shear areas for the cross-section; I X , I Y and
I Z are the torsional and flexural moments of inertia for the
cross-section; F X , F Y , F Z , M X , M Y and M Z are the element
internal forces and moments, as depicted in Fig. 2; f X j , f Y j ,f Z j , m X j , mY j and m Z j are the virtual element forces and
moments due to a unit virtual load applied to the building
at the location corresponding to the story displacement, u j .
Considering rectangular concrete elements with width (Bi)
and depth (Di ) and expressing the cross sectional properties
in terms of Bi and Di , the displacement, u j,memb, in Eq. (6)
can be simplified in terms of Bi and Di [18,21]. During
the inelastic drift design optimization process, u j,memb is
kept unchanged since Bi and Di of each member section
are fixed. That is, the displacement, u j,hinge, caused by the
formation of the plastic hinges alone varies.
In Eq. (7), m0
pj his the virtual end moment at the location
of the hth hinge of a member; θph is the actual plastic
rotation at the location of the hth plastic hinge of a member,
which is equal to zero when no plastic hinge is found.
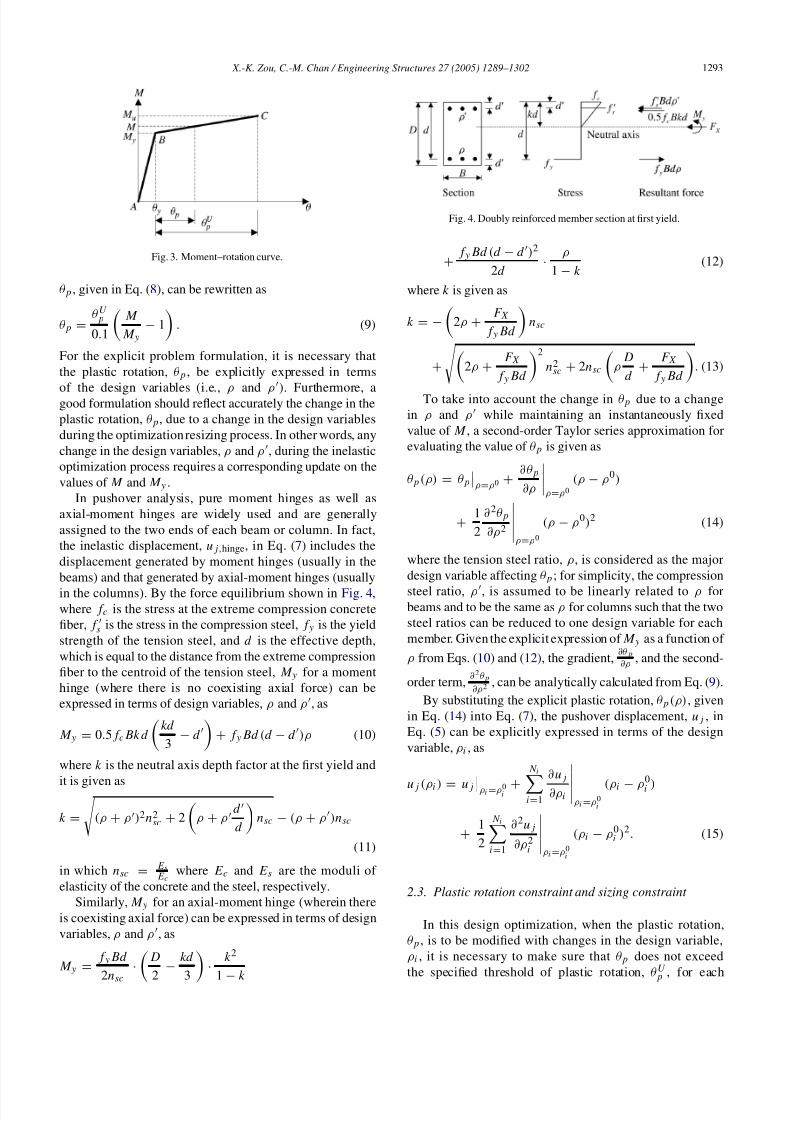
As shown in Fig. 3, the behavior of a plastic hinge is
modeled as a bilinear curve: the elastic segment, AB, and the
hardening segment, BC, where Point A corresponds to the
unloaded condition, Point B is the first yield moment point,
Point C is the ultimate moment capacity, which generally
corresponds to the structural stability performance level in
ATC-40 [2]. On the basis of the line segments A–B–C, the
plastic rotation, θp, can be given as follows:
θp = M − M yM u − M y
θU p ≤ θU
p (8)
where θU p is the ultimate plastic rotation which can be
established on the basis of experimental tests or can be
obtained directly from design guidelines such as the ATC-
40 [2]; M is the applied moment at the location of the plastic
hinge; M y is the bending moment at the first yielding of the
tensile steel; and M u is the ultimate moment of resistance.
Given the quantity of the steel reinforcement used in a
concrete section, the values of M y and M u can then be
determined. For simplicity, M u can be approximately related
to M y as M u = 1.1M y [2]. As a result, the plastic rotation,
8/8/2019 Optimal Seism PBD of RC Blgs Using Pushover Anal -05
http://slidepdf.com/reader/full/optimal-seism-pbd-of-rc-blgs-using-pushover-anal-05 5/14
X.-K. Zou, C.-M. Chan / Engineering Structures 27 (2005) 1289–1302 1293
Fig. 3. Moment–rotation curve.
θp , given in Eq. (8), can be rewritten as
θp =θU
p
0.1
M
M y− 1
. (9)
For the explicit problem formulation, it is necessary that
the plastic rotation, θp , be explicitly expressed in terms
of the design variables (i.e., ρ and ρ
). Furthermore, agood formulation should reflect accurately the change in the
plastic rotation, θp, due to a change in the design variables
during the optimization resizing process. In other words, any
change in the design variables, ρ and ρ, during the inelastic
optimization process requires a corresponding update on the
values of M and M y .
In pushover analysis, pure moment hinges as well as
axial-moment hinges are widely used and are generally
assigned to the two ends of each beam or column. In fact,
the inelastic displacement, u j,hinge, in Eq. (7) includes the
displacement generated by moment hinges (usually in the
beams) and that generated by axial-moment hinges (usually
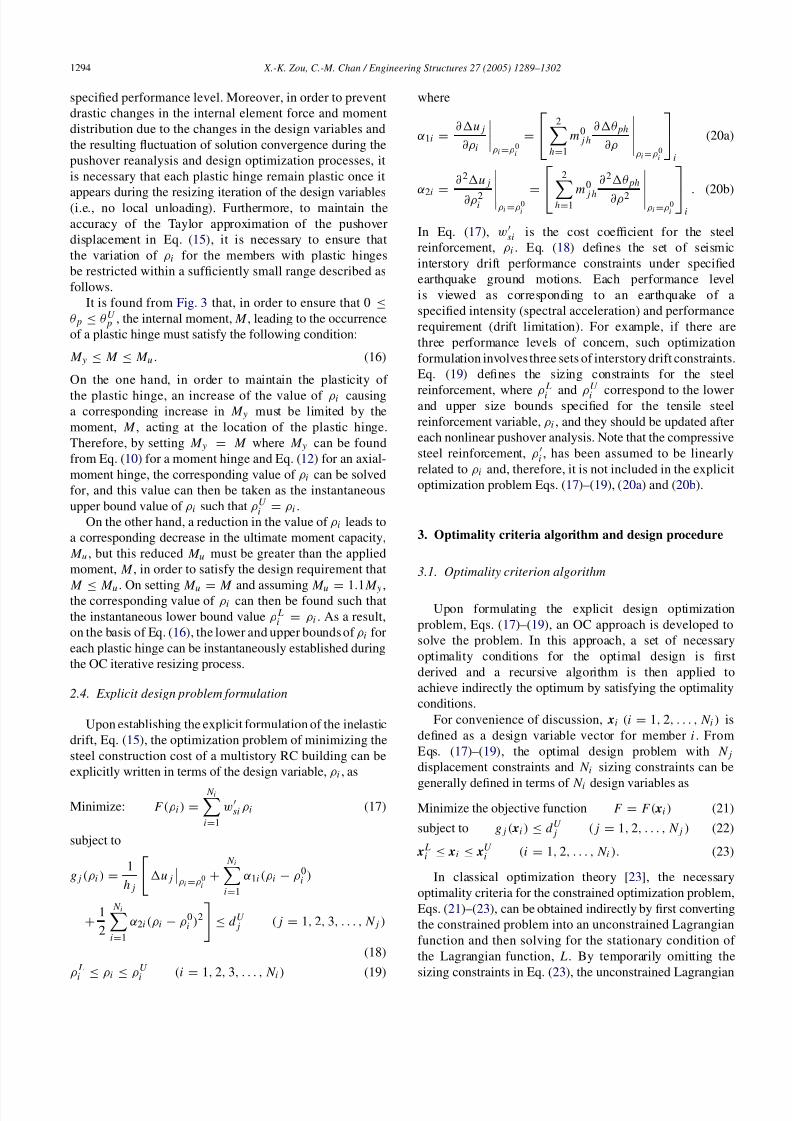
in the columns). By the force equilibrium shown in Fig. 4,where f c is the stress at the extreme compression concrete
fiber, f s is the stress in the compression steel, f y is the yield
strength of the tension steel, and d is the effective depth,
which is equal to the distance from the extreme compression
fiber to the centroid of the tension steel, M y for a moment
hinge (where there is no coexisting axial force) can be
expressed in terms of design variables, ρ and ρ, as
M y = 0.5 f c Bk d
kd
3− d
+ f y Bd (d − d )ρ (10)
where k is the neutral axis depth factor at the first yield and
it is given as
k =
(ρ + ρ)2n2
sc + 2
ρ + ρ
d
d
nsc − (ρ + ρ)nsc
(11)
in which nsc =E sE c
where E c and E s are the moduli of
elasticity of the concrete and the steel, respectively.
Similarly, M y for an axial-moment hinge (wherein there
is coexisting axial force) can be expressed in terms of design
variables, ρ and ρ, as
M y =f y Bd
2n
sc
· D
2
−kd
3 ·
k 2
1− k
Fig. 4. Doubly reinforced member section at first yield.
+f y Bd (d − d )2
2d ·
ρ
1 − k (12)
where k is given as
k = −
2ρ +
F X
f y Bd
nsc
+
2ρ +
F X
f y Bd
2
n2sc + 2nsc
ρ
D
d +
F X
f y Bd
. (13)
To take into account the change in θp due to a change
in ρ and ρ while maintaining an instantaneously fixed
value of M , a second-order Taylor series approximation for
evaluating the value of θp is given as
θp(ρ) = θp
ρ=ρ0 +
∂θp
∂ρ
ρ=ρ0
(ρ − ρ0)
+1
2
∂2θp
∂ρ2
ρ=ρ0
(ρ − ρ0)2 (14)
where the tension steel ratio, ρ, is considered as the major
design variable affecting θp; for simplicity, the compression
steel ratio, ρ, is assumed to be linearly related to ρ forbeams and to be the same as ρ for columns such that the two
steel ratios can be reduced to one design variable for each
member. Given the explicit expression of M y as a function of
ρ from Eqs. (10) and (12), the gradient,∂θ p
∂ρ, and the second-
order term,∂2θp
∂ρ2 , can be analytically calculated from Eq. (9).
By substituting the explicit plastic rotation, θp(ρ), given
in Eq. (14) into Eq. (7), the pushover displacement, u j , in
Eq. (5) can be explicitly expressed in terms of the design
variable, ρi , as
u j (ρi ) = u jρi =ρ0
i +
N ii=1
∂u j
∂ρi
ρi =ρ0
i
(ρi − ρ0i )
+1
2
N ii=1
∂2u j
∂ρ2i
ρi =ρ0
i
(ρi − ρ0i )
2. (15)
2.3. Plastic rotation constraint and sizing constraint
In this design optimization, when the plastic rotation,
θp , is to be modified with changes in the design variable,
ρi , it is necessary to make sure that θp does not exceed
the specified threshold of plastic rotation, θU p , for each
8/8/2019 Optimal Seism PBD of RC Blgs Using Pushover Anal -05
http://slidepdf.com/reader/full/optimal-seism-pbd-of-rc-blgs-using-pushover-anal-05 6/14
1294 X.-K. Zou, C.-M. Chan / Engineering Structures 27 (2005) 1289–1302
specified performance level. Moreover, in order to prevent
drastic changes in the internal element force and moment
distribution due to the changes in the design variables and
the resulting fluctuation of solution convergence during the
pushover reanalysis and design optimization processes, it
is necessary that each plastic hinge remain plastic once it
appears during the resizing iteration of the design variables(i.e., no local unloading). Furthermore, to maintain the
accuracy of the Taylor approximation of the pushover
displacement in Eq. (15), it is necessary to ensure that
the variation of ρi for the members with plastic hinges
be restricted within a sufficiently small range described as
follows.
It is found from Fig. 3 that, in order to ensure that 0 ≤
θp ≤ θU p , the internal moment, M , leading to the occurrence
of a plastic hinge must satisfy the following condition:
M y ≤ M ≤ M u . (16)
On the one hand, in order to maintain the plasticity of
the plastic hinge, an increase of the value of ρi causinga corresponding increase in M y must be limited by the
moment, M , acting at the location of the plastic hinge.
Therefore, by setting M y = M where M y can be found
from Eq. (10) for a moment hinge and Eq. (12) for an axial-
moment hinge, the corresponding value of ρi can be solved
for, and this value can then be taken as the instantaneous
upper bound value of ρi such that ρU i
= ρi .
On the other hand, a reduction in the value of ρi leads to
a corresponding decrease in the ultimate moment capacity,
M u , but this reduced M u must be greater than the applied
moment, M , in order to satisfy the design requirement that
M ≤ M u . On setting M u = M and assuming M u = 1.1M y ,the corresponding value of ρi can then be found such that
the instantaneous lower bound value ρLi = ρi . As a result,
on the basis of Eq. (16), the lower and upper bounds of ρi for
each plastic hinge can be instantaneously established during
the OC iterative resizing process.
2.4. Explicit design problem formulation
Upon establishing the explicit formulation of the inelastic
drift, Eq. (15), the optimization problem of minimizing the
steel construction cost of a multistory RC building can be
explicitly written in terms of the design variable, ρi , as
Minimize: F (ρi) =
N ii=1
wsi ρi (17)
subject to
g j (ρi ) =1
h j
u j
ρi =ρ0
i+
N ii=1
α1i(ρi − ρ0i )
+1
2
N ii=1
α2i(ρi − ρ0i )
2
≤ d U
j ( j = 1, 2, 3, . . . , N j )
(18)
ρLi ≤ ρi ≤ ρU
i (i = 1, 2, 3, . . . , N i ) (19)
where
α1i =∂u j
∂ρi
ρi =ρ0
i
=
2
h=1
m0j h
∂θph
∂ρ
ρi =ρ0
i
i
(20a)
α2i
=∂2u j
∂ρ2i
ρi =ρ0
i
= 2h=1
m0
j h
∂2θph
∂ρ2ρi =ρ0
i
i
. (20b)
In Eq. (17), w
si is the cost coefficient for the steel
reinforcement, ρi . Eq. (18) defines the set of seismic
interstory drift performance constraints under specified
earthquake ground motions. Each performance level
is viewed as corresponding to an earthquake of a
specified intensity (spectral acceleration) and performance
requirement (drift limitation). For example, if there are
three performance levels of concern, such optimization
formulation involves three sets of interstory drift constraints.
Eq. (19) defines the sizing constraints for the steel
reinforcement, where ρLi and ρ
U i correspond to the lower
and upper size bounds specified for the tensile steel
reinforcement variable, ρi , and they should be updated after
each nonlinear pushover analysis. Note that the compressive
steel reinforcement, ρ
i , has been assumed to be linearly
related to ρi and, therefore, it is not included in the explicit
optimization problem Eqs. (17)–(19), (20a) and (20b).
3. Optimality criteria algorithm and design procedure
3.1. Optimality criterion algorithm
Upon formulating the explicit design optimization
problem, Eqs. (17)–(19), an OC approach is developed to
solve the problem. In this approach, a set of necessary
optimality conditions for the optimal design is first
derived and a recursive algorithm is then applied to
achieve indirectly the optimum by satisfying the optimality
conditions.
For convenience of discussion, xi (i = 1, 2, . . . , N i ) is
defined as a design variable vector for member i . From
Eqs. (17)–(19), the optimal design problem with N jdisplacement constraints and N i sizing constraints can be
generally defined in terms of N i design variables as
Minimize the objective function F = F (xi ) (21)
subject to g j (xi ) ≤ d U j ( j = 1, 2, . . . , N j ) (22)
xLi ≤ xi ≤ x
U i (i = 1, 2, . . . , N i ). (23)
In classical optimization theory [23], the necessary
optimality criteria for the constrained optimization problem,
Eqs. (21)–(23), can be obtained indirectly by first converting
the constrained problem into an unconstrained Lagrangian
function and then solving for the stationary condition of
the Lagrangian function, L. By temporarily omitting the
sizing constraints in Eq. (23), the unconstrained Lagrangian
8/8/2019 Optimal Seism PBD of RC Blgs Using Pushover Anal -05
http://slidepdf.com/reader/full/optimal-seism-pbd-of-rc-blgs-using-pushover-anal-05 7/14
8/8/2019 Optimal Seism PBD of RC Blgs Using Pushover Anal -05
http://slidepdf.com/reader/full/optimal-seism-pbd-of-rc-blgs-using-pushover-anal-05 8/14
1296 X.-K. Zou, C.-M. Chan / Engineering Structures 27 (2005) 1289–1302
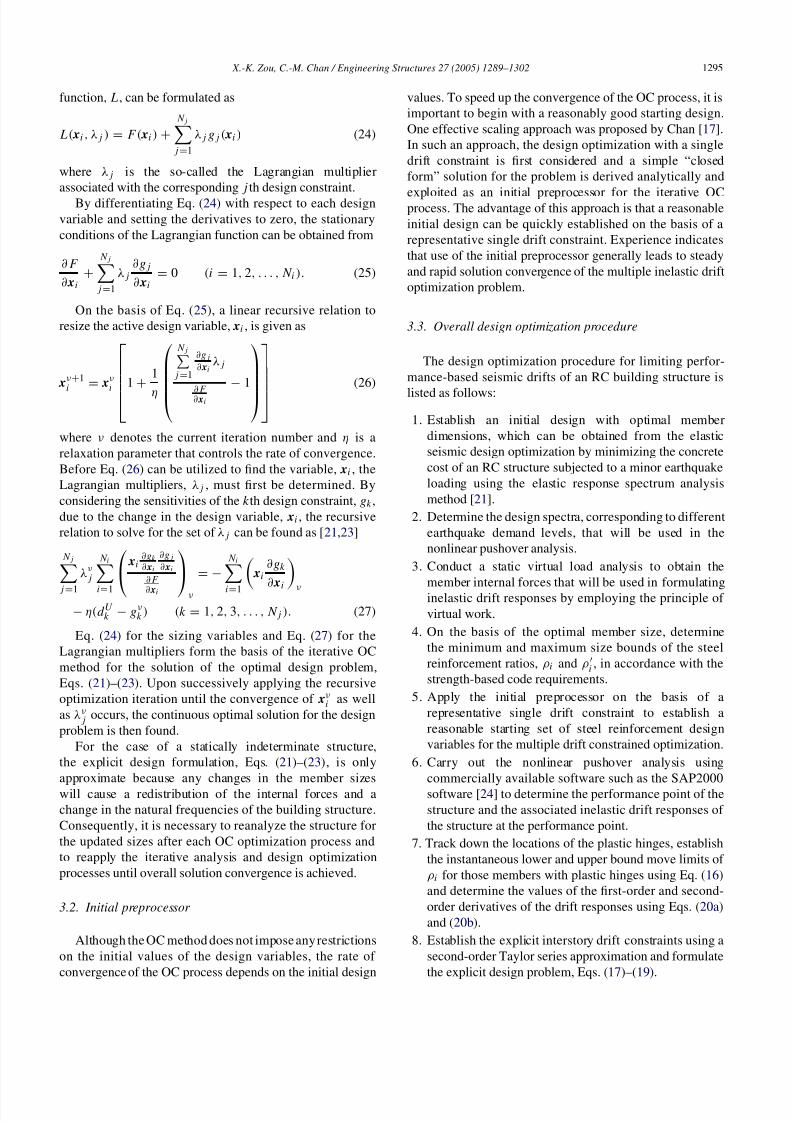
Fig. 5. E xample 1: One-story, one-bay frame.
9. Apply the recursive OC optimization algorithm using
Eqs. (26) and (27) to resize all steel reinforcement
design variables and to identify the active inelastic drift
constraints.
10. Check convergence of the steel cost and the inelastic
drift performance of the structure. Terminate with the
optimum design if the solution convergence is found;
otherwise, return to Step 6.
4. Illustrative examples
4.1. Example 1: A one-story, one-bay frame
A one-story, one-bay planar frame is used to verify the
pushover displacement formulation (Eqs. (5)–(7)), including
the element elastic strain energy generated by the membersand the plastic hinge strain energy generated by the plastic
hinges. The structural geometry of the frame is given in
Fig. 5. Concrete with the cylinder strength of 20 MPa and
steel reinforcement with the yield strength, f y , of 335 MPa
are used for all members. A uniform distributed gravity
load of 4 kN/m is applied to the beam. The lateral load
denoted as P is applied at the top of the structure as shown
in Fig. 5. Flexural moment hinges are assigned to the ends
of the beam, while the axial-moment hinges are assigned to
the ends of each column. The plastic rotation limit, θU p , is
assumed to be 0.02 rad for moment hinges and 0.015 rad
for axial-moment hinges [2,3]. The framework is analyzedusing the pushover method with member sizes of 300 mm ×
300 mm for the two columns and 200 mm × 450 mm for the
beam [25].
The pushover analysis of the structure is first carried out
by the SAP2000 software [24] and the top displacement
response of the structure caused by pushover loading is also
explicitly calculated by the virtual work method as stated
in Eqs. (5)–(7). Table 1 lists the step-by-step displacements
calculated by both the software and the virtual work
method and the percentage of difference between them. It
is found that the difference ranges between 0.0% and 0.5%,
indicating that the explicit displacement values calculated by
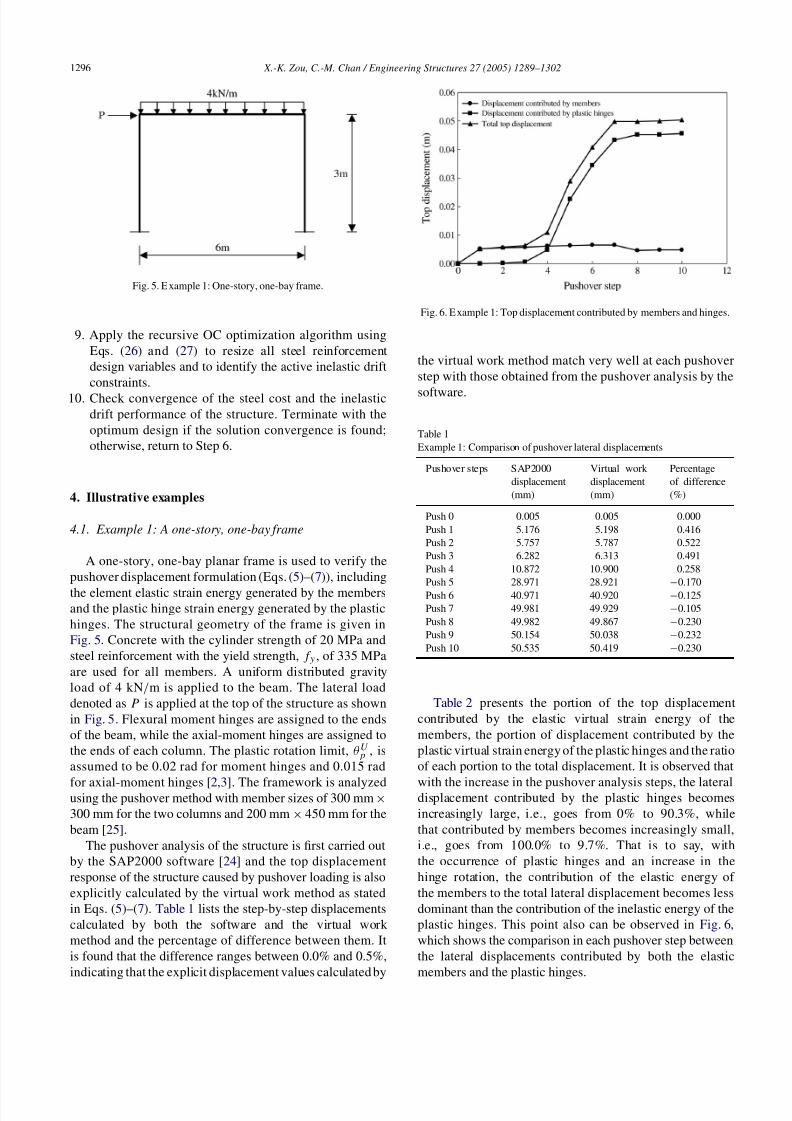
Fig. 6. E xample 1: Top displacement contributed by members and hinges.
the virtual work method match very well at each pushover
step with those obtained from the pushover analysis by the
software.
Table 1
Example 1: Comparison of pushover lateral displacements
Pushover steps SAP2000
displacement
(mm)
Virtual work
displacement
(mm)
Percentage
of difference
(%)
Push 0 0.005 0.005 0.000
Push 1 5.176 5.198 0.416
Push 2 5.757 5.787 0.522
Push 3 6.282 6.313 0.491
Push 4 10.872 10.900 0.258
Push 5 28.971 28.921 −0.170
Push 6 40.971 40.920 −0.125
Push 7 49.981 49.929 −0.105
Push 8 49.982 49.867 −0.230
Push 9 50.154 50.038 −0.232
Push 10 50.535 50.419 −0.230
Table 2 presents the portion of the top displacement
contributed by the elastic virtual strain energy of the
members, the portion of displacement contributed by the
plastic virtual strain energy of the plastic hinges and the ratio
of each portion to the total displacement. It is observed that
with the increase in the pushover analysis steps, the lateraldisplacement contributed by the plastic hinges becomes
increasingly large, i.e., goes from 0% to 90.3%, while
that contributed by members becomes increasingly small,
i.e., goes from 100.0% to 9.7%. That is to say, with
the occurrence of plastic hinges and an increase in the
hinge rotation, the contribution of the elastic energy of
the members to the total lateral displacement becomes less
dominant than the contribution of the inelastic energy of the
plastic hinges. This point also can be observed in Fig. 6,
which shows the comparison in each pushover step between
the lateral displacements contributed by both the elastic
members and the plastic hinges.
8/8/2019 Optimal Seism PBD of RC Blgs Using Pushover Anal -05
http://slidepdf.com/reader/full/optimal-seism-pbd-of-rc-blgs-using-pushover-anal-05 9/14
X.-K. Zou, C.-M. Chan / Engineering Structures 27 (2005) 1289–1302 1297
Table 2
Example 1: Contribution of members and plastic hinges to total pushover
displacement
Pushover steps Virtual work displacement Percentage distribution
Members Plastic hinges Members Plastic hinges
(mm) (mm) (%) (%)
Push 0 0.005 0.000 100.000 0.000Push 1 5.198 0.000 100.000 0.000
Push 2 5.565 0.222 96.171 3.829
Push 3 5.699 0.613 90.287 9.713
Push 4 6.183 4.716 56.729 43.271
Push 5 6.387 22.534 22.085 77.915
Push 6 6.504 34.416 15.893 84.107
Push 7 6.591 43.338 13.201 86.799
Push 8 4.673 45.194 9.371 90.629
Push 9 4.775 45.263 9.543 90.457
Push 10 4.870 45.549 9.659 90.341
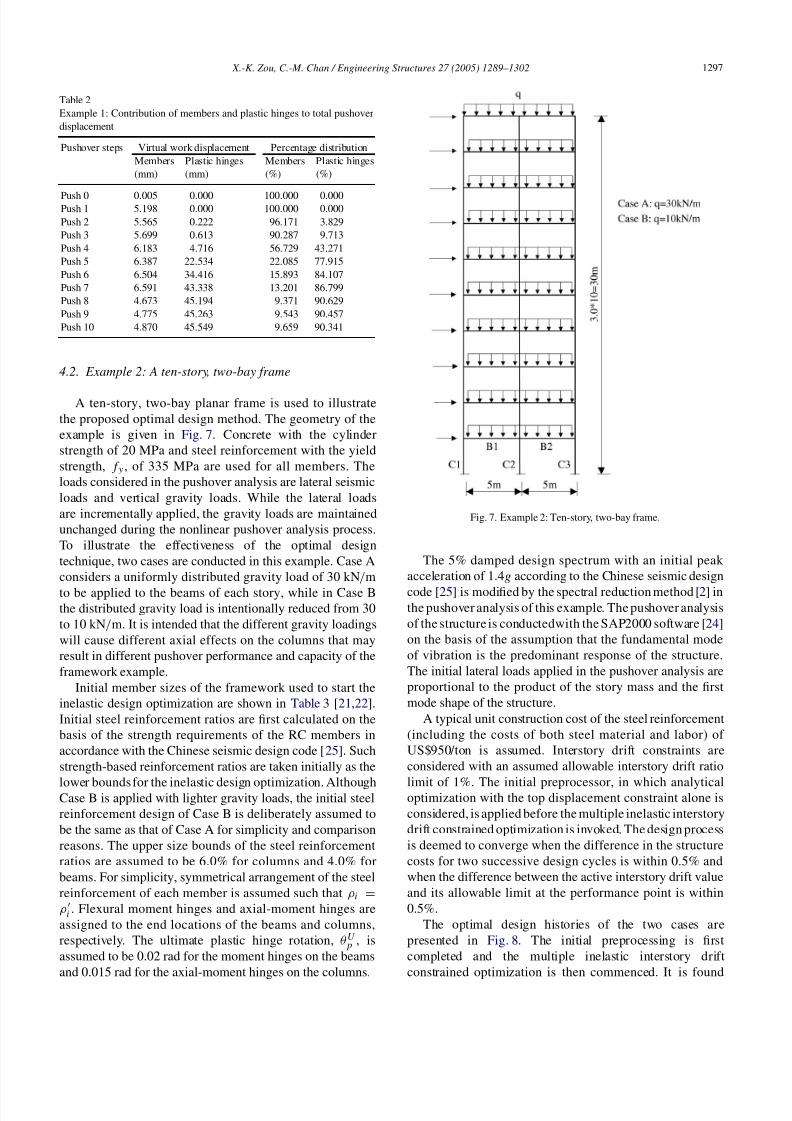
4.2. Example 2: A ten-story, two-bay frame
A ten-story, two-bay planar frame is used to illustrate
the proposed optimal design method. The geometry of the
example is given in Fig. 7. Concrete with the cylinder
strength of 20 MPa and steel reinforcement with the yield
strength, f y , of 335 MPa are used for all members. The
loads considered in the pushover analysis are lateral seismic
loads and vertical gravity loads. While the lateral loads
are incrementally applied, the gravity loads are maintained
unchanged during the nonlinear pushover analysis process.
To illustrate the effectiveness of the optimal design
technique, two cases are conducted in this example. Case A
considers a uniformly distributed gravity load of 30 kN/m
to be applied to the beams of each story, while in Case Bthe distributed gravity load is intentionally reduced from 30
to 10 kN/m. It is intended that the different gravity loadings
will cause different axial effects on the columns that may
result in different pushover performance and capacity of the
framework example.
Initial member sizes of the framework used to start the
inelastic design optimization are shown in Table 3 [21,22].
Initial steel reinforcement ratios are first calculated on the
basis of the strength requirements of the RC members in
accordance with the Chinese seismic design code [25]. Such
strength-based reinforcement ratios are taken initially as the
lower bounds for the inelastic design optimization. AlthoughCase B is applied with lighter gravity loads, the initial steel
reinforcement design of Case B is deliberately assumed to
be the same as that of Case A for simplicity and comparison
reasons. The upper size bounds of the steel reinforcement
ratios are assumed to be 6.0% for columns and 4.0% for
beams. For simplicity, symmetrical arrangement of the steel
reinforcement of each member is assumed such that ρi =
ρi . Flexural moment hinges and axial-moment hinges are
assigned to the end locations of the beams and columns,
respectively. The ultimate plastic hinge rotation, θU p , is
assumed to be 0.02 rad for the moment hinges on the beams
and 0.015 rad for the axial-moment hinges on the columns.
Fig. 7. Example 2: Ten-story, two-bay frame.
The 5% damped design spectrum with an initial peak
acceleration of 1.4g according to the Chinese seismic design
code [25] is modified by the spectral reduction method [2] inthe pushover analysis of this example. The pushover analysis
of the structure is conductedwith the SAP2000 software [24]
on the basis of the assumption that the fundamental mode
of vibration is the predominant response of the structure.
The initial lateral loads applied in the pushover analysis are
proportional to the product of the story mass and the first
mode shape of the structure.
A typical unit construction cost of the steel reinforcement
(including the costs of both steel material and labor) of
US$950/ton is assumed. Interstory drift constraints are
considered with an assumed allowable interstory drift ratio
limit of 1%. The initial preprocessor, in which analyticaloptimization with the top displacement constraint alone is
considered, is applied before the multiple inelastic interstory
drift constrained optimization is invoked. The design process
is deemed to converge when the difference in the structure
costs for two successive design cycles is within 0.5% and
when the difference between the active interstory drift value
and its allowable limit at the performance point is within
0.5%.
The optimal design histories of the two cases are
presented in Fig. 8. The initial preprocessing is first
completed and the multiple inelastic interstory drift
constrained optimization is then commenced. It is found
8/8/2019 Optimal Seism PBD of RC Blgs Using Pushover Anal -05
http://slidepdf.com/reader/full/optimal-seism-pbd-of-rc-blgs-using-pushover-anal-05 10/14
1298 X.-K. Zou, C.-M. Chan / Engineering Structures 27 (2005) 1289–1302
Table 3
Example 2: Initial and final steel reinforcement ratios
Element type Story level Member group Initial member sizes Case A Case B
Steel ratios Steel ratios
Width (mm) Depth (mm) Initial (%) Optimal (%) Initial (%) Optimal (%)
9th–10th C1, C3 350 350 0.990 1.096 0.990 1.506
C2 350 350 1.386 1.386 1.386 1.5788th C1, C3 350 350 0.849 0.860 0.849 1.524
C2 350 475 0.958 0.958 0.958 0.958
Column 7th C1, C3 350 350 1.163 1.163 1.163 1.922
C2 350 475 1.092 1.092 1.092 1.092
6th C1, C3 350 400 0.854 0.864 0.854 1.200
C2 350 575 0.831 0.831 0.831 0.874
5th C1, C3 350 400 0.969 1.004 0.969 1.428
C2 350 575 1.002 1.002 1.002 1.002
4th C1, C3 350 450 0.833 0.873 0.833 1.356
C2 350 600 0.739 0.739 0.739 0.739
3rd C1, C3 350 450 0.825 0.876 0.825 1.536
C2 350 600 0.857 0.857 0.857 0.857
2nd C1, C3 350 450 1.044 1.124 1.044 1.644
C2 350 650 1.225 1.225 1.225 1.225
1st C1, C3 350 450 1.514 1.514 1.514 1.514C2 350 650 1.844 1.844 1.844 1.844
9th–10th B1, B2 200 400 0.800 0.800 0.800 0.800
8th B1, B2 200 450 0.838 0.941 0.838 0.838
Beam 7th B1, B2 200 450 0.915 1.320 0.915 1.053
6th B1, B2 250 450 0.897 1.310 0.897 1.355
5th B1, B2 250 450 0.958 1.493 0.958 1.383
4th B1, B2 300 450 0.915 1.457 0.915 1.430
3rd B1, B2 300 450 0.958 1.484 0.958 1.440
2nd B1, B2 300 450 0.982 1.512 0.982 1.404
1st B1, B2 300 450 0.843 1.006 0.843 1.119
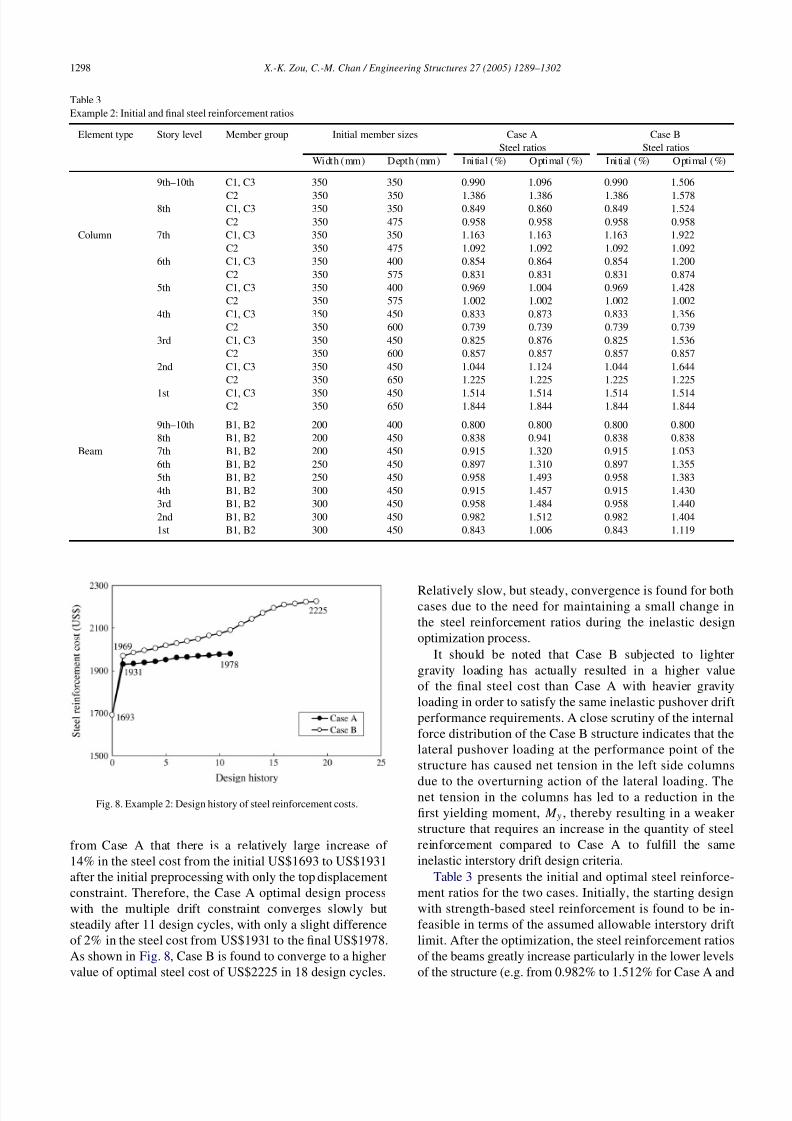
Fig. 8. Example 2: Design history of steel reinforcement costs.
from Case A that there is a relatively large increase of
14% in the steel cost from the initial US$1693 to US$1931
after the initial preprocessing with only the top displacement
constraint. Therefore, the Case A optimal design process
with the multiple drift constraint converges slowly but
steadily after 11 design cycles, with only a slight difference
of 2% in the steel cost from US$1931 to the final US$1978.
As shown in Fig. 8, Case B is found to converge to a higher
value of optimal steel cost of US$2225 in 18 design cycles.
Relatively slow, but steady, convergence is found for bothcases due to the need for maintaining a small change in
the steel reinforcement ratios during the inelastic design
optimization process.
It should be noted that Case B subjected to lighter
gravity loading has actually resulted in a higher value
of the final steel cost than Case A with heavier gravity
loading in order to satisfy the same inelastic pushover drift
performance requirements. A close scrutiny of the internal
force distribution of the Case B structure indicates that the
lateral pushover loading at the performance point of the
structure has caused net tension in the left side columns
due to the overturning action of the lateral loading. Thenet tension in the columns has led to a reduction in the
first yielding moment, M y , thereby resulting in a weaker
structure that requires an increase in the quantity of steel
reinforcement compared to Case A to fulfill the same
inelastic interstory drift design criteria.
Table 3 presents the initial and optimal steel reinforce-
ment ratios for the two cases. Initially, the starting design
with strength-based steel reinforcement is found to be in-
feasible in terms of the assumed allowable interstory drift
limit. After the optimization, the steel reinforcement ratios
of the beams greatly increase particularly in the lower levels
of the structure (e.g. from 0.982% to 1.512% for Case A and
8/8/2019 Optimal Seism PBD of RC Blgs Using Pushover Anal -05
http://slidepdf.com/reader/full/optimal-seism-pbd-of-rc-blgs-using-pushover-anal-05 11/14
X.-K. Zou, C.-M. Chan / Engineering Structures 27 (2005) 1289–1302 1299
(a) Case A.
(b) Case B.
Fig. 9. Example 2: Comparison of performance points.
from 0.982% to 1.404% for Case B at story level 2), while
those of the side columns are found with little changes for
Case A (e.g. from 1.044% to 1.124% for columns C1 and
C2 at story level 2), but with a rather significant increasefor Case B (e.g. from 1.044% to 1.644% for columns C1
and C2 at story level 2). Although the overturning action of
the lateral loading has caused an uplifting tension on the left
side columns (with negative weakening effect on moment
resistance) and down-pressing compression on the right side
columns (with positive stiffening effect on moment resis-
tance), the steel reinforcement of these side columns must
be sized the same to take into account the reversal seismic
loading effects. When comparing the results of the steel re-
inforcement of the columns for the two cases, the columns
of Case A are found to be mainly controlled by the minimum
strength requirements with the final steel ratios being set to
(a) Case A.
(b) Case B.
Fig. 10. Example 2: Initial and final interstory drift ratios.
the initial strength-based limits, whilst the columns of Case
B are governed by the inelastic interstory drift performance
requirements with the final steel ratios being larger than the
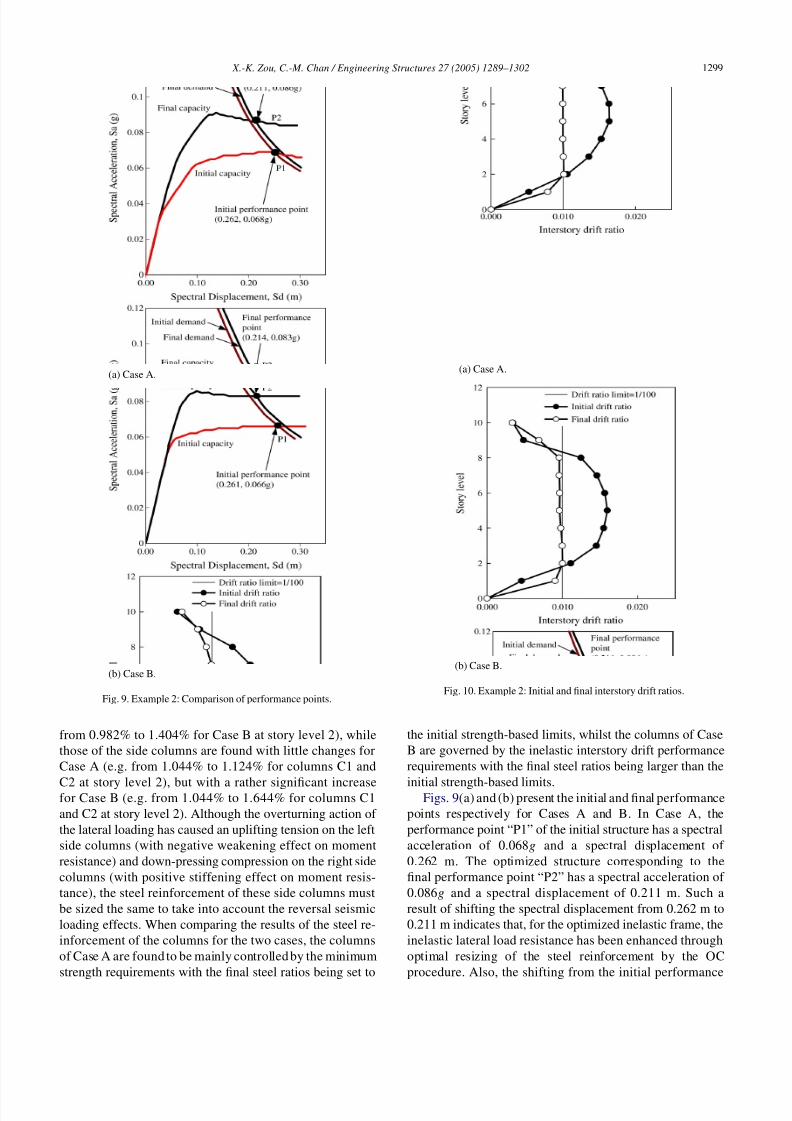
initial strength-based limits.Figs. 9(a) and (b) present the initial and final performance
points respectively for Cases A and B. In Case A, the
performance point “P1” of the initial structure has a spectral
acceleration of 0.068g and a spectral displacement of
0.262 m. The optimized structure corresponding to the
final performance point “P2” has a spectral acceleration of
0.086g and a spectral displacement of 0.211 m. Such a
result of shifting the spectral displacement from 0.262 m to
0.211 m indicates that, for the optimized inelastic frame, the
inelastic lateral load resistance has been enhanced through
optimal resizing of the steel reinforcement by the OC
procedure. Also, the shifting from the initial performance
8/8/2019 Optimal Seism PBD of RC Blgs Using Pushover Anal -05
http://slidepdf.com/reader/full/optimal-seism-pbd-of-rc-blgs-using-pushover-anal-05 12/14
1300 X.-K. Zou, C.-M. Chan / Engineering Structures 27 (2005) 1289–1302
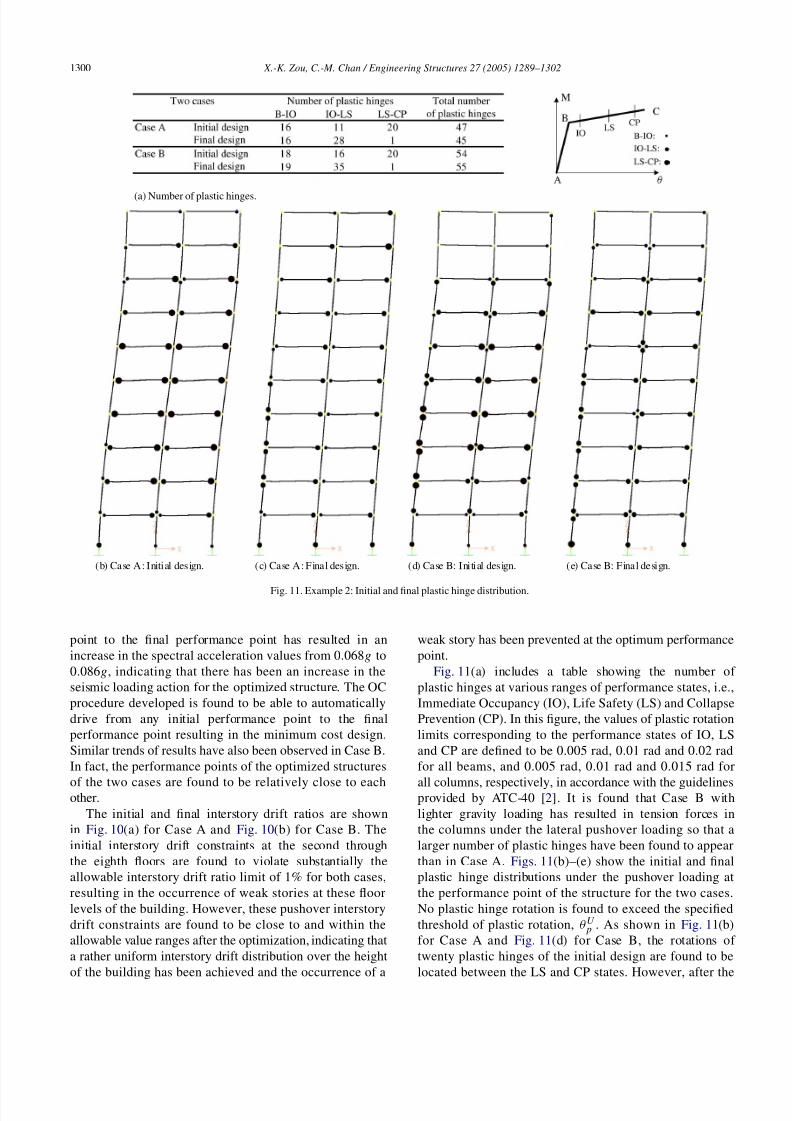
(a) Number of plastic hinges.
(b) Case A: Initial design. (c) Case A: Final design. (d) Case B: Initial design. (e) Case B: Final design.
Fig. 11. Example 2: Initial and final plastic hinge distribution.
point to the final performance point has resulted in an
increase in the spectral acceleration values from 0.068g to
0.086g, indicating that there has been an increase in the
seismic loading action for the optimized structure. The OC
procedure developed is found to be able to automatically
drive from any initial performance point to the final
performance point resulting in the minimum cost design.
Similar trends of results have also been observed in Case B.
In fact, the performance points of the optimized structures
of the two cases are found to be relatively close to eachother.
The initial and final interstory drift ratios are shown
in Fig. 10(a) for Case A and Fig. 10(b) for Case B. The
initial interstory drift constraints at the second through
the eighth floors are found to violate substantially the
allowable interstory drift ratio limit of 1% for both cases,
resulting in the occurrence of weak stories at these floor
levels of the building. However, these pushover interstory
drift constraints are found to be close to and within the
allowable value ranges after the optimization, indicating that
a rather uniform interstory drift distribution over the height
of the building has been achieved and the occurrence of a
weak story has been prevented at the optimum performance
point.
Fig. 11(a) includes a table showing the number of
plastic hinges at various ranges of performance states, i.e.,
Immediate Occupancy (IO), Life Safety (LS) and Collapse
Prevention (CP). In this figure, the values of plastic rotation
limits corresponding to the performance states of IO, LS
and CP are defined to be 0.005 rad, 0.01 rad and 0.02 rad
for all beams, and 0.005 rad, 0.01 rad and 0.015 rad for
all columns, respectively, in accordance with the guidelinesprovided by ATC-40 [2]. It is found that Case B with
lighter gravity loading has resulted in tension forces in
the columns under the lateral pushover loading so that a
larger number of plastic hinges have been found to appear
than in Case A. Figs. 11(b)–(e) show the initial and final
plastic hinge distributions under the pushover loading at
the performance point of the structure for the two cases.
No plastic hinge rotation is found to exceed the specified
threshold of plastic rotation, θU p . As shown in Fig. 11(b)
for Case A and Fig. 11(d) for Case B, the rotations of
twenty plastic hinges of the initial design are found to be
located between the LS and CP states. However, after the
8/8/2019 Optimal Seism PBD of RC Blgs Using Pushover Anal -05
http://slidepdf.com/reader/full/optimal-seism-pbd-of-rc-blgs-using-pushover-anal-05 13/14
X.-K. Zou, C.-M. Chan / Engineering Structures 27 (2005) 1289–1302 1301
optimization, most of the plastic hinges are found to have
smaller values of plastic rotations within the ranges of the
B–IO and IO–LS states and only one hinge is found to be in
the more critical range between the LS and CP states, as can
be observed from the optimized framework in Figs. 11(c)
and (e). Furthermore, the interstory drifts along the height of
the building are also found to be almost all fully constrainedat the optimum, resulting in a rather linear deflected profile
of the inelastic design. Such a result further indicates
that the optimization method developed can automatically
resize the steel reinforcements of all members to attain a
uniform ductility demand over the height of the multistory
building.
5. Conclusions
It has been demonstrated that steel reinforcement plays
a significant role in controlling the lateral drift beyond
first yielding and in providing ductility to an RC building
framework. Using the principle of virtual work and the
Taylor series approximation, the inelastic performance-
based seismic design problem has been explicitly expressed
in terms of the steel reinforcement design variables. Axial-
moment hinges and moment hinges should be considered
in the nonlinear pushover analysis of a frame structure so
that the behavior of columns and beams can be effectively
modelled. It is important that uplifting tension induced by
seismic loading should be prevented in an RC building as the
net tension in columns tends to weaken the lateral resistance
of such a structure and to result in a less economical design.
It is demonstrated that the OC design method is able to
improve automatically and gradually a performance-basedinterstory drift design to attain optimal performance. Also,
this OC design method developed is able to automatically
shift any initial performance point to achieve the final
optimal performance point. However, a restrictive move
limit imposed on the steel reinforcement design variables
is necessary to ensure a smooth and steady convergence
of the inelastic drift design process. At optimum, a
uniform lateral drift or ductility demand over all stories
of the building with the minimum cost is achieved. It is
also believed that this optimization methodology provides
a powerful computer-based technique for performance-
based design of multistory RC building structures. Theproposed optimization methodology provides a good basis
for more comprehensive performance-based optimization of
structures as more accurate nonlinear pushover procedures
taking into account the higher mode effects are developed
and multiple levels of performance criteria and design
objectives are to be simultaneously considered.
Acknowledgment
The authors are grateful for the financial support provided
by the Research Grants Council of Hong Kong under Project
No. HKUST6249/00E.
References
[1] SEAOC. Vision 2000, Performance based seismic engineering of
buildings, part 2: Conceptual framework. Sacremento (CA): Structural
Engineers Association of California; 1995.
[2] ATC. Seismic evaluation and retrofit of concrete buildings—volume
1 (ATC-40). Report No. SSC 96-01. Redwood City (CA): Applied
Technology Council; 1996.[3] FEMA. NEHRP guidelines for the seismic rehabilitation of buildings
(FEMA 273). Washington (DC): Building Seismic Safety Council;
1997.
[4] Moehle JP, Mahin SA. Observations on the behavior of reinforced
concrete buildings during earthquakes. In: Ghosh SK, editor.
Earthquake-resistant concrete structures—inelastic response and
design. American Concrete Institute SP-127; 1991.
[5] Ghobarah A, Aly NM, El-Attar M. Performance level criteria and
evaluation. In: Fajfar P, Krawinkler H, editors. Proceedings of the
international workshop on seismic design methodologies for the next
generation of codes. 1997.
[6] Chopra AK. Dynamics of structures: theory and applications to
earthquake engineering. Englewood Cliffs, NJ; 1995.
[7] Cheng FY, Botkin ME. Nonlinear optimum design of dynamicdamped frames. Journal of Structural Division, ASCE 1976;102(ST3):
609–28.
[8] Feng TT, Arora JS, Huang EJ. Optimal structural design under
dynamic loads. International Journal for Numerical Methods in
Engineering 1977;11(1):39–52.
[9] Bhatti MA, Pister KS. A dual criteria approach for optimal design of
earthquake-resistant structural systems. Earthquake Engineering and
Structural Dynamics 1981;9:557–72.
[10] Balling RJ, Pister KS, Ciampi V. Optimal seismic-resistant design of a
planar steel frame. Earthquake Engineering and Structural Dynamics
1983;11:541–56.
[11] Cheng FY, Truman KZ. Optimization algorithm of 3-D building
systems for static and seismic loading. In: Ames WF, editor.
Modeling and simulation in engineering. North-Holland Pub. Co.;
1983. p. 315–26.
[12] Arora JS. Optimization of structures subjected to dynamic loads.
In: Leondes CT, editor. Structural dynamic systems computational
techniques and optimization. Gordon and Breach Science Publishers;
1999. p. 1–73.
[13] Beck JL, Papadimitriou C, Chan E, Irfanoglu A. A performance-based
optimal structural design methodology. Report No. EERL 97-03. CA,
USA; 1998.
[14] Ganzerli S, Pantelides CP, Reaveley LD. Performance-based design
using structural optimization. Earthquake Engineering and Structural
Dynamics 2000;29:677–1690.
[15] Foley CM. Optimized performance-based design for buildings.
In: Burns SA, editor. Recent advances in optimal structural design.
American Society of Civil Engineers; 2002. p. 169–240.
[16] Charney FA. Needs in the development of a comprehensiveperformance based design optimization process. In: Elgaaly M, editor.
Advanced technology in structural engineering—structural congress
2000, ASCE; 2000 (CD-ROM).
[17] Chan CM. How to optimize tall steel building frameworks. In: Guide
to structural optimization, ASCE manuals and reports on engineering
practice No. 90. American Society of Civil Engineers; 1997.
p. 165–95.
[18] Chan CM. Optimal lateral stiffness design of tall buildings of mixed
steel and concrete construction. Journal of Structural Design of Tall
Buildings 2001;10:155–77.
[19] Zou XK, Chan CM. Optimal drift performance design for nonlinear
pushover response of concrete structures. In: WCSMO-4: Proceedings
of the fourth world congress of structural and multidisciplinary
optimization. 2001.

8/8/2019 Optimal Seism PBD of RC Blgs Using Pushover Anal -05
http://slidepdf.com/reader/full/optimal-seism-pbd-of-rc-blgs-using-pushover-anal-05 14/14
1302 X.-K. Zou, C.-M. Chan / Engineering Structures 27 (2005) 1289–1302
[20] Chan CM, Zou XK. Optimal inelastic drift design of reinforced
concrete structures under pushover loading. In: The second
China–Japan–Korea joint symposium on optimization of structural
and mechanical systems. 2002.
[21] Zou XK. Optimal seismic performance-based design of reinforced
concrete buildings. Ph.D. dissertation. Hong Kong (PR China): Hong
Kong University of Science and Technology; 2002.
[22] Zou XK, Chan CM. An optimal resizing technique for seismic drift
design of concrete buildings subjected to response spectrum and time
history loadings. Computers & Structures [in press].
[23] Grierson DE. Optimality criterion method for structural optimization.
In: Guide to structural optimization, ASCE Manuals and Reports on
Engineering Practice No. 90. American Society of Civil Engineers;
1997. p. 303–14.
[24] Computer and Structures, Inc. (CSI). SAP2000/NL-PUSH software,
version 7.40. Berkeley (CA, USA): Computer and Structures, Inc.,
2000.
[25] National Standard of the People’s Republic of China. Chinese code for
seismic design buildings (GBJ11-89). Beijing (PR China): New World
Press; 1994.