optimally capturing latency dynamics in models of
TRANSCRIPT

Ot
RJa
b
c
d
e
f
a
ARRAA
KTMRP
1
a2irueDhie
3
h10
Epidemics 21 (2017) 39–47
Contents lists available at ScienceDirect
Epidemics
j ourna l ho me pa ge: www.elsev ier .com/ locate /ep idemics
ptimally capturing latency dynamics in models of tuberculosisransmission
omain Ragonneta,b,∗, James M. Trauera,c,d, Nick Scottb,c, Michael T. Meehane,ustin T. Denholma,d,f, Emma S. McBrydea,e
Faculty of Medicine, Dentistry and Health Sciences, University of Melbourne, AustraliaBurnet Institute, AustraliaSchool of Population Health and Preventive Medicine, Monash University, AustraliaVictorian Tuberculosis Program, Melbourne, AustraliaAustralian Institute of Tropical Health and Medicine, James Cook University, AustraliaRoyal Melbourne Hospital, Melbourne, Australia
r t i c l e i n f o
rticle history:eceived 13 February 2017eceived in revised form 30 May 2017ccepted 14 June 2017vailable online 16 June 2017
eywords:uberculosis latencyathematical modelling
isk of disease activationarameter estimation
a b s t r a c t
Although different structures are used in modern tuberculosis (TB) models to simulate TB latency, itremains unclear whether they are all capable of reproducing the particular activation dynamics empiri-cally observed. We aimed to determine which of these structures replicate the dynamics of progressionaccurately. We reviewed 88 TB-modelling articles and classified them according to the latency struc-ture employed. We then fitted these different models to the activation dynamics observed from 1352infected contacts diagnosed in Victoria (Australia) and Amsterdam (Netherlands) to obtain parameterestimates. Six different model structures were identified, of which only those incorporating two latencycompartments were capable of reproducing the activation dynamics empirically observed. We foundimportant differences in parameter estimates by age. We also observed marked differences betweenour estimates and the parameter values used in many previous models. In particular, when two suc-
cessive latency phases are considered, the first period should have a duration that is much shorter thanthat used in previous studies. In conclusion, structures incorporating two latency compartments andage-stratification should be employed to accurately replicate the dynamics of TB latency. We provide acatalogue of parameter values and an approach to parameter estimation from empiric data for calibrationof future TB-models.© 2017 The Authors. Published by Elsevier B.V. This is an open access article under the CC BY-NC-ND
. Introduction
Tuberculosis (TB) is a major health issue with 10.4 millionctive cases and 1.8 million deaths worldwide in 2015 (WHO,016). Furthermore, around one quarter of the world’s population
s estimated to be infected with TB (Houben and Dodd, 2016), rep-esenting a huge reservoir of potential disease. Accordingly, fullynderstanding latent TB infection is crucial for assessing the futurepidemic trajectory and designing effective TB control policies.espite this, much reinfection occurs in high incidence cohorts,
ampering accurate estimation of latency dynamics. Thereforensights into the activation dynamics following a single infectionpisode of Mycobacterium tuberculosis provided by recent studies
∗ Corresponding author at: 85 Commercial Road, Burnet Institute, Melbourne, VIC003, Australia.
E-mail address: [email protected] (R. Ragonnet).
ttp://dx.doi.org/10.1016/j.epidem.2017.06.002755-4365/© 2017 The Authors. Published by Elsevier B.V. This is an open access article
/).
license (http://creativecommons.org/licenses/by-nc-nd/4.0/).
in very low transmission settings are particularly valuable (Traueret al., 2016a; Sloot et al., 2014). These works provide detailed infor-mation on patterns of activation, highlighting that most active casesoccur within the first few months of infection.
Mathematical modelling has informed TB control programs bysimulating interventions, or by explaining the mechanisms under-lying observed epidemiological trends (Vynnycky and Fine, 1997;Gomes et al., 2004; Castillo-Chavez and Feng, 1997; Abu-Raddadet al., 2009; Cohen et al., 2008; Dye, 2012; Menzies et al., 2012;Trauer et al., 2016b), yet little is known about whether such mod-elling has been able to capture latency dynamics accurately. Inthe past, TB models have been constructed to capture the life-long probability of disease and, although some models allowedfor marked differences between the early and late dynamics of
infection (Dowdy et al., 2013; Lin et al., 2011; Aparicio and Castillo-Chavez, 2009), estimates for the associated parameters have notbeen fit closely to longitudinal data. Despite this, it has been shownunder the CC BY-NC-ND license (http://creativecommons.org/licenses/by-nc-nd/4.

4 pidem
taFfttaAeeoocos
mvspidetpaFripcaadyt
spciwdc
2
2
aeomrdbtit
2
a
0 R. Ragonnet et al. / E
hat when modelling infectious diseases, it is critical to employppropriate distributions of latent periods (Wearing et al., 2005).ocusing on emerging infectious diseases, Wallinga and Lipsitchurther demonstrated that capturing the mean of the generationimes is not sufficient to characterise transmission accurately, ashe shape of the distribution of the generation intervals also plays
critical role in infection dynamics (Wallinga and Lipsitch, 2007).lthough TB is an ancient disease, its epidemiology is continuouslyvolving. In particular, changes in TB epidemiology in response tomerging phenomena, such as introduction of drug-resistant formsf TB or stronger control programs, are likely to affect the shapef the generation time distribution. Therefore, the recent detailedharacterisation of TB activation dynamics represent a valuablepportunity to review and improve modelling practices for theimulation of TB latency.
Compartmental dynamic transmission models − the most com-on type of TB mathematical model − simulate TB latency with
arious levels of complexity. While some modellers employ aingle latency compartment that precedes the active disease com-artment (Colijn et al., 2008; Blower and Chou, 2004), others
ncorporate a second latency compartment in order to capture twoifferent rates of progression from latent infection to active dis-ase (Hill et al., 2012; Cohen et al., 2006; Trauer et al., 2014). Whenwo latency compartments are incorporated, they can either beositioned in series or in parallel, involving different underlyingssumptions regarding the progression pathways to active disease.irst, the serial structure implies that newly infected individualsemain at high risk of disease during the initial phase and then,f TB activation has not occurred, they transition to another com-artment where their risk of developing active TB is reduced. Byontrast, with a parallel compartmental structure, the underlyingssumption is that a proportion of infected individuals belong to
high risk category, while the remainder are at lower risk of TBisease. While TB modelling has been used extensively for over 40ears, it remains unclear which of these structures are best adaptedo the natural history of TB.
In this study, we aim to determine the most appropriate modeltructures to simulate TB latency and provide estimates for thearameters associated with these structures across different ageategories. We use the distribution of the estimated times fromnfection to TB activation in 1352 infected contacts of individuals
ith active pulmonary TB from Victoria (Australia) and Amster-am (Netherlands) to calibrate the latency structures of differentandidate models to the dynamics observed in the data.
. Methods
.1. Literature review
Our search was based on the literature review of mathematicalnd economic TB modelling articles provided by the TB Mod-lling and Analysis Consortium, available online at http://tb-mac.rg/Resources/Resource/4 (see Appendix in Supplementary file forore details). From this database we identified all 88 publications
eporting the use of a deterministic compartmental transmissionynamic model. All selected papers were reviewed independentlyy two authors (RR, JMT) who classified the manuscripts accordingo the structure used to model TB latency. These two independentnvestigations led to the same classification which is presented inhe Appendix in Supplementary file (Table S1).
.2. Analytical solution
For each latency structure found in the literature, we associ-ted a basic dynamic model comprised of the latency structure in
ics 21 (2017) 39–47
combination with compartments representing susceptibility toinfection and active disease. We then found analytical solutionsfor the TB activation dynamics corresponding to each model.Namely, considering that individuals were infected at time t = 0,we determined the proportion I (t) of infected individuals that haddeveloped active TB after each time t (t ≥ 0). Analytical expressionsare also presented for the total proportion of infected individu-als progressing to active disease, obtained by calculating the limitof I (t) as t approaches plus infinity. The detailed method used toobtain the analytic solutions is described in the Appendix in Sup-plementary file.
2.3. Data used to calibrate the models
The models described above were calibrated to individual dataon close contacts of individuals with active pulmonary TB notifiedin the Australian state of Victoria from January 2005 to December2013. These data are derived from a very low endemic setting andwere described in detail by Trauer et al. They consist of 613 infectedcontacts of whom 67 (10.9%) developed active TB during the studyperiod (Trauer et al., 2016a). To enhance our dataset, we also usedthe published data on close contacts of pulmonary TB patientsfrom Amsterdam (Netherlands) notified between 2002 and 2011,as reported by Sloot et al. (Sloot et al., 2014). These data include739 infected individuals, of whom 71 (9.6%) developed active TB.The detailed approaches used to determine both dates of infectionand activation in individuals in the two studies are presented inthe respective manuscripts. The activation times measured in thesedata were used to calibrate the different models. In order to vali-date our approach involving merging of two datasets, we presenta comparison of the estimates obtained from the separate fittingsto the two datasets (Appendix in Supplementary file Section 8.2).The approach used to extract data from Sloot and colleagues’ arti-cle is described in detail in the Appendix in Supplementary file,along with a validation analysis of the extraction method whilethe distribution of the times to activation measured in the twodatasets (Victoria and Amsterdam) is presented in Fig. S7 (Appendixin Supplementary file).
Trauer et al. also proposed an imputation method which takesinto account the censorship for migration, death, and preventivetreatment (Trauer et al., 2016a). We used this approach, which isassociated with higher estimates concerning the risk of TB activa-tion, in a supplementary analysis.
2.4. Model fitting
Model fitting to data was made by building the survival like-lihood defined as follows. For a given model associated with agiven set of parameters, �, we obtain an analytical survival func-tion S� (t) which represents the probability that activation has notoccurred yet at time t given that infection occurred at t = 0. Thisfunction is associated with a hazard function �� (t) defined by�� (t) = −S′
� (t) /S� (t), characterising the chance that progressionto active TB occurs at precisely time t, given survival up to thattime. Then, for each infected case i of our dataset, for whom ti desig-nates the time of either TB activation or end of follow-up, we definean individual likelihood component by if the case wasnot known to develop active TB; and if the caseeffectively activated TB at time ti. Finally, we aim to maximise themulti-dimensional likelihood obtained by multiplying all the indi-vidual likelihood components together: . This problemis equivalent to maximising the following log-likelihood that we
define as the fitting score: .Another fitting method was used for validation and when thedata did not allow for the survival likelihood to be utilised. Specif-ically, a least squares optimisation was performed to minimise the
R. Ragonnet et al. / Epidem
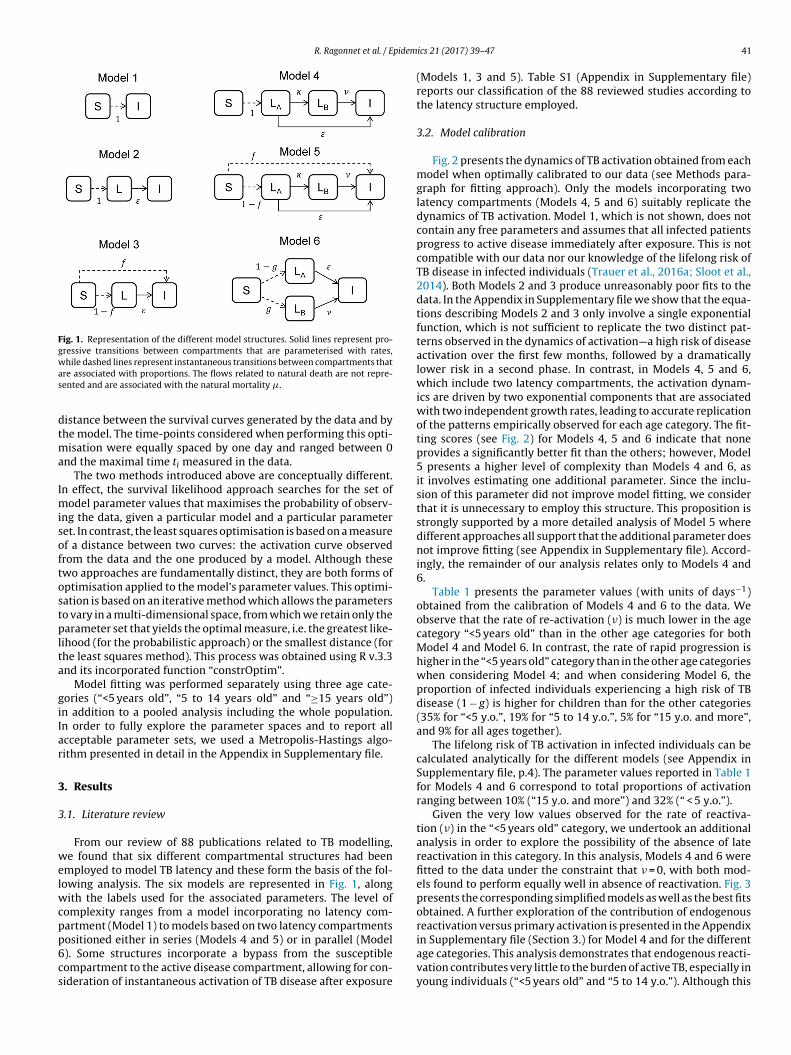
Fig. 1. Representation of the different model structures. Solid lines represent pro-gressive transitions between compartments that are parameterised with rates,was
dtma
Imisoftostplta
giIar
3
3
welwcpp6cs
hile dashed lines represent instantaneous transitions between compartments thatre associated with proportions. The flows related to natural death are not repre-ented and are associated with the natural mortality �.
istance between the survival curves generated by the data and byhe model. The time-points considered when performing this opti-
isation were equally spaced by one day and ranged between 0nd the maximal time ti measured in the data.
The two methods introduced above are conceptually different.n effect, the survival likelihood approach searches for the set of
odel parameter values that maximises the probability of observ-ng the data, given a particular model and a particular parameteret. In contrast, the least squares optimisation is based on a measuref a distance between two curves: the activation curve observedrom the data and the one produced by a model. Although thesewo approaches are fundamentally distinct, they are both forms ofptimisation applied to the model’s parameter values. This optimi-ation is based on an iterative method which allows the parameterso vary in a multi-dimensional space, from which we retain only thearameter set that yields the optimal measure, i.e. the greatest like-
ihood (for the probabilistic approach) or the smallest distance (forhe least squares method). This process was obtained using R v.3.3nd its incorporated function “constrOptim”.
Model fitting was performed separately using three age cate-ories (“<5 years old”, “5 to 14 years old” and “≥15 years old”)n addition to a pooled analysis including the whole population.n order to fully explore the parameter spaces and to report allcceptable parameter sets, we used a Metropolis-Hastings algo-ithm presented in detail in the Appendix in Supplementary file.
. Results
.1. Literature review
From our review of 88 publications related to TB modelling,e found that six different compartmental structures had been
mployed to model TB latency and these form the basis of the fol-owing analysis. The six models are represented in Fig. 1, along
ith the labels used for the associated parameters. The level ofomplexity ranges from a model incorporating no latency com-artment (Model 1) to models based on two latency compartments
ositioned either in series (Models 4 and 5) or in parallel (Model). Some structures incorporate a bypass from the susceptibleompartment to the active disease compartment, allowing for con-ideration of instantaneous activation of TB disease after exposureics 21 (2017) 39–47 41
(Models 1, 3 and 5). Table S1 (Appendix in Supplementary file)reports our classification of the 88 reviewed studies according tothe latency structure employed.
3.2. Model calibration
Fig. 2 presents the dynamics of TB activation obtained from eachmodel when optimally calibrated to our data (see Methods para-graph for fitting approach). Only the models incorporating twolatency compartments (Models 4, 5 and 6) suitably replicate thedynamics of TB activation. Model 1, which is not shown, does notcontain any free parameters and assumes that all infected patientsprogress to active disease immediately after exposure. This is notcompatible with our data nor our knowledge of the lifelong risk ofTB disease in infected individuals (Trauer et al., 2016a; Sloot et al.,2014). Both Models 2 and 3 produce unreasonably poor fits to thedata. In the Appendix in Supplementary file we show that the equa-tions describing Models 2 and 3 only involve a single exponentialfunction, which is not sufficient to replicate the two distinct pat-terns observed in the dynamics of activation—a high risk of diseaseactivation over the first few months, followed by a dramaticallylower risk in a second phase. In contrast, in Models 4, 5 and 6,which include two latency compartments, the activation dynam-ics are driven by two exponential components that are associatedwith two independent growth rates, leading to accurate replicationof the patterns empirically observed for each age category. The fit-ting scores (see Fig. 2) for Models 4, 5 and 6 indicate that noneprovides a significantly better fit than the others; however, Model5 presents a higher level of complexity than Models 4 and 6, asit involves estimating one additional parameter. Since the inclu-sion of this parameter did not improve model fitting, we considerthat it is unnecessary to employ this structure. This proposition isstrongly supported by a more detailed analysis of Model 5 wheredifferent approaches all support that the additional parameter doesnot improve fitting (see Appendix in Supplementary file). Accord-ingly, the remainder of our analysis relates only to Models 4 and6.
Table 1 presents the parameter values (with units of days−1)obtained from the calibration of Models 4 and 6 to the data. Weobserve that the rate of re-activation (�) is much lower in the agecategory “<5 years old” than in the other age categories for bothModel 4 and Model 6. In contrast, the rate of rapid progression ishigher in the “<5 years old” category than in the other age categorieswhen considering Model 4; and when considering Model 6, theproportion of infected individuals experiencing a high risk of TBdisease (1 − g) is higher for children than for the other categories(35% for “<5 y.o.”, 19% for “5 to 14 y.o.”, 5% for “15 y.o. and more”,and 9% for all ages together).
The lifelong risk of TB activation in infected individuals can becalculated analytically for the different models (see Appendix inSupplementary file, p.4). The parameter values reported in Table 1for Models 4 and 6 correspond to total proportions of activationranging between 10% (“15 y.o. and more”) and 32% (“ < 5 y.o.”).
Given the very low values observed for the rate of reactiva-tion (�) in the “<5 years old” category, we undertook an additionalanalysis in order to explore the possibility of the absence of latereactivation in this category. In this analysis, Models 4 and 6 werefitted to the data under the constraint that � = 0, with both mod-els found to perform equally well in absence of reactivation. Fig. 3presents the corresponding simplified models as well as the best fitsobtained. A further exploration of the contribution of endogenousreactivation versus primary activation is presented in the Appendix
in Supplementary file (Section 3.) for Model 4 and for the differentage categories. This analysis demonstrates that endogenous reacti-vation contributes very little to the burden of active TB, especially inyoung individuals (“<5 years old” and “5 to 14 y.o.”). Although this
42 R. Ragonnet et al. / Epidemics 21 (2017) 39–47
Fig. 2. Calibrations obtained with the different models for the percentage of active TB among infected individuals over time since infection. The black lines and grey shaderepresent the estimates (central and 95% CI) obtained from the Kaplan-Meier analysis of our data. The blue line represents the percentage of active TB over time obtainedf ethos atasetr f this
cehLi
4ir
ε
rom the different models, when optimally calibrated with the survival likelihood mtages of infection and do not cover the entire time windows corresponding to the deferences to colour in this figure legend, the reader is referred to the web version o
ontribution is more substantial in the “≥15 years old” category, westimate that only 1% of infected individuals of this category wouldave progressed to active disease transitioning from compartmentB after five or less years from infection (using Eq. (23) in Appendixn Supplementary file).
Our analysis of the analytical solutions associated with Model and Model 6 demonstrated that the two expressions coincide
f the parameter values of the two models satisfy the followingelationships:
6 = ε4 + �4�6 = �4g6 = �4
�4 + ε4 − �4
d. The x-scales were chosen in order to allow for a decent visualisation of the early. Fitting was realised by maximising the fitting score (FS). (For interpretation of the
article.)
where the subscripts indicate to which of Models 4 or 6 theparameters apply. This finding indicates that the dynamics of acti-vation simulated by the two models are identical, differing only inthe value of the parameter values that should be applied.
3.3. Probability distribution of parameters
We used a Bayesian framework to infer the posterior distri-
butions for the parameters in the model. Uniform priors wereused and tools of Bayesian inference applied including MarkovChain Monte-Carlo exploration using the Metropolis-Hastingsacceptance algorithm. The resulting posterior distributions for the
R. Ragonnet et al. / Epidemics 21 (2017) 39–47 43
Table 1Parameter estimates. Calibration issued from the survival likelihood maximisation applied to the merged dataset (Victoria and Amsterdam data). Point estimates correspondto the parameters maximising the likelihood while values into brackets indicate the narrowest interval containing 95% of the accepted values during the Metropolis-Hastingssimulation. Rates are presented as daily values.
ε � � g
Model 4
All ages 1.1e−3
(8.4e−4–1.5e−3)1.0e−2
(8.5e−3 1.4e−2)5.5e−6
(2.5e−6 1.1e−5)–
<5 y.o. 6.6e−3
(4.4e−3 9.5e−3)1.2e−2
(8.5e−3 1.8e−2)1.9e−11
(5.0e−9 1.6e−5)–
5–14 y.o 2.7e−3
(1.7e−3 3.9e−3)1.2e−2
(7.9e−3 1.6e−2)6.4e−6
(6.7e−7 1.9e−5)–
≥15 y.o 2.7e−4
(1.6e−4 5.1e−4)5.4e−3
(3.5e−3 1.1e−2)3.3e−6
(1.9e−6 1.0e−5)–
Model 6
All ages 1.1e−2
(9.2e−3 1.5e−2)– 5.5e−6
(3.4e−6 1.0e−5)0.91(0.89 0.93)
<5 y.o. 1.9e−2
(1.2e−2 2.5e−2)– 3.4e−11
(2.7e−9 2.0e−5)0.65(0.55 0.73)
5–14 y.o 1.4e−2
(9.4e−3 1.8e−2)– 6.4e−6
(8.0e−7 2.2e−5)0.81(0.75 0.86)
≥15 y.o 5.6e−3
(3.8e−3 9.6e−3)– 3.3e−6
(7.3e−7 9.3e−6)0.95(0.94 0.97)
Parameter estimates. Calibration issued from the survival likelihood maximisation appliedto the parameters maximising the likelihood while values into brackets indicate the narrosimulation. Rates are presented as daily values.
Fig. 3. Simplified model structures adapted to simulate TB latency in young children(<5 years old) Here, it is assumed that progression from the previous compartmentsLB of Model 4 and Model 6 to active disease I cannot occur. The compartment LB
tw
dPsmpwvrir
s�gr
partment (�). Concerning Model 6, the best calibration to imputed
herefore becomes a protected state which is labelled R in this illustration. Fittingas realised by maximising the fitting score (FS).
ifferent parameters of Models 4 and 6 are presented (Table 1).roposed statistical distributions that could be used to generateimilar sets of parameters are available in the Appendix in Supple-entary file, along with the posterior distributions obtained for all
arameters. The acceptable ranges of values for the parameter � areide for the category “<5 y.o.”, due to the small number of reacti-
ation cases in our dataset. However, our analysis showed that theate of reactivation is limited by an upper bound of around 2.3e−5
n all categories, which represents a relatively small annual risk ofe-activation of 0.8%.
By analysing the distributions of each of the retained parameterets in pairs, we observed a collinearity between the parameters
and ε for Model 4. This correlation (represented in Fig. 4) sug-ests that when individuals are assumed to stabilise infection moreapidly (� increases), the rate of rapid progression to TB disease (ε)
to the merged dataset (Victoria and Amsterdam data). Point estimates correspondwest interval containing 95% of the accepted values during the Metropolis-Hastings
tends to increase to compensate. This affine relationship betweenparameters � and � is also described through a formal mathematicalanalysis (Appendix in Supplementary file, Section 10.1.2.).
Another result provided by the Metropolis-Hastings simula-tion was the distribution of the average duration spent in the firstlatency compartment for Model 4. This quantity was obtained viathe formula 1
�+ε+� where � represents the natural death rate. Fig. 5presents the distribution of these durations for the different agecategories. The average duration spent in the first latency compart-ment is estimated at 82 days for all age categories combined, thisduration being shorter for children (52 days for “<5 y.o.” category)than for older individuals (70 days for “5 to 14 y.o.” and 146 daysfor “≥15 y.o.”).
3.4. Validation and sensitivity analyses
Our findings were consistent when we employed an alternatefitting method (least squares minimisation), performed separatefits for each dataset (Victoria and Amsterdam) instead of the singlemerged dataset, or used alternate extraction methods for the data ofSloot et al. When fitting Model 3 using least squares minimisation,we obtained a model calibration that differed from that obtainedwith the survival likelihood method (See Appendix in Supplemen-tary file, Fig. S14). However, while this second calibration allowedfor a better simulation of the late stages of latency compared to thebaseline fitting method (Fig. 2), it completely failed to capture theearly dynamics of activation. More details about the different sen-sitivity analyses are available in the Appendix in Supplementaryfile.
Finally, by using imputed data as described in Trauer et al.accounting for the censorship for migration, death, and preventivetreatment and therefore associated with higher estimates for therisk of TB disease (Trauer et al., 2016a), our conclusions regardingoptimal model selection remained unchanged, while we obtainedslightly different optimised parameter values (see Appendix in Sup-plementary file). In particular, in Model 4, imputation led to a slightincrease in the rate of rapid progression (ε) combined with a slightreduction in the rate of transition towards the late latency com-
data was obtained with a higher proportion of infected individualstransitioning to the high risk compartment (1 − g) while the rate ofrapid progression (ε) was slightly reduced.

44 R. Ragonnet et al. / Epidemics 21 (2017) 39–47
Fig. 4. Representation of the collinearity observed between the parameters � and ε for Model 4. The red dots represent the 10,000 accepted parameter sets obtained fromthe Metropolis-Hastings simulation. The black line represents the affine model approximating the data with a least square minimisation. (For interpretation of the referencesto colour in this figure legend, the reader is referred to the web version of this article.)
F el 4. DH
3
t4Awcaeaeiptetro
3
mdatiadpo
ig. 5. Distribution of the times spent in the first latency compartment LA for modastings simulation.
.5. Comparison of our results with previous works
We reviewed the parameter values that had been employed inhe previous studies incorporating the latency structures of Model
and Model 6 and compared these values to our estimates (seeppendix in Supplementary file, Section 9). Concerning Model 4,e found that the rate of progression from compartment LA to
ompartment LB (�) was considerably lower than our estimate inll previous studies, which typically assume long periods spent inarly latency (2–5 years). Similarly, the rate of fast progression toctive TB (ε) used in the existing literature was much lower than ourstimate. For Model 6, the proportion of slow progressors (g) foundn previous works was close to our estimate, whereas the rate of fastrogression (ε) had been markedly underestimated. Finally, whilehe rate of slow progression to active TB (�) was generally under-stimated in studies incorporating either structure (Models 4 or 6),wo studies used point estimates that fall inside of the 95% CI weeport, and nine other studies used parameter ranges overlappingur 95% CI.
.6. Rapid estimation of the parameters for future works
A theoretical analysis of the equations governing the dynamicodels allowed us to develop a method to estimate rapidly the
ifferent parameters of Models 4 and 6 from any dataset. Thispproach involves simple graphical measurements performed onhe curve representing the proportion of active cases amongnfected individuals over time from infection (denoted �), such
s the curves represented in Fig. 2. The detailed description andemonstration of the method is available in the Appendix in Sup-lementary file and the main results are presented here. The profilef � can be decomposed into two phases (see Fig. 2 and detailedistribution associated with 10,000 accepted parameters sets from the Metropolis-
description in Appendix in Supplementary file). The method con-sists of first measuring the initial slope of � (denoted s0) as wellas the characteristics of a tangent to � on a point situated at thebeginning of the second rise phase (slope denoted s, and y-interceptdenoted y0). Then, estimates for the different parameters (ε, �, �and g) can be obtained by using the three measures (s0, s and y0)as follows:
For Model 4 : ε = s0� = ε
y0− ε − �� =
s(
� + ε + �)
�
For Model 6 : ε = s0
y0− �v = s0s
s0 − y0 (s0 + �)g = ε − s0
ε − v
where � designates the natural mortality rate.
4. Discussion
4.1. Main contributions of the study
In this study, we determine the most appropriate model struc-tures for accurately simulating TB latency. We demonstrate that ofthe structures employed in the past, only those that incorporate twocompartments for latent infection are able to reproduce the specificdynamics of TB activation. Such approaches therefore involve twodifferent levels for the rate of activation, allowing for more TB casesto occur after recent infection than through late reactivation. Thiswork also provides a detailed and flexible catalogue of parame-
ter values associated with the retained model structures, that wasvalidated by the use of two independent fitting methods leading tosimilar estimates and that highlighted marked gaps with parametervalues employed in previous works. This study may become a refer-
pidem
eein
4
TldrhiFtbiasrvtiHt2ptgfom
4
coovo1lyiuilaeaoiamoanoceai
R. Ragonnet et al. / E
nce for calibration of future TB models and our approach involvingstimations with and without age stratification will allow our find-ngs to be directly applied whether models are age-structured orot.
.2. Serial versus parallel structure
We demonstrate that the two compartments required to modelB latency could be placed either in series or in parallel, and wouldead to identical activation dynamics. The difficulty in making thisistinction between the two models is unfortunate because theyeflect two alternate biological mechanisms that could explain theigher burden of disease observed after recent infection, each lead-
ng to different recommendations for TB prevention strategies.irst, the serial structure models a decreasing risk of activation overime in every individual, indicating that preventive care shoulde targeted at the most recent infections as a priority through
nterventions such as contact tracing. On the other hand, the par-llel structure suggests that individual predispositions may makeome infected individuals more or less likely to develop disease,egardless of the time from infection. If this second scenario waserified with epidemiological data, these results would suggesthat identifying and finding priority populations could dramat-cally enhance efficiency of interventions. Some factors such asIV-infection, diabetes or smoking are already known to enhance
he risk of TB activation (Bishwakarma et al., 2015; Houben et al.,010; Horsburgh et al., 2010; Jeon and Murray, 2008), although ourarameter estimates under the parallel structure scenario suggesthat around 9% of infected individuals would belong to a high-riskroup in which the risk of TB activation would be as high as 2000-old that of the low-risk group. Alternatively, for the series structuref the latency compartments, rapid identification and early treat-ent of infected people would be the priority.
.3. Age dependency
Our estimations highlight important discrepancies between ageategories, with parameter estimates for young children (<5 yearsld) differing markedly from the other age categories. In particular,ur study suggests that for young children, the rate of disease acti-ation in the high-risk population (early latency for serial structurer high-risk group for parallel structure) is much greater than for5+ year olds. In contrast, among the lower risk population (late
atency for serial structure or low risk group for parallel structure),oung children seem to be at lower risk of activation than the otherndividuals. These findings indicate that the youngest infected pop-lation presents a much higher risk of TB activation early after
nfection, while their risk of activation reduces dramatically in theater stages of infection. Previous works have already identified ages an important factor influencing the natural history of TB (Trauert al., 2016a; Sloot et al., 2014; Vynnycky and Fine, 1997), and ournalysis brings additional insight that reinforces the importancef providing young children with early preventive treatment fornfection as late treatments would be useless. By revealing suchge-specific characteristics, our study also implies that future TBodelling works should incorporate age-stratified structures in
rder to replicate TB activation dynamics accurately. Our analysislso demonstrates that simplified model structures incorporatingo reactivation are adapted to simulate TB latency in the “<5 yearsld” category, suggesting that a significant proportion of infected
hildren will never reactivate. Depending on the model structuremployed, these young individuals could either become immunefter some duration of infection (serial structure) or be protectedmmediately after infection (parallel structure).ics 21 (2017) 39–47 45
4.4. Comparison with previous works
When two latency compartments are positioned in series, therate of transition from early latency to late latency reflects theperiod for which individuals remain at high risk of disease. Weestimate that the average early latency period is 52, 70 days and146 days, for child(<5), adolescents (5–14) and adults, respectively.Most previous works employing the serial structure have used 5years to define early latency, based on a previous convention todefine primary disease versus endogenous disease (Vynnycky andFine, 1997; Holm, 1969), and therefore may have greatly overes-timated the actual duration of high risk. Our review of articlesshowed that the models with these long durations at high risk werealso associated with lower rates of fast progression to active dis-ease than the rates estimated from our study which compensatesfor the long early latency and leads to similar overall risks of acti-vation over a lifetime. However, we have shown that our approach,which has dramatically shorter durations for the time spent in earlylatency and at high risk, is required in order to reproduce the profileof activation dynamics accurately.
Our estimate for the rate of late reactivation corresponds to arisk of 0.20 cases per 100 person-years for all ages, but is muchlower among the ‘<5 years old’ category. However, although ouranalysis clearly highlights different patterns of reactivation by age,accurate estimation of the reactivation parameter for the ‘<5 yearsold’ category was limited by the small number of reactivationcases observed in this sub-group, which explains the wide vari-ation in the associated confidence intervals. While previous worksreported somewhat lower estimates for the late reactivation ratefor all ages, ranging from 0.04 to 0.16 cases per 100 person-years(Vynnycky and Fine, 1997; Horsburgh et al., 2010; Comstock et al.,1967; Ferebee, 1970), our findings suggest that these results canonly be interpreted in the context of age mix in the studies, andwe can speculate that some of this variability may be accountedfor by different proportions of “<5 year olds” in the study popula-tions. Detailed data by age are not available from previous worksso formal analysis by age has not been possible. Another possibleexplanation for the difference between our estimate and previousvalues for the reactivation rate is that the definition of infection inour datasets may be more specific than what was used in previousstudies. In particular, looser definitions for infection may includefalse positives which would tend to increase the number of persons“at risk” and therefore reduce the inferred reactivation rate.
While our study shows that previous TB models have not alwaysincorporated the optimal structure or parameterisation to accountfor the specific patterns observed in TB activation dynamics, thepotential consequences of using suboptimal approaches remainsundetermined. However, an analysis by Dowdy and colleagues ofthe most influential parameters to TB dynamics demonstrated thatthe parameters describing early latency are among those with thegreatest impact on model predictions of steady-state TB incidence(Dowdy et al., 2013). This suggests that it is critical to reproduceearly dynamics of TB infection closely in order to provide accu-rate insight into the epidemics trajectory. Therefore, future worksinvestigating the consequences of employing inappropriate modelstructures or parameterisation are needed.
4.5. Potential for other future works
Our analysis was based on data from very low TB endemic set-tings where re-infection is expected not to play an important role(Wang et al., 2007). This allowed our estimation to focus on the
potential progression to active disease following a single infectionevent and to avoid the confusion that would emerge from repeatedinfections when estimating the time from infection to activation. Inthe event that similar datasets became available in higher endemic
4 pidem
soificri
tAtcmoaeapsts(
tttev
5
rtsfiefwut
C
A
RM
F
i
A
fM
6 R. Ragonnet et al. / E
ettings, a follow-up study could be conducted by integratingur “re-infection free” parameterisation into a model that wouldnclude an additional pathway for re-infection during latency. Bytting such a model to the new data, the re-infection parameterould then be estimated, thus providing valuable insights into theelative contribution of re-infection compared to the risk of firstnfection.
It is important to remember that the calibrations presented inhis study are associated with the specific models that we selected.ccordingly, such estimates could not directly be used in models
hat incorporate a different structure or that do not belong to theategory of deterministic compartmental transmission dynamicodels. However, provided that both the structure and the nature
f the model correspond to those used in this study, our work couldlso be used to re-estimate parameters associated with many differ-nt settings. To this end, we provide a step-by-step method whichllows for rapid estimation of the different model parameters byerforming simple measures on the reactivation failure curve. Con-equently, our study could also be used to inform models in settingshat present different characteristics, such as high HIV-endemicettings where the activation dynamics are known to be differentHouben et al., 2010; Horsburgh et al., 2010).
One natural limitation of this work is that it is linked tohe epidemiological challenges of timing infection and reactiva-ion accurately. However, the estimated durations that we use inhis study are derived from two recently published works thatmployed rigorous definitions for both dates of infection and acti-ation (Trauer et al., 2016a; Sloot et al., 2014).
. Conclusions
Only models employing two latency compartments are able toeproduce TB latency dynamics accurately. We provide parame-er values to optimally simulate epidemiological observations inuch models along with an approach to obtaining such values fromuture epidemiological studies. Our analysis also reinforces themportance of age-stratification for capturing the dramatic differ-nces between age groups in patterns of reactivation, which implyundamental biological differences between age groups. However,e also demonstrate that data of the type this analysis is basedpon cannot be used to determine the ideal configuration for thewo latency compartments.
ompeting interests
We have no competing interests.
uthor’s contributions
RR, JMT and ESM designed the study. RR performed the analysis.R, JMT, NS, MTM, JTD and ESM interpreted the results. RR, JMT, NS,TM, JTD and ESM wrote the manuscript.
unding
RR was supported by an Australian Government Research Train-ng Program Scholarship.
cknowledgments
We thank the nurses and other staff of the Victorian TB Programor collecting the data In particular, we would like to thank Nompilo
oyo and Ee-Laine Tay who compiled the dataset.
ics 21 (2017) 39–47
Appendix A. Supplementary data
Supplementary data associated with this article can be found, inthe online version, at http://dx.doi.org/10.1016/j.epidem.2017.06.002.
References
Abu-Raddad, L.J., Sabatelli, L., Achterberg, J.T., Sugimoto, J.D., Longini Jr., I.M., Dye,C., Halloran, M.E., 2009. Epidemiological benefits of more-effectivetuberculosis vaccines, drugs, and diagnostics. Proc. Natl. Acad. Sci. U. S. A. 106(33), 13980–13985.
Aparicio, J.P., Castillo-Chavez, C., 2009. Mathematical modelling of tuberculosisepidemics. Math. Biosci. Eng. 6, 209–237.
Bishwakarma, R., Kinney, W.H., Honda, J.R., Mya, J., Strand, M.J., Gangavelli, A., Bai,X., Ordway, D.J., Iseman, M.D., Chan, E.D., 2015. Epidemiologic link betweentuberculosis and cigarette/biomass smoke exposure: limitations despite thevast literature. Respirology 20 (4), 556–568.
Blower, S.M., Chou, T., 2004. Modeling the emergence of the ‘hot zones’:tuberculosis and the amplification dynamics of drug resistance. Nat. Med. 10,1111–1116.
Castillo-Chavez, C., Feng, Z., 1997. To treat or not to treat: the case of tuberculosis.J. Math. Biol. 35 (6), 629–656.
Cohen, T., Lipsitch, M., Walensky, R.P., Murray, M., 2006. Beneficial and perverseeffects of isoniazid preventive therapy for latent tuberculosis infection inHIV-tuberculosis coinfected populations. Proc. Natl. Acad. Sci. U. S. A. 103,7042–7047.
Cohen, T., Colijn, C., Finklea, B., Wright, A., Zignol, M., Pym, A., Murray, M., 2008.Are survey-based estimates of the burden of drug resistant TB too low? Insightfrom a simulation study. PLoS One 3 (6), e2363.
Colijn, C., Cohen, T., Murray, M., 2008. Latent coinfection and the maintenance ofstrain diversity. Bull. Math. Biol. 71, 247–263.
Comstock, G.W., Ferebee, S.H., Hammes, L.M., 1967. A controlled trial ofcommunity-wide isoniazid prophylaxis in Alaska. Am. Rev. Respir. Dis. 95 (6),935–943.
Dowdy, D.W., Dye, C., Cohen, T., 2013. Data needs for evidence-based decisions: atuberculosis modeler’s ‘wish list’. Int. J. Tuberc. Lung Dis. 17 (7), 866–877.
Dye, C., 2012. The potential impact of new diagnostic tests on tuberculosisepidemics. Indian J. Med. Res. 135, 737–744.
Ferebee, S.H., 1970. Controlled chemoprophylaxis trials in tuberculosis: a generalreview. Bibl. Tuberc. 26, 28–106.
Gomes, M.G., Franco, A.O., Gomes, M.C., Medley, G.F., 2004. The reinfectionthreshold promotes variability in tuberculosis epidemiology and vaccineefficacy. Proc. Biol. Sci. 271, 617–623.
Hill, A.N., Becerra, J., Castro, K.G., 2012. Modelling tuberculosis trends in the USA.Epidemiol. Infect. 140, 1862–1872.
Holm, J., 1969. Development from Tuberculous Infection to Tuberculous Disease.KNVC, The Hague, The Netherlands.
Horsburgh Jr., C.R., O’Donnell, M., Chamblee, S., Moreland, J.L., Johnson, J., Marsh,B.J., Narita, M., Johnson, L.S., von Reyn, C.F., 2010. Revisiting rates ofreactivation tuberculosis: a population-based approach. Am. J. Respir. Crit.Care Med. 182 (3), 420–425.
Houben, R.M., Dodd, P.J., 2016. The global burden of latent tuberculosis infection: aRe-estimation using mathematical modelling. PLoS Med. 13 (10), e1002152.
Houben, R.M., Glynn, J.R., Mallard, K., Sichali, L., Malema, S., Fine, P.E., French, N.,Crampin, A.C., 2010. Human immunodeficiency virus increases the risk oftuberculosis due to recent re-infection in individuals with latent infection. Int.J. Tuberc. Lung Dis. 14 (7), 909–915.
Jeon, C.Y., Murray, M.B., 2008. Diabetes mellitus increases the risk of activetuberculosis: a systematic review of 13 observational studies. PLoS Med. 5 (7),e152.
Lin, H.H., Langley, I., Mwenda, R., Doulla, B., Egwaga, S., Millington, K.A., Mann,G.H., Murray, M., Squire, S.B., Cohen, T., 2011. A modelling framework tosupport the selection and implementation of new tuberculosis diagnostictools. Int. J. Tuberc. Lung Dis. 15, 996–1004.
Menzies, N.A., Cohen, T., Lin, H.H., Murray, M., Salomon, J.A., 2012. Populationhealth impact and cost-effectiveness of tuberculosis diagnosis with XpertMTB/RIF: a dynamic simulation and economic evaluation. PLoS Med. 9,e1001347.
Sloot, R., Schim van der Loeff, M.F., Kouw, P.M., Borgdorff, M.W., 2014. Risk oftuberculosis after recent exposure: a 10-year follow-up study of contacts inAmsterdam. Am. J. Respir. Crit. Care Med. 190 (9), 1044–1052.
Trauer, J.M., Denholm, J.T., McBryde, E.S., 2014. Construction of a mathematicalmodel for tuberculosis transmission in highly endemic regions of theAsia-Pacific. J. Theor. Biol. 358, 74–84.
Trauer, J.M., Moyo, N., Tay, E.L., Dale, K., Ragonnet, R., McBryde, E.S., Denholm, J.T.,2016a. Risk of active tuberculosis in the five years following infection. 15%?Chest 149 (2), 516–525.
Trauer, J.M., Denholm, J.T., Waseem, S., Ragonnet, R., McBryde, E.S., 2016b. Scenario
analysis for programmatic tuberculosis control in western province, PapuaNew Guinea. Am. J. Epidemiol. 183 (12), 1138–1148.Vynnycky, E., Fine, P.E., 1997. The natural history of tuberculosis: the implicationsof age-dependent risks of disease and the role of reinfection. Epidemiol. Infect.119 (2), 183–201.

pidem
WW
R. Ragonnet et al. / E
HO, 2016. Global Tuberculosis Report. World Health Organization.allinga, J., Lipsitch, M., 2007. How generation intervals shape the relationship
between growth rates and reproductive numbers. Proc. Biol. Sci. 274 (1609),599–604.
ics 21 (2017) 39–47 47
Wang, J.Y., Lee, L.N., Lai, H.C., Hsu, H.L., Liaw, Y.S., Hsueh, P.R., Yang, P.C., 2007.Prediction of the tuberculosis reinfection proportion from the local incidence.J. Infect. Dis. 196 (2), 281–288.
Wearing, H.J., Rohani, P., Keeling, M.J., 2005. Appropriate models for themanagement of infectious diseases. PLoS Med. 2 (7), e174.