optimisation of food to microorganism ratios during ... · optimisation of food to microorganism...
TRANSCRIPT
IIIIIIIIIIIIIIIIIIIII
OPTIMISATION OF FOOD TO MICROORGANISMRA TIOS DURING ACTIVATED SLUDGE
RESPIROMETRIC BATCH ASSAYS
ARSHAD ABDOOL HAK ISMAIL
2003
IIIIIIIIIIIIIIIIIIII
OPTIMISATION OF FOOD TO MICROOGANISM RATIOSDURING ACTIVATED SLUDGE RESPIROMETRiC
BATCH ASSAYS
ARSHAD ABDOOL HAK ISMAIL
Dissertation submitted in compliance with the requirements of the Master's Degree inTechnology in the Department of Biotechnology, Durban Institute of Technology
Approved for final submission
'7'-05 -03
Supervisor:Dr. Faizal Bux(D. Tech: Biotechnology, D.I.T.)
Date
2003

III
DECLARA TION
IIII
I hereby declare that the dissertation is my own work, unless stated to the contrary in thetext, and that it has not been submitted in part, or in whole to any other
TechnikonlUniversity.
III
II
A.A.H. Ismail
II
APRIL, 2003
IIIIIII
IIIIIIIIIIIIIIIIIIIII
DEDICATION
To my Parents ... for their constant support and encouragement
ii
IIIIIIIIIIIIIIIIIIIII
ABSTRACT
The measured kinetics of a bacterial culture degrading a single organic compound as a
sole carbon source in a batch reactor depends on the history of the culture, the
identifiability of the parameters, and the manner in which the experiment to measure
them is run. The initial substrate to biomass ratio (So/Xo) used in the experiment is
particularly important because it influences both parameter identifiability and the
expression of the culture history.
In this study five batch tests were run at So/Xo ratios of 0.8, 1.5, 4, 8 and 11. Mixed
liquor harvested for each batch test was drawn from a well-defined parent anoxic/aerobic
activated sludge system. Contemporary molecular techniques were applied to investigate
the microbial community profile of batch test at defined So/Xo ratios and how the
microbial community structure is influenced by these ratios.
Denaturing gradient gel electrophoresis (DGGE) analysis of PCR-amplified 16S rONA
gene segments was used to examine microbial population shifts in respirometric batch
test at defined So/Xo ratios. Biomass growth and substrate removal curves for batch test
with So/Xo ratios of 0.8 and 1.5 were typical for a system without cell multiplication.
This was confirmed by the consistencies of two predominant common DGGE bands
evident throughout the duration of the batch tests, suggesting no shift in microbial
community structure away from its original treatment environment. At So/Xo ratios of 4,
8 and 11 biomass growth and substrate removal curves were typical for a system with cell
multiplication. The DGGE banding patterns evident at these ratios were suggestive of a
large qualitative shift in microbial community structure, this was indicative by the
absence of predominant DGGE bands (one or two bands) present in its original microbial
culture.
IV
III
PREFACE
II
Aspects of the work covered in this dissertation can be found In the followingpublication.
III
Ismail A.A.H (2003) Denaturing Gradient Gel Electrophoresis of MicrobialCommunity in Activated Sludge Respirometric Batch Assays at Defined So/XoRatios. Water Research (Submitted)
IIIIIIIIIII v
II

III ACKNOWLEDGEMENTS
I I wish to express my sincere gratitude and appreciation to the following people for theirassistance in the completion of this dissertation.
III
);> Mr. Faizal Bux for giving me the opportunity, supporting my ideas andunderstanding my financial position.
);> Mr. Michael de Villiers and Miss Francisca Holden for their interest, valuableinsight and assistance during the course of my work.
II
);> My colleagues at the Centre for Water and Wastewater Research: Adrian Degenaar,Serusha Inarman and Pamela Padayachee for their constant involvement, technicalassistance and understanding.
I );> My siblings: Riyad, Surfaraz and Isma for their love, support, encouragement andpatience through the years.
IIIIIIIII vi
I
IIIIIIIIIIIIIIIIIIIII
TABLE OF CONTENTS
TITLE PAGE i
DECLARATION ii
DEDICATION iii
ABSTRACT. iv
PREFACE v
ACKNOWLEDGEMENT VI
TABLE OF CONTENTS vii
LIST OF TABLES xi
LIST OF FIGURES xii
LIST ABBREVIATIONS xv
CHAPTER 1
General Introduction
1.1 Nutrient overloading: Unbalancing the Global Nitrogen Cycle I
1.2 Biological Treatment Process........................................................... . 4
l.2.1 Population Dynamics 5
1.3 Activated Sludge Process 7
1.3.1 Biological Nutrient Removal Configurations 8
1.4 Heterotrophic Active Biomass 12
1.5 Microbial Community Analyses 13
1.6 Aims and Objectives 15
vii
IIIIIIIIIIIIIIIIIIIII
CHAPTER 2
Literature Review
2.1 Biochemistry of Heterotrophic Respiratory Metabolism 16
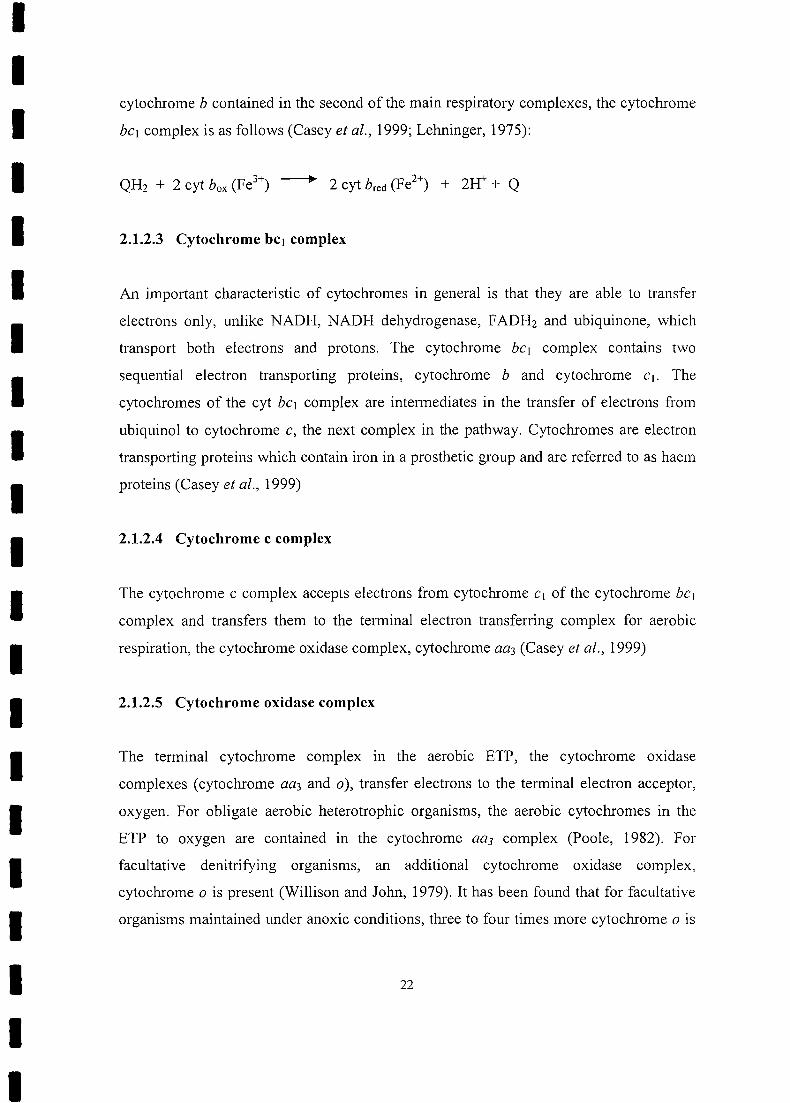
2.l.1 Stages of Respiratory Metabolism 17
2.1.2 Aerobic Respiration 19
2.l.2.1 NADH Dehydrogenase Enzyme Complex 20
2.l.2.2 Ubiquinone 21
2.l.2.3 Cytochrome be, complex 22
2.1.2.4 Cytochrome c complex 22
2.l.2.5 Cytochrome oxidase complex 22
2.1.3 Anoxic respiration 23
2. 1.3.1 Nitrate reductase.................................... . 25
2.l.3.2 Nitrite reductase........................................................ . 25
2.1.3.3 Nitric oxide reductase 26
2.1.3.4 Nitrous oxide reductase 26
2.2 The Development of Molecular Biology 27
2.2.1 The rRNA Revolution 28
2.2.2 Analysis ofrRNA molecules . 29
2.3 The Polymerase Chain Reaction . 30
2.3.1 Thermus aquaticus DNA polymerase 32
2.3.2 The design of amplification primers .33
2.3.3 Sources of Error using PCR.................................................... . 34
2.3.3.1 Taq Polymerase Reading Errors............................... . 34
2.3.3.2 Chimeric Gene Products 35
2.4 Denaturing Gradient Gel Electrophoresis 35
2.4.1 Principal of the Method 37
2.4.2 Perpendicular DGGE 40
2.4.3 Parallel DGGE 41
2.4.3.1 Analysis of Natural Microbial Population 42
viii
IIIIIIIIIIIIIIIIIIIII
2.5 Respirometric Batch Assays 43
2.5.1 Growth Rate in Batch Reactors 43
2.5.2 The So/Xo Ratio 45
2.5.2.1 Considerations for determining the So/Xo ratio 46
CHAPTER 3
The Modified Ludzack-Ettinger Process for Nitrogen Removal
3.1 Introduction 48
3. 1.1 Mass Balance Equations.................................................... . 5 1
3.1.1.1 COD Mass Balance 52
3.1.1.2 Nitrogen Mass Balance 54
3.2 Methodology 56
3.2.1 Parent System............................................... . 56
3.2.2 System performance monitoring and analytical procedures 56
3.3 Results ..57
3.4 Discussion 60
3.5 Conclusion 61
CHAPTER 4
The Relationship between Biomass Growth and Substrate Removal
4.1 Introduction 62
4.2 Methodology 63
4.2.1 Batch Test Experiment 63
4.2.2 Measurement of COD, ML VSS and determination of So/Xo ratio 64
4.3 Results 66
4.4 Discussion 76
4.5 Conclusion 78
IIIIIIIIIIIIIIIIIIIII
CHAPTER 5
Determination of Microbial Population Profiles at Defined So/Xo ratios
5.1 Introduction 79
5.2 Methodology 81
5.2.1 DNA Extractions ..81
5.2.2 PCR.................................................................................................. 81
5.2.3 DGGE 8]
5.3 Results 82
5.4 Discussion 87
5.5 Conclusion 89
CHAPTER 6
General Conclusion and Recommendation 90
REFERENCES 92
APPENDICIES
APPENDIX 1 104
APPENDIX 2 107
APPENDIX 3 110
APPENDIX 4 ] 11
APPENDIX 5 112
APPENDIX 6 . .... 113
APPENDIX 7 1 17
IIIIIIIIIIIIIIIIIIII
TABLE 1.1
TABLE 1.2
TABLE 3.1
TABLE 3.2
LIST OF TABLES
Global Sources of Biologically available (Fixed) Nitrogen 2
Advantages and Disadvantages of nitrogen removal system 11
Steady state results for parent laboratory-scale anoxic/aerobic activated
sludge system 53
Steady state COD and N mass balances for parent anoxic/aerobic
activated sludge system 54
x

FIGURE 1.1 Schematic representation of the nitrogen cycle 2
FIGURE 1.2a Predator-prey relationship between protozoa and bacteria in an activated
sludge system 6
FIGURE 1.2b Sedimentation and recirculation maintains the desired food to
microorganism ratio (F/M) ratio in the aeration basin 6
The Wuhrmann process for nitrogen removal 9
The Bardenpho process for nitrogen removal 10
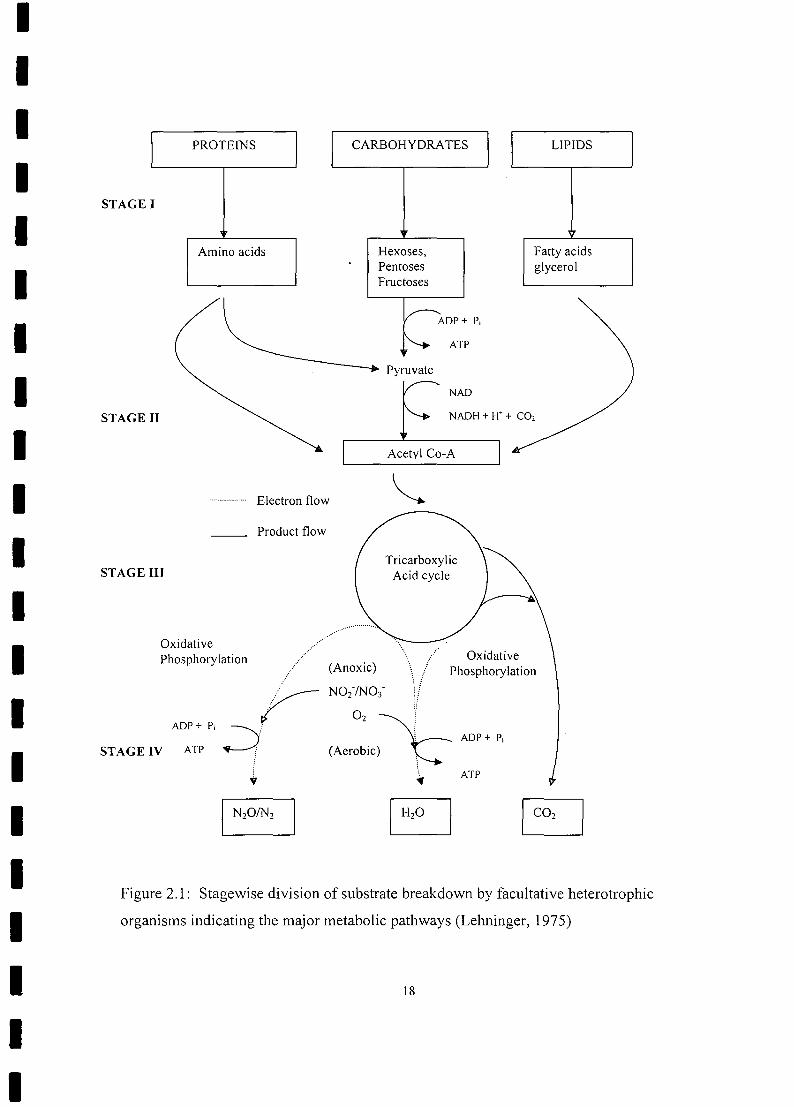
Stagewise division of substrate breakdown by facultative heterotrophic
organisms indicating the major metabolic pathways 18
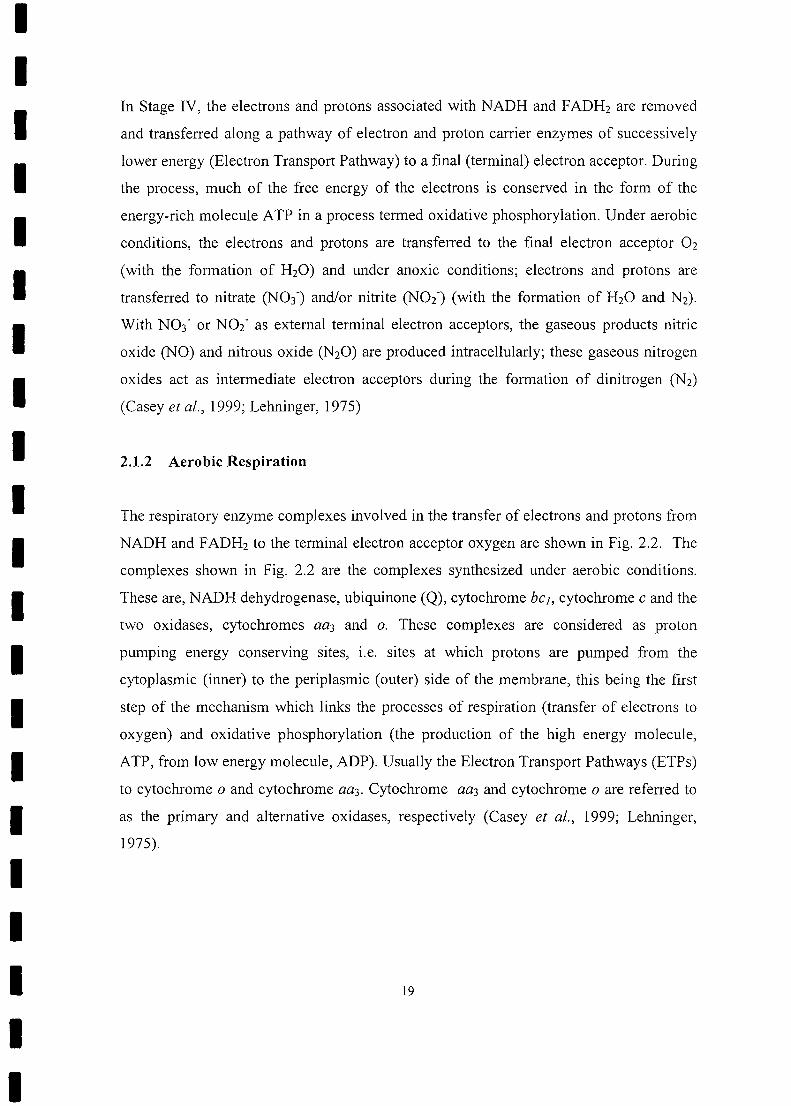
FIGURE 2.2 Electron Transport Pathway (ETP) for a typical facultative aerobic
heterotrophic organism grown under aerobic conditions 20
FIGURE 2.3 Electron transport pathway (ETP) for a typical facultative aerobic
heterotrophic organism grown under anoxic conditions 24
A schematic outline of the polymerase chain reaction 31
Schematic diagram of the rDNA region amplified by PCR 34
An example of wild-type and mutant DNA fragments that were
denatured and re-annealed to generate four fragments, two
Heteroduplexes and two homo duplexes 37
FIGURE 2.7 An example of DNA melting properties in a perpendicular denaturing
gradient gel 41
Typical growth curves for a batch reactor 44
The modified Ludzack Ettinger process for nitrogen removal 48
Division of influent COD into its constituent fractions 50
Division of the total influent TKN into its constituent fractions 50
Schematic layout and operational data for parent laboratory-scale
Modified Ludzack Ettinger (MLE) anoxic/aerobic activated sludge
system 57
FIGURE 4.1 A schematic representation of stirred aerated Batch reactor 63
IIIIIIIIIIIIIIIIIIII
FIGURE 1.3
FIGURE 1.4
FIGURE 2.1
FIGURE 2.4
FIGURE 2.5
FIGURE 2.6
FIGURE 2.8
FIGURE 3.1
FIGURE 3.2
FIGURE 3.3
FIGURE 3.4
LIST OF FIGURES
Xl
IIIIIIIIIIIIIIIIIIII
FIGURE 4.2 OUR response with time for aerobic batch test with So/Xo ratio of
0.8 66
FIGURE 4.3 Substrate removal and biomass growth curve for aerobic batch test with
So/Xo ratio of 0.8 67
FIGURE 4.4 OUR response with time for aerobic batch test with So/Xo ratio of
1.5 68
FIGURE 4.5 Substrate removal and biomass growth curve for aerobic batch test with
So/Xo ratio of 1.5 , , 69
FIGURE 4.6 OUR response with time for aerobic batch test with So/Xo ratio
of4 70
FIGURE 4.7 Substrate removal and biomass growth curve for aerobic batch test with.
So/Xo ratio of 4 71
FIGURE 4.8 OUR response with time for aerobic batch test with So/Xo ratio
of8 72
FIGURE 4.9 Substrate removal and biomass growth curve for aerobic batch test with
So/Xo ratio of 8............................................................................ ... 73
FIGURE 4.10 OUR response with time for aerobic batch test with So/Xo ratio
of 11 74
FIGURE 4.11 Substrate removal and biomass growth curve for aerobic batch test with
So/Xo ratio of 11 75
FIGURE 5.1 Negative image of an ethidium bromide-stained DGGE pattern of PCR
products obtained from the aerobic reactor mixed liquor before being
harvested for the batch test 82
FIGURE 5.2 Ethidium bromide stained DGGE pattern ofPCR products obtain from a
batch test with So/Xo ratio of 0.8 83
FIGURE 5.3 Ethidium bromide stained DGGE pattern of PCR products obtain from a
batch test with So/Xo ratio of 1.5 83
FIGURE 5.4 Ethidium bromide stained DGGE pattern of PCR products obtain from a
batch test with So/Xo ratio of 4 84
FIGURE 5.5 Ethidium bromide stained DGGE pattern ofPCR products obtain from a
batch test with So/Xo ratio of 8 84
xii
II
FIGURE 5.6
IIIIIIIIIIIIIIIIII
Ethidium bromide stained DGGE pattern ofPCR products obtain from a
batch test with So/Xo ratio of 11 85
xiv
II
LIST OF ABBREVIATIONS
Ia mixed liquor recycle ratio from aerobic to the anoxic reactor
I A adenine
ADP adenosine diphosphate
I ATP adenosine triphosphate
Iaq aqueous
BNR biological nutrient removal
BOD biological oxygen demand
I bp = base pair
IC cytosine
CDGE constant denaturing gradient gel electrophoresis
ICO2 carbon dioxide
CoA coenzyme A
I COD chemical oxygen demand
DGGE denaturing gradient gel electrophoresis
I DNA deoxyribonucleic acid
rDNA ribosomal DNA
I DO dissolved oxygen
ETP electron transport pathway
I f, = nitrogen fraction of the MLVSS (O.lmgN/mgYSS)
fev COD to VSS ratio of volatile sludge mass (l.48mgCOD/mgYSS)
I FAD = flavin adenine dinucleotide - oxidized
FADH2 flavin adenine dinucleotide - reduced
I FIM food to microorganism ratio
FMN = flavin mononucleotide - oxidized
I FMNH2 = flavin mononucleotide - reduced
fp flavoprotein
I g = gaseous
G guarune
I GTP guanosine triphosphate
I A'V
II
II
l\1LE modified Ludzack-Ettinger
I l\1LOSS mixed liquor organic suspended solids
l\1LVSS mixed liquor volatile suspended solids
I N nitrogen
Nd nitrate denitrified
I Nne effiuent nitrate
INng nitrate generated
Nti TKN in the influent
Nte = TKN in the effluent
I Ns nitrogen incorporated in VSS per day
Nw = TKN in waste sludge
I NAD+ nicotinamide adenine dinucleotide - oxidized
I NADH nicotinamide adenine dinucleotide - reduced
NaR nitrate reductase
I NH3 ammonia
NiR nitrite reductase
I NOR nitric oxide reductase
N20R nitrous oxide reductase
I NO nitric oxide
N02- nitrite
I N03- = nitrate
N2 dinitrogen
I N20 nitrous oxide
O2 oxygen
I Oc = oxygen required for carbonaceous degradation
Od oxygen recovered via denitrification
I On oxygen used for nitrification
o., measured oxygen per day
I OUR oxygen utilization rate
p phosphorous
I peR polymerase chain reaction
I xvi
II
II
PSS
I Q
IQH2
Qi
RNA
I Rss
I So/Xo
Sti =
I s,
I Sxw
T
I Taq
TCA
I TKN
UCT
I VSS
ww
I XH
Xv
IIIIIIII
protein synthesizing system
ubiquinone
ubiquinol
influent flow rate
ribonucleic acid
sludge age
sludge recycle ratio from the settler to the anoxic reactor
initial substrate to initial biomass ratio
influent COD concentration
effluent COD concentration
COD in waste sludge
Thymidine
Thermus aquaticus
Tricarboxylic acid (cycle)
total Kjeldahl nitrogen
University of Cape Town
volatile suspended solids
wastewater
heterotrophic active biomass
mixed liquor volatile suspended solids
xvi
IIIIIIIIIIIIIIIIIIIII
CHAPTER 1
General Introduction
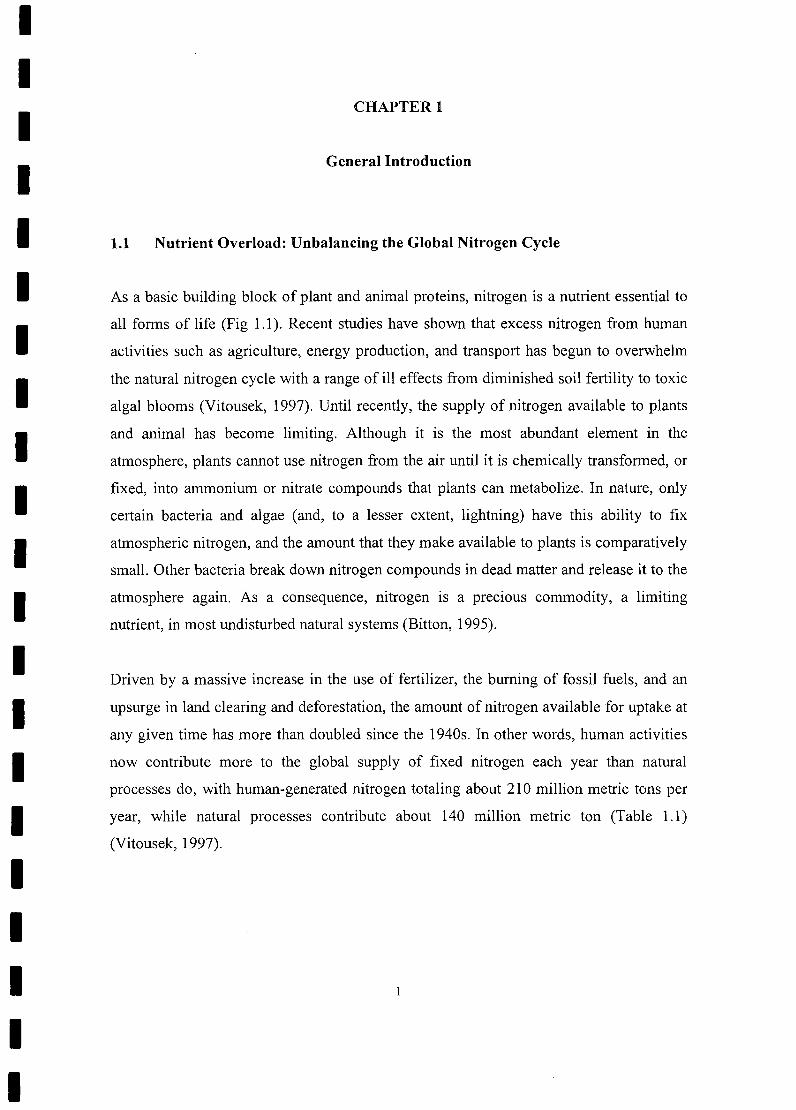
1.1 Nutrient Overload: Unbalancing the Global Nitrogen Cycle
As a basic building block of plant and animal proteins, nitrogen is a nutrient essential to
all forms of life (Fig 1.1). Recent studies have shown that excess nitrogen from human
activities such as agriculture, energy production, and transport has begun to overwhelm
the natural nitrogen cycle with a range of ill effects from diminished soil fertility to toxic
algal blooms (Vitousek, 1997). Until recently, the supply of nitrogen available to plants
and animal has become limiting. Although it is the most abundant element in the
atmosphere, plants cannot use nitrogen from the air until it is chemically transformed, or
fixed, into ammonium or nitrate compounds that plants can metabolize. In nature, only
certain bacteria and algae (and, to a lesser extent, lightning) have this ability to fix
atmospheric nitrogen, and the amount that they make available to plants is comparatively
small. Other bacteria break down nitrogen compounds in dead matter and release it to the
atmosphere again. As a consequence, nitrogen is a precious commodity, a limiting
nutrient, in most undisturbed natural systems (Bitton, 1995).
Driven by a massive increase in the use of fertilizer, the burning of fossil fuels, and an
upsurge in land clearing and deforestation, the amount of nitrogen available for uptake at
any given time has more than doubled since the 1940s. In other words, human activities
now contribute more to the global supply of fixed nitrogen each year than natural
processes do, with human-generated nitrogen totaling about 210 million metric tons per
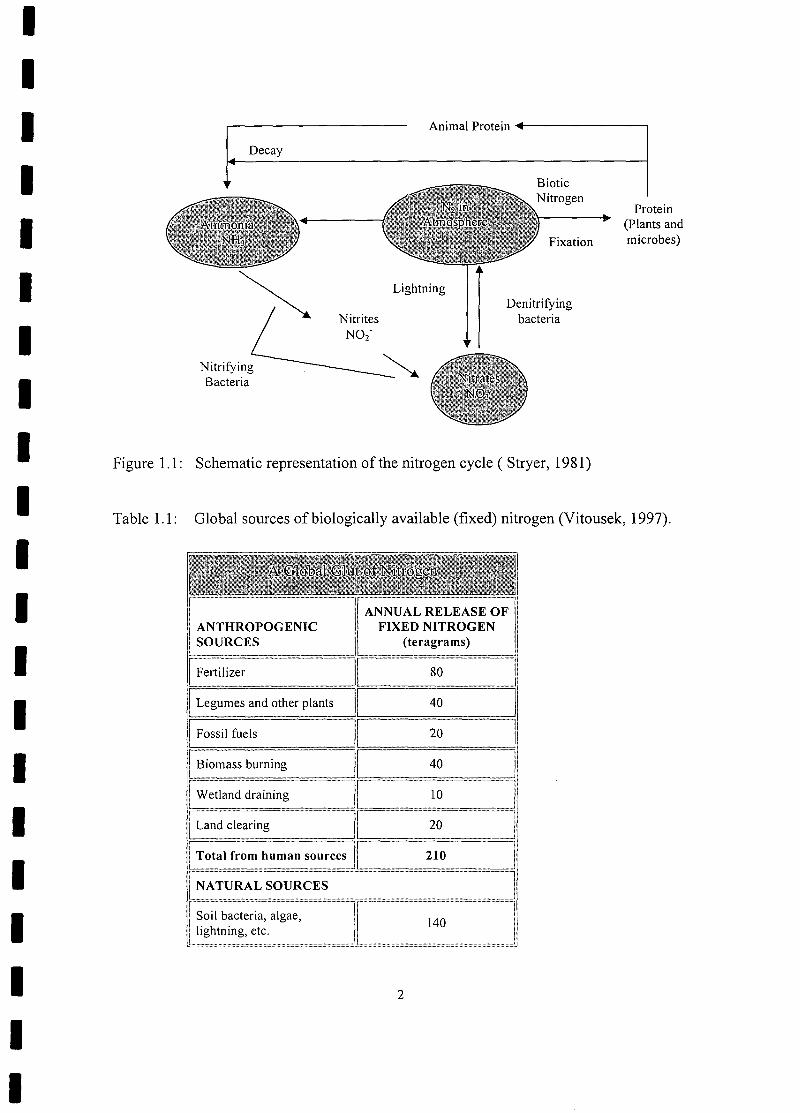
year, while natural processes contribute about 140 million metric ton (Table l.1)
(Vitousek, 1997).
III Animal Protein .....---------,
II
t Decay
IFixation
Protein(Plants andmicrobes)
LightningDenitrifying
bacteria
III
NitrifyingBacteria
Figure 1.1: Schematic representation of the nitrogen cycle (Stryer, 1981)
I Table 1.1: Global sources of biologically available (fixed) nitrogen (Vitousek, 1997).
II
i ANTHROPOGENIC: SOURCES
ANNUAL·~~~;~~;~;I:FIXED NITROGEN
(teragrams)
I,I Wetland drainingL
10
II
Fertilizer 80
40
I Fossil fuels 20
I II Biomass burning:r-
Land clearing
40
20
I'I Total from human sources 210
I NATURAL SOURCESI
140II
·1 ..Ii Soil bacteria, algae,I lightning, etc.L.....
2
II
IIIIIIIIIIIIIIIIIIIII
Although terrestrial ecosystems are vulnerable to the global nitrogen glut, aquatic
ecosystems in lakes, rivers, and coastal estuaries have probably suffered the most so far.
They are the ultimate receptacle of much of the nutrient overload, which tends to
accumulate in runoff or to be delivered directly in the form of raw or treated sewage.
(Sewage is very high in nitrogen from protein in the human diet.) In these aquatic
systems, excess nitrogen often greatly stimulates the growth of algae and other aquatic
plants. When this extra plant matter dies and decays, it can deprive the water of its
dissolved oxygen, suffocating many aquatic organisms (Vitousek, 1997).
This overfertilization process, called eutrophication (Steyn et al., 1975), is one of the
most serious threats to aquatic environments today, particularly in coastal estuaries and
inshore waters where most commercial fish and shellfish species breed .One of the more
troubling aspects of this nutrient assault on aquatic systems has been a steady rise in toxic
algal blooms, which can take a heavy toll on fish, seabirds, and marine mammals
(Vitousek, 1997).
Limitation of nutrient discharges into waters from point sources (sewers) is usually
achieved by biological means, either by way of biological trickling filters or activated
sludge systems. Both these systems utilize naturally occurring bacteria to reduce the
nutrient concentrations entering waters. Artificial conditions favourable for the controlled
growth of these bacteria are created within these systems and results in concentrations of
at least a million times that found in the natural environment. The bacteria in these
systems utilize the nutrients for growth and in this way the nutrients pass from the liquid
phase into a solid phase and are concentrated in the biological culture (Lilley et al., 1997)
3
IIIIIIIIIIIIIIIIIIIII
1.2 Biological Treatment Processes
Municipal wastewaters commonly contain sufficient concentrations of carbon, nitrogen,
phosphorus, and trace nutrients to support the growth of microbial culture. Average
domestic wastewater exhibits a surplus of nitrogen and phosphorus with a BOD/N/P ratio
of about 100117/5. If municipal waste contains a large volume of nutrient-deficient
industrial waste, supplemental nitrogen is generally supplied by the addition of anhydrous
ammonia (NH3) or phosphoric acid (H3P04) as is needed (Hammer, 1977).
Biological processing IS the most efficient way of removing orgamc matter from
municipal wastewaters. These living systems rely on mixed microbial cultures to
decompose, and to remove colloidal and dissolved organic substances from solution. The
treatment chamber holding the microoganisms provides a controlled environment; for
example, activated sludge is supplied with sufficient oxygen to maintain an aerobic
condition. Wastewater contains the biological food, growth nutrients, and innoculum of
microoganisms. The most important factors affecting biological growth are temperature,
availability of nutrients, oxygen supply and pH. The rate of biological activity doubles
for every 10 to 15°C temperature rise with the range of 5 to 35°C. This higher
temperature range is not used in waste treatment, since it is difficult to maintain such a
high operating temperature, and because thermophilic bacteria are more sensitive to small
temperature changes (Needham and Needham, 1962).
Diffused and mechanical aeration basins must supply sufficient air to maintain dissolved
oxygen for the biota to use in metabolizing the waste organics. Rate of microbial activity
is independent of dissolved oxygen concentration above a minimum critical value, below
which the rate is reduced by the limitation of oxygen required for respiration. The exact
minimum depends on the type of activated sludge process and the characteristics of the
wastewater being treated (Hammer, 1977).
Hydrogen ion concentration has a direct influence on the biological treatment systems
which operate best in a neutral environment. The general range of operation of aeration
4
IIIIIIIIIIIIIIIIIIIII
systems is between pH 6.5 and 8.5. Above this range microbial activity is inhibited, and
below pH 6.5 fungi are favoured over bacteria in the competition for metabolizing the
waste organics. Normally the bicarbonate buffer capacity of wastewater is sufficient to
prevent acidity and reduced pH; while carbon dioxide production by the microorganisms
tends to control the alkalinity of high pH wastewaters (McKinney, 1962).
1.2.1 Population Dynamics
Three of the major factors in population dynamics are: competition for the same food,
predator-prey relationship, and symbiotic association. When organic matter is fed to a
mixed population of microoganisms, competition arises for this food, and primary feeders
that are most competitive become dominant. Under normal operating conditions, bacteria
are primary feeders in both aerobic and anaerobic operations. Protozoa consuming
bacteria is the common predator-prey relationship in activated sludge (Clark et al., 1977).
In an activated sludge process, waste organics serve as food for the bacteria and the small
population of fungi that might be present. Some of the bacteria die and lyse, releasing
their contents which are resynthesized by other bacteria. The secondary feeders
(protozoa) consume several thousand bacteria for a single reproduction. The benefit of
this predator-prey action is twofold, firstly removal of bacteria stimulates further bacterial
growth, accelerating metabolisms of organic matter, and secondly settling characteristics
of the biological floc is improved by reducing the number of free bacteria in solution.
(Fig. 1.2) (Hammer, 1977).
5
IIIIIIIIIIIIIIIIIIIII
Wastewaterorganicmatter
(Influent)
(a)
(b)
New bacterialgrowth
Nonsettleablebiological growthsand inorganicnutrients, NH3, P04,
CO2 (Effluent)Bacterial Protozoa
Settled and recycle biological floc
Waste sludge todisposal
Food
(Effluent)
Unused food
(Influent)
Return microorganismsExcess M
.....(Waste)
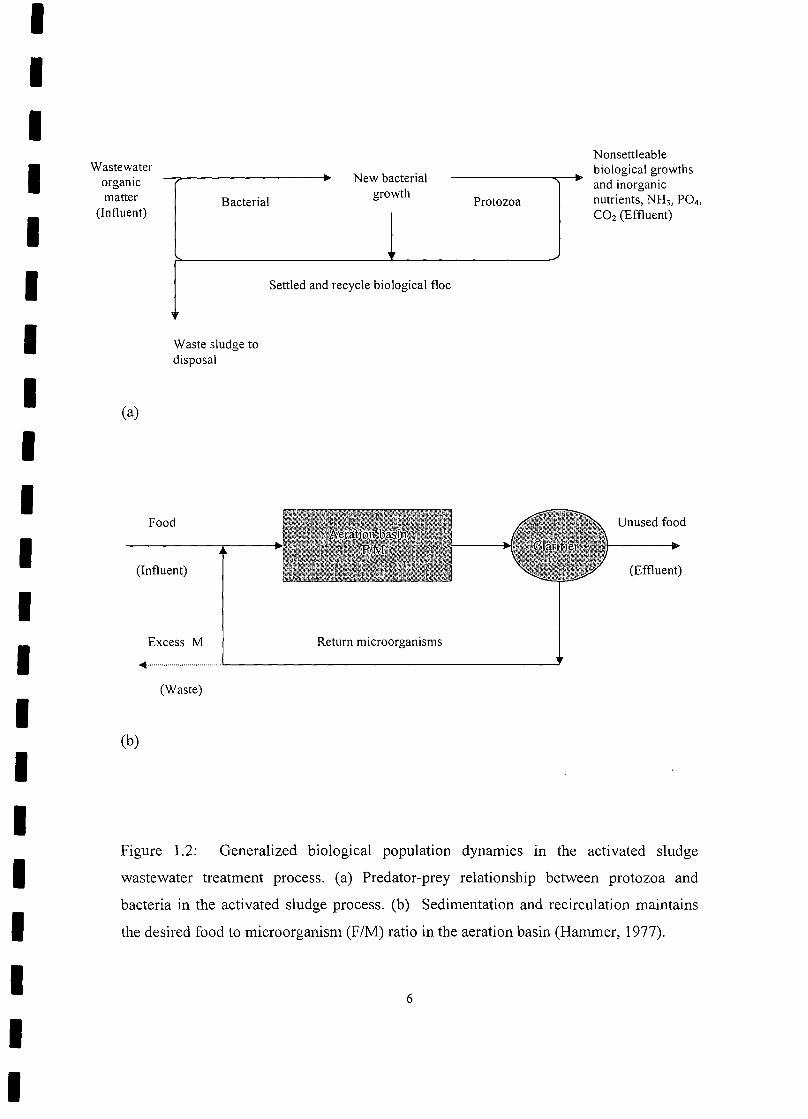
Figure 1.2: Generalized biological population dynamics in the activated sludge
wastewater treatment process. (a) Predator-prey relationship between protozoa and
bacteria in the activated sludge process. (b) Sedimentation and recirculation maintains
the desired food to microorganism (F/M) ratio in the aeration basin (Hammer, 1977).
6
IIIIIIIIIIIIIIIIIIIII
Control of microbial populations is essential for the efficient aerobic treatment. If
wastewater were simply aerated, the liquid detention times would be intolerably long,
requiring a time period of about five days at 20DC for 70 percent reduction. However,
extraction of organic matter is possible within a few hours of aeration provided that a
large number of microorganisms are mixed with the wastewater. In practice this is
achieved by settling the microorganisms out of solution in a final clarifier and returning
them to the aeration tank to metabolize additional waste organics. The effluent from the
process consists of nonsettleable organic matter and dissolved organic salts (Fig. 1.2)
(Hammer, 1977).
Good settling characteristics occur when activated sludge is held in the endogenous
(starvation) phase. Furthermore, a large population of under fed biota removes BOD very
rapidly from solution. Excess microorganisms are wasted from the process to maintain
proper balance between food supply and biological mass in the aeration tank. This
balance is referred to as food-to-microorganism ratio (F/M) which is normally expressed
in units of grams of BOD applied per day per gram of MLSS in the aeration basin.
Operation at a high F/M ratio results in incomplete metabolism of the organic matter,
poor settling characteristics of the biological floc and consequently poor BOD removal
efficiency. At low F/M ratios, the mass of organisms are in near starvation condition that
results in a high degree of organic matter removal, good settleability of the activated
sludge and efficient BOD removal (Hawkes, 1963; Hammer, 1977).
1.3 Activated Sludge Process
Since its development by Ardern and Lockett in 1914, the activated sludge system has
gained increasing importance in the treatment of municipal wastewaters. This is a
consequence of its adaptability to variation in wastewater composition, high rates of
removal of organic material and ability to remove nutrients nitrogen (N) and phosphorus
(P) to low levels without chemical addition (Casey et al., 1995).
7
IIIIIIIIIIIIIIIIIIIII
Its initial development as an aerobic process was a consequence of its greater economy
and surety of effluent quality than the trickling filter, especially with regard to
nitrification. Barnard introduced significant developments in the activated sludge system
in 1973 and 1975. By incorporating anoxic and anaerobic zones he demonstrated that a
high percentage of the influent Nand P could be removed by biological mechanisms in
the system without the aid of chemical addition (Wentzel et al., 1992). It was later
demonstrated that through the imposition of specific environmental conditions and
substrate supply, the growth of certain species could be promoted so as to fulfill some
desired function. Examples are:
• With a sufficiently long aerobic sludge age, nitrifying organisms develop and
produce an effluent low in ammonia
• With the appropriate sludge age, and a sequence of in-series reactors operating in
anaerobic, anoxic and aerobic states, with inter-reactor recycles, different species
of microorganisms develop that
• Nitrifiy;
• Denitrify; and
• Store phosphorus In excess of their metabolic requirements (WRC,1984;
Casey et al., 1995)
By these means the eutrophic elements, Nand P, are removed from the wastewater
biologically.
1.3.1 Biological Nutrient Removal System Configurations
It is not always possible to achieve complete biological nitrogen and phosphorus
removal. However, to achieve biological nutrient removal (BNR) of nitrogen and
phosphorus, the process must incorporate an anaerobic zone, an anoxic zone and an
aerobic zone (Lilly et al., 1997).
8
IIIIIIIIIIIIIIIIIIIII
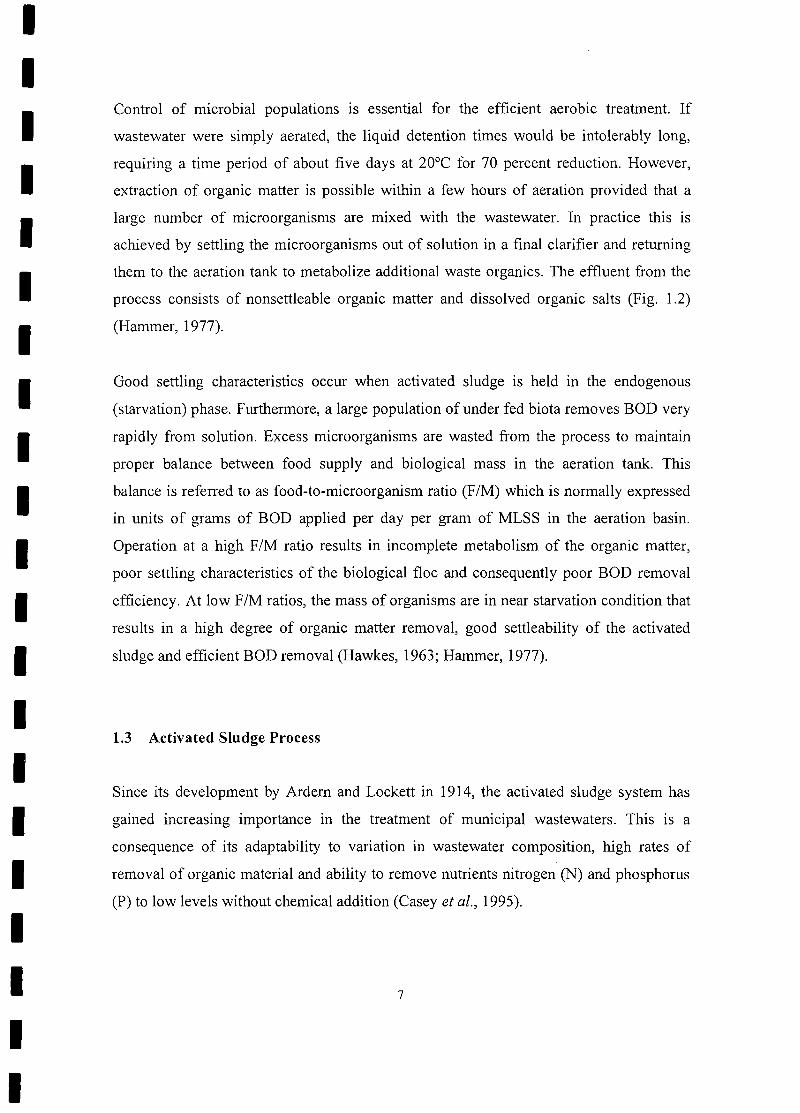
A number of mainstream removal streams have evolved in South Africa over the years.
For the purpose of this investigation three common wastewater treatment processes for
nitrogen removal will be discussed. These include Wuhrmann process (Fig. l.3),
modified Ludzack-Ettinger process (detailed in chapter 3) and Bardenpho process (Fig.
1.4). However other systems such as the phoredox process, 3-stage phoredox process,
UCT process, modified UCT process and Johannesburg process were designed to
incorporate both P and N removal. These systems, however, are beyond the scope of this
study and will not be discussed further (Lilley et al., 1997).
AerobicReactor Anoxic
ReactorWaste Flow
Influent
Settler
Effluent
Sludge Recycle s
Figure 1.3: The Wuhrmann process for nitrogen removal (Lilley et al., 1997).
The Wuhrmann process comprises an aerobic zone followed by an anoxic zone. The
influent is discharged directly into the aerobic zone in which nitrification takes place. The
flow is then discharged to the anoxic zone. The underflow from the clarifier (s-recycle) is
returned to the aerobic zone. The substrate source for denitrification in the anoxic is
obtained from death of organisms. However, the release rate of substrate is very low.
This unfortunately leads to large anoxic zones and small aerobic zones. Theoretically,
complete denitrification could be achieved. However, this is not practically possible
because the anoxic zone would have to be very large due to the slow denitrification rate
which may lead to a loss of nitrification (WRC, 1984; Lilley et al., 1997).
9
IIIIIIIIIIIIIIIIIIIII
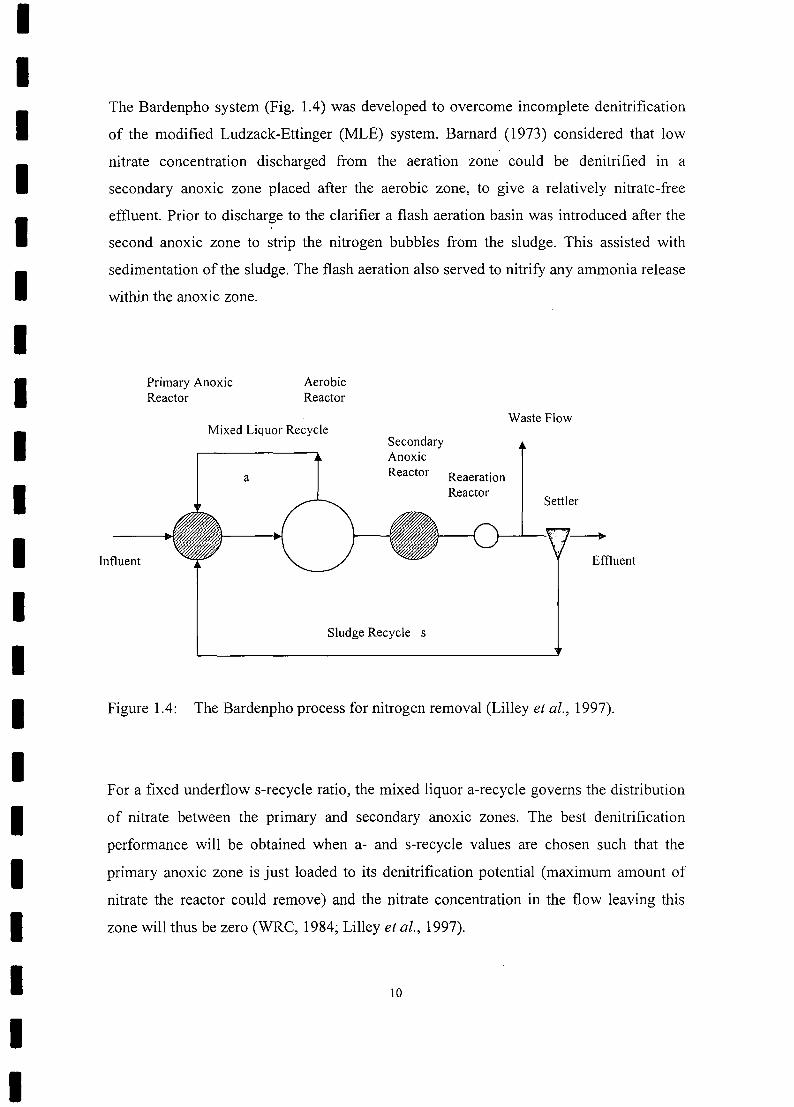
The Bardenpho system (Fig. 1.4) was developed to overcome incomplete denitrification
of the modified Ludzack-Ettinger (MLE) system. Barnard (1973) considered that low
nitrate concentration discharged from the aeration zone could be denitrified in a
secondary anoxic zone placed after the aerobic zone, to give a relatively nitrate-free
effluent. Prior to discharge to the clarifier a flash aeration basin was introduced after the
second anoxic zone to strip the nitrogen bubbles from the sludge. This assisted with
sedimentation of the sludge. The flash aeration also served to nitrify any ammonia release
within the anoxic zone.
Primary AnoxicReactor
AerobicReactor
Waste FlowMixed Liquor Recycle
a
SecondaryAnoxicReactor Reaeration
Reactor
Influent
Sludge Recycle s
Figure 1.4: The Bardenpho process for nitrogen removal (Lilley et al., 1997).
For a fixed underflow s-recycle ratio, the mixed liquor a-recycle governs the distribution
of nitrate between the primary and secondary anoxic zones. The best denitrification
performance will be obtained when a- and s-recycle values are chosen such that the
primary anoxic zone is just loaded to its denitrification potential (maximum amount of
nitrate the reactor could remove) and the nitrate concentration in the flow leaving this
zone will thus be zero (WRC, 1984; Lilley et al., 1997).
10
IIIIIIIII
The balance of nitrate generated in the aerobic zone (and not recycled to the primary
anoxic zone) flows to the secondary anoxic zone. If this load of nitrate to the secondary
anoxic zone is less than the denitrification potential of this zone then complete
denitrification will be achieved. In practice the Bardenpho system for nitrogen removal is
appropriate if the calculated effluent nitrate concentration is greater than S to 7 mgN/L
(which is usually the case for TKN/eoDratios> 0.1 mg N/mg COD) then the MLE process
is better suited for higher nitrogen removal efficiency (Table 1.2) (Lilley et al., 1997).
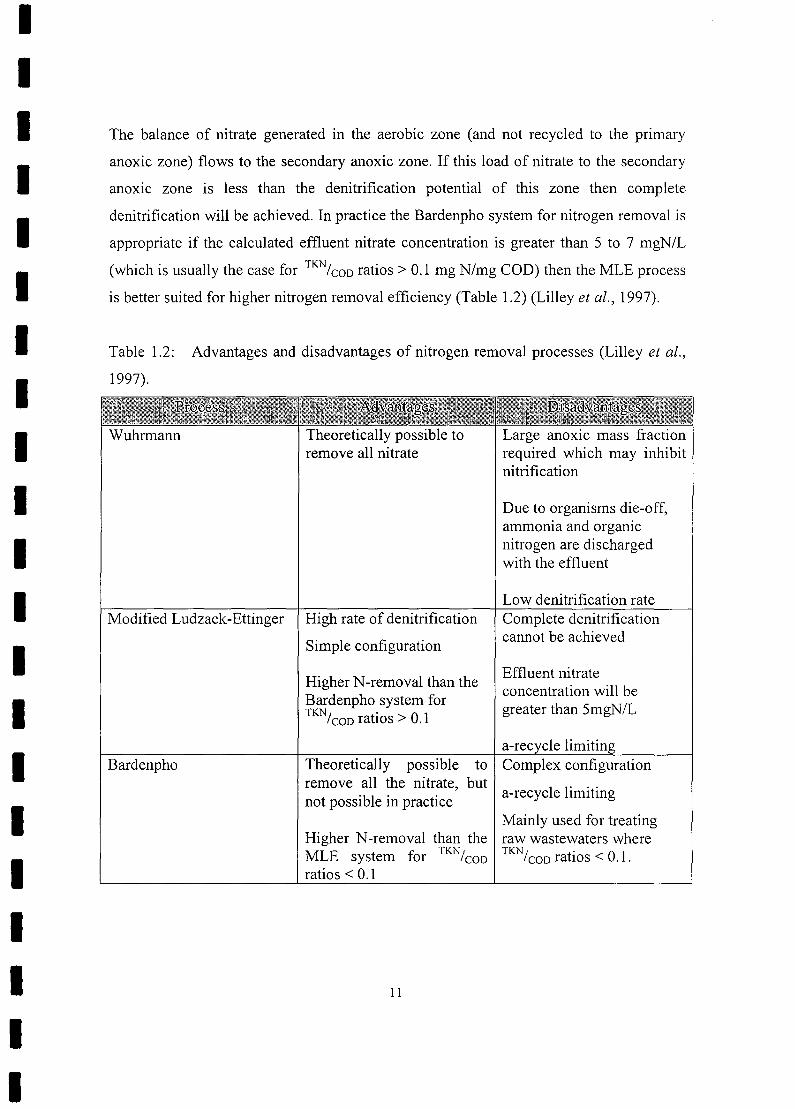
Table 1.2: Advantages and disadvantages of nitrogen removal processes (Lilley et al.,
1997).
IIII
Wuhrmann Theoretically possible toremove all nitrate
Large anoxic mass fractionrequired which may inhibitnitrification
Due to organisms die-off,ammonia and organicnitrogen are dischargedwith the effluent
Low denitrification rate
I
Modified Ludzack-Ettinger High rate of denitrification
Simple configuration
Higher N-removal than theBardenpho system forTKNI . 0 1COD ranos > .
Complete denitrificationcannot be achieved
Effluent nitrateconcentration will begreater than SmgN/L
a-re
III
Bardenpho Theoretically possible toremove all the nitrate, butnot possible in practice
Higher N-removal than theMLE system for TKN/eoDratios < 0.1
Complex configuration
a-recycle limiting
Mainly used for treatingraw wastewaters whereTKNleoD ratios < 0.1.
IIII
11
IIIIIIIIIIIIIIIIIIIII
1.4 Active Biomass
In wastewater treatment, it is the bacteria that are primarily responsible for the oxidation
of organic matter. However, fungi, algae, protozoans (collectively known as Protista),
and higher organisms all have important secondary roles in the transformation of soluble
and colloidal organic matter into biomass. In order to function properly the
microorganisms involved in wastewater treatment require a source of energy and carbon
for the synthesis of new cells as well as other nutrients and trace elements. The
microorganisms are classified as either heterotrophic or autotrophic according to their
source of nutrients. Heterotrophs require organic matter both for energy and as a carbon
source for the synthesis of new microoganisms, whereas autotrophs do not utilize organic
matter but oxidize inorganic compounds for energy and use carbon dioxide as a carbon
source (Hammer, 1977).
In a bioreactor of a non-nitrifying aerobic activated sludge system the mixed liquor
organic suspended solids (MLOSS) is made up of three components;
• Heterotrophic active biomass
• Endogenous residue and
• Inert material (Wentzel et al., 1998)
In the nitrifying aerobic and anoxic/aerobic activated sludge systems, a fourth component
is included;
• Autotrophic active biomass
All four MLOSS components settle out in the secondary settling tank and are returned to
the bioreactor via the underflow recycle and leave the system via the wasteflow (Wentzel
et al., 1998).
Historically the MLOSS has been measured as a lumped parameter using the VSS and
COD tests (Standard Methods, 1985). Specific rates for the biological processes (e.g
denitrification; oxygen utilization) often are expressed in terms of this lumped parameter.
Only a part of the MLOSS is heterotrophic active biomass (XH), the active fraction, and
only this part mediates the biological process of COD removal and denitrification.
12
IIIIIIIIIIIIIIIIIIIII
Accordingly, the specific rates for these biological processes should be expressed in
terms of XH to allow meaningful comparison of rates measured in different systems. The
proliferation of kinetic simulation computer programs that invariable includes XH as a
parameter has become widely accepted. However XH exist only hypothetically within the
structure of the design procedures and kinetic models (Wentzel et al., 1998).
Wentzel et al., (1998) used a simple batch test procedure to quantify the heterotrophic
active biomass concentration of mixed liquor drawn from a well-defined parent
anoxic/aerobic activated sludge system operated at 12 day and 20 day sludge ages. With
the parent system at 12 day sludge age there was a close agreement between the
measured and theoretical values. However with the parent system at 20 day sludge age
the agreement was poor, with the theoretical values been about 2 times those measured.
No explanation could be found for this inconsistency.
Novel microbiological and molecular techniques have been proposed such as ATP
analysis (Nelson and Lawrence, 1980), DNA analysis ( Muyzer et al., 1993; Liebeskind
and Dohmann, 1994) and using florescent probes for ribosomal RNA (Wagner et al.,
1997). With the development and the integration of these techniques to the design and
kinetic modeling theory, it makes it possible to directly quantify the key microbial groups
active within the BNR process with a view to improving the process description and
design (Rittmann et al., 1999).
1.5 Microbial Community Analysis
The activated sludge treatment process uses undefined populations of bacteria to treat a
variety of wastes. The conditions in a reactor are manipulated to promote the presence
and activity of desirable organisms, such as ammonia oxidizers, and to discourage the
growth of undesirable organisms such as the bacteria associated with foaming. The
design and maintenance of such systems is, in effect, the engineering the bacterial
population and its activities (Curtis and Craine, 1998)
13
IIIIIIIIIIIIIIIIIIIII
Unfortunately, it is difficult to engineer something that cannot be measured.
Consequently, the explicit engineering of bacterial populations has been impeded by the
crude, labour intensive and inadequate nature of the tools available to quantify and
identify bacteria: suspended solids measurements (MLOSS), morphological examination
and culture (Bitton, 1995).
However, progress has been made recently with the advent of 16S RNA based
technology, in particular: whole cell hybridization (Amman et al., 1995), the polymerase
chain reaction (PCR) and denaturing gradient gel electrophoresis (DGGE) (Muyzer et al.,
1993). These techniques exploit differences between the ribosomal gene sequence of
different organisms. In whole cell hybridization, individual bacteria can be identified and
enumerated using fluorescent probes targeted at specific signature sequences in ribosomal
RNA.
DGGE allows away of comparing rDNA sequences by separating them into discrete
bands based on their sequence. In DGGE the double stranded DNA products undergo
electrophoresis through a polyacrylamide gel containing an increasing linear gradient of
denaturants. Strand separation occurs when a sufficiently high denaturant concentration is
reached. The sequence of PCR product determines the denaturant concentration at which
this occurs (Muyzer et al., 1993; Myers et al., 1987). A ladder of bands, each
corresponding to the individual PCR products of a specific sequence is thus produced
from analysis of a complex microbial population. The electrophoresis gels can be probed
with diagnostic oligonucleotides to identify particular sequences (Muyzer et al., 1995) or
bands can be excised, reamplified and sequenced (Ferris et al., 1996). To enhance the
resolution of the process a GC rich sequence can be incorporated into one of the primers
to modify the melting behavior of the fragment and allow the majority of sequence
variation to be detected in the denaturing gel (Muyzer et al., 1993).
Ferris and Ward (1997) used DGGE analysis to evaluate seasonal distributions of
Octopus Spring microbial mat populations defined by 16S rRNA sequences along a
14
IIIIIIIIIIIIIIIIIIIII
thermal gradient. No shift in the thermal gradient was detected, and populations at
spatially or temperature-defined sites exhibited only slight changes over the annual
sampling period.
Curtis and Craine (1998) used DGGE analysis to compare spatial and temporal
differences within activated sludge plants and thus defined a sampling strategy for 16S
RNA based comparisons of diversity. This strategy was used to compare a variety of
activated sludge plants.
1.6 Aims and Objectives
• Operation of parent laboratory scale Modified Ludzack Ettinger (MLE)
anoxic/aerobic activated sludge system
• To obtain initial and final profiles of microbial community using DGGE at defined
SolXo ratios during activated sludge respirometric batch assays
• Comparison of initial and final DGGE profiles to determine a SolXo ratio where
change in the composition of microbial community is minimal
15
IIIIIIIIIIIIIIIIIIIII
CHAPTER 2
Literature Review
2.1 Biochemistry of Heterotrophic Respiratory Metabolism
Metabolism can be broadly described as the manner by which facultative heterotrophic
organisms derive energy and matter for growth. It consists of two processes:
e The enzymatic biosynthesis of the complex molecular components of the organism
itself (anabolism)
8 The enzymatic bio-reactions which generate energy to perform this biosynthesis
(catabolism)
The process of catabolism is referred to as respiratory metabolism. In catabolism,
complex organic compounds (substrate) are enzymatically degraded such that some of
its electrons originally present in the organic compound (called the electron donor) are
removed (oxidation) and transferred through a sequence of controlled biochemical
reactions to a final compound (called a terminal electron acceptor). In this sequence of
biochemical reactions there is a release of chemical energy, some of which is conserved
through the formation of energy-rich molecule ATP (Casey et al., 1999)
The principle objective of the catabolic process is the formation of ATP and without
electron donors and acceptors this is not possible. The ATP produced by the catabolic
process is utilized by the organism in the anabolic process for the synthesis of new cell
material and in maintenance of cell function and structure. Facultative heterotrophic
organisms could more appropriately be named chemo-heterotrophs as a consequence of
their derivation of energy (catabolism) from the break down of organic compounds and
their derivation of the principal source of carbon for cell synthesis (anabolism) from the
same organic compounds (heterotrophs). The term facultative refers to their ability to
switch between available terminal electron acceptors in response to their environmental
conditions; oxygen (02) under aerobic conditions, and nitrate (N03) and/or nitrite (N02)
16
IIIIIIIIIIIIIIIIIIIII
under anOXIC conditions (Casey et al., 1999). This study is limited to facultative
heterotrophic organisms since these are the organisms likely to be present under the
cyclic anoxic-aerobic conditions found in a parent laboratory scale anoxic/aerobic
activated sludge system.
2.1.1 Stages of Respiratory Metabolism
The process of respiratory metabolism by heterotrophic organisms wherein organic
substrates, such as carbohydrate, protein and lipids, are oxidized to end products of H20
and CO2 can be divided into four stages and conceptualized as illustrated in Fig. 2.1. In
Stage I, large complex organic molecules are hydrolysed to simpler ones; carbohydrates
to hexoses and pentoses, proteins to amino acids, and lipids to fatty acids and glycerol.
In Stage II, the endproducts of Stage I are degraded further, resulting in the formation of
acetyl-coenzyme A (acetyl-CoA) and carbon dioxide. For the degradation of each group
of Stage I endproducts, i.e. amino acids, hexoses/pentoses, and fatty acids/glycerol,
different biochemical pathways are employed.
In Stage III, the endproduct from Stage II, acetyl-CoA, enters the TCA cycle, a cyclic
sequence of reactions catalysed by a series of enzymes. During the cycle, the acetyl
group of acetyl-CoA is oxidized to form two molecules of CO2, eight protons (H+), and
four pairs of electrons (e) and one molecule of GTP which is energetically equivalent to
one ATP; Coenzyme A is recovered. The TCA cycle is the final catabolic pathway
common to all aerobic and facultative organisms. It can be conceptualized as the
mechanism by which all the foregoing substrates (in the form of acetyl-CoA) are
converted to common products, i.e. electrons and protons, in the form of reduced NADH
and reduced FADH2.
17
IIII
PROTEINS CARBOHYDRATES I LIPIDS
STAGE I
Amino acids Hexoses, Fatty acidsPentoses glycerolFructoses
III
Pyruvate
II
NAD
STAGE II NADH + H+ + CO,
Acetyl Co-A
I Electron flow
TricarboxylicAcid cycle
Product flow
ISTAGE III
III
OxidativePhosphorylation
.'.. OxidativePhosphorylation
ADP+ P;
(Anoxic)
N02-IN03-
I
O2\~-
(Aerobic) l~..,
~
ADP+ P;
I STAGE IV ATP
ATP
II
Figure 2.1: Stagewise division of substrate breakdown by facultative heterotrophic
organisms indicating the major metabolic pathways (Lehninger, 1975)
I 18
II
IIIIIIIIIIIIIIIIIIIII
In Stage IV, the electrons and protons associated with NADH and FADH2 are removed
and transferred along a pathway of electron and proton carrier enzymes of successively
lower energy (Electron Transport Pathway) to a final (terminal) electron acceptor. During
the process, much of the free energy of the electrons is conserved in the form of the
energy-rich molecule ATP in a process termed oxidative phosphorylation. Under aerobic
conditions, the electrons and protons are transferred to the final electron acceptor O2
(with the formation of H20) and under anoxic conditions; electrons and protons are
transferred to nitrate (N03-) and/or nitrite (N02-) (with the formation of H20 and N2).
With N03- or N02- as external terminal electron acceptors, the gaseous products nitric
oxide (NO) and nitrous oxide (N20) are produced intracellularly; these gaseous nitrogen
oxides act as intermediate electron acceptors during the formation of dinitrogen (N2)
(Casey et al., 1999; Lehninger, 1975)
2.1.2 Aerobic Respiration
The respiratory enzyme complexes involved in the transfer of electrons and protons from
NADH and FADH2 to the terminal electron acceptor oxygen are shown in Fig. 2.2. The
complexes shown in Fig. 2.2 are the complexes synthesized under aerobic conditions.
These are, NADH dehydrogenase, ubiquinone (Q), cytochrome bCI, cytochrome C and the
two oxidases, cytochromes aa, and o. These complexes are considered as proton
pumping energy conserving sites, i.e. sites at which protons are pumped from the
cytoplasmic (inner) to the periplasmic (outer) side of the membrane, this being the first
step of the mechanism which links the processes of respiration (transfer of electrons to
oxygen) and oxidative phosphorylation (the production of the high energy molecule,
ATP, from low energy molecule, ADP). Usually the Electron Transport Pathways (ETPs)
to cytochrome 0 and cytochrome aas. Cytochrome aa, and cytochrome 0 are referred to
as the primary and alternative oxidases, respectively (Casey et al., 1999; Lehninger,
1975).
19
IIII PERIPLASM
CYTOPLASMICMEMBRANE CYTOPLASM
II
NADH + WNAD+ .
FADH2
FAD
II i[ NaR
NiR
Cyt c
I NOR
I
2.-I
II Figure 2.2: Electron Transport Pathway (ETP) for a typical facultative aerobic
heterotrophic organism grown under aerobic conditions (Casey et al., 1999)
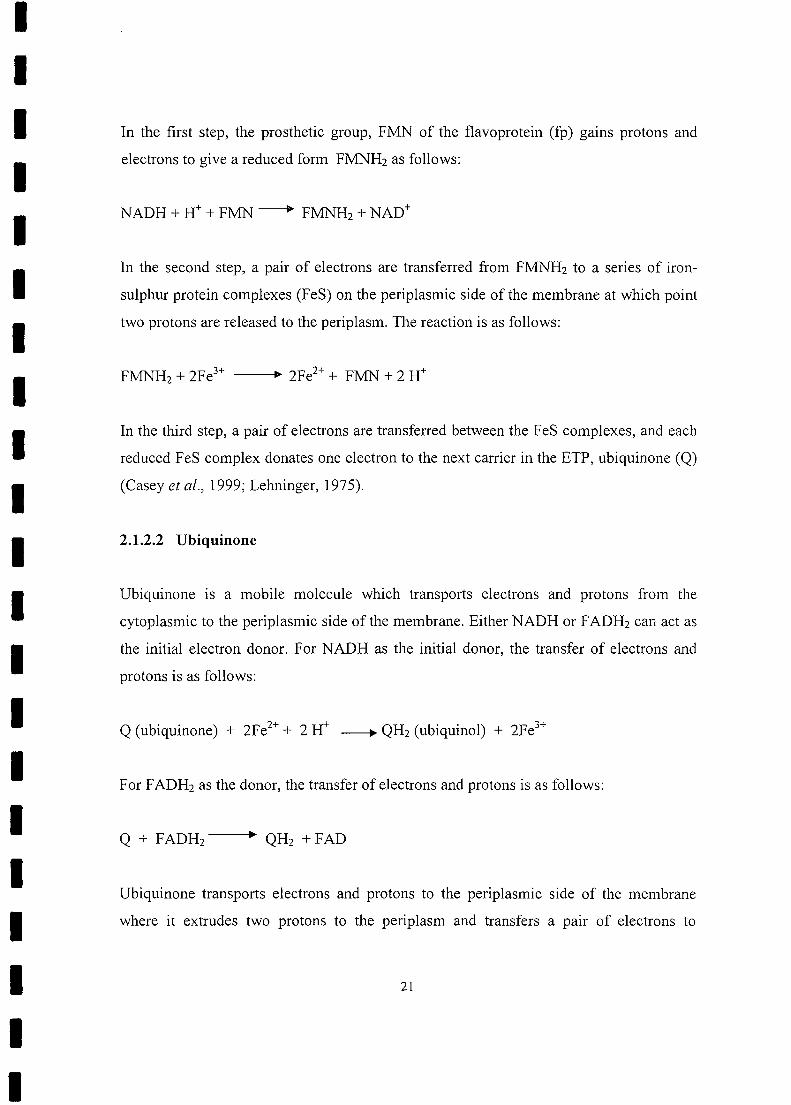
I2.1.2.1 NADH dehydrogenase enzyme complex
II
The NADH dehydrogenase enzyme complex consists of polypeptide chains collectively
referred to as flavoprotein (Fp) and a series of iron-sulphur protein complexes (FeS).
Flavoprotein contains a prosthetic group called flavin mononucleotide (FMN) or flavin
which acts as the electron and proton transferring site of complex. The NADH
dehydrogenase complex catalyses the transfer of two protons and a pair of electrons from
NADH to ubiquinone in three steps.
III 20
II
IIIIIIIIIIIIIIIIIIIII
In the first step, the prosthetic group, FMN of the flavoprotein (fp) gains protons and
electrons to give a reduced form FMNH2 as follows:
In the second step, a pair of electrons are transferred from FMNH2 to a series of iron-
sulphur protein complexes (FeS) on the periplasmic side of the membrane at which point
two protons are released to the periplasm. The reaction is as follows:
-- .. 2Fe2++ FMN + 2 H+
In the third step, a pair of electrons are transferred between the FeS complexes, and each
reduced FeS complex donates one electron to the next carrier in the ETP, ubiquinone (Q)
(Casey etal., 1999; Lehninger, 1975).
2.1.2.2 Ubiquinone
Ubiquinone is a mobile molecule which transports electrons and protons from the
cytoplasmic to the periplasmic side of the membrane. Either NADH or FADH2 can act as
the initial electron donor. For NADH as the initial donor, the transfer of electrons and
protons is as follows:
Q (ubiquinone) + 2Fe2++ 2 H+ _____.QH2 (ubiquinol) + 2Fe3+
For FADH2 as the donor, the transfer of electrons and protons is as follows:
Q + FADH2 QH2 + FAD
Ubiquinone transports electrons and protons to the peri plasmic side of the membrane
where it extrudes two protons to the periplasm and transfers a pair of electrons to
21
IIIIIIIIIIIIIIIIIIIII
cytochrome b contained in the second of the main respiratory complexes, the cytochrome
bel complex is as follows (Casey et al., 1999; Lehninger, 1975):
2.1.2.3 Cytochrome bCI complex
An important characteristic of cytochromes in general is that they are able to transfer
electrons only, unlike NADH, NADH dehydrogenase, FADH2 and ubiquinone, which
transport both electrons and protons. The cytochrome bel complex contains two
sequential electron transporting proteins, cytochrome b and cytochrome e). The
cytochromes of the cyt bel complex are intermediates in the transfer of electrons from
ubiquinol to cytochrome e, the next complex in the pathway. Cytochromes are electron
transporting proteins which contain iron in a prosthetic group and are referred to as haem
proteins (Casey et al., 1999)
2.1.2.4 Cytochrome c complex
The cytochrome c complex accepts electrons from cytochrome e) of the cytochrome be)
complex and transfers them to the terminal electron transferring complex for aerobic
respiration, the cytochrome oxidase complex, cytochrome aa, (Casey et al., 1999)
2.1.2.5 Cytochrome oxidase complex
The terminal cytochrome complex in the aerobic ETP, the cytochrome oxidase
complexes (cytochrome aa, and 0), transfer electrons to the terminal electron acceptor,
oxygen. For obligate aerobic heterotrophic organisms, the aerobic cytochromes in the
ETP to oxygen are contained in the cytochrome aa, complex (Poole, 1982). For
facultative denitrifying organisms, an additional cytochrome oxidase complex,
cytochrome 0 is present (Willison and John, 1979). It has been found that for facultative
organisms maintained under anoxic conditions, three to four times more cytochrome 0 is
22
IIIIIIIIIIIIIIIIIIIII
synthesized than when the same facultative orgamsms are maintained under aerobic
conditions (Sapshead and Wimpenny, 1972).
The cytochrome aa, complex contains four electron transferring metal centres; two iron
and two copper. Iron atoms are contained in each of cytochrome a and a3 and alternate
between a reduced ferrous (+2) state and an oxidized ferric (+3) state during electron
transport. Copper atoms are also contained in each of cytochromes a and a3 and also
mediate electron transport and alternate between a reduced (+ 1) state and an oxidized
(+2) state (Poole, 1982). The Cytochrome aa, complex is as follows:
cyt a (Fe2+, Cu+) + cyt a3 (Fe2+, Cu+) + O2 + 4H+---+ 2H20 + cyt a (Fe3+, Cu2+) + cyt a3
(Fe3+, Cu2+)
For cytochrome 0 as oxidase, 4 protons from the cytoplasm combine with 1 oxygen
molecule and 2 pairs of electrons (transferred from ubiquinol to cytochrome 0) to form
water as follows (Poole, 1982):
2+ C +) 0 H+ ----+2cyt 0 (Fe , u + 2+ 4
2.1.3 Anoxic respiration
When dissolved oxygen becomes limiting, facultative heterotrophs switch from oxygen
to nitrate/nitrite as terminal electron acceptor and respire anoxically. For nitrate/nitrite as
electron acceptor, the first three stages illustrated in Fig. 2.1 and the greater part of the
fourth stage of the ETP continue functioning unchanged; a difference in electron
transport between aerobic and anoxic respiration becomes apparent only after the
Ubiquinone complex. Figure 2.3 illustrates the respiratory complexes present in a typical
facultative aerobic organism grown under anoxic conditions (Casey et al., 1999).
Organisms can utilise nitrate through two processes, assimilatory nitrogen removal and
dissimilatory nitrogen removal. Assimilatory nitrogen removal is the reduction of nitrate
23
III
to ammonium (NH4+), the ammonium being used for synthesis of cellular material. This
is an anabolic process, is energy consuming, is not associated with the respiratory ETP
and can occur under both aerobic and anoxic conditions.
II PERI PLASM
CYTOPLASMICMEMBRANE CYTOPLASM
I i[FADH2
FAD
II
:::.[~~ 2H .....I ..
a '"« ez-o>-.c:'"a
N03- + 2H+
N02- ~ H20
III . .
: Cyl" :••••• " ._. '0 '0 '0· •••••
I Cyl "3..................
ADP + P;
2H+
IIII
Figure 2.3: Electron transport pathway (ETP) for a typical facultative aerobic
heterotrophic organism grown under anoxic conditions (Casey et al., 1999)
I
Dissimilatory nitrogen reduction is the reduction of nitrate to nitrite, or nitrite to one of
the more reduced gaseous nitrogen oxide compounds, nitric oxide (NO), nitrous oxide
(N20) or dinitrogen (N2). The process whereby nitrate and nitrite act as terminal electron
acceptors during utilization of organic substrate are referred to as nitrate and nitrite
respiration respectively. The term nitrate reduction applies to the reduction of nitrate to
nitrite only. The term denitrification is applied to the reduction of one of the ionicII 24
II
IIIIIIIIIIIIIIIIIIIII
nitrogen oxides (nitrate or nitrite), to one of the gaseous nitrogen compounds, nitric
oxide, nitrous oxide, or dinitrogen. The pathway for denitrification is composed of a
number of sequential steps by which electrons are passed via the ETP to one of the
nitrogen oxides, to produce another more reduced nitrogen oxide (Casey et al., 1999).
The sequential production of the intermediates as indicated by Payne (1973) are as
follows:
Nitrate (N03- aqi+5)_" Nitrite (N02 -aq)(+3) _.. Nitric Oxide (NOg)(+2) -----i>
Nitrous Oxide (N20g)(+1) Dinitrogen (N2giO)
2.1.3.1 Nitrate reductase
Nitrate is reduced to nitrite by nitrate reductase, the catalytic site of which is situated on
the cytoplasmic side of the membrane (Boogerd et al., 1983). In the transfer of electrons
from NADH to nitrate reductase, electrons pass sequentially through the complexes of
NADH dehydrogenase to ubiquinone as described for aerobic respiration. In the process,
the first of the energy conserving (proton-pumping) sites (Site I) is passed. The transfer
of electrons through the NADH dehydrogenase complex is common to reduction of each
of the nitrogen oxide reductases. The electrons then pass from ubiquinol to nitrate
reductase. At the catalytic site of nitrate reductase, 2 electrons are passed to nitrate which
in process takes up 2 protons from the periplasm to form nitrite and water as follows
(Casey et al., 1999):
2.1.3.2 Nitrite reductase
The function of nitrite reductase is to reduce nitrite to nitric oxide. Nitrite reductase
situated on the periplasmic side of the membrane accepts one electron from cytochrome c
and at the catalytic site of the reductase the electron is passed to nitrite, which in the
25
IIIIIIIIIIIIIIIIIIIII
process also takes up 2 protons from the periplasm to form nitric oxide (NO) and water as
follows (Casey et al., 1999):
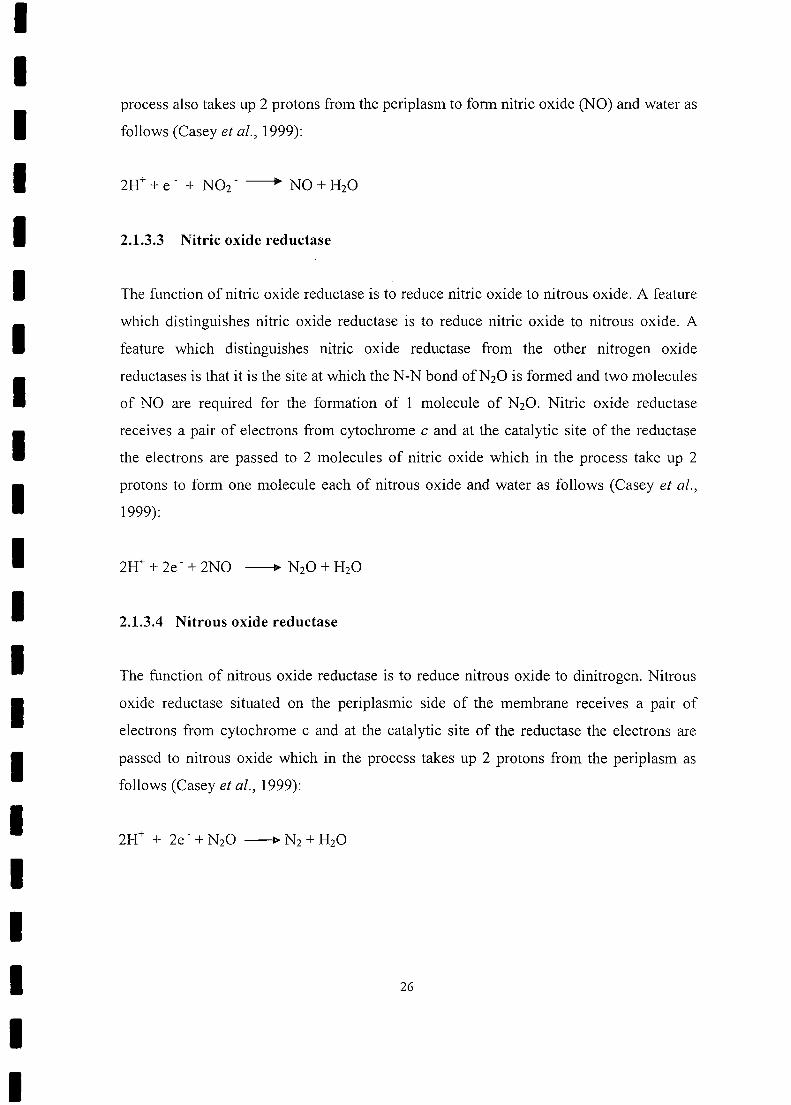
2.1.3.3 Nitric oxide reductase
The function of nitric oxide reductase is to reduce nitric oxide to nitrous oxide. A feature
which distinguishes nitric oxide reductase is to reduce nitric oxide to nitrous oxide. A
feature which distinguishes nitric oxide reductase from the other nitrogen oxide
reductases is that it is the site at which the N-N bond ofN20 is formed and two molecules
of NO are required for the formation of 1 molecule of N20. Nitric oxide reductase
receives a pair of electrons from cytochrome c and at the catalytic site of the reductase
the electrons are passed to 2 molecules of nitric oxide which in the process take up 2
protons to form one molecule each of nitrous oxide and water as follows (Casey et al.,
1999):
2.1.3.4 Nitrous oxide reductase
The function of nitrous oxide reductase is to reduce nitrous oxide to dinitrogen. Nitrous
oxide reductase situated on the periplasmic side of the membrane receives a pair of
electrons from cytochrome c and at the catalytic site of the reductase the electrons are
passed to nitrous oxide which in the process takes up 2 protons from the periplasm as
follows (Casey et al., 1999):
26
IIIIIIIIIIIIIIIIIIIII
2.2 The Development of Molecular Biology
Understanding that DNA contains the blueprint for all life (Avery et al., 1944) led to the
discovery of the structure of the DNA molecule ca. 1953 by Watson and Crick in 1953
and the "cracking of the genetic code" about a decade later (Jacob and Monod, 1961;
Nirenburg and leder, 1964; Khorana, 1966). Manipulative techniques showing that
nucleic acid molecules can be cut into smaller fragments and copied (Smith, 1970;
Southern, 1975; Grunstein and Hogness, 1975) and that its informational content can be
interpreted (Maxam and Gilbert, 1977; Sanger et al., 1977) and controlled (Tacon et al.,
1980; Russel and Bennet, 1981; Amann et al., 1983) has given birth to the field of study
we now call 'recombinant DNA technology'
For most of the history of microbiology, microbiologists have struggled with simplicity
of bacterial morphology and phenotypic characters in an attempt to construct an
evolutionarily valid taxonomy for the prokaryotes (Stackebrandt and Woese, 1981).
Zuckerkandl and Pauling (1965) were among the first to note that molecular sequences
were the best source of evolutionary information. With the advent of nucleic acid
sequencing and phylogenetic inference methods, the way from phenotypic to genotypic
characteristics for evolutionary inference was clear. Ribosomes within biological cells are
the sites of protein synthesis. They are composed of a mixture of nucleic acids (ribosomal
Ribonucleic acids- rRNA) and proteins, and have an average size of 70S in bacteria.
Because of their central role in cell survival, maintenance and reproduction, rRNAs and
their genes are almost universally present in cellular life forms, are functionally
constrained and therefore are described as being evolutionally conserved (Olsen and
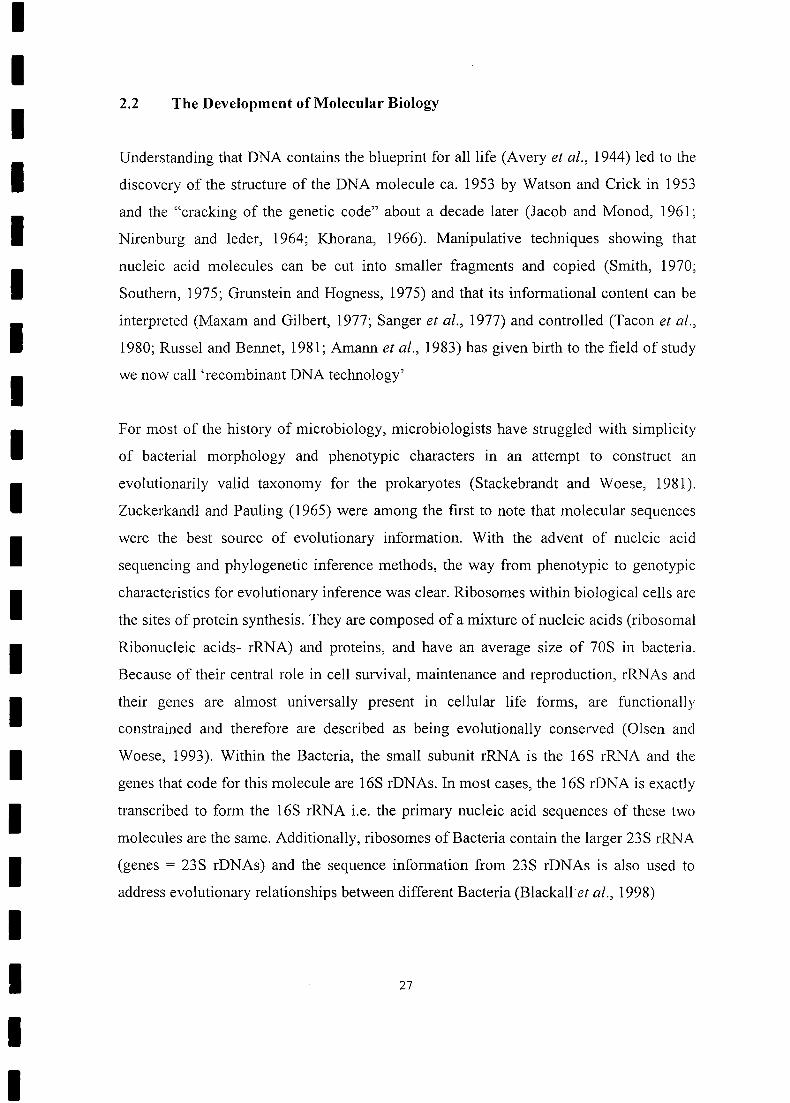
Woese, 1993). Within the Bacteria, the small subunit rRNA is the 16S rRNA and the
genes that code for this molecule are 16S rDNAs. In most cases, the 16S rDNA is exactly
transcribed to form the 16S rRNA i.e. the primary nucleic acid sequences of these two
molecules are the same. Additionally, ribosomes of Bacteria contain the larger 23S rRNA
(genes = 23S rDNAs) and the sequence information from 23S rDNAs is also used to
address evolutionary relationships between different Bacteria (Blackall et al., 1998)
27
IIIIIIIIIIIIIIIIIIIII
2.2.1 The rRNA revolution
16S rRNA was the first molecule examined for studying prokaryotic phylogenies, and
has played a seminal role in evolutionary studies. Between 1965 and the mid-90s, 16S
rRNA has had influence at all levels of bacterial systematics, and was used to
demonstrate the phylogenetic relationship between the eubacteria, eukaryotes and the
archaebacteria. It was demonstrated that eubacterial sequences are far closer to each other
than they are to archae bacteria and also pointed towards a theoretical organism from
which all life has evolved (Woese, 1987). The use of 16S rRNA sequence information
thereby led to a proposal by Woese et al. (1990), stating that there should be a new taxon
called a domain established above the level of kingdom. All life on this planet is therefore
divided into the three domains Bacteria, Archaea and Eucarya (Woese et aI., 1990).
Information from rRNA sequences demonstrated that very little was known about
bacterial phylogeny, and what was known was often wrong. Before rRNA sequencing, it
was believed that bacteria fell into one of two groups - Gram-positive and Gram-
negative. This was an almost truth, where Gram-positive turned out to be a coherent
grouping, but the Gram-negative group consisted of 10 distinct groups each as
distinguishable as the Gram-positive group. Many other groupings previously based on
morphological or otherwise 'behavioural' attributes were also changed. This included the
mycoplasmas, which in lacking a cell wall were segregated, however rRNA sequencing
indicates that they are merely degenerate clostridia. Similarly, the segregation of
autotrophs and heterotrophs, were shown not to be phylogenetically separate groupings
but intermixed with numerous other bacterial phyla. 16S rRNA is particularly useful for
the resolution of the bacteria phylum branching orders, therefore showing the progression
of bacterial evolution (Woese, 1987).
In addition to these major taxonomic resolutions, there are various examples of how 16S
rRNA sequence information has assisted in the resolution of bacterial genera. One of the
best examples of how this information has been applied to such a problem is with the
bacterial order actinomycetes (Blackall et al., 1994).
28

IIIIIIIIIIIIIIIIIIIII
2.2.2 Analysis of rRNA molecules
The first attempts to characterize environmental samples by studying rRNA began about
more than a decade ago. In these studies, 5S rRNA molecules were directly extracted
from mixed samples, the molecules belonging to the different community members were
electrophoretically separated, and a comparative sequence analysis yielded phylogenetic
placements (Lane et ai., 1985; Stahl et ai., 1985; Amann et ai., 1995). These pioneering
studies yielded interesting insights. However, the information content in the
approximately 120-nucleotide 5S rRNA is relatively small, and the requirement for
electrophoretic separation of the different 5S rRNA molecules limited this approach to
less complex ecosystems. Consequently, the use of larger rRNA molecules for studies in
microbial ecology were implemented (Olsen et ai., 1986)
An average bacterial 16S rRNA molecule has a length of 1,500 nucleotides, and 23S
rRNA molecules are around 3,000 nucleotides. When fully or almost fully analyzed
(> 1,000 nucleotides should be determined), both molecules contain sufficient information
for reliable phylogenetic analysis (Amann et ai., 1995).
The principle steps of the proposed procedure were:
o Extraction of total community DNA
o Preparation of shot-gun DNA library in bacteriophage lamda
e Screening by hybridization with a 16S rRNA-specific probe
G Sequence determination from clones containing 16S rRNA genes and
• Comparative analysis of the retrieved sequence
The first thorough application of this approach was the characterization of a marine
picoplankton sample (Schmidt et ai., 1991). Numerous unknown sequences could be
identified in the library. Among those were 15 unique bacterial sequences related to the
cyanobacteria and proteobacteria and one eucaryotic sequence.
With the advent of PCR (Saiki et ai., 1988), a method became available to speed up this
quite laborious procedure. By using PCR, 16S rRNA gene fragments can be selectively
29
IIIIIIIIIIIIIIIIIIIII
amplified from mixed DNA. Gene libraries derived from mixed amplification products
should contain only defined fragments that can be rapidly sequenced from known
priming sites. Giovannoni et al., (1990) was the first to apply this approach in an analysis
of Sargasso Sea picoplankton. Results indicated again the presence of defined clusters of
proteobacterial and cyanobacterial origin.
Finally, there is yet another route to the molecular characterization of natural microbial
communities. With techniques such as denaturant gradient gel electrophoresis, it is
possible to physically separate peR products originating from the amplification of rDNA
fragments from environmental samples. Besides obtaining a characteristic fingerprint for
the examined community, the possibility of isolating less common fragments should
allow their specific retrieval (Muyzer et al., 1995).
Kowalchuk et al., (1997) used denaturing gradient gel electrophoresis of specifically
amplified 16S rRNA gene fragments to analyze the p-subdivision ammonia-oxidizing
populations from coastal sand dune samples. This approach coupled with sequence
analysis allowed the detection of specific groups of p-subdivision ammonia oxidizers and
permitted their presence to be correlated with specific environmental factors.
2.3 Polymerase Chain Reaction
The polymerase chain reaction (ECk) for gene amplification was first introduced by Saiki
and colleagues in 1985. peR quickly and efficiently produces many copies of specific
DNA regions. Standard DNA cloning methods achieve similar results with viral or
plasmid vectors, but with much greater effort. Thus, it is evident that peR will replace or
modify many applications of cloning technology. The main limitations of peR are the
size of the region that can be amplified, and the requirement for some knowledge of the
sequences flanking the 'target' DNA. (Giovannoni,1991).
30
III
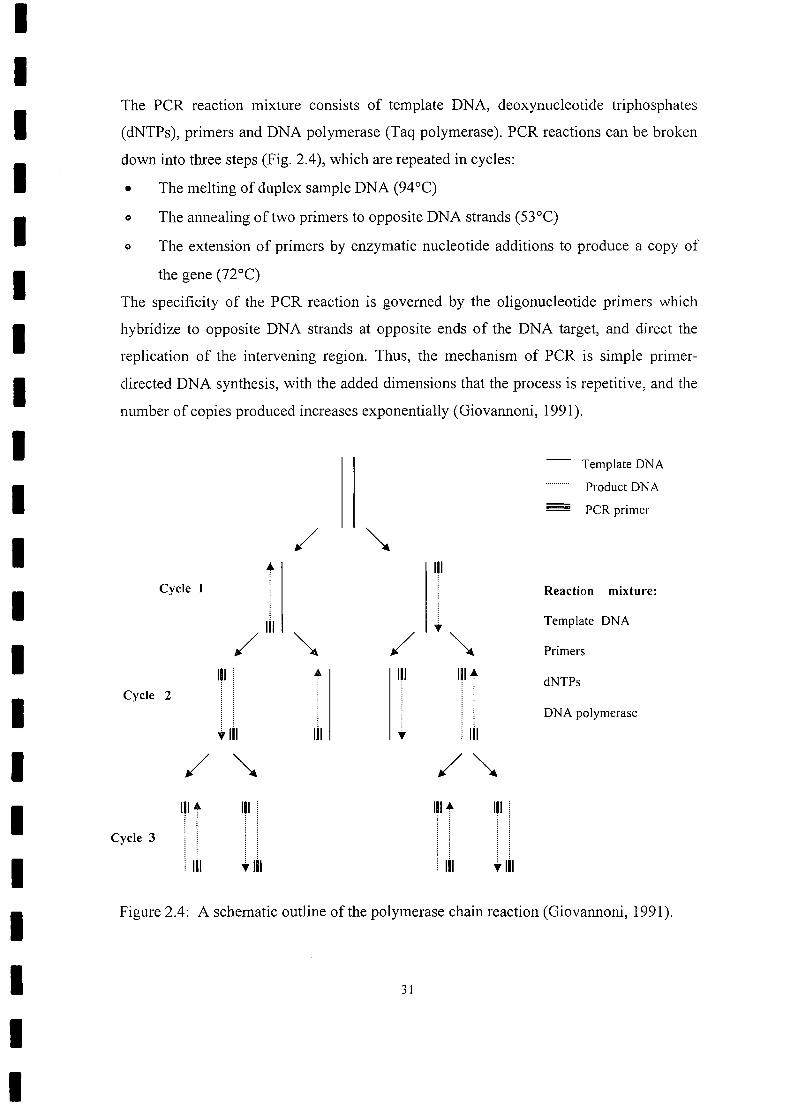
The PCR reaction mixture consists of template DNA, deoxynucleotide triphosphates
(dNTPs), primers and DNA polymerase (Taq polymerase). PCR reactions can be broken
down into three steps (Fig. 2.4), which are repeated in cycles:
• The melting of duplex sample DNA (94°C)
o The annealing of two primers to opposite DNA strands (53°C)
o The extension of primers by enzymatic nucleotide additions to produce a copy of
III the gene (72°C)
The specificity of the PCR reaction is governed by the oligonucleotide primers which
hybridize to opposite DNA strands at opposite ends of the DNA target, and direct the
replication of the intervening region. Thus, the mechanism of PCR is simple primer-
directed DNA synthesis, with the added dimensions that the process is repetitive, and the
number of copies produced increases exponentially (Giovannoni, 1991).
III
I /t
Cycle 1
/ Iii -.III ...
Template DNA
Product DNA
- PCRprimerI
II
Reaction mixture:
/1,1
Template DNA
Primers
ICycle 2
dNTPs
IiiDNA polymerase
IIIII
! III of Iii
III + 1,1
Iii ... Iii
Cycle 3
Figure 2.4: A schematic outline of the polymerase chain reaction (Giovannoni, 1991).
31
II
IIIIIIIIIIIIIIIIIIIII
In theory, with each replication cycle, the number of copies of the DNA target doubles.
Copies of the target DNA are produced according to the equation:
Where x is the number of cycles, No is the starting number of copies, and I is the
efficiency of the reaction expressed as the number of complete target molecules produced
per cycle from each template molecule. In theory, the maximum value for I is 2. An
example will serve to illustrate the remarkable outcome of this process. Starting with a
single copy of 1-Kilobase piece of DNA, after 36 complete cycles of synthesis, 1011
copies, or lOOng, of DNA would be produced (Giovannoni, 1991).
2.3.1 Thermus aquaticus DNA Polymerase
The first PCR experiments used the Klenow fragment of Escherichia coli DNA
polymerase 1 to catalyze the extension of the annealed primers (Saiki et al., 1985). The
Klenow fragment is irreversibly denatured at 94°C. After each denaturing step fresh
enzyme was added to the reaction. The process was tedious and prone to errors. The
substitution of the thermostable DNA polymerase isolated from Thermus aquaticus (Taq
polymerase; Chen et al., 1976) circumvented these problems (Saiki et al., 1988). In
addition, the primer elongation step of the reaction could be run at higher temperatures,
improving specificity. The result was a greatly simplified procedure that increased the
yield, sensitivity, and the length of products that could be amplified.
Thermus aquaticus is a thermophilic eubacterium that can routinely be isolated from
hot springs and household water heaters. Innis and colleagues (1988) studied the
enzymology of the T aquaticus DNA polymerase. Taq DNA polymerase exhibits an
unusually high optimal processing activity, 8000 bases per minute at 75°C, and
significant extension rates at much lower temperatures: 90 bases per a minute at 37°C
32
IIIIIIIIIIIIIIIIIIIII
and 15 bases per a minute at 22°C. Taq polymerase does not possess a 3' exonuclease
activity, which may in part explain the high processing rate of the enzyme (Giovannoni,
1991).
2.3.2 The Design of Amplification Primers
PCR amplification primers are simply pairs of hybridization probes that must act in
concert. Each probe must be relatively specific for its binding site. If one or both of the
primers fails to hybridize, there will be no PCR products. If the primers hybridize non-
specifically, which is often the case with degenerate primers when used at conditions of
low hybridization stringency, then non-specific amplifications will occur (Giovannoni,
1991).
Usually PCR primers are synthetic DNA molecules 20-30 bases in length. In theory, any
specific 20-base-long DNA sequence will occur in random DNA segments of 3.4 x 10⁶
bases (the size of the E. coli genome) with a frequency of (1/4)20 x 3.4 X 106 = 3.09 X 10⁻⁶
(Giovannoni, 1991).
With highly conserved molecules, such as rRNAs, it is possible to design amplification
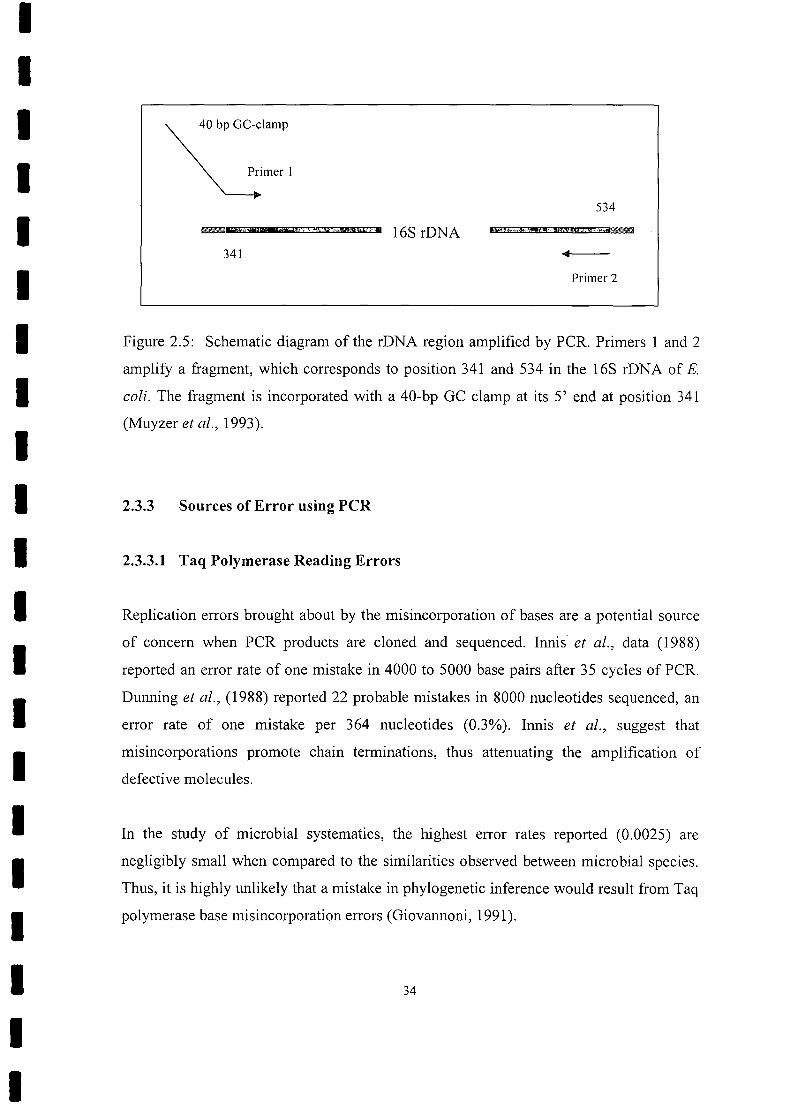
primers that will universally amplify all genes. In this study the variable V3 region of 16S
rDNA was enzymatically amplified in the PCR with primers to conserved regions of the
16S rRNA genes. Primers 1 and 2 (chapter 5) was used to amplify the 16S rDNA regions
in different bacterial species which correspond to position 341 to 534 in E. coli (Fig. 2.5)
(Muyzer et al., 1993; Giovannoni, 1991)
33
IIIIIIIIIIIIIIIIIIIII
534
40 bp GC-clamp
Primer 1
db' ,15 *§,.,lltjijjiil •• ,/,_ 16S rDNA
341 ..Primer 2
Figure 2.5: Schematic diagram of the rDNA region amplified by PCR. Primers 1 and 2
amplify a fragment, which corresponds to position 341 and 534 in the 16S rDNA of E.
coli. The fragment is incorporated with a 40-bp GC clamp at its 5' end at position 341
(Muyzer et al., 1993).
2.3.3 Sources of Error using peR
2.3.3.1 Taq Polymerase Reading Errors
Replication errors brought about by the misincorporation of bases are a potential source
of concern when PCR products are cloned and sequenced. Innis et al., data (1988)
reported an error rate of one mistake in 4000 to 5000 base pairs after 35 cycles of PCR.
Dunning et al., (1988) reported 22 probable mistakes in 8000 nucleotides sequenced, an
error rate of one mistake per 364 nucleotides (0.3%). Innis et al., suggest that
misincorporations promote chain terminations, thus attenuating the amplification of
defective molecules.
In the study of microbial systematics, the highest error rates reported (0.0025) are
negligibly small when compared to the similarities observed between microbial species.
Thus, it is highly unlikely that a mistake in phylogenetic inference would result from Taq
polymerase base misincorporation errors (Giovannoni, 1991).
34
IIIIIIIIIIIIIIIIIIIII
2.3.3.2 Chimeric Gene Products
One consideration in the use of PCR for the amplification of genes from mixed
populations of homologous genes (such as rRNA genes in mixed microbial population
DNA) is the concern that chimeric amplification products might be created. The
formation of chimeric products can occur by a mechanism in which some templates are
not copied completely during a period of primer extension. During ensuing cycles the
partial copies could re-anneal to related homologues, to be further extended on a second
template. The result would be the creation of chimeric genes that contain regions copied
from different homologues (Dunning et al., 1988; Giovannoni, 1991)
Innis et al., (1988) reported that Taq polymerase is highly processive. In the presence of
sufficient dNTP substrates, premature terminations are rare events. This suggests that
chimeric genes, like misincorporated nucleotides, may be the result of low dNTP
substrate concentrations in late cycles. Accordingly, Giovannoni (1991) suggest limiting
the number of amplification cycles so that no more than 25% of the initially present
substrate nucleotides are incorporated.
2.4 Denaturing gradient gel electrophoresis
There are three types of DGGE gels that can be run to detect mutations in DNA. The first
gel type is a perpendicular gradient gel, in which the gradient is perpendicular to the
electric field and uses a broad denaturing gradient range, such as 0-100% or 20-70%
(Fisher and Lerman, 1983). From this gel one can determine the concentration of
denaturants in which the wild-type and mutant fragments can be separated. The other
types of gels are parallel DGGE and constant denaturing gradient gel electrophoresis
(CDGE). In parallel DGGE, the denaturing gradient is parallel to the electric field, and
the range of denaturants is narrowed to allow better separation of fragments (Myers et al.,
35
IIIIIIIIIIIIIIIIIIIII
1987). In CDGE there is no gradient. Instead the optimum denaturing concentration
which allowed separation in perpendicular DGGE is used (BRL, 1994).
When running a denaturing gel, both the mutant and wild-type DNA fragments are run on
the same gel. This way one can detect a mutation by seeing a band shift on the gel. In
some cases, it is possible to detect a mutation by running just homoduplex DNA, for
example, if the mutation is a base change from A to G (G-C pairing has higher melting
temperature than A-T pairing) (Myers et al., 1987). The method of heteroduplex analysis
helps in resolving wild-type and mutated fragments when it is not possible to detect a
mutation by running homoduplex fragments, for example if the mutation is a base change
from A to T. Heteroduplexes can be formed by adding the wild type and mutant template
sequence in the same PCR reaction or by adding separate PCR products together, then
denaturing and allowing them to re-anneal. A heteroduplex has a mismatch in the double
strand causing a distortion in its usual shape; this has a destabilizing effect and causes the
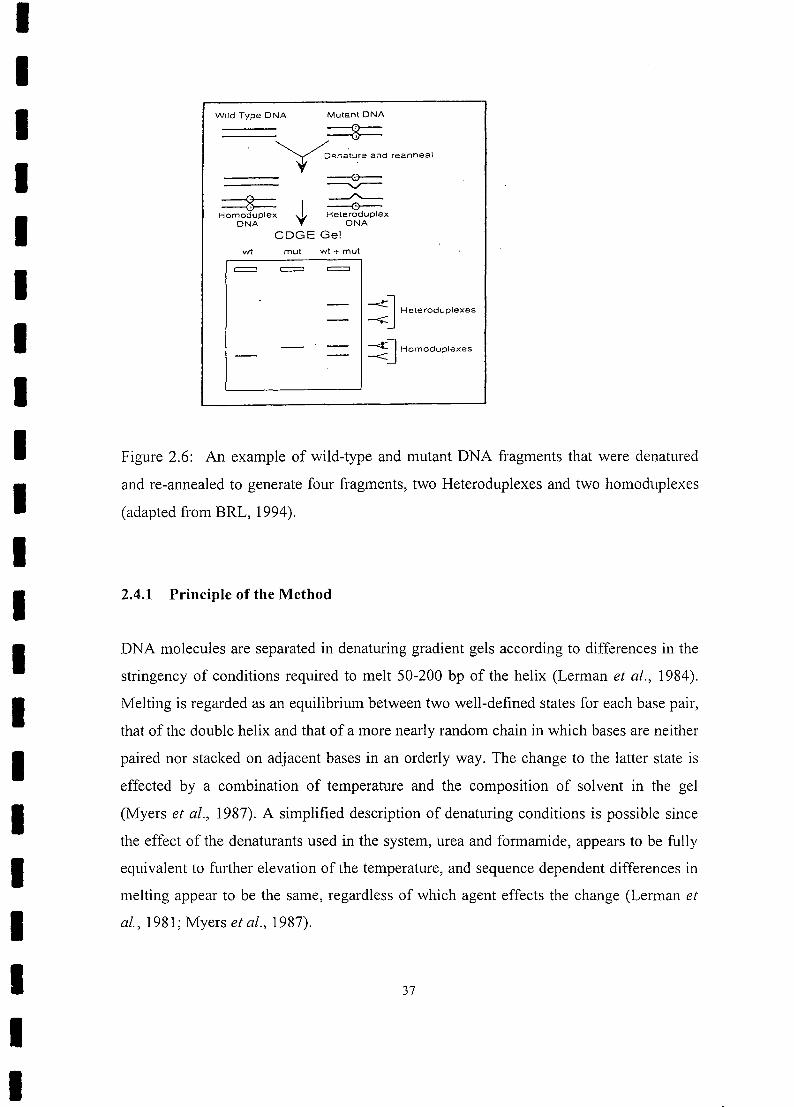
DNA strands to separate at a lower concentration of denaturant (Fig. 2.6). The
heteroduplex bands always migrate more slowly than the corresponding homoduplex
bands (Myers et al., 1987; BRL, 1994)
36
IIIIIIIIII
Wild Type DNA Mutant DNA
Figure 2.6: An example of wild-type and mutant DNA fragments that were denatured
and re-annealed to generate four fragments, two Heteroduplexes and two homoduplexes
(adapted from BRL, 1994).
II
~-, /"f D.,naOturaand reanneal
------ ~----....r-
Homo~uPlex J ~xDNA T DNA
eDGE Gelwt mut wt + mut
= = =
~ ] Heteroduplexes
~J Homoduplexes
2.4.1 Principle of the Method
DNA molecules are separated in denaturing gradient gels according to differences in the
stringency of conditions required to melt 50-200 bp of the helix (Lerman et al., 1984).
Melting is regarded as an equilibrium between two well-defined states for each base pair,
that of the double helix and that of a more nearly random chain in which bases are neither
paired nor stacked on adjacent bases in an orderly way. The change to the latter state is
effected by a combination of temperature and the composition of solvent in the gel
(Myers et al., 1987). A simplified description of denaturing conditions is possible since
the effect of the denaturants used in the system, urea and formamide, appears to be fully
equivalent to further elevation of the temperature, and sequence dependent differences in
melting appear to be the same, regardless of which agent effects the change (Lerman et
aI., 1981; Myers et al., 1987).
IIIIIIIII
37

IIIIIIIIIIIIIIIIIIIII
The portion of a sequence in which a GC pair replaces an AT will melt at a slightly
higher temperature, or equivalently, at a slightly higher concentration of urea and
formamide in the gel (Fisher and Lerman, 1983). The structural difference caused by the
presence of opposing bases that do not constitute a Watson-Crick pair in otherwise
complementary strands substantially lowers the melting temperature of that portion of the
molecule or equivalently, lowers the denaturant concentration at which melting takes
place (Myers et al., 1987).
The electrophoretic mobility of a fully helical DNA molecule in a gel appears to be
insensitive to the composition or sequence of the helix, except with respect to minor
effects where certain sequence patterns introduce a persistent curvature of the helix.
Under conditions that maintain complete melting and strand dissociation, the separated
strands exhibit an electrophoretic mobility in the gel considerable lower than that of a
double helical molecule (Myers et al., 1987).
The progression of melting of a DNA molecule as the temperature is gradually raised
occurs as a succession of more or less well-defined steps, where each step represents the
simultaneous change in state of a considerable number, 50-300, of contiguous base pairs.
All of the pairs comprising a segment of this kind melt within a relatively narrow
temperature interval. Each such block of base pairs is conventionally termed a domain;
each domain is usually clearly demarcated from the adjacent domains on either side.
Small changes in the properties of a molecule, such as the replacement of a single base
pair by a different base pair, raises or lowers the melting temperature of the domain that
includes the substitution without significant effects beyond its boundaries (Myers et al.,
1987). The positions along the base sequence that correspond to domain boundaries can
be identified by examining the effects of a series of closely spaced single base
substitutions and by computation using sequence-specific melting theory, which shows a
close agreement with the experimental results (Myers et al., 1985a; Myers et al., 1985b).
38
IIIIIIIIIIIIIIIIIIIII
More substantial changes in the molecule, such as sequence alteration involving many
base pairs or the lack of perfect Watson-Crick complementarity in the molecule, can alter
domain boundaries, establish new domains, or result in the merger of adjacent domains
that were otherwise slightly different (Myers et al., 1987).
The typical length of domains is roughly 50-300 bp under the conditions prevailing in
denaturing gradient gels. The effective persistence length of 35-40 bases characterizes the
flexibility of melted strands of DNA. Consequently only the melting of the first or the
first few domains gives a melted section of at least 91 bp, the length required to reduce
the electrophoretic mobility of a partly melted DNA molecule to 20% of its mobility
when fully helical. The use of the denaturing gradient gels to examine changes that occur
after further mobility reductions is not feasible. Further melting usually results in the
complete dissociation of the two strands in molecules shorter than roughly 1 kb. Thus,
only those changes in sequence that occur in the lowest temperature domains can be
detected by denaturing gradient gel electrophoresis (Myers et al., 1985b).
Composite molecules can be constructed in which nearly any sequence can constitute the
lowest temperature domains by attachment to a very high-melting portion. The high
melting portion is described as a "GC clamp" (Fisher and Lerman, 1983; Shefield et al.,
1989).
Shefield et al., (1989) cloned a high-temperature melting G+C-rich sequence, designated,
a GC clamp, into a plasmid vector next to the mouse pmajor globin promoter. This cloned
GC-clamp increased the number of mutations in the promoter detectable by DGGE from
40% of all possible single-base changes to close to 100%.
In the experimental configuration that is most useful for comparing a large number of
similar molecules and for preparative process, the electrophoretic field drives the
molecule into an ascending gradient of the denaturant mixture. The limits of denaturant
concentration at the top and bottom of the gel and the ambient temperature are selected
such that melting transition in the domain of interest takes place somewhere in the middle
39
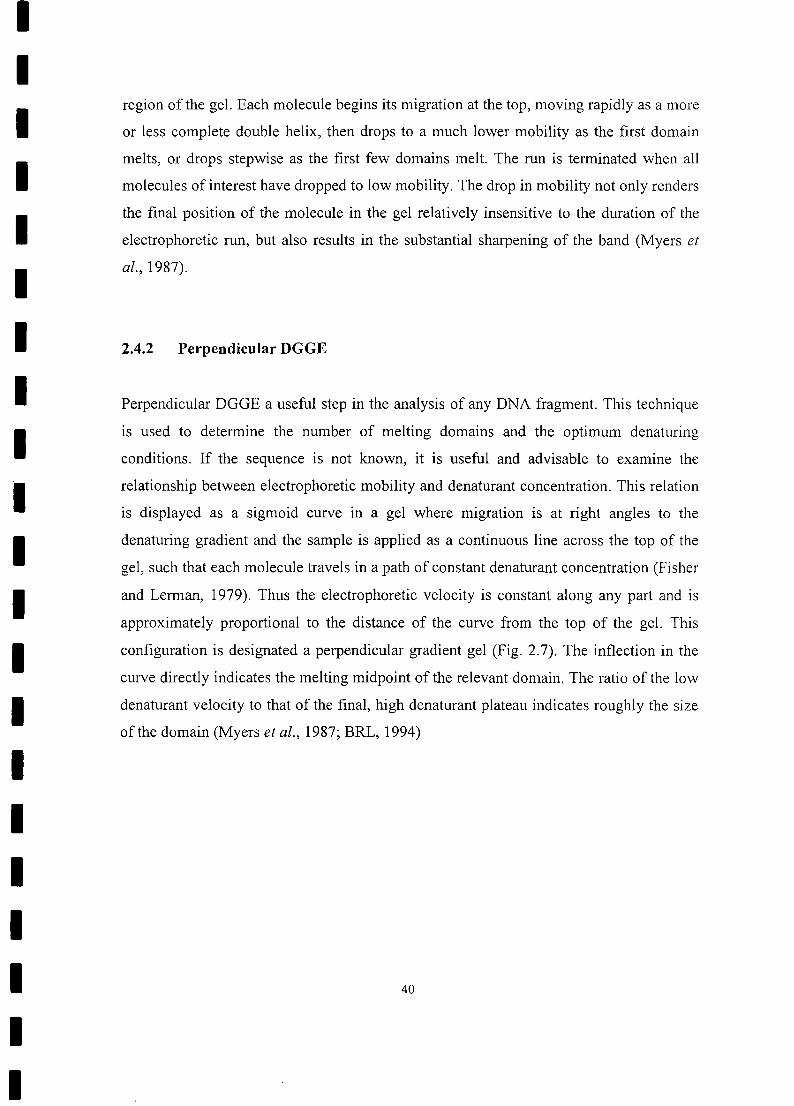
IIIIIIIIIIIIIIIIIIIII
region of the geL Each molecule begins its migration at the top, moving rapidly as a more
or less complete double helix, then drops to a much lower mobility as the first domain
melts, or drops stepwise as the first few domains melt. The run is terminated when all
molecules of interest have dropped to low mobility. The drop in mobility not only renders
the final position of the molecule in the gel relatively insensitive to the duration of the
electrophoretic run, but also results in the substantial sharpening of the band (Myers et
al., 1987).
2.4.2 Perpendicular DGGE
Perpendicular DGGE a useful step in the analysis of any DNA fragment. This technique
is used to determine the number of melting domains and the optimum denaturing
conditions. If the sequence is not known, it is useful and advisable to examine the
relationship between electrophoretic mobility and denaturant concentration. This relation
is displayed as a sigmoid curve in a gel where migration is at right angles to the
denaturing gradient and the sample is applied as a continuous line across the top of the
gel, such that each molecule travels in a path of constant denaturant concentration (Fisher
and Lerman, 1979). Thus the electrophoretic velocity is constant along any part and is
approximately proportional to the distance of the curve from the top of the gel. This
configuration is designated a perpendicular gradient gel (Fig. 2.7). The inflection in the
curve directly indicates the melting midpoint of the relevant domain. The ratio of the low
denaturant velocity to that of the final, high denaturant plateau indicates roughly the size
of the domain (Myers et al., 1987; BRL, 1994)
40
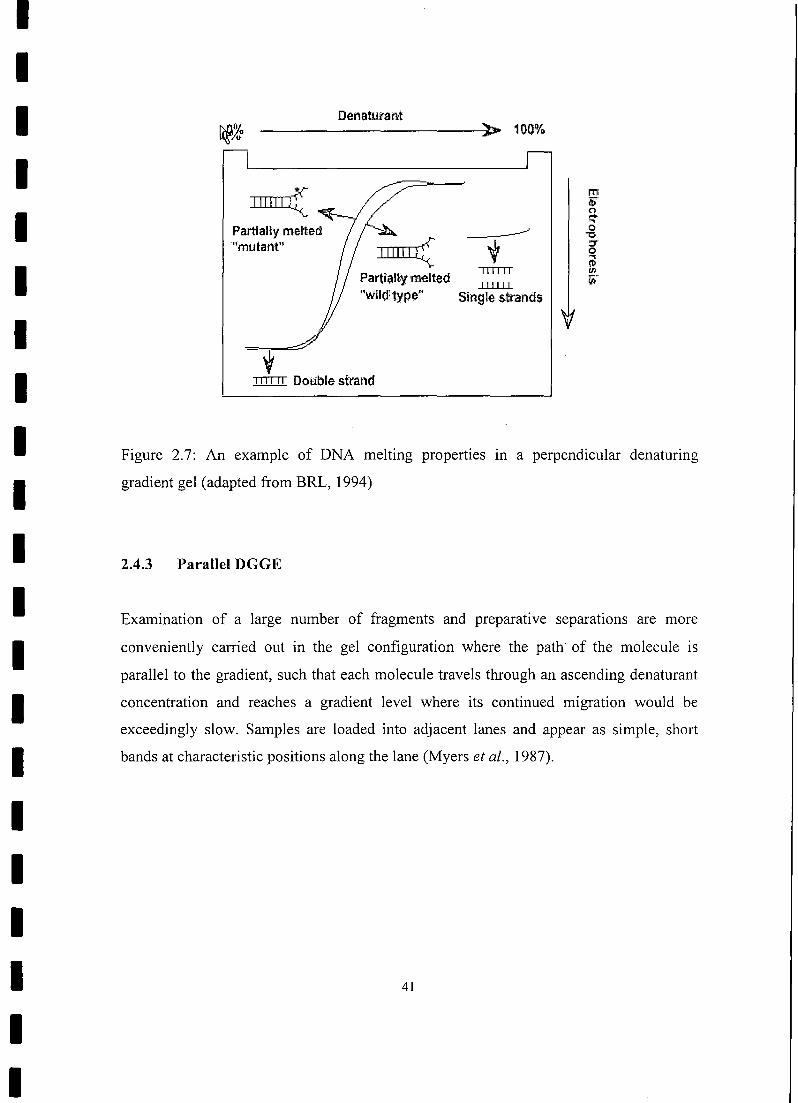
II
ITflllll-f ~~ ~ Z"-Partially metted I A. ~
'''mutant'' IlIlW""{{"' V~ llTTlT
Partially melted ...ll.ll.ll
"wild!type" Single strands
I Denaturant-------------» 100%
IIII
==vm Doublestrand
II
Figure 2.7: An example of DNA melting properties III a perpendicular denaturing
gradient gel (adapted from BRL, 1994)
I 2.4.3 Parallel DGGE
I Examination of a large number of fragments and preparative separations are more
conveniently carried out in the gel configuration where the path- of the molecule is
parallel to the gradient, such that each molecule travels through an ascending denaturant
concentration and reaches a gradient level where its continued migration would be
exceedingly slow. Samples are loaded into adjacent lanes and appear as simple, short
bands at characteristic positions along the lane (Myers et al., 1987).
IIIIIII 41
II
IIIIIIIIIIIIIIIIIIIII
2.4.3.1 Analysis of Natural Microbial Population
Recently, denaturing gradient gel electrophoresis (DGGE) analysis of 16S rRNA gene
segments has been used to profile complex microbial communities (Muyzer et al., 1993)
and to infer the phylogenetic affiliation of the community members (Muyzer et al., 1994;
Muyzer et al., 1995). Ferris et al., (1996) used DGGE to profile microbial populations
inhabiting different temperature regions in the microbial mat community. Two known
cyanobacterial populations and one known green nonsulphur bacterium-like population
were detected by DGGE. A new cyanobacterial 16S rRNA sequence type was detected at
temperatures from 63 to 75°C and a new green nonsulphur bacterium-like sequence type
was also detected at temperatures from 53 to 62°C (Ferris et al., 1997).
The use of DGGE for the analysis of the microbial community of activated sludge
provides a powerful means for detecting perturbations in community structure. Marsh et
al., (1998) applied DGGE to an activated sludge community maintained in a laboratory-
scale bioreactor. Over the course of five weeks, analysis with DGGE revealed dramatic
changes in the eukaryotic community based on differences in the denaturation profiles.
Curtis and Craine, (1998) used DGGE to compare the bacterial diversity of activated
sludge plants and to determine the optimal sample regime for comparative studies.
DGGE process allows rapid comparison of bacterial diversity in activated sludge plants.
DGGE approach can help answer important questions about which bacteria undertake
which functions in activated sludge. Answering these questions will be important step
towards the explicit engineering of bacterial populations in activated sludge and other
bacterial treatment processes (Curtis and Craine, 1998).
42
IIIIIIIIIIIIIIIIIIIII
2.5 Respirometric Batch assay
2.5.1 Growth rate in batch reactors
Some biological reactors, e.g. anaerobic digesters, are operated as batch reactors, where
the waste containing some microorganisms is place in the reactor and mixed at a constant
temperature. After a given time the reactor contents are emptied and disposed of and the
reactor is recharged. Since there is no flow of the substrate or bacteria into or out of the
reactor in batch processes, the concentrations of substrate and bacteria vary with time. If
a small number of innoculum bacteria are placed into a substrate and nutrient rich liquid,
the mass of bacteria as well as the substrate remaining within the liquid will vary
according to Figure 2.7. Initially the bacterial population remains constant during a lag
phase during which time the cells become accustomed to the new media. After the lag
phase of up to several hours, the organisms begin to grow and multiply during the
acceleration phase. During this second phase, the many intermediates involved in the
metabolic reaction chain build up to steady levels. Once the organisms have become
accustomed to the media, they multiply very rapidly according to the first order reaction
rate (Schroeder, 1977),
dX=kXdt (2.1)
where
x = weight of dry cells/volume
K = specific growth rate, time-1
Since the integral of Eq. (2.1) is a logarithmic expression, this growth is called a log
phase. During this phase, there is a high food to microorganism (So/Xo) with a very high
fraction of cells being viable; cell deaths are not important. Eventually the food is
consumed to a point where there are too many organisms and not enough food left to
sustain the rapid growth rate during the log phase.
43
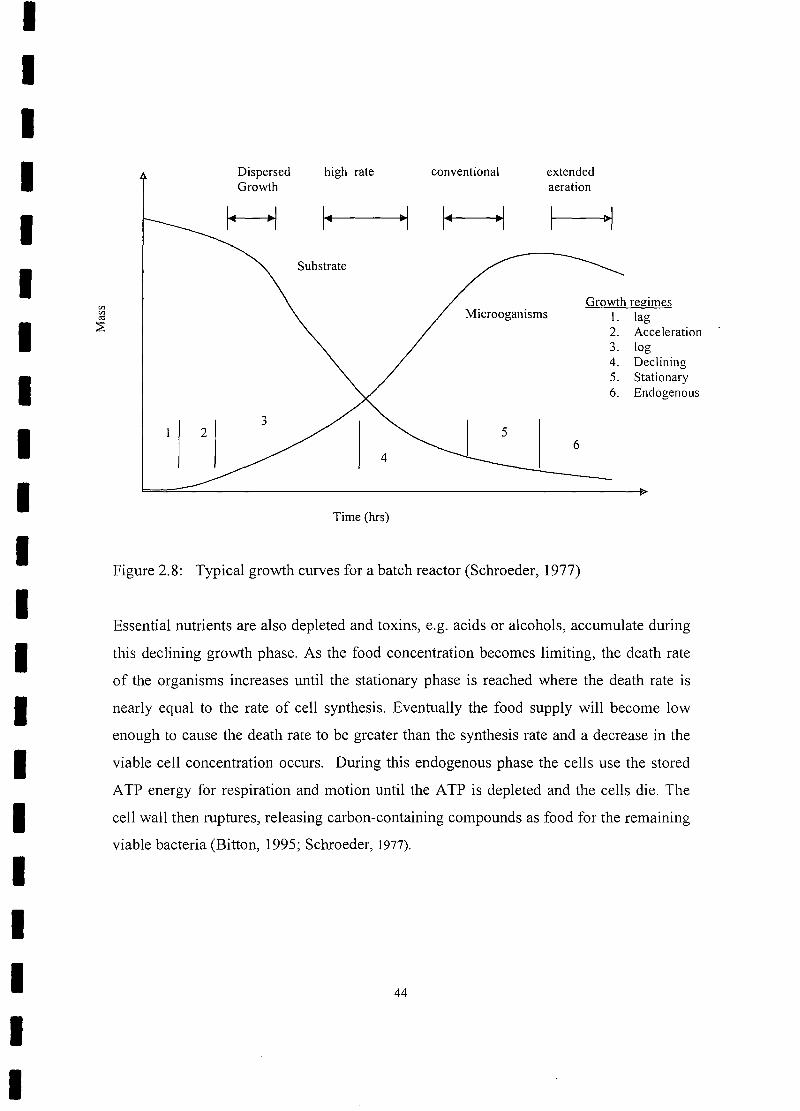
IIIII
Dispersed high rate conventional extendedGrowth aeration
"I 14 ·1 14 ·1 ~
Substrate
IMicrooganisms
Growth regimesl. lag2. Acceleration3. log
DecliningStationaryEndogenous
I
II
I
Time (hrs)
I Figure 2.8: Typical growth curves for a batch reactor (Schroeder, 1977)
IEssential nutrients are also depleted and toxins, e.g. acids or alcohols, accumulate during
this declining growth phase. As the food concentration becomes limiting, the death rate
of the organisms increases until the stationary phase is reached where the death rate is
nearly equal to the rate of cell synthesis. Eventually the food supply will become low
enough to cause the death rate to be greater than the synthesis rate and a decrease in the
viable cell concentration occurs. During this endogenous phase the cells use the stored
ATP energy for respiration and motion until the ATP is depleted and the cells die. The
cell wall then ruptures, releasing carbon-containing compounds as food for the remaining
viable bacteria (Bitton, 1995; Schroeder, 1977).
IIIIIII 44
II
IIIIIIIIIIIIIIIIIIIII
2.5.2 The SolXo ratio
The variations in relationship between biomass growth and substrate removal rate, during
batch experiments have been studied by numerous authors (Fujimoto, 1963; Rao and
Gaudy, 1966; Gaudy and Ramanathan, 1967). However the various experimental data
found in the literature cannot be compared because of different operational conditions
used. In order to make them suitable for more correct interpretation, the data obtained
from batch experiments have to be related to a universal parameter. According to Pitter
and Chudoba (1990), such a parameter is the ratio of initial substrate concentration (So)
to initial biomass concentration (Xo). This ratio is one of the most important parameters
in batch cultivations, determining whether or not cell multiplication will take place
during exogenous substrate removal (Chudoba et al., 1992).
Microbial growth reflects an increase in biomass with (multiplication) or without (storage
or accumulation) the increase in cell number (Pitter and Chudoba, 1990). The increase in
biomass due to cell multiplication results from the oxidation of extracellular substrates, to
obtain energy and also to synthesize all components of the biomass (Daigger and Grady,
1982). The storage response involves only the transport of substrates, the oxidation of a
smaller portion, and the synthesis of storage polymers like carbohydrate or lipid.
Storage or accumulation processes have been observed most usually during batch
cultivation when microbial growth is limited by low amount of utilizable carbon and
energy source, with respect to the innoculum concentration. Thus, at low So/Xo ratio, a
relatively high amount of biomass is supplied with a low quantity of substrate. The initial
energy level is then low as well, and the increase in cell mass reflects only the increase in
molecular polymer content in the biomass. Consequently, weight changes do not
necessarily reflect similar changes in cell number. Due to the fact that the cell replication
is a process energetically enough demanding, no, or only negligible cell multiplication
takes place at low So/Xo ratios during exogenous substrate removal (Speece et al., 1973;
Pitter and Chudoba, 1990; Chudoba et al., 1992)
45
IIIIIIIIIIIIIIIIIIIII
At high So/Xo ratio, a relatively low amount of biomass is supplied with a higher
quantity of substrate. The initial energy level is higher, and thus sufficient for different
synthetic reactions which take place during cell replication cycle, like enzyme, protein
and nucleic acids syntheses. Consequently, the number of microorganisms increases
during the exogenous substrate removal, which is indicated by increasing rates of
substrate removal and biomass growth (Chudoba et al., 1992).
2.5.2.1 Considerations for Determining the So/Xo ratio
Mixed culture of microoganisms (e.g. activated sludge) contains different bacterial
species and predators (protozoa, rotifers etc.) which differ in their growth constants. They
can be divided into two groups; slow growers and fast growers (Chudoba et al., 1992).
Under high So/Xo ratios substantial cell multiplication occurs in a batch cultivation
which changes the proportion between slow-growers and fast growers and the measured
kinetics will reflect the characteristics of the fastest growing species, resulting in a shift
in bacterial community structure away from its original mixed culture. Therefore the
measured growth parameters would not be representative of the original treatment
environment (Chudoba et al., 1992).
Chudoba et al., (1992) in recognizing the culture history and the nature of the assay
procedure, argued in favour of low So/Xo ratios (to limit cell multiplication) during batch
tests since they mimic the most common condition of the biomass present in typical full
scale, completely mixed, continuous activated sludge process.
This is evident from the following calculation for such a system:
Given:
Influent substrate concentration (Si) =Effluent substrate concentration (Se)
Volatile suspended solids
Fey
500 mgCOD/L
20 mgCOD/L
2000 mgVSS/L
1.48 mgCOD/mgVSS (WRC, 1984)
46
IIIIIIIIIIIIIIIIIIIII
Therefore: Xo VSS x Fey
2000 X 1.48
2960 mgCOD/L
In such a system the available substrate concentration (So) is approximately the same as
that in the effluent (Se)
Therefore;
So/Xo = 20/2960
0.0067
This So/Xo ratio (0.0067) would therefore represent the condition of the biomass found
in most BNR treatment plants (Chudoba, 1992).
47
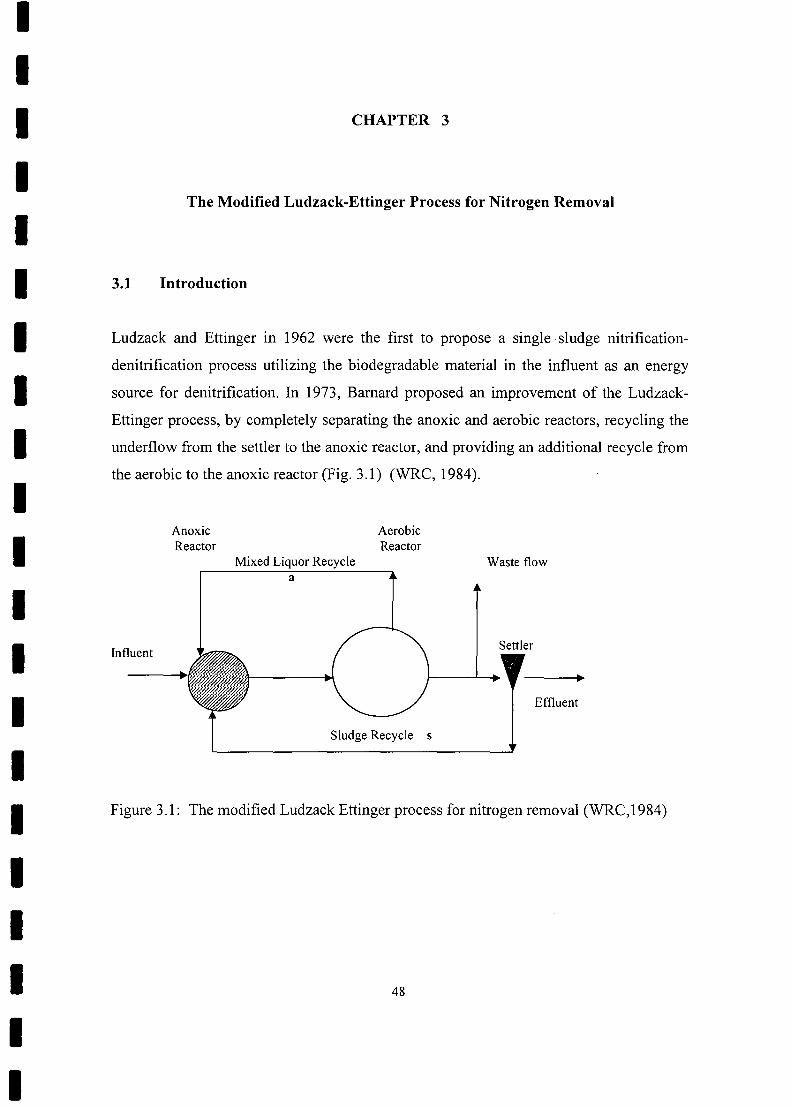
IIIIIIIIIIIIIIIIIIIII
CHAPTER 3
The Modified Ludzack-Ettinger Process for Nitrogen Removal
3.1 Introduction
Ludzack and Ettinger in 1962 were the first to propose a single sludge nitrification-
denitrification process utilizing the biodegradable material in the influent as an energy
source for denitrification. In 1973, Barnard proposed an improvement of the Ludzack-
Ettinger process, by completely separating the anoxic and aerobic reactors, recycling the
underflow from the settler to the anoxic reactor, and providing an additional recycle from
the aerobic to the anoxic reactor (Fig. 3.1) (WRC, 1984).
AnoxicReactor
AerobicReactor
Mixed Liquor Recycle Waste flow
Influent
a
Settler
Effluent
Sludge Recycle s
Figure 3.1: The modified Ludzack Ettinger process for nitrogen removal (WRC, 1984)
48
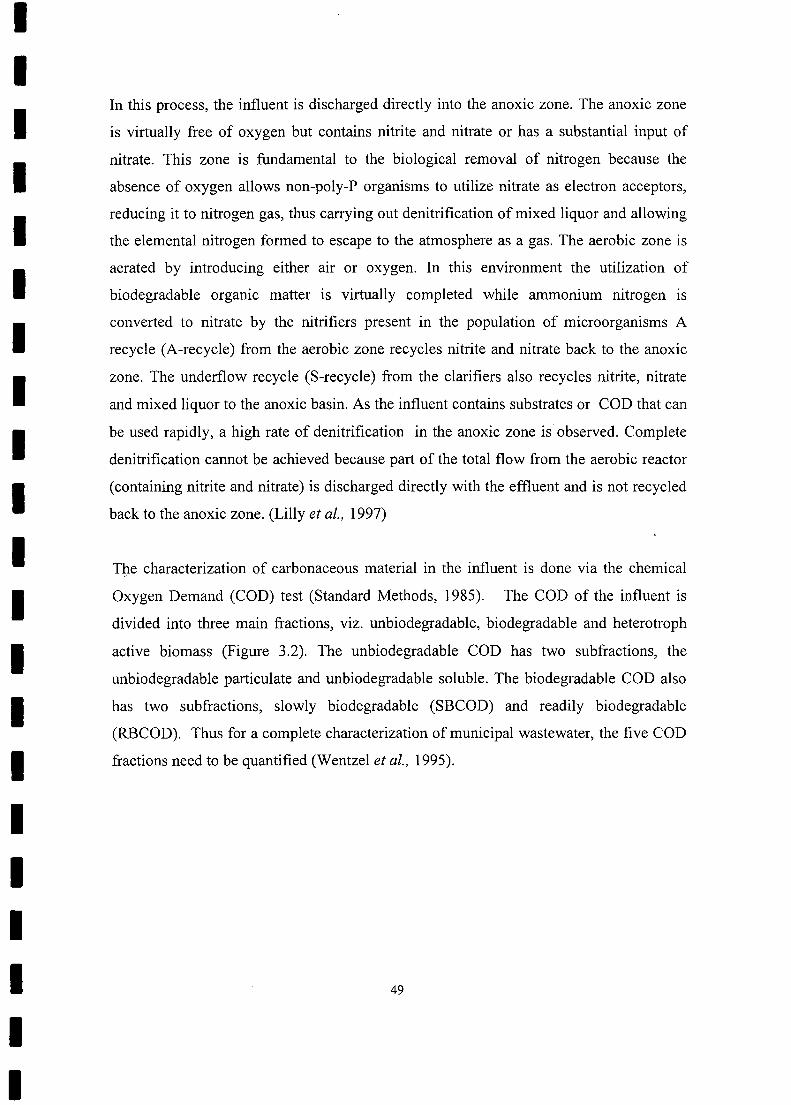
IIIIIIIIIIIIIIIIIIIII
In this process, the influent is discharged directly into the anoxic zone. The anoxic zone
is virtually free of oxygen but contains nitrite and nitrate or has a substantial input of
nitrate. This zone is fundamental to the biological removal of nitrogen because the
absence of oxygen allows non-poly-P organisms to utilize nitrate as electron acceptors,
reducing it to nitrogen gas, thus carrying out denitrification of mixed liquor and allowing
the elemental nitrogen formed to escape to the atmosphere as a gas. The aerobic zone is
aerated by introducing either air or oxygen. In this environment the utilization of
biodegradable organic matter is virtually completed while ammonium nitrogen IS
converted to nitrate by the nitrifiers present in the population of microorganisms A
recycle (A-recycle) from the aerobic zone recycles nitrite and nitrate back to the anoxic
zone. The underflow recycle (S-recycle) from the clarifiers also recycles nitrite, nitrate
and mixed liquor to the anoxic basin. As the influent contains substrates or COD that can
be used rapidly, a high rate of denitrification in the anoxic zone is observed. Complete
denitrification cannot be achieved because part of the total flow from the aerobic reactor
(containing nitrite and nitrate) is discharged directly with the effluent and is not recycled
back to the anoxic zone. (Lilly et al., 1997)
The characterization of carbonaceous material in the influent is done via the chemical
Oxygen Demand (COD) test (Standard Methods, 1985). The COD of the influent is
divided into three main fractions, viz. unbiodegradable, biodegradable and heterotroph
active biomass (Figure 3.2). The unbiodegradable COD has two subfractions, the
unbiodegradable particulate and unbiodegradable soluble. The biodegradable COD also
has two subfractions, slowly biodegradable (SBCOD) and readily biodegradable
(RBCOD). Thus for a complete characterization of municipal wastewater, the five COD
fractions need to be quantified (Wentzel et al., 1995).
49
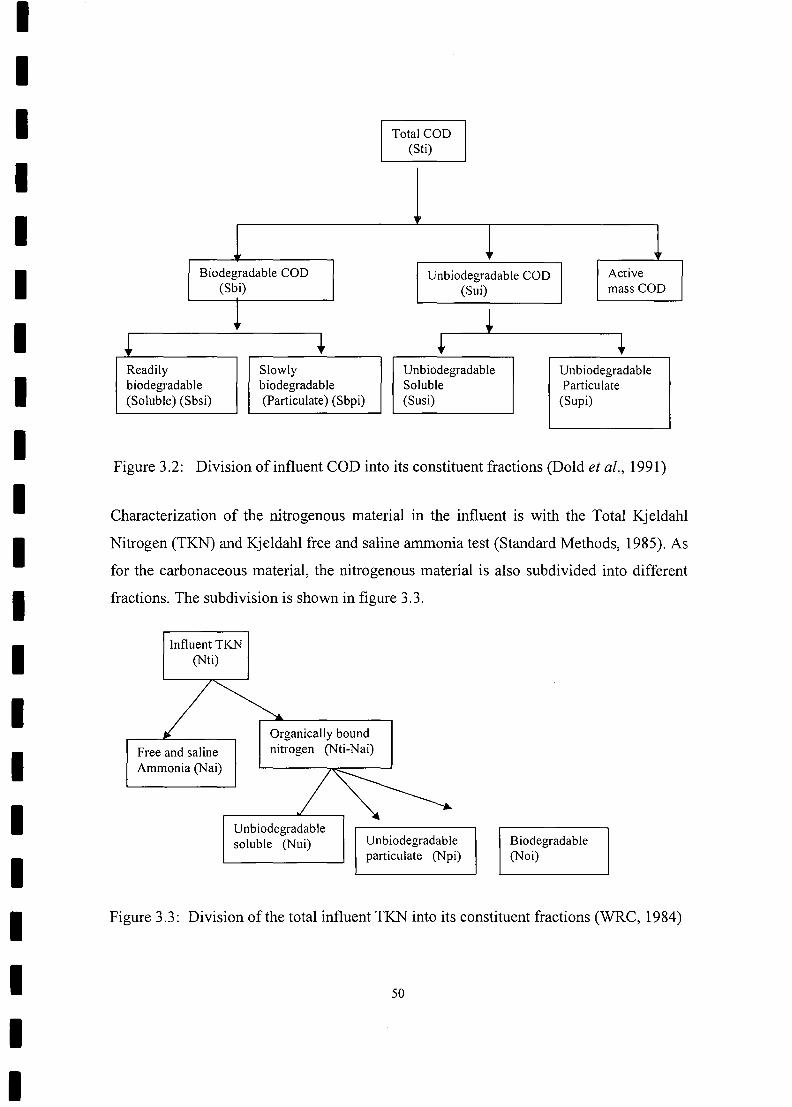
IIIII
Total COD(Sti)
Il 1
Biodegradable COD Unbiodegradable COD Active(Sbi) (Sui) mass COD
i~ + ~ +Readily Slowly Unbiodegradable Unbiodegradablebiodegradable biodegradable Soluble Particulate(Soluble) (Sbsi) (Particulate) (Sbpi) (Susi) (Supi)
IIII
Figure 3.2: Division of influent COD into its constituent fractions (Dold et al., 1991)
ICharacterization of the nitrogenous material in the influent is with the Total Kjeldahl
Nitrogen (TKN) and Kjeldahl free and saline ammonia test (Standard Methods, 1985). As
for the carbonaceous material, the nitrogenous material is also subdivided into different
fractions. The subdivision is shown in figure 3.3.II Influent TKN
(Nt i)
III
Free and salineAmmonia (Nai)
Organically boundnitrogen (Nti-Nai)
III
Unbiodegradableparticulate (Npi)
Biodegradable(Noi)
Figure 3.3: Division of the total influent TKN into its constituent fractions (WRC, 1984)
50
II
IIIIIIIIIIIIIIIIIIIII
The free and saline ammonia is immediately available for the incorporation into the
bacterial protoplasm and for the conversion to nitrite or nitrate. The proteinaceous
fraction consists of a number of subfractions, unbiodegradable soluble and
unbiodegradable particulate organic nitrogen fractions, Nui and Npi respectively, and a
biodegradable organic nitrogen fraction, Noi. The unbiodegradable soluble fraction
passes unaffected through the system and is discharged in the effluent similar to the
soluble unbiodegradable COD. The biodegradable organic nitrogen is broken down by
the heterotrophs to free and saline ammonia which with its influent counterpart
participates in any further biologically mediated reactions (WRC, 1984).
3.1.1 Mass balance equations
In the design of activated sludge processes the characteristics of wastewater are of prime
importance. These characteristics govern both the selection of the process and the
removal of nitrogen attainable in the process. Wastewater characteristics of importance
are:
• Mean influent COD and TKN concentrations (Sti and Nti respectively) and mean
daily flow (Q)
• Mean effluent COD and TKN concentrations (Ste and Nte respectively)
• Influent readily biodegradable COD fraction (fbs)
• Influent TKN/COD concentration ratio (Nt/ Sti)
• Maximum specific growth rate of the nitrifiers at reference temperature of 20°C
(Ilnm20)
e Average minimum and maximum temperatures (Tminand Tmax)in the process
51

IIIIIIIIIIIIIIIIIIIII
3.1.1.1 COD mass balance
The mean influent COD concentration (Sti) and the mean flow per a day (Q) define the
mass COD load day on the process, M (Su), (WRC, 1984) by
Mass of COD in the effluent is defined by,
M (Ste) = Q . Ste
Mass of COD in the waste sludge
M (Sxw)= fev. MXy/Rs
Where
X, = mixed liquor volatile suspended solids (mgVSS)
fev= CODNSS ratio of volatile solids (1.48mgCOD/mgVSS)
Vp = total volume of the process reactors (L)
R, = mass of sludge in reactormass of sludge wasted per day
MXv=Vp. x,
Mass of oxygen required daily for carbonaceous degradation
Where
M (Otm)= measured oxygen per day
= OUR. 24. % aerobic Vp/100
52
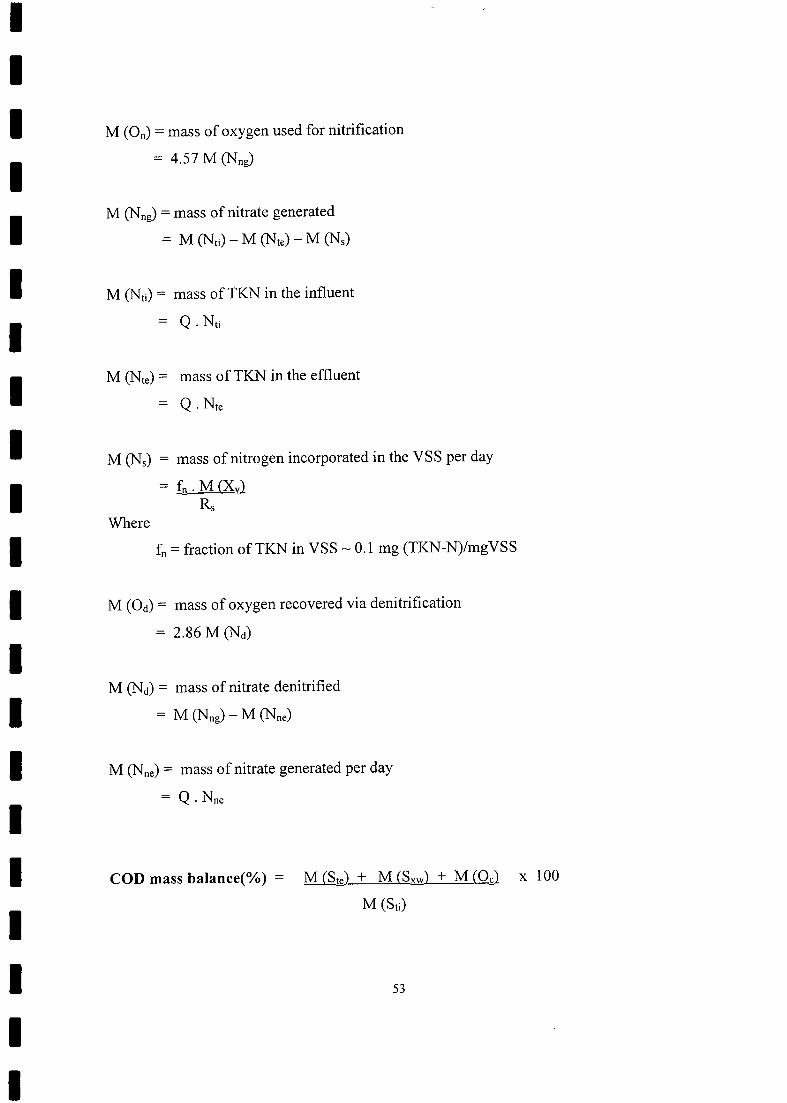
IIIIIIIIIIIIIIIIIIIII
M (On) = mass of oxygen used for nitrification
= 4.57 M (Nng)
M (Nng) = mass of nitrate generated
= M (Ns) - M (Nte) - M (Ns)
M (Nu) = mass ofTKN in the influent
= Q.Nti
M (Nte) = mass ofTKN in the effluent
Q. Nte
M (Ns) = mass of nitrogen incorporated in the VSS per day
= fn. M (XvlRs
Where
£1 = fraction ofTKN in VSS ~ 0.1 mg (TKN-N)/mgVSS
M (Oa) = mass of oxygen recovered via denitrification
= 2.86 M (Nd)
M (Na) = mass of nitrate denitrified
= M (Nng) - M (Nne)
M (Nne) = mass of nitrate generated per day
= Q. Nne
COD mass balance(%) = M (Ste) + M (Sxw) + M (Oel x 100
M (Sti)
53
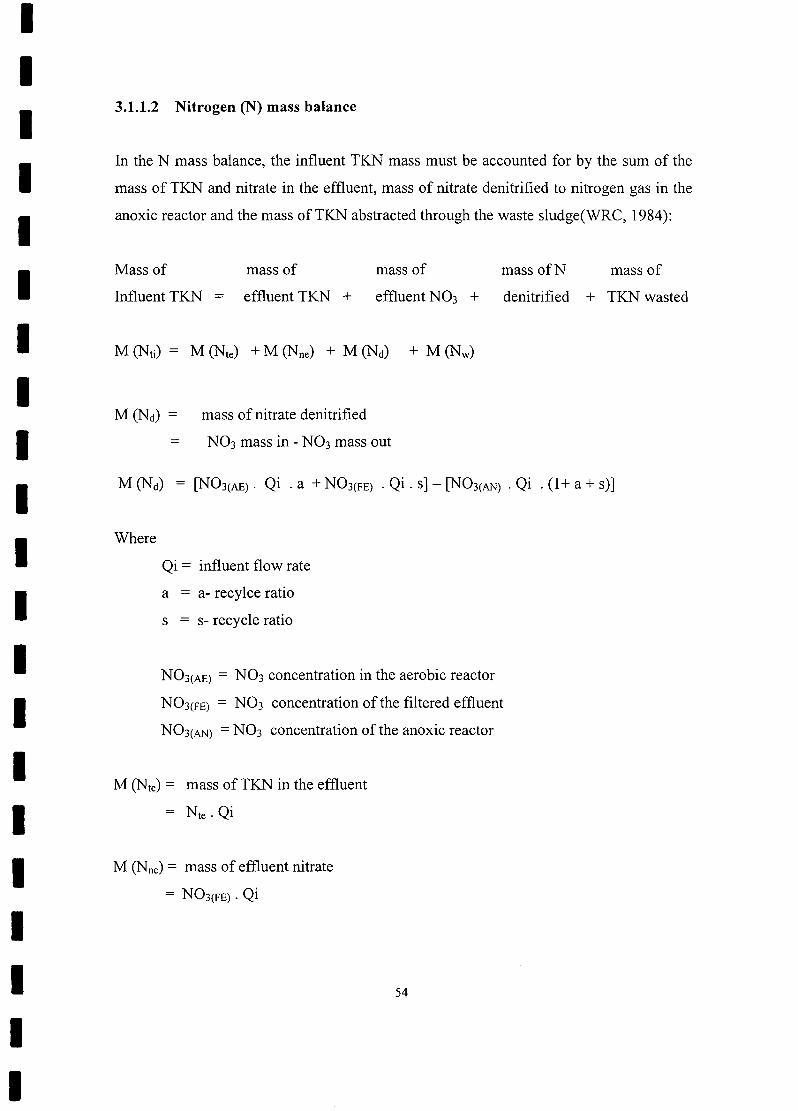
IIIIIIIIIIIIIIIIIIIII
3.1.1.2 Nitrogen (N) mass balance
In the N mass balance, the influent TKN mass must be accounted for by the sum of the
mass of TKN and nitrate in the effluent, mass of nitrate denitrified to nitrogen gas in the
anoxic reactor and the mass ofTKN abstracted through the waste sludge(WRC, 1984):
Mass of
Influent TKN =
mass of
effluent TKN +mass of
effluent N03 +mass ofN mass of
denitrified + TKN wasted
M(Nti) M (Nte) + M (Nne) + M (Nd) + M (Nw)
M (Na) mass of nitrate denitrified
= N03 mass in - N03 mass out
M (Nd) = [N03(AE). Qi . a + N03(FE) . Qi . s] - [N03(AN) . Qi . (1+ a + s)]
Where
Qi = influent flow rate
a = a- recylce ratio
s = s- recycle ratio
N03(AE) = N03 concentration in the aerobic reactor
N03(FE) = N03 concentration of the filtered effluent
N03(AN) = N03 concentration of the anoxic reactor
M (Nte) = mass of TKN in the effluent
Nte. Qi
M (Nne)= mass of effluent nitrate
= N03(FE). Qi
54
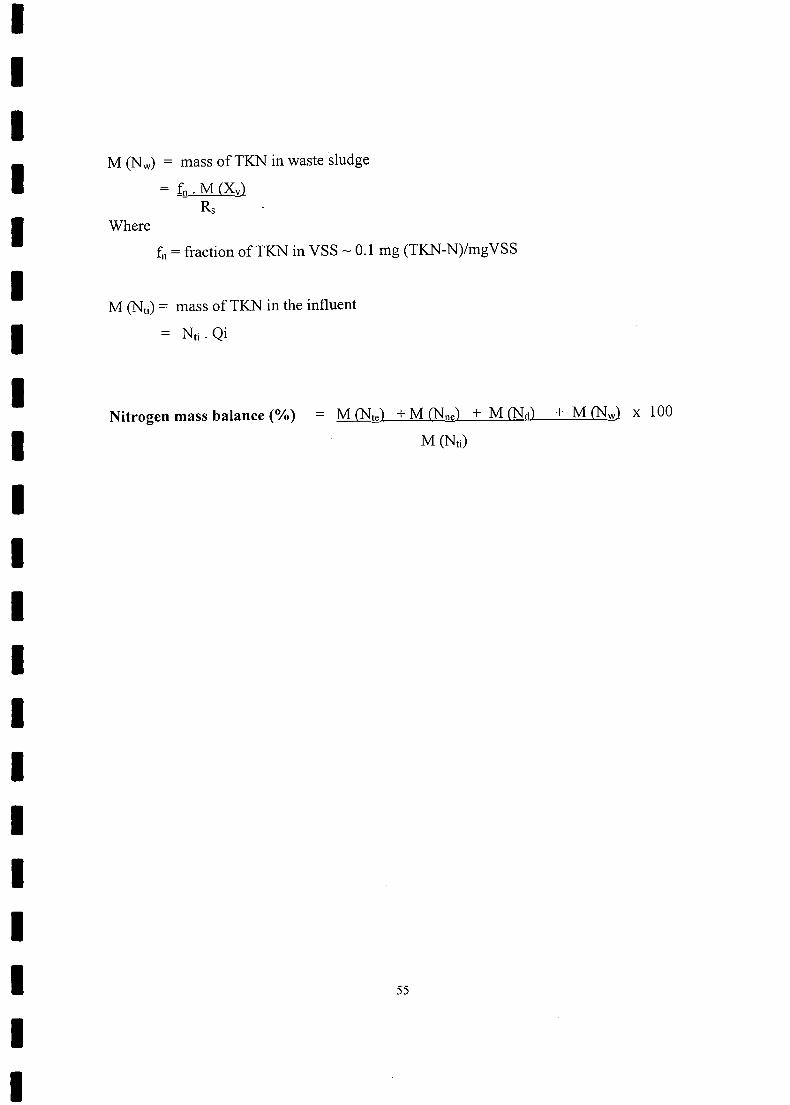
IIIIIIIIIIIIIIIIIIIII
M (Nc) = mass ofTKN in waste sludge
= fn. M (Xv}Rs
Where
fn = fraction ofTKN in VSS ~ 0.1 mg (TKN-N)/mgVSS
M (Nti) = mass ofTKN in the influent
= Nti. Qi
Nitrogen mass balance (%) M...ilite) + M (Nne) + M CNd)
M(Nti)
55
+MCNw} x 100
IIIIIIIIIIIIIIIIIIIII
3.2 Methodology
3.2.1 Parent System
The parent laboratory-scale system layout and operational details are shown in figure 3.4.
The system was fed 30L/d raw (unsettled) municipal wastewater obtained from Southern
Works (Durban, South Africa). This wastewater is primarily domestic with no industrial
contribution. The wastewater was collected in batches, stored in 25L containers at 4°C
and served as feed for both the parent system and batch tests. For the parent system, daily
wastewater was drawn from the storage containers after thorough mixing and diluted with
tap water from its raw COD of approximately 800 mgCOD/L to give a total influent feed
of approximately 500 mgCOD/L.
3.2.2 System performance monitoring and analytical methods
To monitor the system performance, samples were drawn daily for analysis from each of
the reactors, anoxic, aerobic and final effluent. Daily monitoring included influent COD
(APPENDIX 1), TKN (APPENDIX 2); all reactors nitrate and nitrite; aerobic reactor
VSS (APPENDIX 3), COD and TKN, OUR; effluent COD, TKN, nitrate and nitrite.
(Nitrite was less than 2% of nitrate and therefore neglected). Oxygen utilization rate
(OUR) was monitored continuously online with the DO controller, OUR meter developed
by Randall et al., (1991). In addition, aerobic batch tests (Chapter 4) were conducted on
sludge drawn from the system to investigate microbial population shifts at defined So/Xo
ratios. To ensure steady state, the parent system was run for more than five sludge ages
before mixed liquor was harvested for the batch test.
56
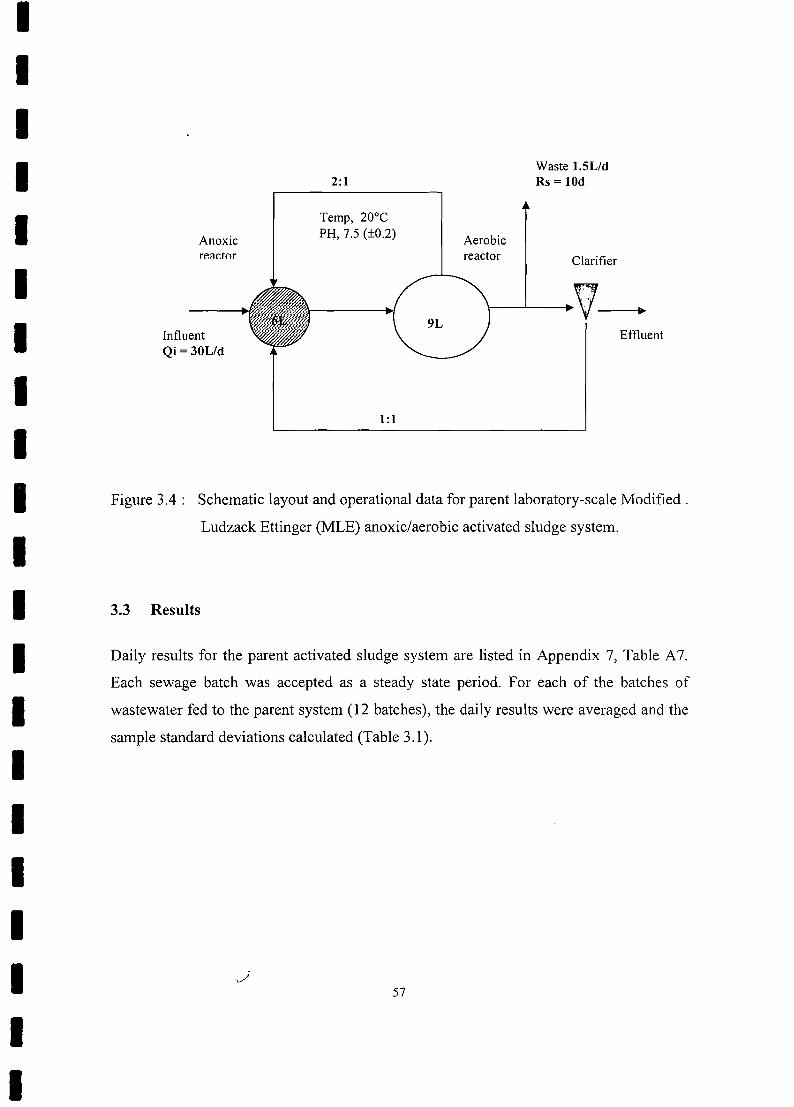
IIIIIIIIIIIIIIIIIIIII
2:1Waste 1.5L/dRs = 10d
Anoxicreactor
Temp, 20°CPH, 7.5 (±O.2) Aerobic
reactor Clarifier
InfluentQi =30L/d
Effluent
1:1
Figure 3.4: Schematic layout and operational data for parent laboratory-scale Modified.
Ludzack Ettinger (MLE) anoxic/aerobic activated sludge system.
3.3 Results
Daily results for the parent activated sludge system are listed in Appendix 7, Table A7.
Each sewage batch was accepted as a steady state period. For each of the batches of
wastewater fed to the parent system (12 batches), the daily results were averaged and the
sample standard deviations calculated (Table 3.1).
57

III Table 3.1: Steady state results for parent laboratory-scale anoxic/aerobic activated sludge
IIIIIIIIIIIIIIIIII
Anoxic/Aerobic steady state system
WW COD (mg/I) TKN (mg/I) Nitrates (mgN/I) Aerobic Mixedbatch OUR liquor
(mgO/lIh) (mg/I)lnf Eff lnf Eff Anoxic Aerobic Eff VSS
1 470.93 46.13 29.50 3.07 0.48 1.76 7.58 30.33 2069(25.52) (8.82) (4.33) (0.60) (0.50) (0.65) (3.17) (0.31) (119.7)
2 491.49 48.39 27.84 6.48 0.32 1.28 3.78 29.57 2610(39.34) (12.76) (5.08) (3.25) (0.03) (0.81) (1.21) (0.40) (135.7)
3 481.92 48.42 29.96 4.87 0.29 1.89 4.98 30.57 2195.14(33.89) (11.94) (2.32) (0.57) (0.11) (0.45) (1.50) (0.29) (101.6)
4 497.52 60.08 32.15 4.51 0.1 1.30 6.21 29.64 2363(44.18) (16.01) (2.94) (3.72) (0.02) (0.45) (1.64) (0.16) (112.9)
5 475.4 68.6 34.24 8.04 0.1 1.26 6.01 29.02 2301.71(28.01) (11.89) (5.25) (4.87) (0.01) (0.86) (1.87) (0.24) (85.40)
6 482.82 67.32 31.04 4.86 0.52 1.88 7.25 31.01 2038.4(31.49) (9.00) . (3.92) (1.03) (0.21 ) (0.93) (0.75) (0.86) (187.3)
7473.892 68.46 32.01 10.08 0.51 1.18 5.14 29.29 1904(25.16) (8.02) (1.88) (1.90) (0.29) (0.87) (1.58) (0.24) (187.1)
8485.7 58.29 28.21 3.24 0.285 0.98 8.03 32.29 1814.5
(46.75) (12.26) (2.53) (0.71) (0.18) (0.52) (0.85) (0.52) (155.9)9 484.14 51.21 27.27 4.58 0.1 0.39 6.58 30.13 2258
(31.35) (10.43) (5.26) (0.91) (0.03) (0.16) (0.95) (0.47) (132.1)10 473.39 62.8 28.45 3.35 0.1 0.26 7.30 30.54 1912.4
(36.66) (20.20) (3.88) (0.71) (0.02) (0.51 ) (2.04) (0.34) (154.5)11
489.59 59.19 30.63 4.29 0.1 0.12 7.26 31.23 2237(33.40) (11.94) (2.99) (1.20) (0.01) (0.06) (1.84) (0.63) (131.70)
12485.16 62.34 27.44 4.38 0.1 0.1 6.30 30.54 2045(35.27) (16.03) (5.72) (0.92) (0.004) (0.07) (1.40) (0.73) (92.26)
58
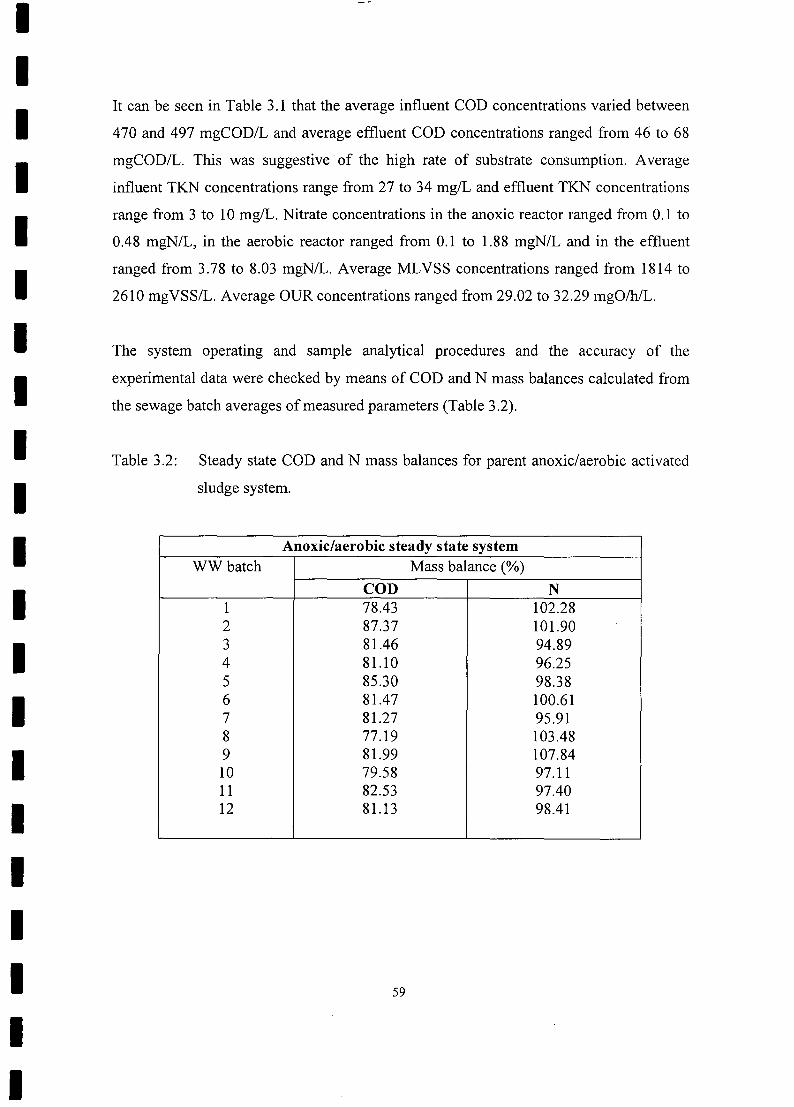
IIII
It can be seen in Table 3.1 that the average influent COD concentrations varied between
470 and 497 mgCOD/L and average effluent COD concentrations ranged from 46 to 68
mgCOD/L. This was suggestive of the high rate of substrate consumption. Average
influent TKN concentrations range from 27 to 34 mg/L and effluent TKN concentrations
range from 3 to 10 mg/L. Nitrate concentrations in the anoxic reactor ranged from 0.1 to
0.48 mgN/L, in the aerobic reactor ranged from 0.1 to 1.88 mgN/L and in the effluent
ranged from 3.78 to 8.03 mgN/L. Average MLVSS concentrations ranged from 1814 to
2610 mgVSS/L. Average OUR concentrations ranged from 29.02 to 32.29 mgO/hiL.
IIII
The system operating and sample analytical procedures and the accuracy of the
experimental data were checked by means of COD and N mass balances calculated from
the sewage batch averages of measured parameters (Table 3.2).
II
Table 3.2: Steady state COD and N mass balances for parent anoxic/aerobic activated
sludge system.
II
Anoxic/aerobic steady state systemWWbatch Mass balance (%)
COD N1 78.43 102.282 87.37 101.903 81.46 94.894 81.10 96.255 85.30 98.386 81.47 100.617 81.27 95.918 77.19 103.489 81.99 107.8410 79.58 97.1111 82.53 97.4012 81.13 98.41
IIIIIII 59
II
IIIIIIIIIIIIIIIIIIIII
The COD mass balances fall in the range of 77 to 87% and the nitrogen mass balances
fall in the range of 94 to 107%. Acceptable N and COD mass balances were obtained for
all 12 wastewater batches.
3.4 Discussion
The parent laboratory-scale activated sludge system was run for more than five sludge
ages to ensure steady state. Once steady state was acquired, the mixed liquor was
harvested for the batch tests (chapter 4). Steady state data obtained for 12 wastewater
batches are represented in Table 3.1. COD entering the system was approximately
500mg/L and in the range of 50-70 mgCOD/L leaving the system. TKN leaving the
system was in the range 3-10 mgN/L. TKN/cOD ratios> 0.1 were suggestive of a high rate
of the nitrogen removal efficiency in the system (WRC, 1984), however this resulted in
high effluent nitrate concentrations of > 5mgN/L. The low concentrations of N03 in
anoxic reactor were evident of the high rates of denitrification in the system. The
proportion of COD utilized with nitrate also indicates that the denitrification potential of
the system is very high.
COD and N mass balances verified the reliability of the experimental data (Table 3.2). In
the COD balance, the COD mass leaving the system via the final effluent flow; oxygen
utilized; sludge wasted; nitrate denitrified; and COD utilized in the system is reconciled
with the COD mass entering the system with the influent flow (3.1.1.1). In the N balance,
the N mass leaving the system via the final effluent flow; sludge wasted; nitrate
denitrified; and the nitrogen removed in the system is reconciled with the TKN mass
entering the system with the influent flow. The N nitrified and denitrified is calculated
from a nitrate mass balance around the reactors (3.1.1.2) (Zhi-rong Hu et al., 2000). The
reliability of the experimental data is directly proportional to the mass balance deviation
from the target value of 100%, i.e. the closer the mass balances are to 100%, the more
reliable the data. The N mass balance falls in the range of 90-11 0%.
60

IIIIIIIIIIIIIIIIIIIII
Although the COD and N mass balances of some of batches were lower than 100%, these
are similar to COD and N mass balances observed in other investigations with nutrient
removal systems, viz. Clayton et ai., (1989), 92% and 91%; Ubisi et al., (1997), 84% and
102% and Wentzel et al., (1998), 81% and 92%.
3.5 Conclusion
A biological nutrient removal activated sludge system with MLE configuration for
nitrogen removal was proposed. The laboratory-scale evaluation of the system indicates
that it holds considerable potential for denitrification. From the 120d laboratory scale
evaluation of 10d sludge age acceptable nitrogen and COD mass balances were obtained.
The importance of steady state behavior in this study is to ensure that the mixed liquor
has acclimatized to the existing environment, which was observed by the consistencies of
the measured parameters. In order to analyze the bacterial community in activated sludge
respirometric batch assays and to obtain kinetic constants the mixed liquor has to be
representative of the original mixed culture (Chudoba et ai., 1992).
61
IIIIIIIIIIIIIIIIIIIII
CHAPTER 4
The Relationship between Biomass Growth and Substrate Removal
4.1 Introduction
During a batch experiment, an initial substrate concentration (So) is put into contact with
an initial quantity of microbial culture (Xo). The parameter So represents the carbon and
energy source for biosynthesis, while Xo represents a source of carbon and energy
consumption. After being put into contact with the substrate, microorganisms of mixed
culture start to remove the substrate, which is demonstrated by changes in substrate
removal and biomass growth curves or lines. Therefore the most important parameter in
batch cultivation of mixed cultures is the ratio of initial substrate concentration to initial
biomass concentration (SolXo as COD/Biomass) (Chudoba et al., 1992)
At high substrate to biomass ratios the batch assay will measure the maximum rate of
substrate oxidation, but it does not represent the growth rate and physiological state of
bacteria in the original treatment environment. The greater the batch reactor SolXo ratio,
the greater the change in the bacterial community away from that of the original
wastewater environment, and the more likely it is that the measured kinetics will reflect
the characteristics of the fastest growing bacteria, or changes in the physiological state of
the bacterial community. Hence, lower SolXo ratios «2) are preferred in batch assays.
Under these conditions, bacterial cell multiplication rate is assumed not to be altered from
that of the original treatment environment (Chudoba et al., 1991, 1992). In order to
investigate the relationship between biomass growth and substrate removal batch test
were set up with various SolXo ratios. The substrate and biomass were sampled at regular
intervals and OUR profiles were determined.
62

IIIIIIIIIIIIIIIIIIIII
4.2 Methodology
4.2.1 Batch Test Experiment
The mixed liquor (bacterial biomass, Xo) was sampled from the parent system aerobic
reactor and the raw sewage (substrate, So) was taken from the influent that had been
diluted to SOOmgCOD/L. Both were added into a SL stirred aerobic batch reactor (figure
4.1) and run as described by Ekama et al. (1986). To inhibit autotrophic nitrifying
bacterial growth, thiourea was added to the mixed liquor to a final concentration of
20mg/L. The OUR was monitored continually using an automated technique (Randall et
al., 1991). The dissolved oxygen (DO) concentration was logged continuously with a DO
probe linked to a computer. The DO was allowed to decrease from Smg/L to 2mg/L and
the mixture aerated until the DO again reached Smg/L. OUR was represented by the
negative slope of the DO concentration profile during the non-aerated periods. The pH
was maintained at 7.4 (±O.2) and the temperature at 20°C (±2°C). Because of the low
OUR values, the walls of the reactor was thoroughly brushed during aeration cycles to
prevent particulate matter adhering to them. Samples of SOmL mixed liquor were taken
every l-hour over a period of 16 hours for COD (APPENDIX 1), MLVSS (APPENDIX
3) and DNA extractions (APPENDIX 4).
DO probe
OURMETER
5L reaction vessel
Air sparger
Stirrer
Figure 4.1: A schematic representation of stirred aerated Batch reactor.
63
IIIIIIIIIIIIIIIIIIIII
4.2.2 Measurement of COD, MLVSS and determination of So/Xo ratio
In order to investigate biomass growth and substrate removal five batch tests were
conducted at defined So/Xo ratios (0.8, 1.5, 4.0, 8.0 and 11). Before mixing, the COD
(APPENDIX 1) and MLVSS (APPENDIX 3) concentrations of the sewage feed and
mixed liquor were measured. The initial substrate to biomass ratio (So/Xo) was
determined by dividing COD (mg/L) measurements ofraw sewage by those of the mixed
liquor. The COD was adjusted to approximately 500mg/L and the mixed liquor volatile
suspended solids was measured and adjusted according to the So/Xo ratio. Taking fcv=
1.48mgCOD/mgVSS (WRC, 1984), So/Xo (on a COD basis) was calculated as follows:
Batch test 1 :
COD (So)
MLVSS
500 mg/L
417 mgVSS/L
Xo 417 mgVSS/L x 1.48 mgCOD/mgVSS
617 mgVSS/L
0.8SolXo
Batch test 2 :
COD (So)
MLVSS
500 mglL
225 mgVSS/L
Xo 225 mgVSS/L x 1.48 mgCOD/mgVSS
333 mgVSS/L
1.5SolXo
64
IIII Batch test 3 :
I COD (So) = 500 mg/L
MLVSS 84 mgVSS/L
I Xo = 84 mgVSS/L x 1.48 mgCOD/mgVSS
I 124 mgVSS/L
SolXo 4.0
II Batch test 4 :
I COD (So) = 500 mg/L
MLVSS 42 mgVSS/L
I 42 mgVSS/L x 1.48 mgCOD/mgVSSXO =
I 62 mgVSS/L
SolXo 8
II Batch test 5 :
I COD (So) = 500 mg/L
MLVSS 30 mgVSS/L
IXo 30 mgVSS/L x 1.48 mgCOD/mgVSS
I 45.45 mgVSS/L
SolXo 11
II 65
II
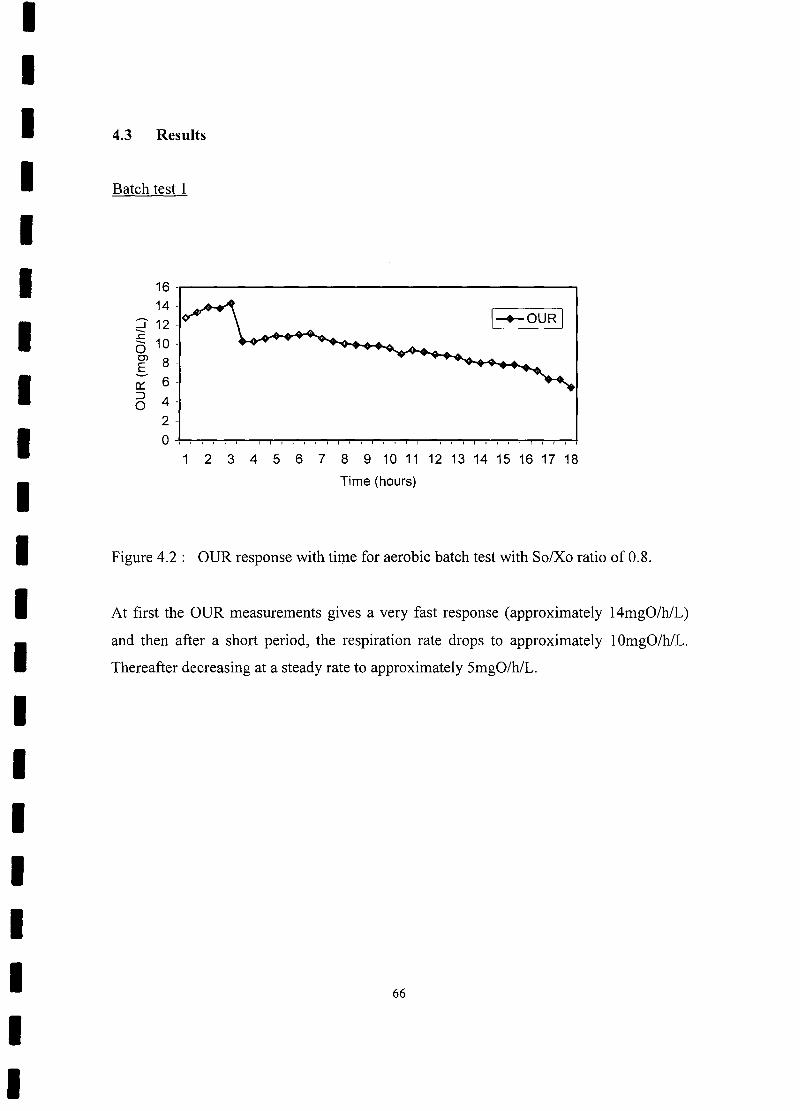
IIII
4.3 Results
Batch test 1
IIII
16 -14 -
~ 12..c
10 ---0OJ 8 -E- 6 -a:::J 4 -0
2 -
01
I--+-OUR I
II
2 3 4 5 6 7 8 9 10 11 12 13 14 15 16 17 18
Time (hours)
II
Figure 4.2: OUR response with time for aerobic batch test with So/Xo ratio of 0.8.
IAt first the OUR measurements gives a very fast response (approximately 14mgOIhlL)
and then after a short period, the respiration rate drops to approximately 10mgOlhlL.
Thereafter decreasing at a steady rate to approximately 5mgOIhlL.
IIIIII 66
II
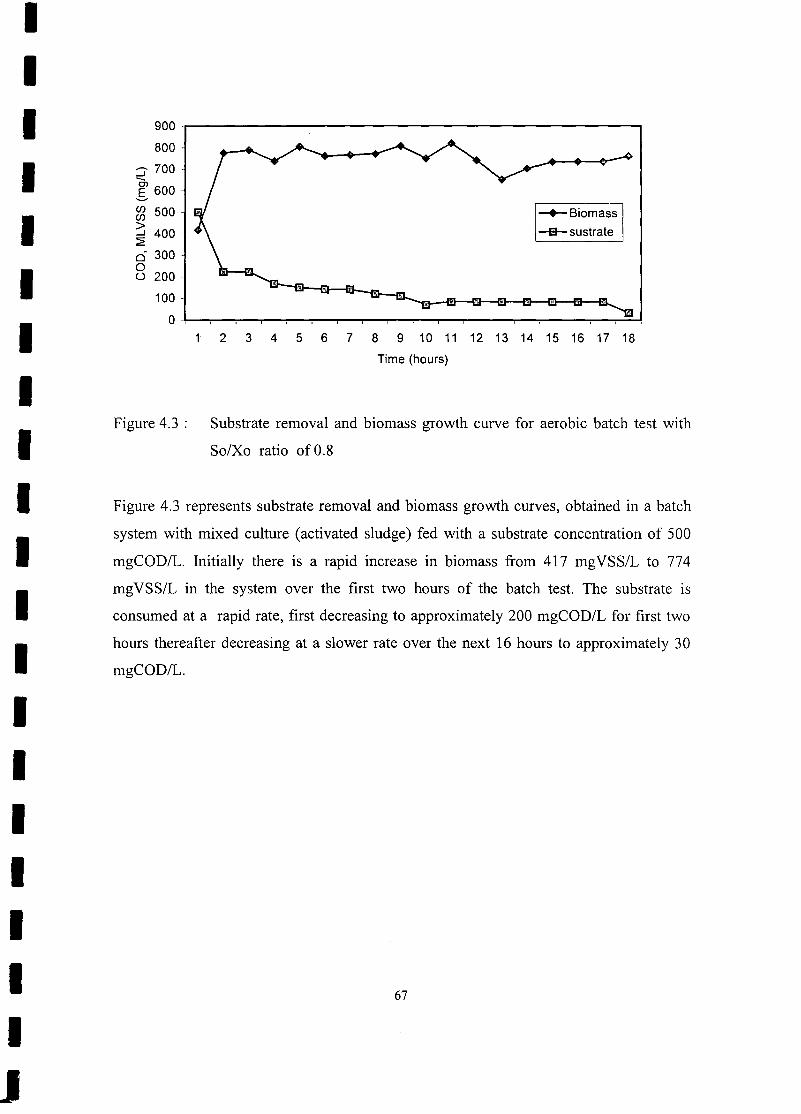
IIIIIIIIIIIIIIIIIIIIJ
900 -~--------------------------------------------------~800 -
::::J 700 -en.s 600 -
~ 500
~ 400::20" 300-o() 200 -
100
o -~~--~~~--~~--~~--~-T--~~--~~--r-~--~~
-+-Biomass-e-- sustrate
2 3 4 5 6 7 8 9 10 11 12 13 14 15 16 17 18
Time (hours)
Figure 4.3: Substrate removal and biomass growth curve for aerobic batch test with
So/Xo ratio of 0.8
Figure 4.3 represents substrate removal and biomass growth curves, obtained in a batch
system with mixed culture (activated sludge) fed with a substrate concentration of 500
mgCOD/L. Initially there is a rapid increase in biomass from 417 mgVSS/L to 774
mgVSS/L in the system over the first two hours of the batch test. The substrate is
consumed at a rapid rate, first decreasing to approximately 200 mgCOD/L for first two
hours thereafter decreasing at a slower rate over the next 16 hours to approximately 30
mgCOD/L.
67
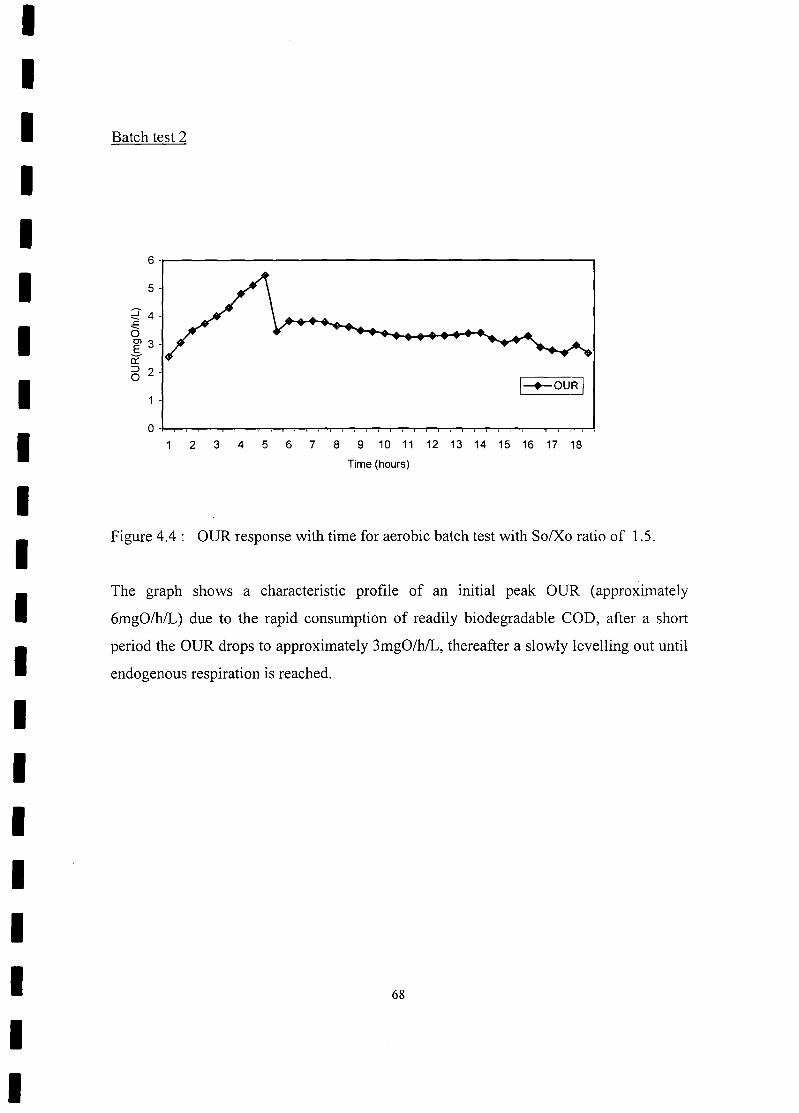
IIIIIIIIIIIIIIIIIIIII
Batch test 2
6-~-----------------------------------------------.5
I--+-OUR I
2 3 4 5 6 7 8 9 10 11 12 13 14 15 16 17 18
Time (hours)
Figure 4.4: OUR response with time for aerobic batch test with SolXo ratio of 1.5.
The graph shows a characteristic profile of an initial peak OUR (approximately
6mgOIhlL) due to the rapid consumption of readily biodegradable COD, after a short
period the OUR drops to approximately 3mgO/h/L, thereafter a slowly levelling out until
endogenous respiration is reached.
68
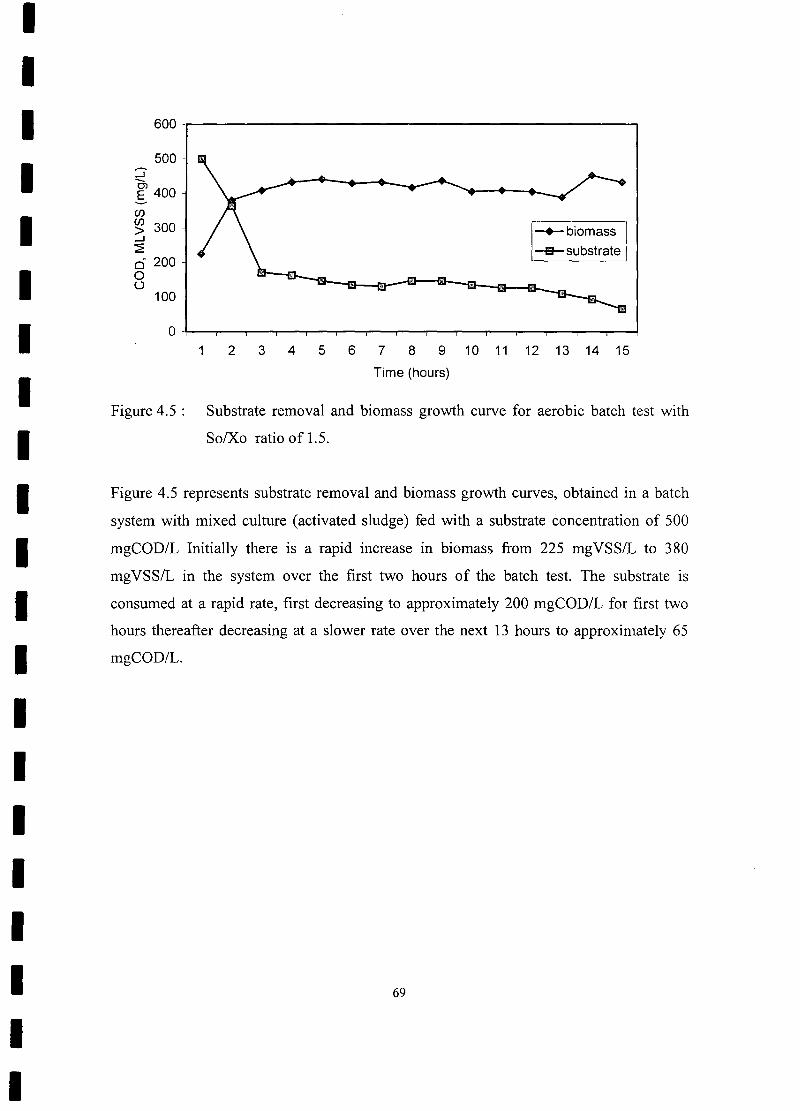
IIIII
600-~----------------------------------------------~
I
(J)(J)> 300 -....J~6 200-oo
-+-biomass-a-- substrate
100 -
:::J0,E 400--
III
2 3 4 5 6 7 8 9 10 11 12 13 14 15
Time (hours)
Figure 4.5 : Substrate removal and biomass growth curve for aerobic batch test with
SolXo ratio of 1.5.
II
Figure 4.5 represents substrate removal and biomass growth curves, obtained in a batch
system with mixed culture (activated sludge) fed with a substrate concentration of 500
mgCOD/L Initially there is a rapid increase in biomass from 225 mgVSS/L to 380
mgVSS/L in the system over the first two hours of the batch test. The substrate is
consumed at a rapid rate, first decreasing to approximately 200 mgCOD/L for first two
hours thereafter decreasing at a slower rate over the next 13 hours to approximately 65
mgCOD/L.
IIIIIIII 69
II
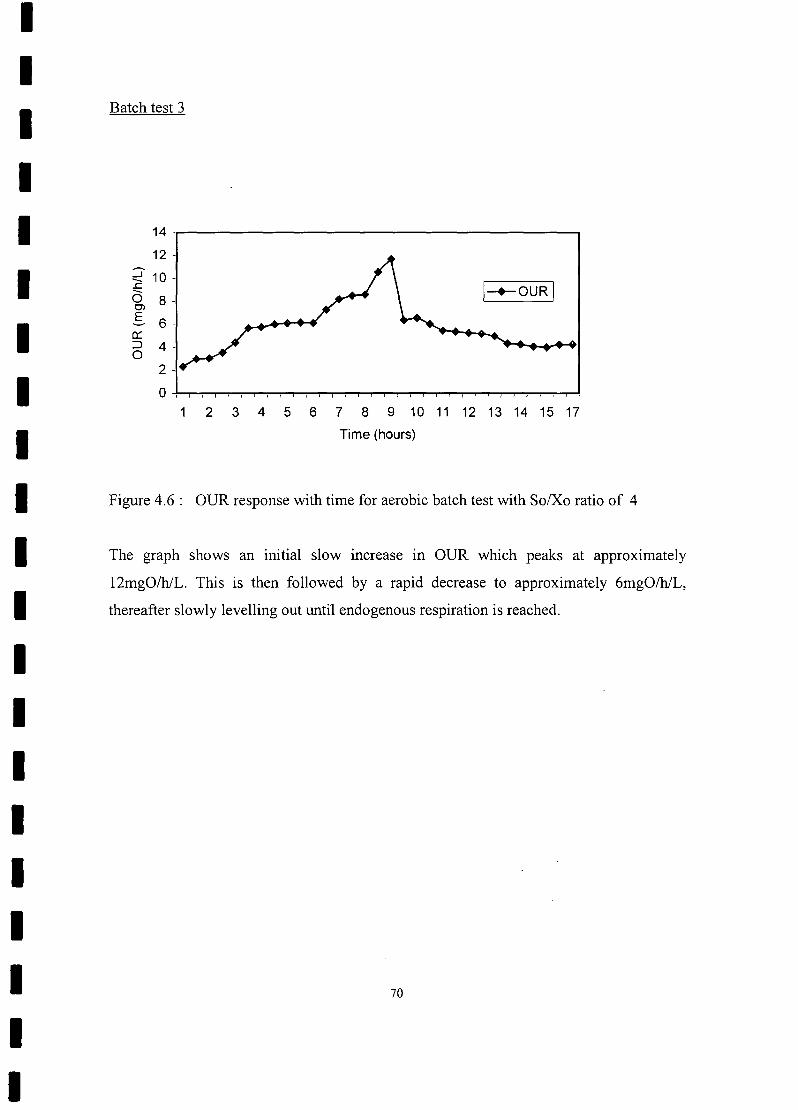
III Batch test 3
II 14-~------------------------------------------~
12
~ 10-£o 8-OJ.s 6-I 0:::~ 4 -0
2 -
0 ,
1
J-+-OUR II
III
2 3 4 5 6 7 8 9 10 11 12 13 14 15 17
Time (hours)
Figure 4.6: OUR response with time for aerobic batch test with So/Xo ratio of 4
I The graph shows an initial slow increase in OUR which peaks at approximately
12mgO/hiL. This is then followed by a rapid decrease to approximately 6mgOlhlL,
thereafter slowly levelling out until endogenous respiration is reached.IIIIIIIII
70
I
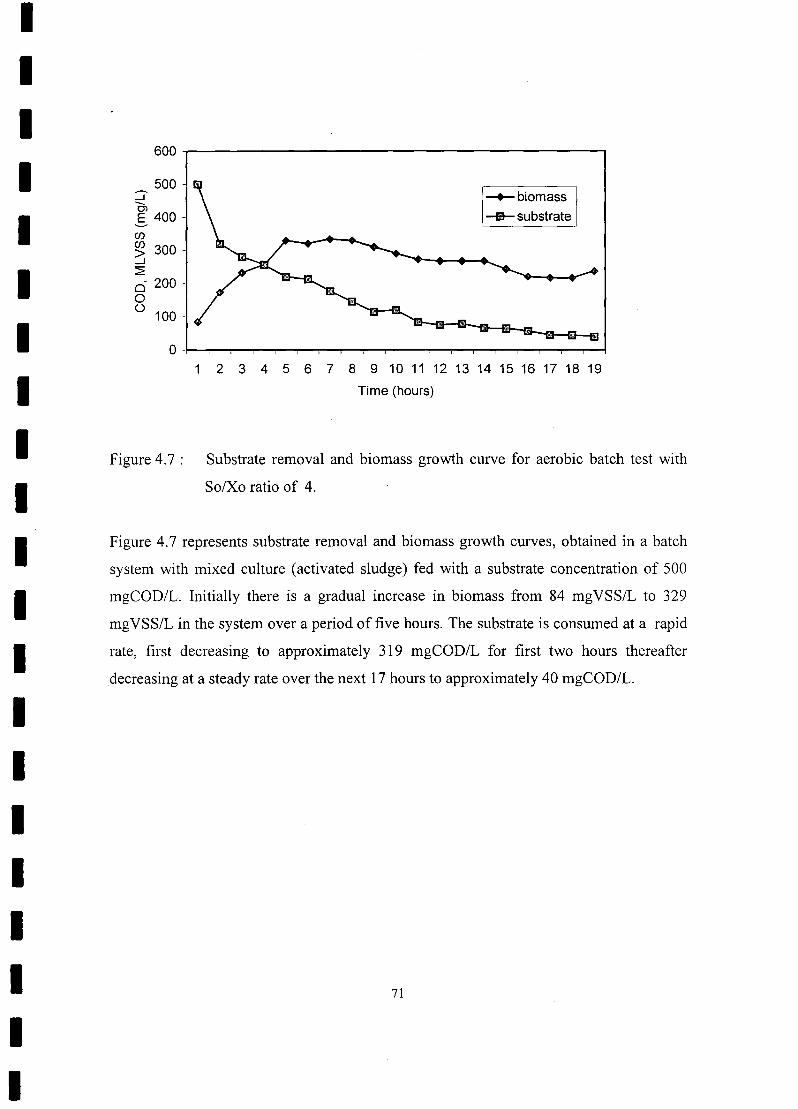
IIIIIIIIIIIIIIIIIIIII
600~--------------------------------------------~
500::::J-..OJE 400-~
-+-biomass_substrate
(f)(f)> 300-_J
~6200 -oo 100-
2 3 4 5 6 7 8 9 10 1112 13 14 1516 17 18 19
Time (hours)
Figure 4.7 : Substrate removal and biomass growth curve for aerobic batch test with
So/Xo ratio of 4.
Figure 4.7 represents substrate removal and biomass growth curves, obtained in a batch
system with mixed culture (activated sludge) fed with a substrate concentration of 500
mgCOD/L. Initially there is a gradual increase in biomass from 84 mgVSS/L to 329
mgVSS/L in the system over a period of five hours. The substrate is consumed at a rapid
rate, first decreasing to approximately 319 mgCOD/L for first two hours thereafter
decreasing at a steady rate over the next 17 hours to approximately 40 mgCOD/L.
71
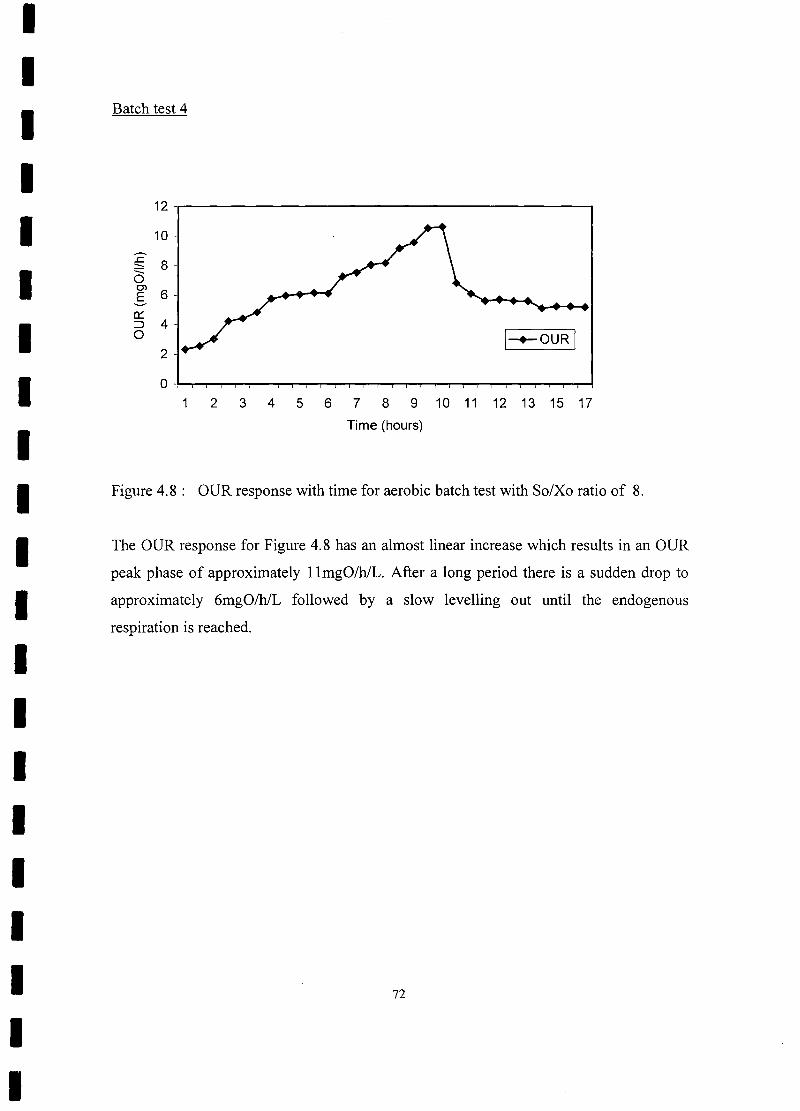
III Batch test 4
II
12 -
10 -
-..c 8 ---:::::0en
6 -E-0:::::::> 4 -0
2 -
o -,1
I-+-OUR I
IIII
2 3 4 5 6 7 8 9 10 11 12 13 15 17
Time (hours)
I Figure 4.8: OUR response with time for aerobic batch test with So/Xo ratio of 8.
II
The OUR response for Figure 4.8 has an almost linear increase which results in an OUR
peak phase of approximately IlmgOIhlL. After a long period there is a sudden drop to
approximately 6mgOlhlL followed by a slow levelling out until the endogenous
respiration is reached.
IIIIIII 72
II
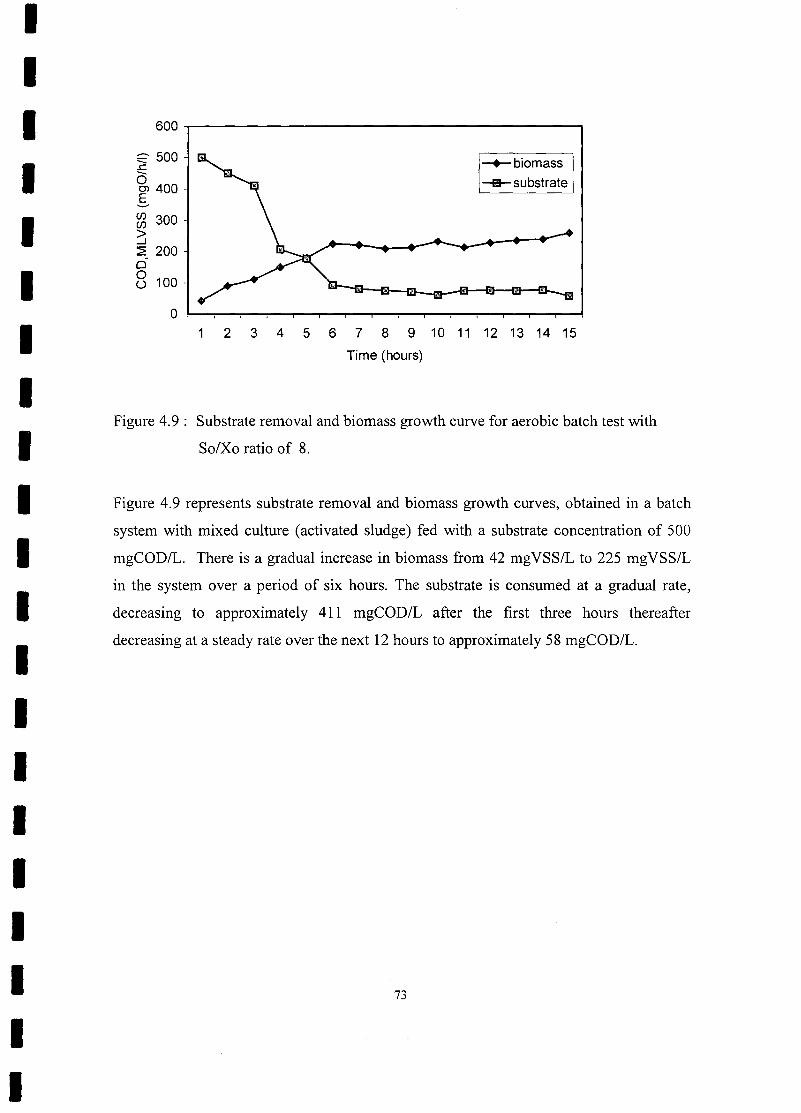
IIIIIIIIIIIIIIIIIIIII
600~----------------------------------------~
:=- 500-:c(5OJ 400-E........
-+-- biomass---fiB- substrate
(f) 300-(f)
>_J
~ 200-ooo 100-
2 3 4 5 6 7 8 9 10 11 12 13 14 15
Time (hours)
Figure 4.9: Substrate removal and biomass growth curve for aerobic batch test with
SolXo ratio of 8.
Figure 4.9 represents substrate removal and biomass growth curves, obtained in a batch
system with mixed culture (activated sludge) fed with a substrate concentration of 500
mgCOD/L. There is a gradual increase in biomass from 42 mgVSS/L to 225 mgVSS/L
in the system over a period of six hours. The substrate is consumed at a gradual rate,
decreasing to approximately 411 mgCOD/L after the first three hours thereafter
decreasing at a steady rate over the next 12 hours to approximately 58 mgCOD/L.
73
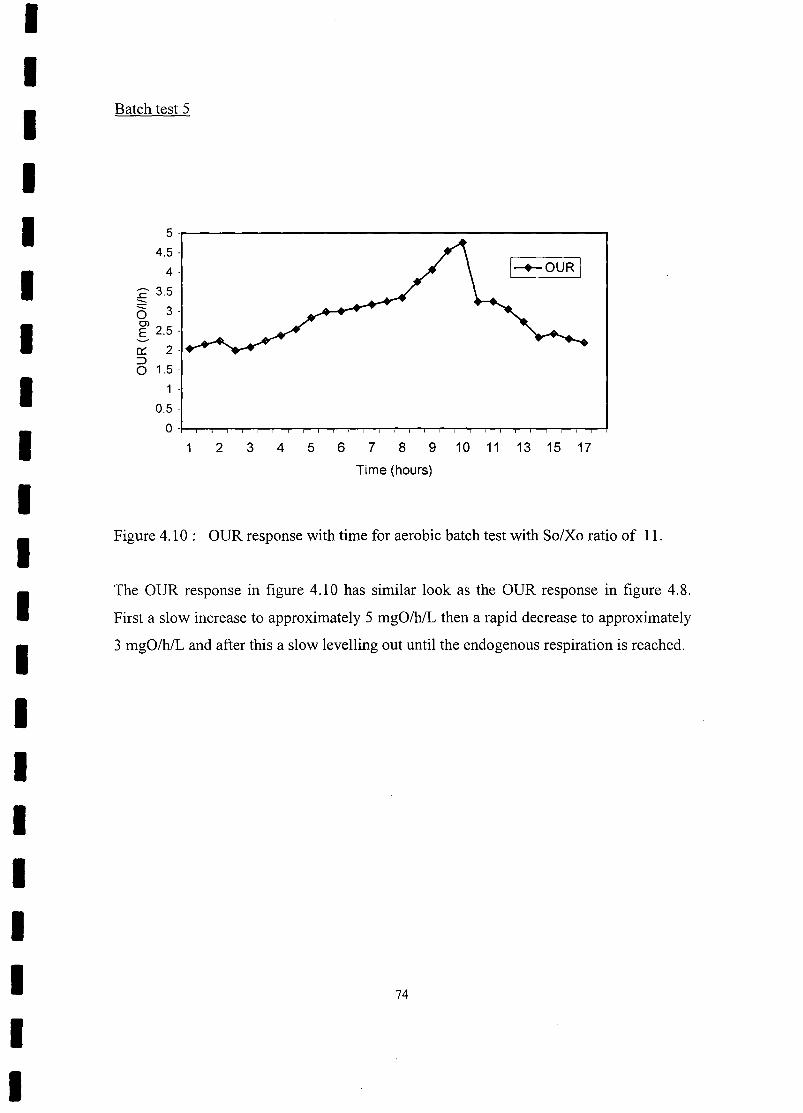
IIIIIIIIIIIIIIIIIIIII
Batch test 5
5"~--------------------------------------------~4.5·
4·
2" 3.5---o 3-O'lE 2.5-'-"
I-+-OUR I
a:: 2-::Jo 1.5"
1 "
0.5 "O-~, ~~~~~~~~~~-r~~~~-T~~~~~~~
1 2 3 4 5 6 7 8 9 10 11 13 15 17
Time (hours)
Figure 4.10: OUR response with time for aerobic batch test with So/Xo ratio of 11.
The OUR response in figure 4.10 has similar look as the OUR response in figure 4.8.
First a slow increase to approximately 5 mgO/hiL then a rapid decrease to approximately
3 mgO/hiL and after this a slow levelling out until the endogenous respiration is reached.
74
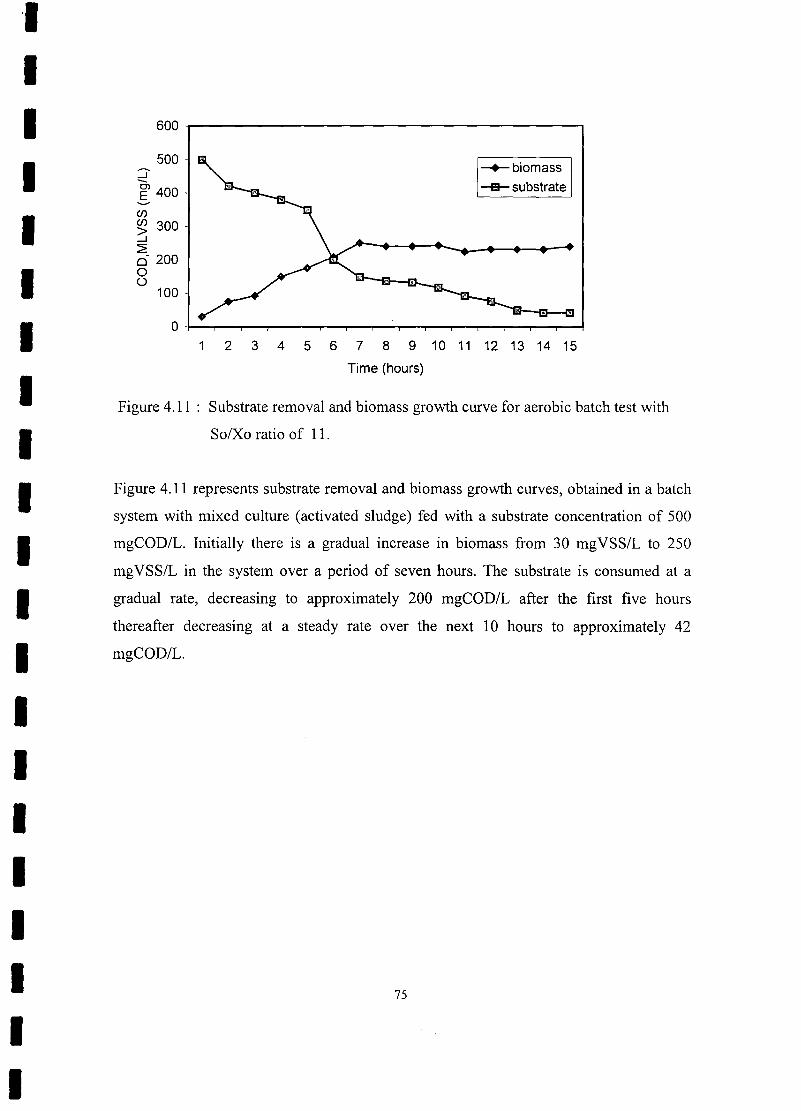
'IIIIIIIIIIIIIIIIIIIII
600 ~----------------------------------------~
100
-+-biomass_substrate
500 -::::J~ 400---C/)
~ 300 -_l
~6200 -oo
1 2 3 4 5 6 7 8 9 10 11 12 13 14 15
Time (hours)
Figure 4.11 : Substrate removal and biomass growth curve for aerobic batch test with
So/Xo ratio of 11.
Figure 4.11 represents substrate removal and biomass growth curves, obtained in a batch
system with mixed culture (activated sludge) fed with a substrate concentration of 500
mgCOD/L. Initially there is a gradual increase in biomass from 30 mgVSS/L to 250
mgVSS/L in the system over a period of seven hours. The substrate is consumed at a
gradual rate, decreasing to approximately 200 mgCOD/L after the first five hours
thereafter decreasing at a steady rate over the next 10 hours to approximately 42
mgCOD/L.
75
IIIIIIIIIIIIIIIIIIIII
4.4 Discussion
Storage or accumulation processes have been observed most usually during batch
cultivation when microbial growth is limited by low amount of utilizable carbon and
energy source, with respect to the innoculum concentration. Both Figure 4.3 and 4.5
show substrate removal and biomass growth curves with decreasing rates, typical for a
system without cell multiplication during exogenous substrate removal (Chudoba et al.,
1992). Thus at low So/Xo ratio (Fig. 4.3 and 4.5) a relatively high amount of biomass is
supplied with a low quantity of substrate. The initial energy level is then low as well, and
the increase in cell mass reflects only the increase in molecular polymer content in the
biomass. Consequently, weight changes do not necessarily reflect similar changes in cell
number. Due to the fact that the cell replication is a process energetically enough
demanding, no, or only negligible cell multiplication takes place at low So/Xo ratios
during exogenous substrate removal (Speece et al., 1973; Pitter and Chudoba, 1990;
Chudoba, 1991).
The first increase of the OUR curve (Fig 4.2 and 4.4) can be explained by the adaptation
of the organisms to this sudden much higher concentration of organic substrate or it could
be caused by growth of the biomass. Then the curve exhibits a sudden drop, indicating
that the added substrate has been removed from the wastewater. The sudden drop of the
OUR curve is then followed by a constantly decreasing respiration which is probable due
to the transformation of a secondary substrate (storage polymer) or it could be due to
more difficult access to the remaining primary substrate in the floes (Dircks et al., 1999).
Under high So/Xo (Fig. 4.7,4.9, and 4.11) the growth and substrate consumption curves
have sigmoidal shapes. The rates of biomass growth and substrate removal increase in the
initial stage of the batch experiment and after reaching a maximum, decrease (Chudoba et
al., 1992). The increase in cell number (cell multiplication) is indicated by an
acceleration of both biomass growth and substrate removal rates (Speece et al., 1973)
76
IIIIIIIIIIIIIIIIIIIII
Thus at high So/Xo ratios a relatively low amount of biomass is supplied with a higher
quantity of substrate. The initial energy level is higher, thus sufficient for different
synthetic reactions which take place during cell replication cycle, like enzyme, protein
and nucleic acids syntheses. Consequently, the number of microorganisms increases
during the exogenous substrate removal, which is indicated by increasing rates of
substrate removal and biomass growth. It is obvious that the portion of substrate
consumed for energy production by catabolic processes will be higher as well, because of
higher energetic demand of cell multiplication and maintenance processes (Chudoba et
al., 1992).
The OUR curves for aerobic batch test with high So/Xo ratios (Fig 4.6, 4.8 and 4.10)
exhibits an initial almost linear increase, this is probably due to the organisms adapting to
a very high concentration of substrate or it could be caused by the increase in biomass
(Dircks et al., 1999). Then the curve exhibits a sudden drop, indicating that the added
substrate has been removed from the wastewater. The sudden drop of the OUR curve is
followed by a tail phase due to the metabolism of exogenous slowly biodegradable COD
(Wentzel et al., 1995) or internal storage compounds (Dircks et al., 1999).
By only monitoring OUR it is not possible to tell how the cell has allocated its resources.
Small variations in cell maintenance have been shown to have a great influence on cell
growth (Stouthamer and van Versevld, 1987). Characteristically, adding nutrients to
batch cultures stimulates bacterial growth and alters the physiology of the bacteria
(Dawes and Sutherland, 1992). Pollard et al., (1998) have suggested that when excess
substrate was added to the batch reactor, bacteria progressively channelled more energy
into new cell synthesis and less into cell maintenance. The rapid increase in bacterial
growth was a normal response of bacteria that have been exposed to a sudden increase in
the nutrients. These changes were due to either bacteria adapting to the new nutrient
environment (Dawes and Sutherland, 1992), or the selection of sub-populations of
bacteria that were more able to efficiently use the higher concentration of nutrients
(Grady et al., 1996).
77
IIIIIIIIIIIIIIIIIIIII
Energy generated from the oxidation of substrate by the bacterial cell in the batch reactor
environment is allocated into a complex array of cellular functions. Oxygen utilization
rates (OUR) are related only to the initial energy generated from substrate oxidation. On
its own, the OUR does not indicate how the cell used the energy from substrate oxidation.
The energy resource may be allocated to cell maintenance, new cell synthesis,
endogenous polymers (that can again be oxidized) and secreted exopolymers (Jorand et
al., 1995)
More recently, others (Grady et al., 1996; Ellis et al., 1996) similarly explained that
SolXo ratios must be low for kinetic growth parameters to represent those of the original
treatment environment. The purpose of low ratios is to ensure minimal changes of the
bacterial physiological state and community structure away from those of the original
treatment process.
78
IIIIIIIIIIIIIIIIIIIII
4.5 Conclusion
It has been shown that So/Xo ratio is one of the most important parameters in batch
cultivation. It determines whether or not cell multiplication will take place during
exogenous substrate removal. According to the value of this ratio, it is possible to
estimate which processes will take place during batch experiment, accumulation of
storage polymers under low So/Xo ratios and cell multiplication under high So/Xo ratios
(Chudoba et al., 1992)
An SolXo ratio of 0.8 and 1.5 has proven suitable for representing the biomass of the
original treatment environment since negligible cell multiplication has occurred. It can
therefore be expected that the deviation from the community present in the original
treatment environment will be negligible and that the batch test conducted at these ratios
is representative of the biomass active in the full scale plant.
79
IIIIIIIIIIIIIIIIIIIII
CHAPTER 5
Determination of Microbial Population profiles at defined So/Xo ratios
5.1 Introduction
The activated sludge process comprises a complex enrichment culture of a mixture of
microorganisms. A wide range of bacteria can be isolated using conventional
microbiological techniques of sample dilution and spread plate inoculation. However,
these techniques are known to be bias the types of microorganisms that are obtained in
pure culture and many well known activated sludge bacteria such as Microthrix
parvicella cannot be isolated using them (Blackall et al., 1994). For most habitats the vast
majority of microorganisms are not cultivatable using standard techniques, leading
Amann et al. (1995) to suggest that these techniques created the "Great Plate Count
Anomaly".
Denaturing gradient gel electrophoresis provides a new approach for directly determining
the genetic diversity of complex microbial populations. The procedure is based on
electrophoresis of PCR-amplified 16S rDNA fragments in polyacrylamide gels
containing a linearly increasing gradient of denaturants. In DGGE, DNA fragments of the
same length but with different base-pair sequences can be separated (Fisher and Lerman,
1979).
Separation in DGGE is based on the electrophoretic mobility of a partially melted DNA
molecule in polyacrylamide gels, which is decreased compared with that of the
completely helical form of the molecule. The melting of fragments proceeds in discrete
so-called melting domains: stretches of base pairs with an identical melting temperature.
Once the melting domain with the lowest melting temperature reaches its melting
temperature at a particular position in the DGGE gel, a transition of helical to partially
80
IIIIIIIIIIIIIIIIIIIII
melted molecules occurs, the migration of the molecule will practically halt. Sequence
variation within such domains causes their melting temperatures to differ. Sequence
variants of particular fragments will therefore stop migrating at different positions in the
denaturing gradient and hence can be separated effectively by DGGE (Lerman et al.,
1984).
This technique has been successfully applied to identifying sequence variations in a
number of genes from several different organisms (Muyzer et ai., 1993). DGGE can be
used for direct analysis of genomic DNA from organisms with genomes of millions of
base pairs. This is done by transferring separation patterns to hybridization membranes
by capillary blotting with modified gel media (Borresen et al., 1988) or by electroblotting
(Lerman et al., 1984) followed by analysis with DNA probes. Alternatively, PCR can be
used to selectively amplify the sequence of interest before DGGE is used (Cariello et al.,
1988). In modification of the latter method, GC-rich sequences can be incorporated into
one of the primers to modify the melting behavior of the fragment of interest to the extent
to which all possible sequence variations can be detected (Myers et ai., 1985b; Muyzer et
al., 1993).
Denaturing gradient gel electrophoresis of enzymatically amplified 16S DNA encoding
rRNA (rDNA) was used as a molecular approach for the analysis of microbial population
shifts in five different batch tests with defined So/Xo ratios (previously discussed in
Chapter 4). Bacterial DNA was extracted at regular intervals, amplified by PCR and
microbial population profiles of each batch test were determined by DGGE.
81
IIIIIIIIIIIIIIIIIIIII
5.2 Methodology
5.2.1 DNA extractions
Samples of 25mL were taken in one-hour intervals from each of the five-batch test
previously discussed in chapter four. DNA was extracted using phenol chloroform and
precipitated with absolute ethanol (APPENDIX 4). The phenol chloroform extraction was
repeated four times until the interface after centrifugation appeared clear. These DNA
preparations were used as template DNAs in the PCR.
5.2.2 peR
The variable V3 region of 16S rDNA was enzymatically amplified in the PCR with
primers to conserved regions of the 16S rRNA genes. The nucleotide sequences of the
primers are as follows: primer 1, 5'-CGCCCGCCGCGCCGGCGGGCGGGGCGGG
GGCACGGGGGGCCTACGGGAGGCAGCAG-3'primer 2, 5'-ATTACCGCGGCTG
CTGG-3' corresponding respectively to positions (in E. coli) 341-358 and 534-517.
Primer 1 has at its 5' end a 40-nucleotide GC-rich sequence (GC clamp). A combination
of primers 1 and 2 was used to amplify the 16S rDNA regions (Muyzer et al., 1993). PCR
amplification was carried out on a Hybaid Thermal Cycler (Hybaid limited, Ashford,
UK) in O.2ml reaction volumes. The reaction mixture and PCR procedure is detailed in
APPENDIX 5.
5.2.3 DGGE
All DGGE gels were prepared using a D-gene denaturing gel electrophoresis system
(Bio-Rad, Hercules, Ca, USA). PCR products were loaded onto a 7.5% (wt/vol)
acrylamide gel (37.5:1, acrylamide: N,N'-methylene-bis-acrylamide) in 1 x TAE buffer
with gradients which were formed with 7.5% (wt/vol) acrylamide stock solutions. An
optimum denaturant range of 20% to 50% was determined. Parallel DGGE gels
82
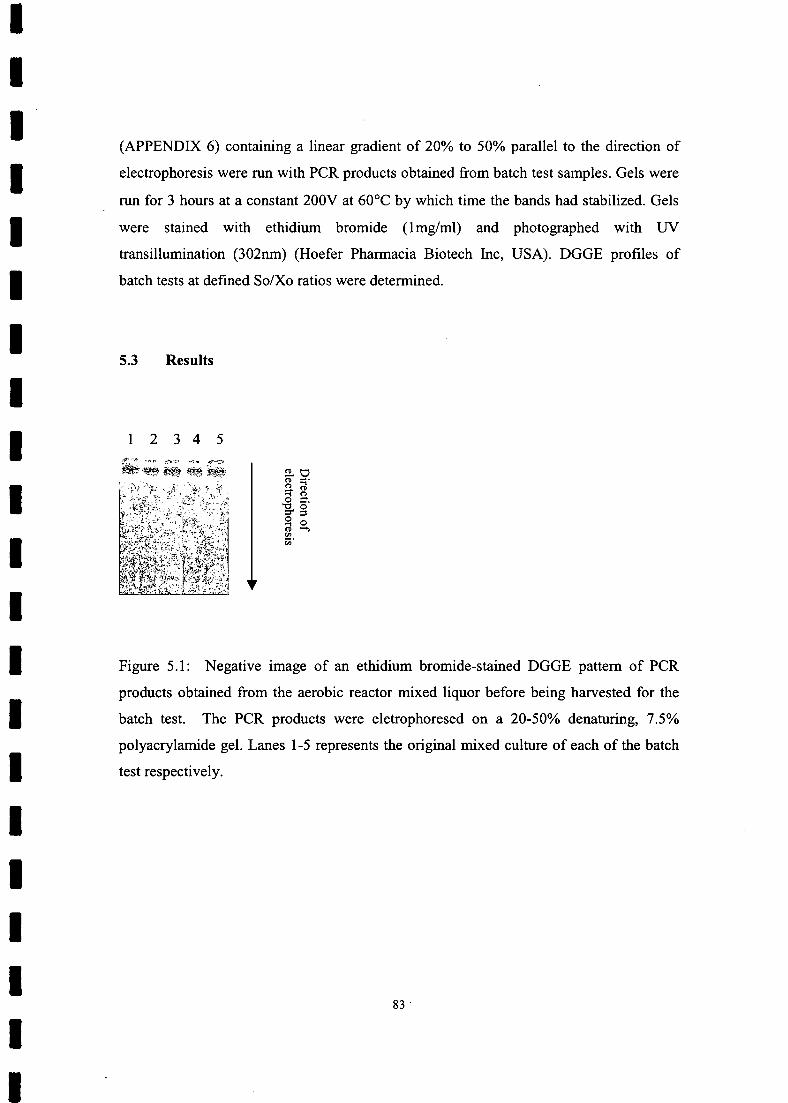
IIIIIIIIIIIIIIIIIIIII
(APPENDIX 6) containing a linear gradient of 20% to 50% parallel to the direction of
electrophoresis were run with PCR products obtained from batch test samples. Gels were
run for 3 hours at a constant 200V at 60°C by which time the bands had stabilized. Gels
were stained with ethidium bromide (lmg/ml) and photographed with UV
transillumination (302nm) (Hoefer Pharmacia Biotech Inc, USA). DGGE profiles of
batch tests at defined So/Xo ratios were determined.
5.3 Results
1 2 3 4 5
Figure 5.1: Negative image of an ethidium bromide-stained DGGE pattern of PCR
products obtained from the aerobic reactor mixed liquor before being harvested for the
batch test. The PCR products were eletrophoresed on a 20-50% denaturing, 7.5%
polyacrylamide gel. Lanes 1-5 represents the original mixed culture of each of the batch
test respectively.
83

IIII 2 3 4 5 6 7 8 9 10 11 12 13 14 15 16
I ~~ ~;.~~!' ~~~.{, t >
,-1'.
IIII
t!l~(1) (1)
o 0::j c.o 0'0 ::l::1"0Q ....,(1)CIlen'
Figure 5.2: Negative image of an ethidium bromide-stained DGGE pattern of peR
products obtain from a batch test with So/Xo ratio of 0.8. The batch test was sampled
every hour for a period of 16 hours. The peR products were eletrophoresed on a 20-50%
denaturing, 7.5% polyacrylamide gel. Lanes 1-16 represents the hourly intervals at which
the samples were taken.IIII
2 3 4 5 6 7 8 9 10 11 12 13 14 15 16
III
melCD =:;-o (1)_ 0
a g.o ::l::1"0Q ....,(1)CIlen'
Figure 5.3: Negative image of an ethidium bromide-stained DGGE pattern of peR
products obtain from a batch test with So/Xo ratio of 1.5. The batch test was sampled
every hour for a period of 16 hours. The peR products were eletrophoresed on a 20-50%
denaturing, 7.5% polyacrylamide gel. Lanes 1-16 represents the hourly intervals at which
the samples were taken.III
84
I
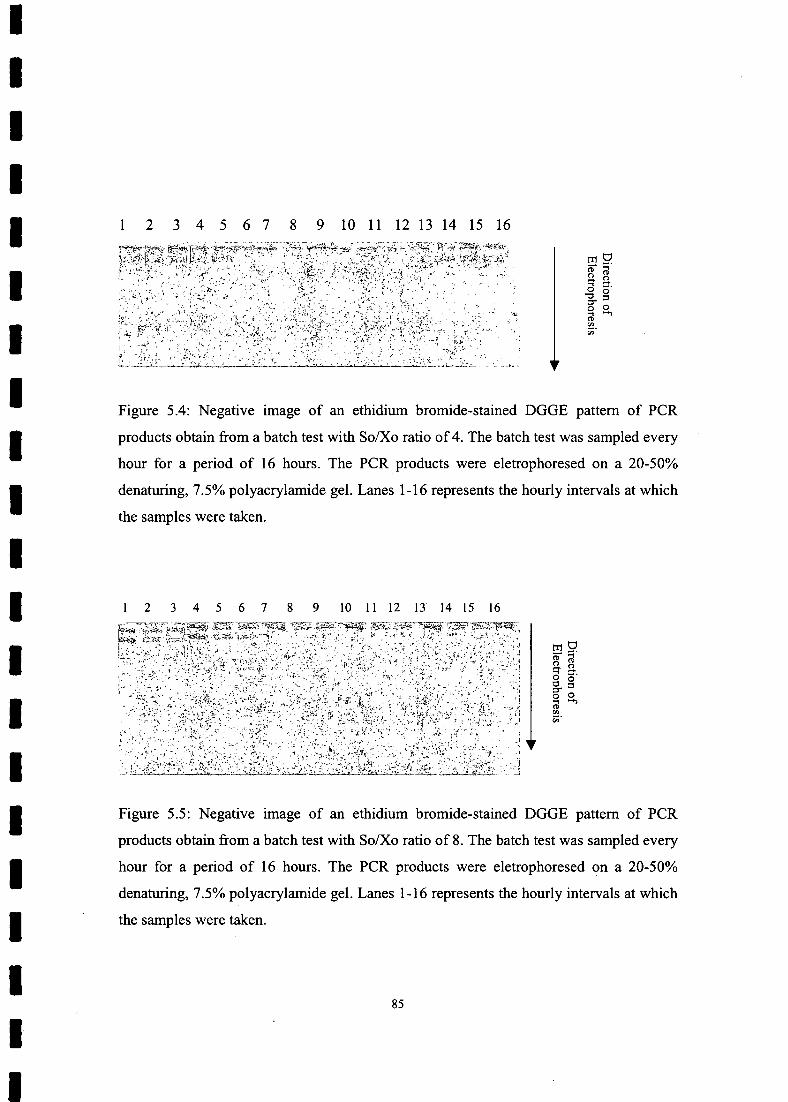
Figure 5.4: Negative image of an ethidium bromide-stained DGGE pattern of peR
products obtain from a batch test with So/Xo ratio of 4. The batch test was sampled every
hour for a period of 16 hours. The peR products were eletrophoresed on a 20-50%
denaturing, 7.5% polyacrylamide gel. Lanes 1-16 represents the hourly intervals at which
the samples were taken.
IIIII 1 2 3 4 5 6 7 8 9 10 11 12 13 14 15 16
IIIIIIII
2 3 4 5 6 7 8 9 10 11 12 13 14 15 16
IIII
-~
~~CD CDo 0q- :::t.o 0o ::s:1"05:l ...,CDen;n'
Figure 5.5: Negative image of an ethidium bromide-stained DGGE pattern of peR
products obtain from a batch test with So/Xo ratio of 8. The batch test was sampled every
hour for a period of 16 hours. The peR products were eletrophoresed on a 20-50%
denaturing, 7.5% polyacrylamide gel. Lanes 1-16 represents the hourly intervals at which
the samples were taken.II
85

IIIIIIIIIIIIIIIIIIII
2 3 4 5 6 7 8 9 10 11 12 13 14 15 16
Figure 5.6: Negative image of an ethidium bromide-stained DGGE pattern of PCR
products obtain from a batch test with So/Xo ratio of 11. The batch test was sampled
every hour for a period of 16 hours. The PCR products were eletrophoresed on a 20-50%
denaturing, 7.5% polyacrylamide gel. Lanes 1-16 represents the hourly intervals at which
the samples were taken.
The 16S rONA gene fragments amplified from mixed liquor batch test samples were
resolved using DGGE. DGGE analysis of the microbial communities present the original
treatment environment (Fig. 5.1) demonstrated the presence of three distinguishable
bands in the separation pattern. Based on the band intensities two prominent bands were
observed in lanes 1-5.
Figure 5.2 represents DGGE analysis of amplified 16S rONA fragments of mixed liquor
sampled at regular intervals from a batch test with So/Xo ratio of 0.8. Based on the band
intensities two prominent bands were observed throughout the batch test (Lanes 1-16).
The electrophoretic mobility and the intensities of the bands at So/Xo of 0.8 were similar
at SolXo ratio of 1.5 (Fig. 5.3), suggesting that the predominant populations of these
microbial communities were not detectably different. DGGE band patterns of both figure
5.2 and 5.3 share these predominant common bands evident in figure 5.1, suggesting that
86

IIIIIIIIIIIIIIIIIIIII
the microbial communities present in batch test 1 (SolXo =0.8) and batch tests 2 (SolXo=
1.5) are representative of the original treatment environment (Fig. 5.1).
Figure 5.4 represents the DGGE pattern of 16S rDNA fragments of mixed liquor sampled
at regular intervals from a batch test with So/Xo ratio of 4. The DGGE analysis of batch
test 3 (SolXo= 4) showed 2 common bands in lanes 1-5, after 5 hours a single band was
observed for the next seven hours (Lanes 6-12) thereafter 2 bands were observed for the
remaining of the batch test (Lanes 13-16). Similar banding patterns were found in batch
test 4 at So/Xo of 8 (Fig. 5.5), mixed liquor sampled for the first six hours showed two
common bands (Lanes 1-6) thereafter a single band was observed throughout the batch
test (Lanes 7-16). Figure 5.6 (SolXo =11) show 2 bands in the first hour (Lane 1) after
the first hour a single band was observed throughout the duration of the batch test (Lanes
2-16).
Figures 5.4, 5.5 and 5.6 show DGGE patterns of 16S rDNA fragments which are not
representative of the original treatment environment (Fig. 5.1). This is indicated by the
inconsistencies of the 2 prominent bands found in the original microbial population.
87
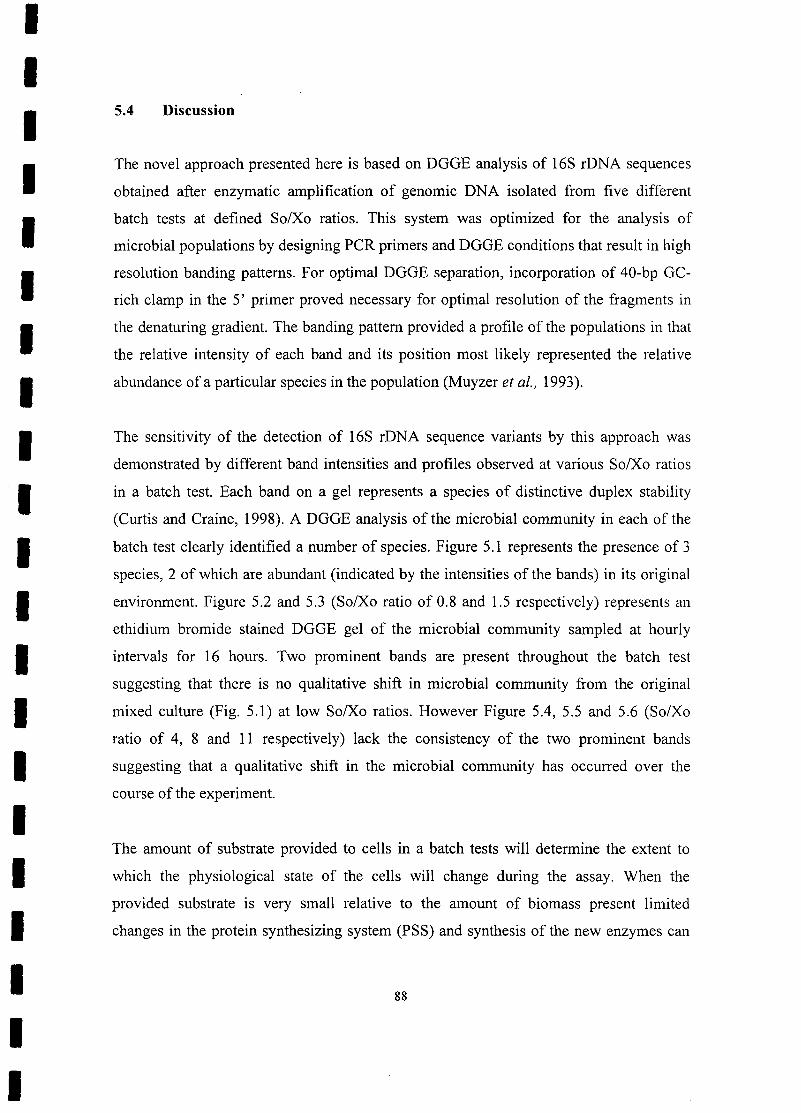
IIIIIIIIIIIIIIIIIIIII
5.4 Discussion
The novel approach presented here is based on DGGE analysis of 16S rDNA sequences
obtained after enzymatic amplification of genomic DNA isolated from five different
batch tests at defined So/Xo ratios. This system was optimized for the analysis of
microbial populations by designing PCR primers and DGGE conditions that result in high
resolution banding patterns. For optimal DGGE separation, incorporation of 40-bp GC-
rich clamp in the 5' primer proved necessary for optimal resolution of the fragments in
the denaturing gradient. The banding pattern provided a profile of the populations in that
the relative intensity of each band and its position most likely represented the relative
abundance of a particular species in the population (Muyzer et al., 1993).
The sensitivity of the detection of 16S rDNA sequence variants by this approach was
demonstrated by different band intensities and profiles observed at various So/Xo ratios
in a batch test. Each band on a gel represents a species of distinctive duplex stability
(Curtis and Craine, 1998). A DGGE analysis of the microbial community in each of the
batch test clearly identified a number of species. Figure 5.1 represents the presence of 3
species, 2 of which are abundant (indicated by the intensities of the bands) in its original
environment. Figure 5.2 and 5.3 (So/Xo ratio of 0.8 and l.5 respectively) represents an
ethidium bromide stained DGGE gel of the microbial community sampled at hourly
intervals for 16 hours. Two prominent bands are present throughout the batch test
suggesting that there is no qualitative shift in microbial community from the original
mixed culture (Fig. 5.1) at low So/Xo ratios. However Figure 5.4, 5.5 and 5.6 (SolXo
ratio of 4, 8 and 11 respectively) lack the consistency of the two prominent bands
suggesting that a qualitative shift in the microbial community has occurred over the
course of the experiment.
The amount of substrate provided to cells in a batch tests will determine the extent to
which the physiological state of the cells will change during the assay. When the
provided substrate is very small relative to the amount of biomass present limited
changes in the protein synthesizing system (PSS) and synthesis of the new enzymes can
88
IIIIIIIIIIIIIIIIIIIII
take place before the substrate is depleted and changes in the physiological state will be
minimal. This is evident in Figure 5.2 and 5.3 where there is no microbial community
shift at low So/Xo ratios. Conversely, when So/Xo ratio is sufficiently high (Fig. 5.5 and
5.6) to allow several cell divisions, synthesis of new PSS components can be significant
and a change in physiological state will occur. The kinetics measured under such
conditions will be more representative of the cultures ultimate capabilities than of its
capabilities prior to the test. Finally for all So/Xo values in between these two extremes
(Fig. 5.4), bacteria will achieve only a partial change of physiological state, with the
extent of the change depending on the ratio (Grady et al., 1996).
All the conclusions above have to be viewed in the context of the limitations of the
process of DNA extraction, PCR and DGGE which could lead to either over or under
estimation of the diversity. Underestimates could be caused by an inability to detect
organisms present in relatively low numbers or problems with cell lysis or primer
binding. Curtis and Craine, (1998) found that diversity assessments were sensitive to the
method of DNA extraction employed, this is probably because some organisms are easier
to lyse than others. Although bead beating was the best method available, it is possible
that some bacteria remained undetected because they were difficult to lyse.
Overestimates of diversity could be caused by a number of factors. Some bacteria may
have more than one rDNA sequence which could lead to one bacterium producing two
bands. Fortunately, this phenomenon is thought to be relatively rare in bacteria (Curtis
and Craine, 1998). The corruption of the DNA in the PCR process leading to the
formation of chimeric sequences (when the sequences of more than one bacteria is
incorporated into one PCR product) and heteroduplex fragments (where two similar but
different strands join together). The sequencing of DGGE products in a hot spring study
found evidence for heteroduplex formation (Ferris and Ward, 1997) in a minority of
bands; there was no evidence of chimera formation. Another study (Kowalachuk et al.,
1997) also found no evidence of chimeras and no true heteroduplex formation (the
degenerate primers caused multiple bands from a single template). Muyzer et al., (1993)
used DGGE analysis for detecting sequence differences in uncharacterized microbial
89
IIIIIIIIIIIIIIIIIIIII
populations and excluded the possibility of the creation of chimeric genes in the course of
rcn.
5.5 Conclusion
The use of contemporary molecular techniques for the analysis of the microbial
community of activated sludge provides a powerful means for detecting perturbations in
community structure. DGGE as a technique for studying microbial diversity is superior to
cloning and subsequent sequencing of peR-amplified rDNA or ribosomal copy DNA
fragments. First, it provides an immediate display of the constituents of a population in
both a qualitative and semiquantitative way, and second it is less time consuming and
laborious (Marsh et al., 1998)
This study focuses on the microbial community using primers previously designed for
the PeR-amplification of 16S rDNA (Muyzer et al., 1993). DGGE reveals two prominent
bands which are evident throughout batch test at low SolXo ratios (0.8 and 1.5), while at
high SolXo ratios (4,8 and 11) lack the consistency of the two prominent bands indicative
of a shift in microbial community structure. Therefore it can be concluded that suitable
SolXo ratios of 0.8 and 1.5 can be used for performing batch experiments as the
microbial community structure was maintained throughout the batch test, this implies that
biomass has utilized energy in storage and accumulation processes and the microbial
community under these conditions was representative of the original treatment
environment.
90
IIIIIIIIIIIIIIIIIIIII
CHAPTER 6
General Conclusion and Recommendations
The activated sludge process is the most widely used biological process for wastewater
treatment. Patented in 1914 by Ardern and Lockett, then industrialized in 1920 by John
and Atwood as a continuous process (Lilley et al., 1997). The activated sludge process
design and operation is mainly based on engineering and biological considerations.
However, the integration of novel molecular techniques to the activated sludge process
will enable improved design and optimization.
The novel approach that is presented here is based on DGGE analyses of 16S rDNA
sequences obtained after enzymatic amplification of genomic DNA extracted from
microbial populations. In this study DGGE was used to determine microbial community
profiles in batch tests at defined So/Xo ratios. At low So/Xo predominant common
DGGE bands were observed through the batch test. Therefore suggesting no shift in
microbial community structure away from its original environment. At high So/Xo ratios
there was a large qualitative shift in microbial community structure, this was indicative
by the absence of predominant DGGE bands (one or two bands) present in its original
microbial culture.
It has been shown that SolXo ratio is one of the most important parameters in batch
cultivation. It determines whether or not a shift in microbial community structure will
take place during exogenous substrate removal. So/Xo ratios of 0.8 and 1.5 have proven
to be suitable when conducting a respirometric batch test. This parameter ensures that the
microbial community structure will be representative of the original treatment
environment.
91
IIIIIIIIIIIIIIIIIIIII
In this study we have established defined technological parameters in which a batch test
could be conducted and have determined microbial community profiles apparent at low
and high SolXo ratios. One step further in the analysis of microbial populations will be to
identify these populations and determine correlations between community structure and
the function of the participating microbial consortia. The molecular techniques suggestive
in facilitating this approach are:
• DNA extractions
• peR
• DGGE
• Direct rDNA sequencing
• rDNA database
• Phylogenetic identification
92
IIIIIIIIIIIIIIIIIIII.1
REFERENCES
Avery OT, Macleod CM, and Macarty M (1944) Studies on the chemical nature of the
substance inducing transformation of pneumococcal types. Journ. Exper. Med. 79: 137-
158
Amann E, Brosius J and Ptashne M (1983) Vectors bearing a hybrid trp-lac promoter
useful for regulated expression of cloned genes in E. coli. Gene 25: 167-178
Amann RI, Ludwig Wand Schleifer K-H (1995) Phylogenetic identification and in situ
detection of individual microbial cells without cultivation. Microbiol. Rev. 59: 143-169
Bitton G (1995) Wastewater Microbiology. John Wiley and sons, New York
Blackall LL, Burell PC, Gwilliam H, Bradford D, Bond PL and Hugenholtz P (1998) The
use of 16S rDNA clone libraries to describe the microbial diversity of activated sludge
communities. Wat. Sci. Tech. 37 (4-5): 451-454
Blackall LL, Seviour EM, Cunningham MA, Seviour RJ and Hugenholtz P (1994)
Microthrix parvicella is a novel, deep branching member of the actinomycetes
subphylum. System. Appl. Microbiol. 17: 513-518
Boogerd FC, Appeldoorn KJ and Stouthamer AH (1983) Effects of electron transport
inhibitors and uncouplers on denitrification in Paracoccus denitrificans. FEMS
Microbiol. Lett. 20: 455-460
Borresen AL, Hovig E and Brogger A (1988) Detection of base mutations in genomic
DNA using denaturing gradient gel electrophoresis (DGGE) followed by transfer and
hybridization with gene specific probes. Mutat. Res. 202: 77-83
93
IIIIIIIIIIIIIIIIIIIII
BRL (1994) Instruction manual to the D Gene system. Bio-rad Laboratories. Hercules,
CA, USA.
Cariello NF, Scott lK, Kat AG, and Thilly WG (1988) Resolution of a missense mutant
in human genomic DNA by denaturing gradient gel electrophoresis and direct sequencing
using in vitro DNA amplification: HPRT Munich. Am. 1. Hum. Genet. 42: 726-734.
Casey TG, Ekama GA, Wentzel MC and Marais GvR (1995) Filamentous organism
bulking in nutrient removal activated sludge systems Paper 1: a historical overview of
causes and control. Waf. SA 21 (3): 231-237.
Casey TG, Wentzel MC and Ekama GA (1999) Filamentous organism bulking in nutrient
removal activated sludge systems Paper 9: Review of biochemistry of heterotrophic
respiratory metabolism. Wat. SA 25 (5): 409- 424
Chen A, Edgar DB and Trela 1M (1976) Deoxyribonucleic acid polymerase from the
extreme thermophile Thermus aquaticus. 1. Bacterioll27: 1550-1557
Chudoba P, Capdeville B and Chudoba 1 (1992) Explanation of the biological meaning of
the SolXo ratio in batch cultivation. Waf. Sci. Tech. 26 (3-4): 743-751
Chudoba P, Chang 1 and Capdeville B (1991) Synchronised division of activated sludge
microoganisms. Wat. Res. 25 (7): 817-822
Clark lW, Viessman Wlr and Hammer Ml (1977) Biological-Treatment Process, Water
Supply and Pollution Control. IEP, Dun-Donnelley Publisher, New York
Clayton lA, Ekama GA, Wentzel MC and Marais GvR (1989) Denitrification kinetics in
biological nitrogen and phosphorus removal systems treating municipal wastewaters. Res.
Rep. W95, Dept. of civil Eng., Univ. of Cape Town, Rondebosch, 7701, RSA
94
IIIIIIIIIIIIIIIIIIIII
Curtis TP and Craine NG (1998) The comparison of the diversity of activated sludge
plants. Wat. Sci. Tech. 37 (4-5): 71-78
Daigger GT and Grady CPL (1982) The dynamics of microbial growth on soluble
substrates. A unifying theory. Wat. Res. 16: 365-382
Dawes IW and Sutherland IW (1992) Microbial Physiology. Blackwell Scientific
Publications, Oxford.
Dircks K, Pind PF, Mosbzek and Henze M (1999) Yield determination by respirometric-
The possible influence of storage under aerobic conditions in activated sludge. Wat SA.
25 (1): 69-74.
Dunning AM, Talmud P and Humphries S (1988) Errors in the Polymerase Chain
reaction. Nucleic acid Res. 16: 10393
Ekama GA, Dold PL and Marais GVR (1986) Procedure for determining influent COD
fractions and the maximum specific growth rate ofheterotrophs in activated sludge. Wat.
Sci. Tech. 18: 91-114.
Ellis TG, Barbeau DS, Smets BF and Grady CPLI (1996) Respirometric technique for
determination of extant kinetic parameters describing biodegradation. Water Environ.
Res. 68 (5): 917-926.
Ferris MI, Muyzer G and Ward DM (1996) Denaturing gradient gel electrophoresis
profiles of 16s RNA-defined populations inhabiting a hot spring microbial mat
community. Appl. Env. Microbiol. 62: 340-346
Ferris MJ and Ward DM (1997) Seasonal distributions of dominant 16s rRNA defined
populations in a hot spring microbial mat examined by denaturing gradient gel
electrophoresis. Appl. Env. Microbiol. 63: 1375-1381.
95

IIIIIIIIIIIIIIIIIIIII
Fisher SG, and Lerman LS (1979) Length-independent separation of DNA restriction
fragments in two dimensional gel electrophoresis. Cell 16: 191-200
Fisher SG and Lerman LS (1983) DNA fragments differing by single-base pair
substitutions are separated in denaturing gradient gels: Correspondence with melting
theory. Proc. Natl. Acad. Sci. USA 80: 1579-1583
Fujimoto Y (1963) Kinetics of microbial growth and substrate consumption. J Theoret.
Bioi. 5: 171-191
Gaudy AF jr, Ramanathan M and Rao BS (1967) Kinetic behavior of heterogeneous
populations in completely mixed reactors. Biotechno!. & Bioeng. 9: 387-411
Giovannoni, S.J. (1991). The polymerase chain reaction, In E. Stackerbrandt and
M.Goodfellow (ed.), Nucleic acid techniques in bacterial systematics. John Wiley &
Sons, Chichester, England.
Giovannoni SJ, Britschgi TB, Moyer CL and Field KG (1990) Genetic diversity in
Sargasso Sea Bacterioplankton. Nature 345: 60-63
Grady CPLJ, Smets BF and Baebeau DS (1996) Variability in kinetic parameter
estimates: a review of possible causes and proposed terminology. Wat. Res. 30 (3): 742-
748.
Grunstein M and Hogness DS (1975) Colony hybridization: a method for the isolation of
cloned DNAs that contain a specific gene. Proc. Nat!. Acad. Sci. USA 72: 3961-3965
96
IIIIIIIIIIIIIIIIIIIII
Hammer MJ (1977) Water and Wastewater Technology. John Wiley and Sons, Inc,
Canada.
Hawkes HA (1963) The Ecology of Wastewater Treatment. Pergamon Press, London,
England.
Innis MA, Myambo KB, Gelfand DH and Brow MAD (1988) DNA sequencing with
Thermus aquaticus DNA polymerase, and direct sequencing of PCR amplified DNA.
Proc. Nat!. Acad. Sci. USA 85: 9436-9440
Jacob F and Monod J (1961) Genetic regulatory mechanisms in the synthesis of proteins.
Journ. Mol. BioI. 3: 318-356
Jorand F, Zartarian F, Thomas F, Block JC, Bottero JY, Villemin G, Urbain V and
Manem J (1995) Chemical and structural (2D) linkage between bacteria within activated
sludge floes. Wat. Res. 29 (7): 1639-1647.
Khorana HG (1966) Polynucleotide synthesis and the genetic code. Harvey lectures
1966-1967. Series 62. Academic press: New York, USA pp. 79-105
Kowalachuk GA, Stephen JR, Boer W de, Prosser Jl, Embley TM and Woldendorp JW
(1997) Analysis of ammonia oxidizing bacteria of the B subdivision of the class
Proteobacteria in coastal sand dunes by denaturing gadient gel electrophoresis and
sequencing of PCR-amplified 16s ribosomal DNA fragments. App!. Env. Microbiol. 63:
1489-1497
Lane DJ (1996) 16S/23S rRNA sequencing. In Stackebrandt E and Goodfellow M (eds),
Nucleic acid techniques in bacterial systematics. John Wiley and Sons: New York. pp
115-148
97

IIIIIIIIIIIIIIIIIIIII
Lane DJ, Stahl DA, Olsen GJ, Heller DJ and Pace NR (1985) Phylogenie analysis of the
genera Thiobacillus and Thiomicrospira by 5S rRNA sequences. J Bacteriol. 163: 75-81
Lehninger AL (1975) Biochemistry (2nd edn.). Worth Publishers Inc., New York, USA.
Lerman LS, Fisher SG, Bregman DB, and Silverstein KJ (1981) In RH Sarma (ed),
Biomolecular Steriodynamics. Adenine Press, Albany, New York, USA.
Lerman LS, Fisher SG, Hurley I, Silverstein K and Lumelsky N (1984) Sequence-
determined DNA separations. Annu. Rev. Biophys. Bioeng. 13: 399-423
Liebeskind M and Dohmann M (1994) Improved method of activated sludge biomass
determination. Wat. Sci. Tech. 29 (7): 7-13.
Lilley ID, Pybus PJ and Power SPB (1997) Operating manual for biological nutrient
removal wastewater treatment works. Water Research Commision Report No. TT 83/97
Marsh TL, Liu W-T, Forney LJ and Cheng H (1998) Beginning a molecular analysis of
the eukaryal community in activated sludge. Wat. Sci. Tech. 37 (4-5): 455-460.
Maxam AM and Gilbert W (1977) A new method for sequencing DNA. Proc. Nat!. Acad.
Sci. USA 74: 560-564
McKinney RE (1962) Microbiology for Sanitary Engineers. McGraw-Hill Book Co.,
New York, USA.
Muyzer G, Teske A, Wirson CO and Jannasch HW (1995) Phylogenetic relationship of
Thiomicrospira species and their identification in deep-sea hydrothermal vent samples by
denaturing gradient gel electrophoresis of 16s rDNA. Appl. Env. Microbiol. 59: 695-700
98
IIIIIIIIIIIIIIIIIIIII
Muyzer G and Waal EC (1994) Determination of the genetic diversity of microbial
communities using DGGE analysis of PCR-amplified 16S rDNA. In LJ Stal and P
Caumette (ed), Microbial mats: structure, development and environmental significance.
Springer- Verlag, Heidelberg, Germany.
Muyzer G, Waal EC and Uitterlinden AG (1993). Profiling of complex microbial
populations by denaturing gradient gel electrophoresis analysis of polymerase chain
reaction-amplified genes coding for 16s rRNA. Appl. Env. Microbiol. 59: 695-700
Myers RM, Fisher SG, Lerman LS and Maniatis T (1985a) Nearly all single base
substitutions in DNA fragments joined to a GC-clamp can be detected by denaturing
gradient gel electrophoresis. Nucleic Acids Res. 13: 3131-3145
Myers RM, Fisher SG, Maniatis T and Lerman LS (1985b) Modification of the melting
properties of duplex DNA by attachment of a GC-rich DNA sequence as determined by
denaturing gradient gel electrophoresis. Nucleic Acids Res. 13: 3111-3129
Myers RM, Maniatus T and Lerman LS (1987) Detection and localization of single base
changes by denaturing gradient gel electrophoresis. Methods Enzymol. 155: 501-527
Needham JR and Needham PR (1962) A Guide to the Study of Fresh-water Biology,
Holden-Day, Inc., San Francisco.
Nelson PO and Lawrence AW (1980) Microbial viability measurements and activated
sludge kinetics. Wat. Res. 14: 217-225
Nirenburg M and Leder P (1964) RNA codewords and protein synthesis: the effect of
trinucleotides upon the binding sRNA to ribosomes. Science 145: 1399-1407
Olsen GJ, Lane DJ, Giovannoni SJ, Pace NR and Stahl DA (1986) Microbial ecology and
evolution: a ribosomal RNA approach. Annu. Rev. Microbiol. 40: 337-365
99
IIIIIIIIIIIIIIIIIIIII
Olsen GJ and Woese CR (1993) Ribosomal RNA: a key to phylogeny. FASEB 7: 113-
123
Payne WJ (1973) Reduction of nitrogenous oxides by microorganisms. Bacteriol. Rev. 37
409- 452
Pitter P and Chudoba J (1990) Biodegradablity of organic substances in the aquatic
environment. CRC Press, Boca Raton, USA
Pollard PC, Steffens MA, Biggs CA and Lant PA (1998) Bacterial growth dynamics in
activated sludge batch assays. Wat. Res. 32 (3): 587-596.
Poole RK (1982) The oxygen reactions of bacterial cytochrome oxidases. TIBS (January)
32-34
Rao BS and Gaudy AF jr (1966) Effect of sludge concentration on various aspects of
biological activity in activated sludge. J Wat. Pollut. Control. Fed. 38 (5): 794- 812
Randall EW, Wilkinson A and Ekama GA (1991) An instrumentation for the direct
determination of oxygen utilization rate. Wat. SA 17 (1): 11-18
Rittmann BE, laspidou CS, Flax J, Stahl DA, Urbain V, Harduin H, van der Waarde JJ,
Geurkink B, Henssen MJC, Brouwer H, Klapwijk A and Wetterauw M (1999) Molecular
and modeling analysis of the structure and function of nitrifying activated sludge. Wat.
Sci. Tech. 39 (1): 51-60.
Russel DR and Bennet GN (1981) Characterization of the B-lactamase promoter of
pBR322. Nucleic acids Res. 9: 2517-2533
100
IIIIIIIIIIIIIIIIIIIII
Saiki RK, Gelfand DH, Stoffel S, Scharf SJ, Higuchi R, Horn GT, Mullis KB, and
Ehrlich HA (1988) Primer-directed enzymatic amplification of DNA with a thermostable
DNA polymerase. Science 239: 487-491.
Saiki RK, Scharf SJ, Faloona F, Mullis KB, Horn GT, Erlich HA, and Arnheim N (1985)
Enzymatic amplification of beta-globin genomic sequences and restriction site analysis
for diagnosis of sickle cell anemia. Science 230: 1350-1354
Sanger F, Nicklen S and Coulsen AR (1977) DNA sequencing with chain-terminating
inhibitors. Proc. Natl. Acad. Sci. USA 74: 5463-5467
Sapshead LM and Wimpenny JWT (1972) The influence of oxygen and nitrate on the
formation of the cytochrome pigments of the aerobic and anaerobic respiratory chain of
Micrococcus denitrificans. Biochim. Biophys. Acta. 267: 388- 397
Schmidt TM, Delong EF and Pace NR (1991) Analysis of a marine picoplankton
community by 16S rRNA gene cloning and sequencing. J Bacteriol. 173: 4371-4378
Sheffield VC, David RC, Lerman LS, and Myers RM (1989) Attachment of a 40-base-
pair G+C-rich sequence (GC-clamp) to Genomic DNA fragments by the polymerase
chain reaction results in improved detection of single-base changes. Proc. Natl. Acad.
Sci. USA 86: 232-236
Schroeder ED (1977) Water and Wastewater Treatment. McGraw-Hall Inc. USA
Smith HO, (1970) Nucleotide sequence specificity of restriction endonucleases. Science
205: 455-462
Southern EM (1975) Detection of specific sequences among DNA fragments separated
by gel electrophoresis. J Mol. Bioi. 98: 503-517
101
IIIIIIIIIIIIIIIIIIIII
Speece RE, Engelbrecht RS and Aukamp DR (1973) Cell replication and biomass in the
activated sludge process. Wat. Res. 7: 361-374
Stackebrandt E and Woese CR (1981) The evolution of prokaryotes. In: Molecular and
Cellular Aspects of Microbial Evolution. Charlie MJ, Collins JF and Moseley BEB (eds).
Vol. 32, Cambridge University Press, London. pp 1-31
Stahl DA, Lane DJ, Olsen GJ, and Pace NR (1985) Characterization of a Yellowstone hot
spring microbial community by 5S rRNA sequences. Appl. Environ. Microbial. 49: 1379-
1384.
Standard Methods (1985) Standard Methods for the Examination of Water and
Wastewater (16th edn) American Public Health Assoc., 1015 15th Str. NW, Washington
DC 20005, USA.
Steyn DJ, Toerien DF and Visser JH (1975) Eutrophication levels of some SA
impoundments II Hartbeesport Dam. Water SA 1(3): 93-101
Stouthamer AH and van Verseveld HW (1987) Microbial energetics should be
considered in manipulation metabolism for biotechnological purposes. Trends
Biotechnol. 5: 149-155
Stryer L (1981) Biochemistry (2nd edn.). WH Freeman & Co, San Francisco.
Tacon W, Cary N and Emtage S (1980) The construction and characterization of plasmid
vectors suitable for the expression of all DNA phases under the control of the E. coli
tryptophan promoter. Mo lec. Gen. Genet. 177: 427-438
Ubisi MF, Jood TW, Wentzel MC, and Ekama GA (1997) Activated sludge mixed liquor
heterotrophic active biomass. Water SA 23 (3): 239-248
102
IIIIIIIIIIIIIIIIIIII
-I
Vitousek PM (1997) Human Alteration of the Global Nitrogen Cycle: Causes and
Consequences. Issues in Ecology 1: 4-6.
Wagner M and Amann R (1997) Molecular techniques for determining microbial
community structures in activated sludge. In: Cleote TE and Muyima NYO (eds.)
Microbial community analysis: The key design of biological wastewater treatment
systems. I.A.W.Q scientific and technical report no.5. Cambridge University Press:
London. pp. 61-72.
Wentzel MC, Ekama GA and Marais GvR (1992) Processes and modeling of nitrification
denitrification biological excess phosphorus removal systems- a review. First IA WQ
Technical Tour Nutrient Removal and Anaerobic Digestion in South Africa. Volume one-
Nutrient Removal, 11-13 October, 1992
Wentzel MC, Mbewe A and Ekama GA (1995) Batch test for the measurements of
readily biodegradable COD and active organisms concentrations in municipal
wastewaters. Wat. SA 21 (2): 117-124
Wentzel MC, Ubisi MF and Ekama GA (1998) Heterotrophic active biomass component
of activated sludge mixed liquor. Wat. Sci. Tech. 37 (4-5): 79-87
Willison JC and John P (1979) Mutants of Paracoccus denitrificans deficient in c-type
cytochromes. J Gen. Microbiol. 115: 443- 450
Woese, CR. (1987) Bacterial evolution. Microbiol. Rev. 51: 221-271
Woese CR, Kandler 0, and Wheelis ML (1990) Towards a natural system of organisms:
Proposal for the domains archaea, bacteria, and eucarya. Proc. Natl. Acad Sci. USA 87:
4576- 4579.
103
IIIIIIIIIIIIIIIIIIIII
WRC (1984) Theory, Design and operation of nutrient removal Activated Sludge
processes. Water research Commission, PO Box 824, Pretoria 0001, South Africa.
Zhi-rong Hu, Wentzel MC and Ekama GA (2000) External nitrification in biological
nutrient removal activated sludge systems. Water SA 26 (2): 225-237
Zuckerkandl E and Pauling L (1965) Molecules as documents of evolutionary history. J
Theor. Bioi. 8: 357-366
104
IIIIIIIIIIIIIIIIIIIII
APPENDIX 1
Chemical Oxygen Demand (COD) Test(Standard methods, 1985)
Reagents
1.1 Standard potassium dichromate (K2Cr207) solution, O.250N
Dissolve 12,259g, K2Cr207 (primary standard grade) previously dried at 103°C
for 3 hours and then cooled in a desiccator, in distilled water and make up to
1000mL
1.2 Sulphuric acid (H2S04) reagent
Dissolve 15g of silver sulphate (Ag2S04) in 2500mL of concentrated «98%)
H2S04 using a magnetic stirrer. Dissolution takes place between 1 and 2 days.
1.3 Standard ferrous ammonia sulphate [Fe (NH4)2(S04)21O.05N
Dissolve 100g analytical grade Fe (N~)2(S04)2. 6H20 in distilled water using a
5L volumetric flask. Add 100mL of concentrated H2S04 and make up to 5000mL.
Standardization: Pipette 5mL of standard K2Cr207 (1.1) solution into a
Erlenmeyer flask, and dilute to 50mL with distilled water. Add 15mL of the
H2S04 (1.2) and allow to cool before titrating with Fe (NH4)2(S04)2 titrant, using
2 drops of ferroin indicator (1.4)
Normality Fe (N~)2(S04)2 = mL K2Cr207 * 0.25
mL Fe (NH4)2(S04)2
1.4 Ferrion indicator
Dissolve 1.485g 1,10-phenanthroline monohydrate, together with 0.695g
FeS04.7H20 in distilled water and dilute to 100mL.
1.5 Mercuric sulphate (HgS04) powder
105
IIIIIIIIIIIIIIIIIIIII
Procedure
1. Collect the correct number of clean, dry 250mL Erlenmeyer flasks with the
ground-glass 24/40 necks. Two flasks are used for each test. Include 2 extra flasks
if influent COD is being tested and 2 extra flasks if reactor or effluent COD is
being tested.
2. place approximately 0.04g HgS02 powder in each flask. This is the equivalent to
the volume of 2 match heads.
3. place 8-10 glass beads (± 3mm diameter) in each flask.
4. for each influent sample pipette 10mL of unfiltered influent into each of the two
flasks. Pipette 10mL of distilled water into each of the two flasks. (these are the
blanks)
5. add 5mL of K2Cr207 solution to each of the flasks.
6. in turn, carefully add 15mL of the H2S04 COD acid (1.2) to each flask, ensuring
that no vapour escapes from the flask. This is most easily done by pouring the
acid down the wall of the flask while the flask is tilted. Immediately attach the
flask to the jacket condenser.
7. once acid has been added to each flask ensure that the flasks are level on the
heating pad. Allow the contents of the flask to boil for 2 hours. Ensure that the
water flow rate in the condensers is swift enough to condense all vapour rising up
the condensers.
8. allow the flasks to cool to room temperature with the condensers still in position
9. pour approximately 80mL of distilled water through the top opening of each of
the condensers into the sample mixture, ensuring that the side walls of the
condensers are well washed.
10. remove the flasks from the condensers and the heating pad and add 2 drops of
ferroin indicator to each flask.
106
IIIIIIIIIIIIIIIIIIII
11. titrate with Fe (S04)2 (NH4) solution until one drop of titrant changes the solution
colour to reddish brown.
Calculation:
mg/L COD = (a-b)* N * 8000mL sample
where
a = average mL Fe (S04)2 (NH4) used to titrate blank of same volumeas sample
b = average mL Fe (S04)2 (NH4) used to titrate sample
N = normality of Fe (S04)2 (NH4)
107
IIIIIIIIIIIIIIIIIIIII
APPENDIX 2
Total Kjeldahl Nitrogen (TKN) Test
(Standard methods, 1985)
Reagents
2.1 Mercuric sulphate (HgS04) solution
Dissolve 40g red mercuric oxide (HgO) in 250mL of 1 H2S04: 5 water (50mL :
250mL) and dilute to 800mL with distilled water.
2.2 Sulphuric acid (H2S04)- mercuric sulphate (HgS04)
(K2S04) solution
Dissolve 333.75g K2S04 in 1800mL distilled water and add 500mL concentrated
- potassium sulphate
H2S04. Add 62.5mL HgS04 solution and dilute to 2500mL. This reagent
crystallizes at temperature lower than 14°C.
2.3 7N Sulphuric acid (H2S04)
Dilute 485mL concentrated H2S04 (>98%) in distilled water and make up to
2500mL with distilled water.
2.4 Digestion mixture
Mix the two solutions made up in 2.2 and 2.3 above to give 5000mL of digestion
mixture
2.5 Mixed indicator
Mix two volumes of 0.2% methyl red in 95% alcohol with 1 volume of 0.2%
methylene blue in 95% alcohol. This solution must be made fresh every 30 days.
108
IIIIIIIIIIIIIIIIIIIII
2.6 Boric acid (H3B03)
Dissolve 100g H3B03 in distilled water. Add 100mL of mixed indicator (or 40mL
blue and 80mL red), and dilute to SOOOmL.
2.7 Sulphuric acid H2S04 solution O.02N
Prepare a stock solution of O.IN H2S04 by diluting 2.8mL concentrated H2S04 to
1000mL. Dilute 200mL of the O.IN H2S04 stock solution to 1000mL with
distilled water to give a 0.02N stock solution. Standardize this solution as outlined
in section 102.3 (c) - Alkalinity of "Standard Methods", p.S4
2.8 Standard Sulphuric acid (H2S04) solution O.OOIN
Dilute 100mL of the 0.02N H2S04 stock solution to 2000mL to grve an
approximately O.OOlNH2S04 solution.
2.9 Sodium Hydroxide (NaOH)- sodium thiosulphate solution (Na2S203.5H20)
Dissolve SOOgNaOH and 2Sg Na2S203.SH20 in distilled water and make up to
1000mL. This procedure is done in a plastic container as the reaction is highly
exothermic.
Procedure
1. Pipette 2SmL influent sample or a SOmL reactor or effluent sample into a 2S0mL
Kjeldahl flask. Add 10mL digestion mixture (2.4) and 3 glass beads
(approximately 3mm diameter). Prepare a blank by placing a volume of distilled
water equal in volume to that of the sample with digestion mixture and beads, in a
second kjeldahl flask. Follow the same procedure for the sample and the blank.
2. digest the sample mixture on a heating pad until the sample is clear, and heat for
another 20 minutes.
3. Transfer the Kjeldahl flask to the micro steam distillation apparatus and allow to
cool for approximately 30 min.
109
IIIIIIIIIIIIIIIIIIIII
4. pipette 2SmL of H3B03 solution (2.6) into a 100mL Erlenmeyer flask and place
in position on the steam distillation apparatus with nozzle of the condenser
immersed in the solution.
5. add about 100mL of distilled water to the contents of the Kjeldahl flask to
dissolve the sediment.
6. add 10mL of the NaOH solution (2.9) to the contents of the Kjeldahl flask via the
top opening of the steam distillation apparatus, and immediately seal the
apparatus by placing the steam line in position.
7. Stearn distil until the volume of the H3B03 solution in the Erlenmeyer flask is
approximately 100mL.
8. Titrate the contents of the Erlenmeyer flask for the sample and the blank with
standardized 0.02N H2S04 (2.7).
Calculation
TKN mgN/L = (a-b)* N *14000
A
Wherea = mL O.OOINH2S04 for sample
b = mL O.OOINH2S04 for blank
N = actual normality ofO.OOIN H2S04
A = mL sample
110
IIIIIIIIIIIIIIIIIIII
~,
APPENDIX 3
Determination of MLSS and MLVSS
Determination of MLSS
1. Place 100mL of activated sludge mixed liquor in a centrifuge tube. Centrifuge at
4000 xg for 8 min
2. Discard the supernatant and quantitatively scoop the sludge into a pre-weighed
crucible.
3. place the crucible into a drying oven at 105°C and leave overnight. Remove from
oven and allow to cool in a dessicator.
4. Re-weigh crucible.
5. determine the MLSS according to the following calculation:
MLSS (g/L) = mass of (crucible + sludge) - mass of (crucible) in grams x 10
100mL
Determination of MLVSS
1. Place the pre-weighed crucible (from the MLSS determination) into a muffle
furnace
2. Ash at 550°C for 1 hour. Remove the crucible and allow to cool in dessicator.
3. Re-weigh the crucible.
4. Determine the MLVSS according to the following equation:
MLVSS (giL) = mass of (crucible + sludge) - mass of (crucible + ash) x 10
100mL
III
IIIIIIIIIIIIIIIIIIII[1
APPENDIX 4
DNA Extraction (Lane, 1996)
Reagents
DNA extraction buffer: O.2M Tris-HCI pH 8.5, 0.25M NaCI, 25mM EDT A
Phenol equilibrated with DNA extraction buffer (Sambrook et al., 1989)
Chloroform-isoamyl alcohol (24: 1, v/v)
20% SDS
3M NaOAc, pH 5.1
Acid washed glass beads. Soak glass beads in 6M HCI for 10 min. Rinse with
distilled water, checking pH paper until the pH is equivalent to that of fresh
distilled water. Bake the rinsed beads at 180°C until completely dry.
Procedure:
Fill the bead beating vial (Biospec products cat. no. 1083-2) one third with acid washed,
baked glass beads (0.1-0.15mm beads, Sigma chemical Co.). Add approximately 0.2g of
cell pellet (wet weight). Add 75011L of DNA extraction buffer and 5011L of 20% SDS.
Fill the remaining portion of the vial with buffer saturated phenol. Beat for 4 min in a
bead-beating machine at 4600rpm (biospec products, Mini-Beadbeater). Transfer the vial
to a heating block for 15 min at 60°C. Beat for a further 2 min. Spin in a microfuge at
4000rpm for 10 min to separate the organic and aqueous phases. Remove the aqueous
(top) phase to a clean microfuge tube. Add 40011L of buffer saturated phenol and vortex.
Add I0011L of chloroform-isoamyl alcohol and vortex. Spin in a microfuge at 4000rpm
for 10 min. Remove the top layer and repeat the phenol chloroform extraction three
times. Remove the top layer, add 1110 volume of 3M NaOAc (PH 5.1), and precipitate
with two volumes of ethanol at -20°C overnight. Air dry the pellet and resuspend in
50011LofTE buffer (PH 7.4). Store at -20°C until further use.
112
IIIIIIIIIIIIIIIIIII.II
APPENDIX 5
Polymerase Chain Reaction (Giovannoni, 1991)
Reagents:
10 X PCR reaction buffer: 50mM KCI, 10mM Tris-HCI pH 8.4, 2.5mM MgClz,
l Oflug/ml Gelatin, 0.05% (v/v) Nonidet-40.
50llM stock solution of primers
l Ong/ul of DNA template
2.0mM of nucleotide triphosphate solution (concentration of each nucleotide)
1 unit/ul of Taq polymerase
Reaction Mixture:
The reaction mixture is prepared in a 0.2ml microfuge tube by mixing l Ong/ul of DNA
template; 10llL of lOX PCR buffer; 65 III distilled water; 10111of 2.0mM nucleotide
triphosphates solution; 2111of 50llM stock solution of each probe. The reaction mixture is
then incubated at 94°C for 4 min to inactivate any contaminating proteases, followed by
the addition of 1III ofTaq polymerase (Iunit/ul). The final reaction volume is l Ouul,
Hybaid PCR Sprint Thermal Cycler program (Hybaid limited, Ashford, UK)
Stage 1 Step 1 94°C 4min xl
Stage 2 Step 1 94°C lmin
Step 2 53°C lmin x 35
Step 3 72°C 2min
Stage 3 Step 1 72°C 4min x I
Hold 4°C
113
IIIIIIIIIIIIIIIIIIIII
APPENDIX 6
DENATURING GRADIENT GEL ELECTROPHORESIS PROTOCOL
D GENE System (Bio-Rad Laboratories, Hercules Ca, USA)
Reagent preparation
40% Acrylamide/Bis (37.5:1)
Acrylamide 38 g
Bis-acrylamide 2 g
Add dH20 to 100mi. Filter through a Whatmann No.1 and store at 4
Preparation of 50 x DGGE/TAE buffer solution
Tris-Base: 242 g
Acetic acid, glacial 57.1 ml
0.5M EDTA, pH 8.0 100 ml
Mix and add dH20 to 1 liter. Autoclave for 20-30 mins. Store at room temperature
0% Denaturing Solution (100ml)
40% Acrylamide/bis (37.5:1)
50 x TAE buffer
dH20 ~
18.8 ml
2ml
100 ml
100% Denaturing solution (100ml)
40% Acrylamide/Bis (37.5:1) 18.8 ml
50 x TAE buffer 2 ml
Formamide (deionized) 40 ml
Urea 42 g
to 100 ml
114
IIII Denaturing Solution
I10% 20% 30% 40% 50% 60% 70% 80% 90%
Formamide 4 8 12 16 20 24 28 32 36(ml)Urea (g) 4.2 8.4 12.6 16.8 21 25.2 29.4 33.6 37.8
II 10% Ammonium Persulfate (Iml)
Ammonium Persulfate 0.1 g
1.0 mlI Mix and store at -20°C for about a month
II
D Gene Dye Solution (10ml)
Bromophenol blue 0.05 g
Xylene cyanol 0.05 g
1 x TAE buffer 10.0 mlI Store at room temperature.
II
1 x TAE Running Buffer (7 L)
50 x TAE buffer 140.0 ml
6860.0 ml
IIIIII 115
II
IIIIIIIIIIIIIIIIIIIII
Procedure
6.1 Assembling the Glass plate Sandwiches
Assemble the gel sandwich on a clean surface. Lay the long rectangular plate down first,
and then place the left and right spacers of equal thickness along the short edges of the
rectangular plate. For parallel gradient gels place the spacers so that the holes in the
spacers are at the top of the plate, facing inward and the grooved side of the spacer facing
upward or against the short glass plate. Place each clamp by the appropriate side of the
glass plate. Place the sandwich assembly in the alignment slot of the casting stand with
the short glass plate forward. Loosen the sandwich clamps and insert a D GENE
alignment card to keep the spacers upright.
6.2 Pouring gradients
Position the DGGE apparatus below the gradient maker (Model 475 Gradient delivery
system) about 30 em in order to generate enough of a gravity-gradient. Prepare the high
and low-density gel solution by pipeting the desired amounts into two disposable culture
tubes. Add 11100 of the total volume of 10% ammonium Persulfate and 111000 of the
total gel volume of TEMED to the tubes containing the gel solutions. Withdraw the high
and low-density gel solutions using a syringe. Place the high density and low-density
syringes into the respective syringe holders (high density side for top filling). Rotate the
cam wheel slowly and steadily to deliver the gel solution. It is important to cast the gel
solutions at a steady pace to avoid mixing of the gradients within the gel sandwich. Let
the gel polymerize for about 30-45 minutes.
6.3 Electrophoresis
When the running buffer has reached the correct temperature in the D GENE chamber,
the samples are ready to be loaded on the gel. Load samples into the wells using a pipette
and a sequencing-loading tip. Do not pierce the gel during sample delivery. Use about 8
ul of PCR product with 2f-LIof gel loading dye. Place the DGGE apparatus into the
prewarmed (60°C) tank. Run at 200V for 3 hours.
116
IIIIIIIIIIIIIIIIIIIII
6.4 Staining and photographing the gel
Remove the gel from the glass plate by gently grasping two comers and lifting off. Place
the gel into a dish containing 250ml of 1 x TAE buffer and 1001-11of 1mg/ml ethidium
bromide. Stain for about 1-2 minutes. After staining, carefully transfer the gel into a dish
containing 250ml of 1 x TAE buffer. Destain for 5-20 minutes. Photograph the gel on a
UV transilluminator with a Polaroid camera (Hoefer Pharmacia Biotech, USA).
117
IIIIII a
a)......C/)
;>..C/)
a)
I eo'"0.2
C/)
'"0a)
I ......e<:l;>.............Ue<:lU
I :.s0I-<a)e<:l....._o
I.......~0faa)-
Ie<:l
r- oC/)
~ ;>..I-<
"""" 0~ ~
Iz I-<
~ 0..D~ e<:l~ -< ~a)
I 1ac,
S0
Ic..i::'"0a)s::·a......
..D
I 0C/)......
'"3C/)
a)I-<
I b·aCl
It"-<r.Ll~co
I <E-<
III
~ f ...... ("<) t"- V) ...... 0\ V) V) ("<) 0\ ...... V) t"- ("<) -.::t V) 00 -.::t 00 V) 00 N -.::t ("<) V)
)::l 0 "<:t: ...... 0\ V) ...... ("<) 00 0 0\ V) ("<) ...... 0 t"- 0\ 0 V) r- oo \00 0 0 0 0 0\ 0 0 0 0 0\ 0\ 0\ 0\ 0\ 0\ 0\ 0\ 0\ 0\ 0 0 0 00 ("<)
("<)("<)
("<) ("<) N ("<) ("<) ("<) ("<)("<) N N N N N N N N N N ("<) ("<) ("<) ("<)
...;;.
~V) V) \0 t"- oo t"- V) V) -.::t 00 ("<) -.::t V)a) V) ("<) "<:t: "<:t: ("<) t"- oo t"- N;:l ("<) ("<) 00 ...... V) \0 0\ \0 "<:t: ~ ("<) "<:t: ("<) <'l -.::i -.::i
V) "<:t:S ...... ...... r-. -; N N ("<) V) V) N
5 \0 00 V) -.::t V) ("<) tri -.::t ("<) ("<) V) ("<)
~. a)
! u....... ...... -.::t V) 0\ N N ("<)..D ...... \0 0\ "<:t: N 00 0\ 00 N t"- <'l ...... ("<) 00 00 ...... ("<) N 0\ 00 ("<) V)("<) -.::t.." 0 N~ I-< ("<) ...... ...... N ...... ...... ...... 0 ...... ...... ...... 0 ...... N ...... 0 ...... ...... 0 ...... ...... ...... N N.... a)
eo: e<:l..........z; o.~ V) V) ("<) <'l ("<) ...... N V) ...... ...... ("<) ("<)
V)("<) ("<) "<:t: ("<) ("<)
V)("<) -.::t -.::t -.::t "<:t:
V)("<) ("<) ("<)
0 0 0 0 ...... 0 0 0 ...... 0 0 0 0 0 0 0 0 0 0 0 0 0 0s:: 0 0 0e<:l
~ N V) r- -.::t \0 ("<) N N 00 00 N -.::t N 00 00 \0 -.::t ("<) t"- 0\a) \0("<) 00 \0 \0
i ;:l ...... V) ("<) ...... ("<) t"- "<:t: 0\ V) 00 -.::t 0\ \0 0\ 00 -.::t V) 0 0 0 00
S N N N -.::i -.::i 0 -.::i ......("<) ("<) N ("<) ("<) N -.::t ("<) -.::t V) ...... V) V) -.::t V) V) -.::t -.::t
a)
~ ~ -.::t \0 V) -.::t t"- -.::t \0 00 V) -.::t -.::t \0 -.::t V) \0 -.::t V)0\ 0\ 0\ \0 00
a) N V) \0 <'l \0 ("<) V) 0\ "<:t: ("<) "<:t: r- V) 00 <'l ("<) V) V) V) 00 0 V) -.::tEo-< ;:l V)
~ 0 N t"- o V) V) t"- oo t"- 0\ ...... V) N N 0 r- V) -.::t N V) 00 t"- N ("<) Ns:: -.::t ("<) N ("<) N N N N N N -.::t N ("<) N N N N N N ("<) ("<) ("<)
.......
~
0\ 0 0 0 0 0 0 0 0 0 0 0 \0 0 \0 \0 0\ 00 V) 0 -.::t \0 0 0 V)V) V) 0 0 0 0 00 0 0 0 0 0 t"- ("<) \0 V) 00 t"- V) V) 00 N 0 0 0\0 0\ N 0\ ("<) ...... 0\ 0 ...... ...... V) r- V) -.::t t"- oo V) V) -.::t \0 0 -.::t N N ......N ...... N ...... N N ...... N N N N N N N N N N N N N N N N N N
......s:: 00 00 \0 -.::t N -.::t \0 "<:t: 00 -.::t -.::t -.::t N \0 N \0 \0 \0 \0 -.::t \0 N 00 V) Na) \0 \0 "<:t: 0\ "<:t: N N \0 <'l r- "<:t: ...... "<:t: "<:t: 0\ 0 ("<)
~
;:l V) ...... N ...... ...... ...... ...... -.::iS ("<) ("<) -.::t V) 0\ t"- -.::t \0 ("<) 00 00 0 -.::t ("<) ...... ("<) -.::t -.::t -.::t t"- -.::t 0\ N ("<) 0
-.::t -.::t -.::t -.::t ("<) ("<) V) \0 V) t"- -.::t -.::t -.::t ("<) -.::t r- \0a)
8 ~ 00 N 00 00 \0 \0 N <'l \0 00 -.::t \0 ("<) \0 \0 \0 N 00 00 00 \0 N "<:t:00
a) N ...... ("<) ("<) t"- V) 0 "<:t: r- V) ("<) ("<) t"- V) N N 00 ("<) \0;:l 0\ t"- \0 \0 0\ ...... \0 0\ N 0 t"- ...... -.::i t"- N 00 ("<) V) 0\ 0\ -e- 0\
...... 00 0\1§ -.::t 0\ ("<) ("<)
0\ V) 00 0\ 00 r- V) V) ("<)...... 00 0\ V) V) -.::t -.::t 0 0\
V) t"- V)
-.::t -.::t -.::t -.::t -.::t -.::t -.::t -.::t -.::t -.::t V) V)V) -.::t -.::t -.::t -.::t -.::t -.::t V) -.::t V) -.::t -.::t.......
~ -=C.J.... """' f'.l~ eo:
~
1a 1a 1a 1a 1a 1a 1a 1a 1a 1a 1a 1a 1a 1a 1a 1a 1a 1a I-< 1a 1a 1a I-<~ e<:l e<:l.... ::8 ::8 ::8 ::8 ::8 ::8 ::8 ::8 ::8 ::8 ::8 ::8 ::8 ::8 ::8 ::8 ::8 ::8 ::8 ::8 ::8 ::8 ::8eo:~ I I I I I I I I I I I I I I I I I I I I I I I...... N ("<) -.::t V) \0 t"- oo 0\ ...... N ("<) -.::t V) \0 r- oo 0\ ...... N ("<) -.::t V)
0 0 0 0 0 0 0 0 0 ...... ...... ...... ...... ...... ...... ...... ...... ...... N N N N N
00
IIIIIIIIIIIIIII ""0
Q)
::ls::
I "150(.)
Ir-
I <t:Q)
:0('j
f-<
IIII
l£) 0'1 "<T 0'1 0'1 0'1 ,......, "<T ,......,l£) \0 00 l£) 00 ~ -.::t:
,......, ,......,0'1 0'1 r- r-. C'l C'l \0 "<T ~ ,......,
l£) l£) \0 r-- l£) \0 \0 r- l£)
0\ \0 -.::t: 0'1 r- -.::t: 0 ,......, 0 0 0'1 r-0 0 0 0 0 0'1 0\ 0'1 0'1 0\ 0'1 0'1 0'1 0'1 0'1 0'1 0'1 00 00 00 00 0'1 0'1 0'1 0'1 0
,......,~ ~ ~ ~ ~ C'l C'l C'l C'l C'l C'l C'l C'l C'l C'l C'l C'l C'l C'l C'l C'l C'l C'l C'l C'l C'l ~ ~
l£) \0 "<T l£) \0 ,......, l£)l£)
l£) \0 r- OO r-. l£) l£) ~ r- \0 ,......, C"'! l£) -.::t: C'l -.::t: r- l£) \0l£) l£) 0'1 l£) \0 ,......, l£) \0 0'1 \0 -.::t: ~ \0 \0
l£) 00\0 ~ -.::t -.::t "<T 00 \0 r- OO r- l£) -.::t l£) ~ "<T r- l£) r- l£) 00 00 l£) ~ ~ l£) r-
r- l£) 00 r- r- l£) C'l "<T -.::t:l£) l£) \0 r- ,......, \0 l£) ~ r- ~ l£) C'l 0'1
,......,-.::t: ,......, C'l \0 -.::t:r- C'l -.::t: C'l l£) C'l 00 ~
,......, ,......, ,......, C'l ,......, ,......, ,......, ,......, ,......, ,......, ,......, ,......, ,......, 0 ,......, ,......, ,......, 0 ,......, ,......, ,......, 0 0 ~ 0 ,......,0
,......,
l£)C"'! C'l C'l ,......, ,......, ,......, ,......, ,......, ,......, l£) ,......, ,......, l£) ,......, "<T ,......, ,......, ,......, ,......, ,......, ,......, ,......, ,......, ,......, l£) ~ l£)
C"'! 0 ,......, ,......, ~ -.::t:0 0 0 0 0 0 0 0 0 0 0 0 0 0 0 0 0 0 0 0 0 0 0 0 0 0 0 0
\0 \0 "<T 00 00 "<T \0 00 C'l "<T \0 l£)C'l \0 r- en 00 r- en 0 en en -.::t: "<T en en en \0l£) "<T r= c---i -.::t ~ -.::t: 0 \0 r= r= r= 0 l£) r= r= r= ,......, 0 0 -.::t:l£) l£) -.::t l£) ~ \0 00 0 l£) 00 r- OO l£) ,......, "<T "<T l£),......, ,......,
~ 0'1 "<T "<T 0'1 \0 \0 -.::t: "<T -.::t: "<T 0'1 0'1 l£) -.::t: C'l \0 00 \0 l£) 0'1 0'1 \0 \0 0'1 r- OOr- ~ ~ l£) C'l \0 00 0 ~ \0 ,......, l£) ~ \0 r-,......,00 ~ 0 \0 C'l 0 0'1 0 0'1 ~ l£) ~ l£) 00 ,......,
0 ~ 0'1 -.:i 0 0'1 00 .~ ,......, 00 r- 0~ C'l C'l ~ C'l ~ ~ C'l ~ C'l ~ ~ ~ C'l "<T "<T ~ C'l ~ ~ C'l C'l ~ C'l C'l ~
0 "<T r- OO r- 0 0 0 00 0 l£) ~ 0 00 l£) 0 0 0 "<T 0 0 C'l 00 "<T 0 0 00 00 00 0'1 0'1 \0 "<T "<T l£) r- \0 ,......, ,......, "<T "<T "<T \0 C'l "<T 0 0 0 0'1 0'1 0 0 0 ,......, 00C'l 0 0 ,......, C'l l£) ~ C'l ~ "<T l£) C'l ~ ~ C'l C'l ~ ,......, C'l ~ C'l ~ l£) C'l "<T ,......, 0'1 C'lC'l C'l C'l C'l C'l C'l C'l C'l C'l C'l C'l C'l C'l C'l C'l C'l C'l C'l C'l C'l C'l C'l C'l C'l C'l C'l ,......, C'l
C'l 00 "<T \0 00 "<T C'l "<T C'l 00,......, 0'1 \0 ,......, 00 C'l l£) 0'1 00 C'l "<T C'l \0 0 \0 0 "<T "<T 00 0 \0 "<T "<T 00 00 0 0 ,......,l£) "<T \0 00 0 r- 0 ,......, 0'1 ~ "<T l£) r- l£) r- \0 r- \0 "<T 00 \0 00 00 \0 l£) \0 \0 \0l£) ~ "<T ~ l£) l£) l£) l£) "<T 0'1
"<T C'l \0 "<T 00 C'l C'l 00 \0 \0"<T C"'! r- -.::t: ~ 0'1 ~ 0 l£) \0 0 \0 "<T 0 0 0 C'l \0 \0 "<T 0 00 C'l \0 ,......, 0'1 C'l0'1 ~ ~ 0'1 l£) r- \0 \0 00 0 ,......, 00 l£) C'l "<T \0 l£) l£) ~ l£) 0'1 00 0 ,......, 0 ,......, 00 l£)
"<T \0 0 "<T l£) "<T 00 ~ r- ,......, "<T "<T l£) l£) l£) "<T "<T "<T "<T "<T "<T "<T l£) l£) l£) l£) "<T "<T"<T "<T l£) "<T "<T "<T "<T l£) "<T l£)
M -.:r II)
~ ~ ~ I-< ~ '! ~ !i~ ;~I~ 1~ ~ ~ t ~~
~ ~ ~ ~('j
I~::;E ::;E ::;E ::;E ::;EI I I I I
~ ~ I~ :f ~ ~\0 r- oo 0'1 ,......, l£) \0 00 ,......, ~ l£) r- oo ,......,C'l C'l C'l C'l ~ 0 0 0 0 0 ,......, ,......, ,......, ,......, ,......, ,......, ,......, ,......, C'l
IIIIIIIIIIIIIII
'"0a.>
I ::s~...........~0o
IIr-<
a.>:gI E-<
II-I
00 \D r- OO 0\ 00 00 l(')l(')
l(') M 0\ r- 0\ 0\ r- l(') M l(') r- 0\ C"l l(') 00 00 00 Mr- l(') \D r- OO M C"l 0 0 0 C"l 0\ r- c- C"l 0! 0 0! M ": r- r- 0\ M....... ....... ....... ....... ....... 0\ 0\ 0\ 0\ 0\ 0\ 0\ 0\ 0\ 0\ C"l 0\ ...... ...... C"l r-i C"l C"l C"l C"l C"l r-i .......M M M M M C"l C"l C"l C"l C"l C"l C"l C"l C"l C"l C"l M M M M M M M M M M M
\D 00 0\ 00 ....... l(') 00 r- ....... C"l C"l \D \D M 0\ \D C"l l(') \D \Dl(') 0\ 00 ...... 00 00 '<:t
r- 0 t'l(') 00 t' 0! t' 0
l(')
r- \D r- l(') 00 r- r- l(') \D M M M l(') M l(') 00 t' r- oo 00 0\ \D
....... l(') C"l \D C"l 00 '<:t C"l C"l \D 00 0! M 00 00 -e- 0\ C"l r- l(') 00 C"l \D r- 0\ \D .......0\ ...... C"l ...... M 00 ....... 0\ 00 l(')
M C"l M C"l ....... ....... ....... 0 ...... 0 ...... 0 ...... C"l ....... 0 0 ...... 0 0 0 ...... 0 0 ...... ....... 0
l(')l(') '<:t 00 \D l(') l(') l(') ...... l(') l(')
l(') l(') \D ....... l(') 0\ 00 l(')
0!l(') ...... '<:t \D .......
\D ....... .......0\ l(') M l(') M 0\ \D 00 0! ....... C"l l(') C"l
0 0 0 0 0 0 0 0 0 0 0 0 0 0 0 0 0 0 0 0 0 0 0 0 0 0 0 0
r- r- l(') '<:t r- oo l(')\D
l(') '<:t l(')l(') C"l M l(') r- '<:t '<:tC"l \D ": '<:t '<:t ": M ": \D 00 \D 0\
\D 0 '<:t M \D 0 r- 0\ l(') 0\ ...... l(') M ...... M M -<i 0-<i M l(') '<:t l(') l(') 0\
...... 00 r- oo 0 C"l M 0\ C"l M M C"i C"l M M M '<:t...... ....... ...... ......
\D M 00 '<:t 00 00 00 r- C"l r- \D l(') 00 \D \D 00 00 0\l(') 0\ 00 '<:t l(') ...... l(') C"'l '<:tl(') r- 0 0\ ": 00 00 0 \D l(') ": 0\ l(') l(') 0\ C"l r- oo r- 0 '<:t l(')
0 0\ 0 C"l 0 C"l 0 0\ 0 C"i 0 c-i C"l -<i 0 l(') 00 ...... r- 0 C"l l(') 0 00 l(') l(') C"lM C"l M M '<:t M C"l C"l M M M M M M M M M C"l M C"l C"l M C"l M C"l C"l C"l
00 0 -e- 0 r- 0 0 0 0\ 0 00 00 0\ 0 l(') C"l 0 0\ 0 00 0 0 0 0\ r- 0 00 0\0\ 0 M 00 00 00 0 0\ 00 0 C"l C"l 00 0 r- C"l C"l 00 0\ r- 0 0 0 0\ 00 0 0\ 00C"l r- 0 00 0\ 0\ C"l r- r- oo 00 00 \D ...... ....... C"l 00 \D r- \D 0\ r- \D 00 0\ 00 0 MC"l ...... C"l ....... ....... ...... C"l ...... ...... ...... ....... ....... ...... C"l C"l C"l ....... ...... ...... ....... ....... ...... ....... ...... ....... ...... C"l C"l
'<:t C"l 0! 00 '<:t \D '<:t \D r- ":l(') l(') '<:t \D l(') 0 '<:t \D C"l \D C"l 0 '<:t 00 \D 0\ C"l C"l \D '<:t 0 '<:t 00 C"l C"i\D ....... r- ......l(') M 0\ M r- r- \D r- r- r- r- l(') l(') 00 l(') l(') M \D \D r- r- \D '<:t
r- r- \D r- oo \D l(') '<:t \D C"l
'<:t \D '<:t 00 C"l C"l C"l 0000 r- \D l(') r- ...... 0 \D 0 '<:t 0 C"l 00 '<:t '<:t 00 C"l 0 '<:t 0 0 C"l \D ...... 0 00 \D ...... 00 0 l(') 0 00 0\ '<:t 0\ 0 r- \D \D '<:t '<:t 00 r- oo l(') '<:t l(') 00 0 '<:t 0 l(')
l(') '<:t 0\ '<:t M 0\ ...... '<:t '<:t '<:t '<:t l(') '<:t '<:t '<:t '<:t l(') '<:t -e- '<:t '<:t '<:t '<:t l(') l(') '<:t l(') '<:t'<:t '<:t '<:t '<:t l(') '<:t l(') '<:t
\C r-- ee
II~~~i~,~~~I!!~ I~ ~ ~ ~ ~ I!i~? ~ !~ l~'l~ l(') I~ r- ~ ....... M i~
l(') 18 l~C"l C"l C"l 0 0 0
oN
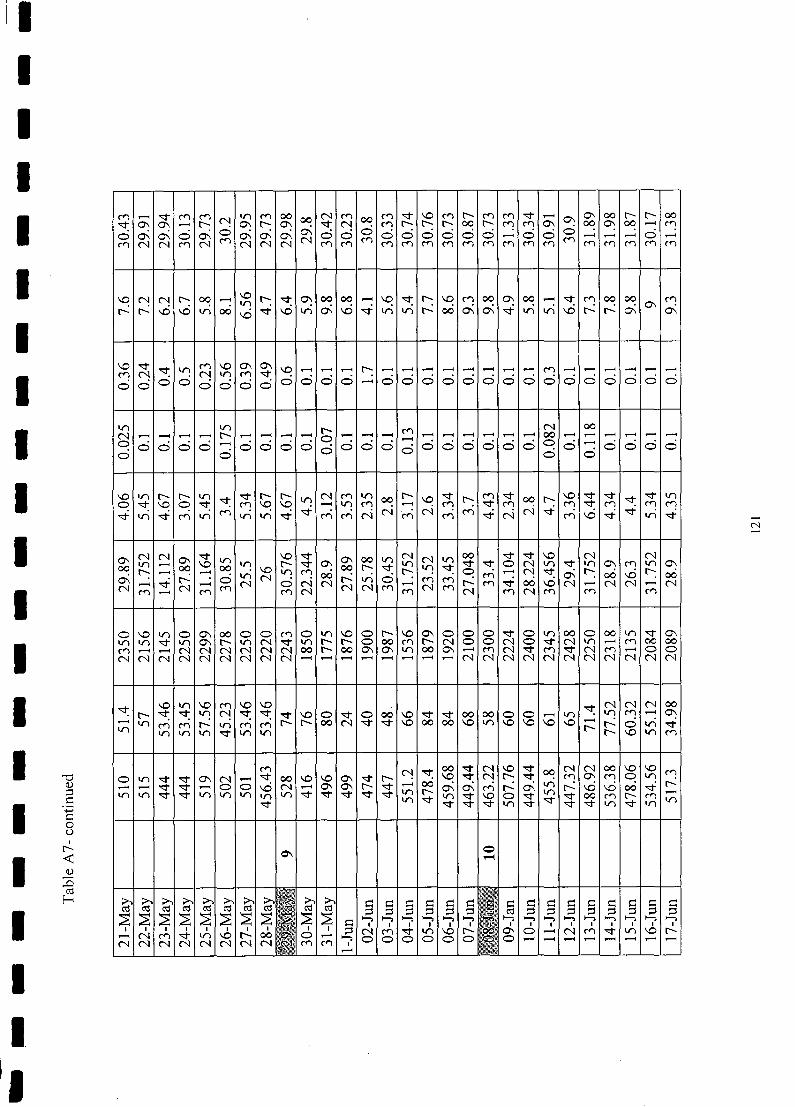
IIIIIIIIIIIIIII '"0
<!);::s
I .s.......t::0oIr-
I <t:<!)
:0rof-<
IIIII
M ........ -.::t M M 01tr) M 00 00 01 M 00 M -.::t \0 M t"- M M -.::t ........
0'\ 0'\ 00 t"- t"- OO-.:t: 0'\ 0'\ ........ t"- 0'\ t"- 0'\ -.::t 01 M t"- r- r-. OO r-. M M 0'\ 00 0'\ 00 ........ M
0 0'\ 0'\ ci 0'\ 0 0'\ 0'\ 0'\ 0'\ ci ci 0 0 0 0 0 0 ci ........ 0 ci 0 ........ ........ ........ ~ ........M 01 01 M 01 M 01 01 01 01 M M M M M M M M M M M M M M M r"l M
\0 01 C'l t"- OO ........ \0 r- -.:t: 0'\ 00 00 ........ \0 -.:t: t"- \0 M 00 0'\ 00 ........ -.:t: M 00 00 Mtr)..,f 0\ ..,f 0\ ..,f 0'\
t"- r- \0 \0 tr) 00 \0 \0 tr) \0 tr) tr) t"- OO 0'\ tr) tr) \0 t"- t"- 0'\ 0'\
\0 -.::t -.:t: tr) M \0 0'\ 0'\ \0 ........ ........ ........ t"- ........ ........ ........ ........ ........ ........ ........ ........ M ........ ........ ........ ........ ........ ........M C'l 01 tr) M -.:t:0 0 0 0 0 0 0 0 0 0 ci 0 ........ 0 0 0 0 ci ci 0 0 0 0 0 0 ci ci ci
tr) tr) r- M 01 0001 ........ ........ ........ ........ t"- ........ ........ ........ ........ 0 ........ ........ ........ ........ ........ ........ ........ ........ ........ ........ 00 ........ ........ ........ ........ ........ ........0 0 ci 0 0 ........ 0 0 0 0 ci 0 0 0 0 0 ci ci 0 0 0 0 ........ ci 0 ci 00 0 0 0 0
\0 tr) t"- r-- tr) -.:t: -.::t r- t"- tr) 01 M tr)00 r- \0 -.::t t"- M -.::t 00 t"- \0 -.::t -.::t -.::t -.::t tr)
0 -.::t \0 0 -.:t: M \0 \0 ........ tr) M ........ M -.::t M M -.:t: M M M
-.::t tr) -.::t M tr) M tr) tr) ..,f ..,fM M 01 01 M 01 M M ..q: 01 01 ..,f
M \0 -.::t -.::t tr) -.::t
0'\ 01 01 0'\ -.::t tr) \0 -.::t 0'\ 00 tr) 01 01 tr) 00 -.::t -.::t \0 01 01tr) ........ \0 tr) r- -.::t 0'\ tr) -e- -.::t 0 01 tr) -.:t: tr) 0'\ M tr) 0'\00 r- ........ 00 ........ 00 \0 tr) M 00 t-- -.:t: t"- tr) -.:t: 0 ........ C'l -.:t: t"- \C) t"-
0'\ t"- Otr) 01 00 t"- tr) 0 M M M 0'\ 00 00
01........ -.::t 01
........M 01 0 01 01 01 01 M
........ 01 M r- M -e- 00 \0 01 ........ 01 01 ........ 01M ........ M M 01 M 01 M 01 M M M
0 \0 tr) 0 0'\ 00 0 0 M 0 tr) \0 0 t"- \0 0'\ 0 0 0 -.::t 0 tr) 00 0 00 tr) -.::t 0'\tr) tr) -.::t tr) 0'\ t"- tr) 01 -.::t tr) r- t"- O 00 M r- 01 0 0 01 0 -.::t 01 tr) ........ M 00 00M ........ ........ 01 01 01 01 01 01 00 r- OO 0'\ 0'\ tr) 00 0'\ ........ M 01 -.::t M -e- 01 M ........ 0 001 01 01 01 01 01 01 01 01 ........ ........ ........ ........ ........ ........ ........ ........ 01 01 01 01 01 01 01 01 01 01 01
-.:t: \0 tr) \0 M \0 \0 -.:t: 01 01 01 00t"- -.:t: -.:t: tr) 01 -.:t: -.:t: -e- \0 0 -.::t 0 00 \0 -e- -.::t 00 00 0 0 ........ tr) tr) M ........ 0'\
........ tr) M M t"- tr) M M r- t"- OO 01 -.::t -.::t \0 00 00 \0 tr) \0 \0 \0 \0 ........ t"- O tr) ..,ftr)
tr) tr) tr) -.::t tr) tr) r- t"- \0 tr) M
M 01 -.:t: 00 -.::t 01 \0 -.::t 00 01 01 00 \0 \0 M0 tr) -.::t -.::t 0'\ 01 ........ -.:t: 00 \0 \0 0'\ -.::t c- \0 -.:t: 01 t"- -.:t: M 0'\ M 0 tr)
........ ........ -.::t -.::t ........ 0 0 \0 01 ........ 0'\ 0'\ c- -.::t ........ 00 0'\ 0'\ M t"- 0'\ tr) t"- \0 \C) 00 ..q: r-tr) tr) -.::t -.::t tr) tr) tr) tr) tr) -.::t -.::t -.::t -.::t -.::t tr) c- tr) -.::t \0 0 -.::t tr) -.::t 00 M t"- M
........-.::t tr) -.::t -.::t -.::t -.::t tr) -.::t -.::t -.::t -.::t tr) -.::t tr)
tr)
0\ <:>...-(
~~
i~
F~
F~ I!I~ § I=l § I=l § I=l ~ § I=l I=l § § I=l § I=l
I~ ;::s ;::s ;::s ;::s ;::s ;::s ;::s~ ~ ] ~ ~ ~ ~ ~ ~ ~ ~ ~ ~ ~ ~ ~ ~ ~11' I I I I I I I I I I I I I I I
~ ~01 M -.::t tr) \0 t"- 0'\ 0 ........ 01 M -.::t tr) \0 t"-........
~ M tr) r- ........ 0 0 0 0 0 0 0 ........ ........ ........ ........ ........ ........ ........ ........01 01 01 01 1M M I
........
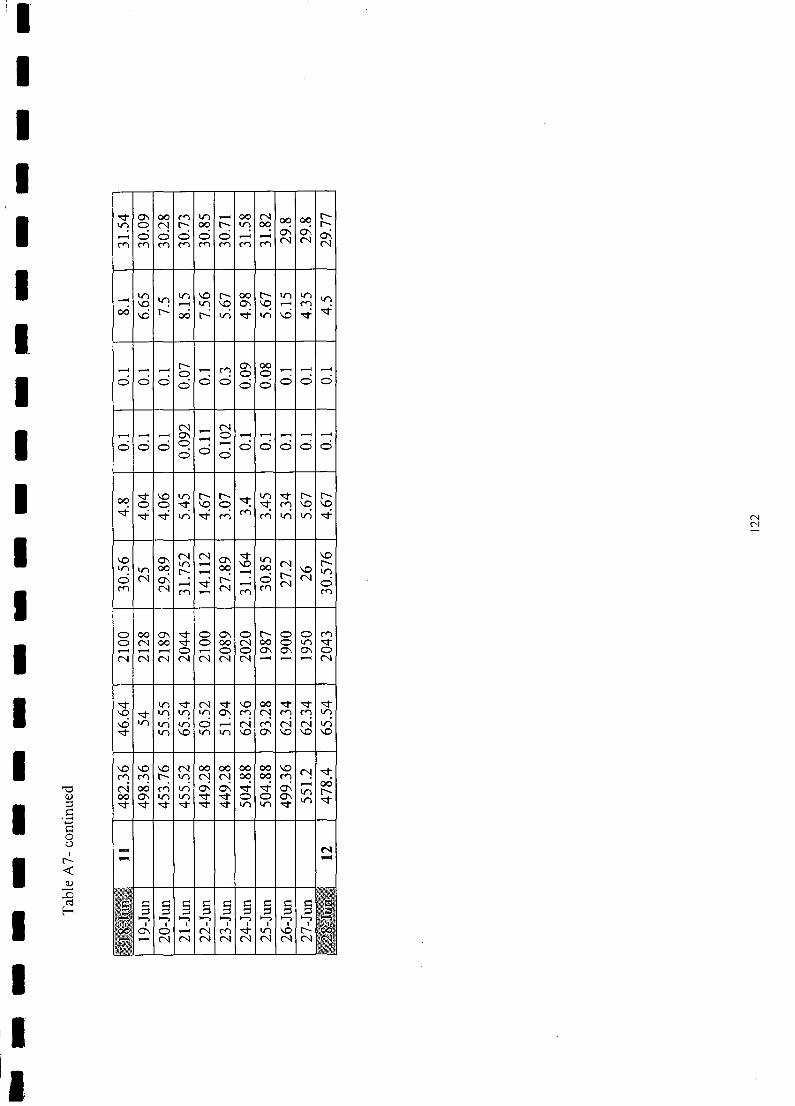
I IIIIIIIIIIIIIII
'"0<I)
I;:::sc..........c0(.)
I
I r---<C<I)
::0~
I t--<
IIII
"<:t 0\ 00 M V) ...... 00 C"'l 00 00 r---V) 0 C"'l r--- 00 r--- V) 00 0\ r---...... 0 c:) 0 0 c:) ...... ...... 0\ 0\M M M M M M M M C"'l C"'l C"'l
...... V)V)
V) \0 r--- 00 t-- V) V)V)
\0 ...... V) \0 0\ \0 ...... M00 \0 r--- 00 r--- V) "<:t V) \C) "<:t -.:t
...... ...... ...... r- ...... M 0\ 00 ...... ...... ......0 ~ 00 0 0 c:) 0 0 0 0 0 0 c:)
C"'l ...... C"'l...... ...... ...... 0\ ...... 0 ...... ...... ...... ...... ......0 0 0 0 ...... c:) 0 0 c:) c:)
0 0 0
00 "<:t \0 V) r--- r--- "<:t:V) "<:t r--- r---
0 0 "<:t: \0 0 "<:t: M \0 \0-e- -.:t -e- V) -.:t M M M V) V) -.:t
\0 0\ C"'l C"'l 0\ "<:t V) \0V) ...... \0 C"'l r---V) V) 00 r- ...... 00 ...... 00 \0 V)
0 C"'l 0\ ._t r- 0 r--- C"'lM C"'l ...... C"'l ......
M C"'l 0M ...... M M
0 00 0\ "<:t 0 0\ 0 c- 0 0 M0 C"'l 00 "<:t 0 00 C"'l 00 0 V) "<:t...... ...... ...... 0 ...... 0 0 0\ 0\ 0\ 0C"'l C"'l C"'l C"'l C"'l C"'l C"'l ...... ...... ...... C"'l
"<:t V) -e- C"'l "<:t \0 00 -e- "<:t "<:t\0 "<:t V) V) V) 0\ M C"'l M M V)
\0 V) V) V) c:) ...... C"'l M C"'l C"'l V)
"<:t V) \0 V) V) \0 0\ \0 \0 \0
\0 \0 \0 C"'l 00 00 00 00 \0 C"! "<:tM M c- V) C"'l C"'l 00 00 M
C"'l 00 M V) 0\ 0\ "<:t ._t 0\ ...... 00V) r---00 0\ V) V) "<:t "<:t 0 0 0\ V) "<:t"<:t "<:t -e- "<:t -e- "<:t V) V) "<:t
...-I M
...-I ...-I
C § § C § C § § C;:::s ;:::s ;:::s ;:::s,_, ,_, ,_, ,_, ,_, ,_, ,_, ,_, ,_,I I I I I I I I I
0\ 0 ...... C"'l M "<:t V) \0 r---...... C"'l C"'l C"'l C"'l C"'l C"'l C"'l C"'l