optimisation of machining parameters for turning operations based
TRANSCRIPT

Measurement 46 (2013) 1521–1529
Contents lists available at SciVerse ScienceDirect
Measurement
journal homepage: www.elsevier .com/ locate/measurement
Optimisation of machining parameters for turning operationsbased on response surface methodology
0263-2241/$ - see front matter � 2012 Elsevier Ltd. All rights reserved.http://dx.doi.org/10.1016/j.measurement.2012.11.026
⇑ Corresponding author. Mobile: +91 09426429122; fax: +91 02822293008.
E-mail addresses: [email protected] (A.J. Makadia), [email protected] (J.I. Nanavati).
1 Mobile: +91 09825027274.
Ashvin J. Makadia a,⇑, J.I. Nanavati b,1
a Darshan Institute of Engineering and Technology, Gujarat Technology University, At. Hadala, Rajkot-Morbi Highway, Nr. Water Sump,Rajkot 363 650, Gujarat, Indiab Faculty of Engineering and Technology, MS University, Kalabhavan, Baroda 390 001, Gujarat, India
a r t i c l e i n f o a b s t r a c t
Article history:Received 12 January 2012Received in revised form 9 November 2012Accepted 11 November 2012Available online 5 December 2012
Keywords:Response surface methodologySurface roughnessOptimisation
Design of experiments has been used to study the effect of the main turning parameterssuch as feed rate, tool nose radius, cutting speed and depth of cut on the surface roughnessof AISI 410 steel. A mathematical prediction model of the surface roughness has beendeveloped in terms of above parameters. The effect of these parameters on the surfaceroughness has been investigated by using Response Surface Methodology (RSM). Responsesurface contours were constructed for determining the optimum conditions for a requiredsurface roughness. The developed prediction equation shows that the feed rate is the mainfactor followed by tool nose radius influences the surface roughness. The surface roughnesswas found to increase with the increase in the feed and it decreased with increase in thetool nose radius. The verification experiment is carried out to check the validity of thedeveloped model that predicted surface roughness within 6% error.
� 2012 Elsevier Ltd. All rights reserved.
1. Introduction
Surface roughness is one of the most important require-ments in machining process, as it is considered an index ofproduct quality. It measures the finer irregularities of thesurface texture. Achieving the desired surface quality iscritical for the functional behaviour of a part. Surfaceroughness influences the performance of mechanical partsand their production costs because it affects factors, suchas friction, ease of holding lubricant, electrical and thermalconductivity, geometric tolerances and more. The ability ofa manufacturing operation to produce a desired surfaceroughness depends on various parameters. The factors thatinfluence surface roughness are machining parameters,tool and work piece material properties and cuttingconditions. For example, in turning operation the surface
roughness depends on cutting speed, feed rate, depth ofcut, tool nose radius, lubrication of the cutting tool, ma-chine vibrations, tool wear and on the mechanical andother properties of the material being machined. Evensmall changes in any of the mentioned factors may havea significant effect on the produced surface [1].
Therefore, it is important for the researchers to modeland quantify the relationship between roughness and theparameters affecting its value. The determination of thisrelationship remains an open field of research, mainlybecause of the advances in machining and materials tech-nology and the available modeling techniques. In machin-ability studies investigations, statistical design ofexperiments is used quite extensively. Statistical designof experiments refers to the process of planning the exper-iments so that the appropriate data can be analysed bystatistical methods, resulting in valid and objective conclu-sions [2]. Design methods such as factorial designs,response surface methodology (RSM) and taguchi methodsare now widely use in place of one factor at a timeexperimental approach which is time consuming andexorbitant in cost.
1522 A.J. Makadia, J.I. Nanavati / Measurement 46 (2013) 1521–1529
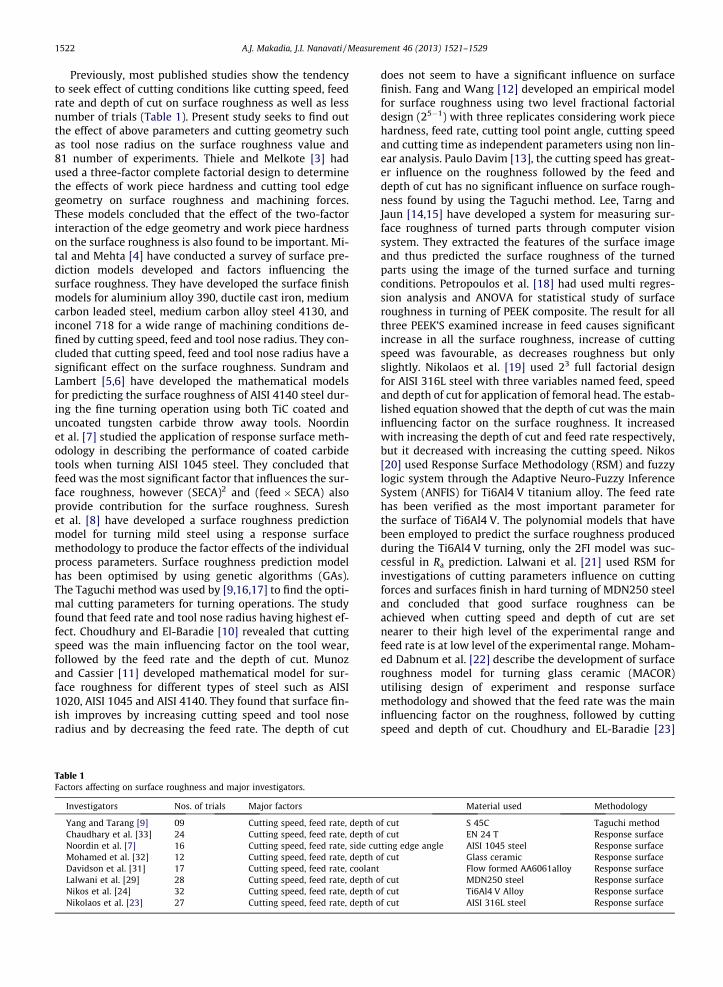
Previously, most published studies show the tendencyto seek effect of cutting conditions like cutting speed, feedrate and depth of cut on surface roughness as well as lessnumber of trials (Table 1). Present study seeks to find outthe effect of above parameters and cutting geometry suchas tool nose radius on the surface roughness value and81 number of experiments. Thiele and Melkote [3] hadused a three-factor complete factorial design to determinethe effects of work piece hardness and cutting tool edgegeometry on surface roughness and machining forces.These models concluded that the effect of the two-factorinteraction of the edge geometry and work piece hardnesson the surface roughness is also found to be important. Mi-tal and Mehta [4] have conducted a survey of surface pre-diction models developed and factors influencing thesurface roughness. They have developed the surface finishmodels for aluminium alloy 390, ductile cast iron, mediumcarbon leaded steel, medium carbon alloy steel 4130, andinconel 718 for a wide range of machining conditions de-fined by cutting speed, feed and tool nose radius. They con-cluded that cutting speed, feed and tool nose radius have asignificant effect on the surface roughness. Sundram andLambert [5,6] have developed the mathematical modelsfor predicting the surface roughness of AISI 4140 steel dur-ing the fine turning operation using both TiC coated anduncoated tungsten carbide throw away tools. Noordinet al. [7] studied the application of response surface meth-odology in describing the performance of coated carbidetools when turning AISI 1045 steel. They concluded thatfeed was the most significant factor that influences the sur-face roughness, however (SECA)2 and (feed � SECA) alsoprovide contribution for the surface roughness. Sureshet al. [8] have developed a surface roughness predictionmodel for turning mild steel using a response surfacemethodology to produce the factor effects of the individualprocess parameters. Surface roughness prediction modelhas been optimised by using genetic algorithms (GAs).The Taguchi method was used by [9,16,17] to find the opti-mal cutting parameters for turning operations. The studyfound that feed rate and tool nose radius having highest ef-fect. Choudhury and El-Baradie [10] revealed that cuttingspeed was the main influencing factor on the tool wear,followed by the feed rate and the depth of cut. Munozand Cassier [11] developed mathematical model for sur-face roughness for different types of steel such as AISI1020, AISI 1045 and AISI 4140. They found that surface fin-ish improves by increasing cutting speed and tool noseradius and by decreasing the feed rate. The depth of cut
Table 1Factors affecting on surface roughness and major investigators.
Investigators Nos. of trials Major factors
Yang and Tarang [9] 09 Cutting speed, feed rate, depth oChaudhary et al. [33] 24 Cutting speed, feed rate, depth oNoordin et al. [7] 16 Cutting speed, feed rate, side cuMohamed et al. [32] 12 Cutting speed, feed rate, depth oDavidson et al. [31] 17 Cutting speed, feed rate, coolantLalwani et al. [29] 28 Cutting speed, feed rate, depth oNikos et al. [24] 32 Cutting speed, feed rate, depth oNikolaos et al. [23] 27 Cutting speed, feed rate, depth o
does not seem to have a significant influence on surfacefinish. Fang and Wang [12] developed an empirical modelfor surface roughness using two level fractional factorialdesign (25�1) with three replicates considering work piecehardness, feed rate, cutting tool point angle, cutting speedand cutting time as independent parameters using non lin-ear analysis. Paulo Davim [13], the cutting speed has great-er influence on the roughness followed by the feed anddepth of cut has no significant influence on surface rough-ness found by using the Taguchi method. Lee, Tarng andJaun [14,15] have developed a system for measuring sur-face roughness of turned parts through computer visionsystem. They extracted the features of the surface imageand thus predicted the surface roughness of the turnedparts using the image of the turned surface and turningconditions. Petropoulos et al. [18] had used multi regres-sion analysis and ANOVA for statistical study of surfaceroughness in turning of PEEK composite. The result for allthree PEEK’S examined increase in feed causes significantincrease in all the surface roughness, increase of cuttingspeed was favourable, as decreases roughness but onlyslightly. Nikolaos et al. [19] used 23 full factorial designfor AISI 316L steel with three variables named feed, speedand depth of cut for application of femoral head. The estab-lished equation showed that the depth of cut was the maininfluencing factor on the surface roughness. It increasedwith increasing the depth of cut and feed rate respectively,but it decreased with increasing the cutting speed. Nikos[20] used Response Surface Methodology (RSM) and fuzzylogic system through the Adaptive Neuro-Fuzzy InferenceSystem (ANFIS) for Ti6Al4 V titanium alloy. The feed ratehas been verified as the most important parameter forthe surface of Ti6Al4 V. The polynomial models that havebeen employed to predict the surface roughness producedduring the Ti6Al4 V turning, only the 2FI model was suc-cessful in Ra prediction. Lalwani et al. [21] used RSM forinvestigations of cutting parameters influence on cuttingforces and surfaces finish in hard turning of MDN250 steeland concluded that good surface roughness can beachieved when cutting speed and depth of cut are setnearer to their high level of the experimental range andfeed rate is at low level of the experimental range. Moham-ed Dabnum et al. [22] describe the development of surfaceroughness model for turning glass ceramic (MACOR)utilising design of experiment and response surfacemethodology and showed that the feed rate was the maininfluencing factor on the roughness, followed by cuttingspeed and depth of cut. Choudhury and EL-Baradie [23]
Material used Methodology
f cut S 45C Taguchi methodf cut EN 24 T Response surface
tting edge angle AISI 1045 steel Response surfacef cut Glass ceramic Response surface
Flow formed AA6061alloy Response surfacef cut MDN250 steel Response surfacef cut Ti6Al4 V Alloy Response surfacef cut AISI 316L steel Response surface

A.J. Makadia, J.I. Nanavati / Measurement 46 (2013) 1521–1529 1523
developed surface roughness prediction model for turningof EN 24T utilising response surface methodology. The re-sults have revealed that the effect of feed is much morepronounced than the effect of cutting speed and depth ofcut on the surface roughness. However, a higher cuttingspeed improves the surface roughness.
The aim of the present study has been, therefore to de-velop the surface roughness prediction model of AISI 410steel with the aid of statistical method under various cut-ting conditions. By using response surface methodologyand (34) full factorial design of experiment, quadratic mod-el has been developed with 95% confidence level.
Table 2Input parameters and their levels.
Sr. no. Parameters Level 1 Level 2 Level 3
1 Cutting speed (v), m/min 220 250 2802 Feed (f), mm/rev 0.1 0.15 0.23 Depth of cut (d), mm 0.3 0.6 0.94 Tool nose radius (r), mm 0.4 0.8 1.2
Table 3Mechanical properties of AISI 410 steel.
Material properties AISI 410 steel
Physical density 7.74 g/cm3
Mechanical hardness, Rockwell B 99 HRBTensile strength, ultimate 510 MpaTensile strength, yield 310 MpaElongation of break 25%Modulus of elasticity 200 Gpa
2. Postulation of the surface roughness model
A popular model [1] to estimate the surface roughnesswith a tool having none zero radius is:
Ra ¼ 0:032f 2
rð1Þ
where Ra is the surface roughness (lm), f is the feed rate(mm/rev), r is the tool nose radius (mm).
To borrow the Taylor’s tool life equation in metal cut-ting, a functional relationship between surface roughnessand the independent variables under investigation couldbe postulated by:
Ra ¼ cf mrnvpdq ð2Þ
where Ra is the surface roughness, c the constant, f the feedrate (mm/rev), r the tool nose radius (mm), v the cuttingspeed (m/min), d the depth of cut (mm), m, n, p, q are theconstant that are to be derived.
A logarithmic transformation can be applied to convertthe non linear form of Eq. (2) into the following linearform:
lnðRaÞ ¼ lnc þm lnf þ n lnr þ p lnv þ q lnd ð3Þ
This is one of the data transformation methods used inempirical model building. Eq. (3) can be rewritten as a lin-ear model:
g ¼ b0 þ b1x1 þ b2x2 þ b3x3 þ b4x4 ð4Þ
where g is the true value of surface roughness on logarith-mic scale. For simplicity Eq. (4) can be written as:
y ¼ b0 þ b1x1 þ b2x2 þ b3x3 þ b4x4 ð5Þ
where y is the predicted surface roughness value after log-arithmic transformation and b0, b1, b2, b3 and b4 are esti-mates of the parameters b0, b1, b2, b3, b4 respectively.
With the experimental data, the analysis consisted ofestimating these four parameters for a first order model.
Table 4Model summery statistics.
Source Standard deviation R2 Ad
Linear 0.130411 0.9476 0.2FI 0.114851 0.9626 0.Quadratic 0.067053 0.9880 0.
If the first order model demonstrates any statistical lackof fit, a second order model can then be developed.
y ¼ b0 þ b1x1 þ b2x2 þ b3x3 þ b4x4 þ b12x1x2 þ b13x1x3
þ b14x1x4 þ b23x2x3 þ b24x2x4 þ b34x3x4 þ b11x21
þ b22x22 þ b33x2
3 þ b44x24 ð6Þ
A second order empirical regression model is requiredwhen the true response function is non linear andunknown.
3. Experimental work
In this study, cutting experiments are planned using 3level full factorial experimental design. Machining testsare conducted by considering four cutting parameters: cut-ting speed (v), feed rate (f), depth of cut (d), and tool noseradius (r). Total 34 = 81 cutting experiments are carriedout. Low-middle-high level of cutting parameters in cut-ting space of three level full factorial experimental designare shown in Table 2. Ranges of cutting parameters are se-lected based on shop floor. All the experiments were car-ried out on Jobber XL model made by Ace design, CNClathe machine with variable spindle speed 50–3500 RPMand 7.5 KW motor drive was used for machining tests. Sur-face finish of the work piece material was measured bySurf test model No. SJ-400 (Mitutoyo make).The surfaceroughness was measured at three equally spaced locationsaround the circumference of the work pieces to obtain thestatistically significant data for the test. In the presentwork, the work piece material was the AISI 410 steel. Thismaterial has good wear and corrosion resistance and usedfor the manufacturing of nozzle, valve parts and impeller ofsubmersible pump. A mechanical property of the material
j. R2 Pred. R2 PRESS
9449 0.9407 1.463329572 0.9528 1.164649854 0.9825 0.43136 Suggested

Table 5Estimated regression coefficients for roughness (Ra).
Term Coeff. SE Coeff. T P
Constant 0.11407 0.022351 49.844 0.000Cutting speed (v) �0.05481 0.009125 �6.007 0.000Feed (f) 0.50981 0.009125 55.871 0.000Depth of cut (d) 0.04407 0.009125 4.830 0.000Nose radius (r) �0.4100 0.009125 �44.931 0.000Speed � speed 0.0837 0.015805 5.296 0.000Feed � feed �0.11241 0.015805 �7.112 0.000Depth of cut � depth of cut �0.01185 0.015805 �0.750 0.456Nose radius � nose radius 0.12259 0.015805 7.757 0.000Cutting speed � feed �0.02528 0.011176 �2.262 0.027Cutting speed � depth of cut 0.01472 0.011176 1.317 0.192Cutting speed � nose radius 0.01194 0.011176 1.069 0.289Feed � depth of cut 0.01417 0.011176 1.268 0.209Feed � nose radius �0.0950 0.011176 �8.501 0.000Depth of cut � nose radius �0.00556 0.011176 �0.497 0.621
1524 A.J. Makadia, J.I. Nanavati / Measurement 46 (2013) 1521–1529
is given in Table 3. In this study, ceramic inserts (suppliedby Ceratizit) were used. Inserts with ISO codeTNMG160404 EN-TMF, TNMG 160408 EN-TM and TNMG160412 EN-TM with different nose radius (60� triangularshaped inserts) were used. The inserts were mounted ona commercial tool. The procedure of experimental schemeis shown in Fig. 8.
4. Result and discussion
The analysis of variance (ANOVA) was applied to studythe effect of the input parameters on the surface rough-ness. Table 4 gives the statistics for the model summery.It reveals that the quadratic model is the best appropriatemodel. So, for further analysis this model was used. Table 5gives the Estimated Regression Coefficients of surfaceRoughness for uncoded units. The value ‘‘p’’ for the modelis less than 0.05 which indicates that the model terms aresignificant, which is desirable as it indicates that the termsin the model have a significant effect on the response. Fromresponse surface Eq. (7), the most significant factor on the
Fig. 1. Main effect plots of s
surface roughness is feed rate. The next contribution onsurface roughness is nose radius and cutting speed. Fur-ther, it is seen that the R2 value is 0.9880 and the Adj. R2
is 0.9854. The predicted R2 value 0.9825 is in reasonableagreement with Adj. R2 value. The R2 value in this case ishigh and close to 1, which is desirable.
In order to understand the turning process, the experi-mental results were used to develop the mathematicalmodels using response surface methodology (RSM). In thiswork, a commercially available software package (MINI-TAB 14) was used for the computation work. The proposedquadratic model was developed from the above functionalrelationship using RSM method.
Ra ¼ 5:32260� 0:0475792v þ 31:1315f
� 0:208642d� 1:75949r þ 0:00009v2
� 44:9630f 2 � 0:131687d2 þ 0:7662204r2
� 0:0168519vf þ 0:00163580vd
þ 0:000995370vr þ 0:94444fd� 457000fr
� 0:0462963dr ð7Þ
urface roughness (Ra).
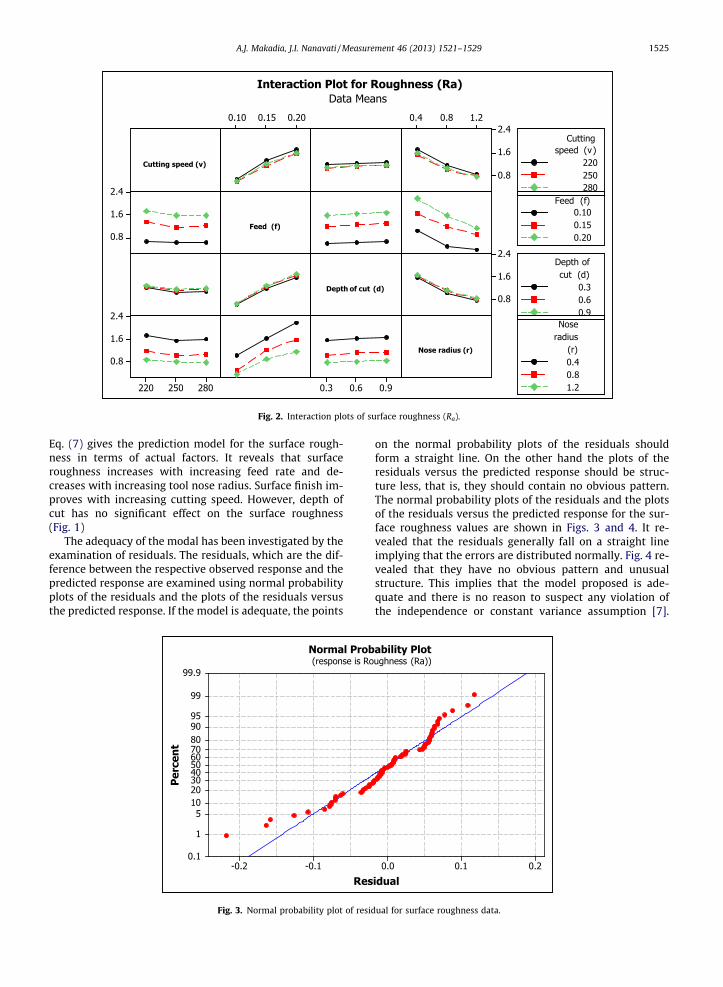
Fig. 2. Interaction plots of surface roughness (Ra).
A.J. Makadia, J.I. Nanavati / Measurement 46 (2013) 1521–1529 1525
Eq. (7) gives the prediction model for the surface rough-ness in terms of actual factors. It reveals that surfaceroughness increases with increasing feed rate and de-creases with increasing tool nose radius. Surface finish im-proves with increasing cutting speed. However, depth ofcut has no significant effect on the surface roughness(Fig. 1)
The adequacy of the modal has been investigated by theexamination of residuals. The residuals, which are the dif-ference between the respective observed response and thepredicted response are examined using normal probabilityplots of the residuals and the plots of the residuals versusthe predicted response. If the model is adequate, the points
Fig. 3. Normal probability plot of resid
on the normal probability plots of the residuals shouldform a straight line. On the other hand the plots of theresiduals versus the predicted response should be struc-ture less, that is, they should contain no obvious pattern.The normal probability plots of the residuals and the plotsof the residuals versus the predicted response for the sur-face roughness values are shown in Figs. 3 and 4. It re-vealed that the residuals generally fall on a straight lineimplying that the errors are distributed normally. Fig. 4 re-vealed that they have no obvious pattern and unusualstructure. This implies that the model proposed is ade-quate and there is no reason to suspect any violation ofthe independence or constant variance assumption [7].
ual for surface roughness data.

Fig. 4. Plot of residual vs. fitted surface roughness values.
1526 A.J. Makadia, J.I. Nanavati / Measurement 46 (2013) 1521–1529
The effect of main factor and interactions are shown inFigs. 1 and 2.
The 3D surface graphs for the surface roughness areshown in Figs. 5–7. As the model is adequate these 3D sur-face plots can be used for estimating the surface roughnessvalues for the any suitable combination of the input
Fig. 5. 3D Surface graph for (Ra) at nos
Fig. 6. 3D Surface graph for (Ra) at cutt
parameters namely feed rate, tool nose radius, cuttingspeed and depth of cut. It is clear from Fig. 5 that the sur-face roughness decreases with increasing tool nose radius.Good surface finish can be obtained for a higher tool noseradius, and depth of cut has no significant effect on the sur-face roughnes. Fig. 6 revealed that cutting speed improvessurface roughness. Fig. 7 gives the surface graph for surfaceroughness at depth of cut = 0.3 mm, tool nose ra-dius = 0.4 mm and feed rate and cutting speed varies. Itindicates that surface roughness increases with increasingfeed rate.
One of the most important aims of experiments relatedto manufacturing is to achieve the desired surface rough-ness of the optimal cutting parameters. To end this, the re-sponse surface optimisation is an ideal technique fordetermination of the best cutting parameters in turningoperation. Here, the goal is to minimise surface roughness(Ra). RSM optimisation results for surface parameters areshown in Fig. 9 and Table 6. Optimum cutting parametersare found to be cutting speed of 255.75 m/min, feed of0.1 mm/rev, depth of cut of 0.3 mm and tool nose radiusof 1.2 mm. The optimised surface roughness parameter isRa = 0.2601 lm.
e radius and depth of cut varies.
ing speed and nose radius varies.

Fig. 8. Experimental scheme.
Fig. 7. 3D Surface graph for (Ra) at cutting speed and feed varies.
A.J. Makadia, J.I. Nanavati / Measurement 46 (2013) 1521–1529 1527
5. Confirmation test
In order to verify the accuracy of the model developed,three confirmation run experiments were performed(Table 7). The test conditions for the confirmation testwere so chosen that they be within the range of the levelsdefined previously. The predicted values and the associ-
ated experimental values were compared. The error per-centage is within permissible limits. So, the responseequation for the surface roughness predicted throughRSM can be use to successfully predict the surface rough-ness values for any combination of the feed rate, tool noseradius, cutting speed and depth of cut within the range ofthe experimentation performed.
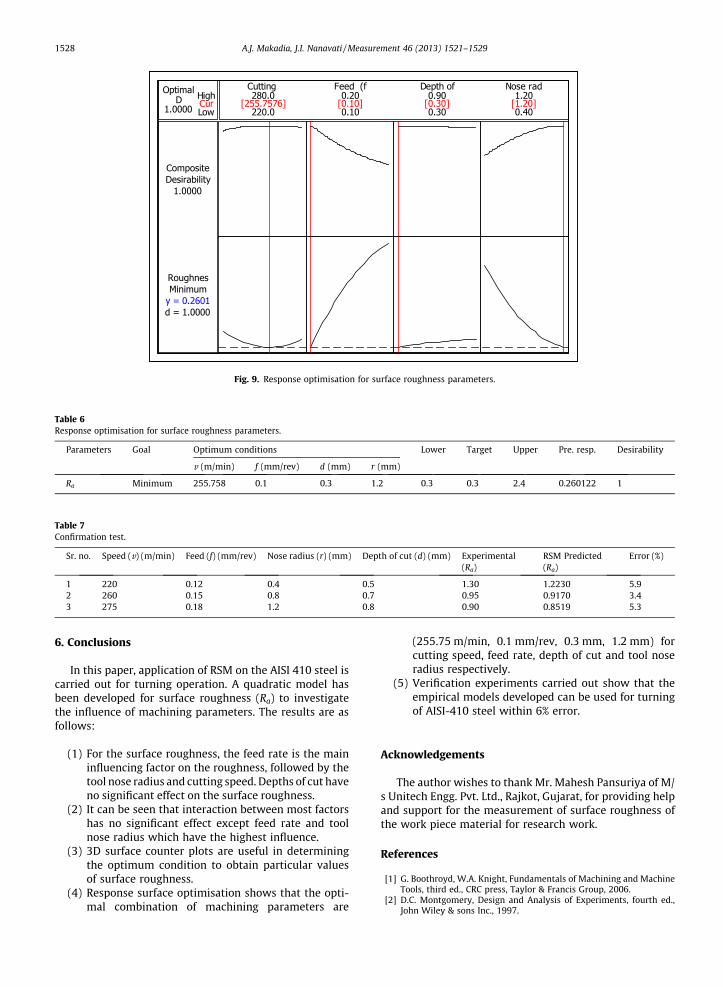
Fig. 9. Response optimisation for surface roughness parameters.
Table 7Confirmation test.
Sr. no. Speed (v) (m/min) Feed (f) (mm/rev) Nose radius (r) (mm) Depth of cut (d) (mm) Experimental(Ra)
RSM Predicted(Ra)
Error (%)
1 220 0.12 0.4 0.5 1.30 1.2230 5.92 260 0.15 0.8 0.7 0.95 0.9170 3.43 275 0.18 1.2 0.8 0.90 0.8519 5.3
Table 6Response optimisation for surface roughness parameters.
Parameters Goal Optimum conditions Lower Target Upper Pre. resp. Desirability
v (m/min) f (mm/rev) d (mm) r (mm)
Ra Minimum 255.758 0.1 0.3 1.2 0.3 0.3 2.4 0.260122 1
1528 A.J. Makadia, J.I. Nanavati / Measurement 46 (2013) 1521–1529
6. Conclusions
In this paper, application of RSM on the AISI 410 steel iscarried out for turning operation. A quadratic model hasbeen developed for surface roughness (Ra) to investigatethe influence of machining parameters. The results are asfollows:
(1) For the surface roughness, the feed rate is the maininfluencing factor on the roughness, followed by thetool nose radius and cutting speed. Depths of cut haveno significant effect on the surface roughness.
(2) It can be seen that interaction between most factorshas no significant effect except feed rate and toolnose radius which have the highest influence.
(3) 3D surface counter plots are useful in determiningthe optimum condition to obtain particular valuesof surface roughness.
(4) Response surface optimisation shows that the opti-mal combination of machining parameters are
(255.75 m/min, 0.1 mm/rev, 0.3 mm, 1.2 mm) forcutting speed, feed rate, depth of cut and tool noseradius respectively.
(5) Verification experiments carried out show that theempirical models developed can be used for turningof AISI-410 steel within 6% error.
Acknowledgements
The author wishes to thank Mr. Mahesh Pansuriya of M/s Unitech Engg. Pvt. Ltd., Rajkot, Gujarat, for providing helpand support for the measurement of surface roughness ofthe work piece material for research work.
References
[1] G. Boothroyd, W.A. Knight, Fundamentals of Machining and MachineTools, third ed., CRC press, Taylor & Francis Group, 2006.
[2] D.C. Montgomery, Design and Analysis of Experiments, fourth ed.,John Wiley & sons Inc., 1997.

A.J. Makadia, J.I. Nanavati / Measurement 46 (2013) 1521–1529 1529
[3] J.D. Thiele, S.N. Melkote, Effect of cutting edge geometry and workpiece hardness on surface generation in the finish hard turning ofAISI 52100 steel, J. Mater. Process. Technol. 94 (1999) 216–226.
[4] A. Mittal, M. Mehta, Surface finish prediction models for fine turning,Int. J. Prod. Res. 26 (12) (1988) 1861–1876.
[5] R.M. Sundaram, B.K. Lambert, Mathematical models to predictsurface finish in fine turning of steel, Part 1, Int. J. Prod. Res. 19 (5)(1981) 547–556.
[6] R.M. Sundaram, B.K. Lambert, Mathematical models to predictsurface finish in fine turning of steel, Part 2, Int. J. Prod. Res. 19 (5)(1981) 557–564.
[7] M.Y. Noordin, V.C. Venkatesh, S. Sharif, S. Elting, A. Abdullah,Application of response surface methodology in describing theperformance of coated carbide tools when turning AISI 1045 steel,J. Mater. Process. Technol. 145 (2004) 46–58.
[8] P.V.S. Suresh, P.V. Rao, S.G. Deshmukh, A genetic algorithmicapproach for optimization of surface roughness prediction model,Int. J. Mach. Tools & Manuf. 42 (2002) 675–680.
[9] W.H. Yang, Y.S. Tarng, Design optimization of cutting parameters forturning operations based on Taguchi method, J. Mater. Process.Technol. 84 (1998) 112–129.
[10] I.A. Choudhury, M.A. El- Baradie, Tool life prediction model by designof experiments for turning high strength steel, J. Mater. Process.Technol. 77 (1998) 319–326.
[11] P.M. Escalona, Z. Cassier, Influence of critical cutting speed on thesurface finish of turned steel, Wear 218 (1998) 103–109.
[12] C.X. (Jack) Feng, X. Wang, Development of empirical models forsurface roughness prediction in finish turning, Int. J. Adv. Manuf.Technol. 20 (2002) 348–356.
[13] J.P. Davim, A note on the determination of optimal cuttingconditions for surface finish obtained in turning using design ofexperiments, J. Mater. Process. Technol. 116 (2001) 305–308.
[14] B.Y. Lee, Y.S. Tarng, Surface roughness inspection by computer visionin turning operations, Int. J. Mach. Tools & Manuf. 41 (2001) 1251–1263.
[15] B.Y. Lee, S.F. Yu, H. Juan, The model of surface roughness inspectionby vision system in turning, Mechatronics 14 (2004) 129–141.
[16] E.D. Kirby, Z. Zhang, J.C. Chen, J. Chen, Optimizing surface finish in aturning operation using the Taguchi parameter design method, Int. J.Adv. Manuf. Technol. 30 (2006) 021–1029. doi 10.1007/s00170-005-0156-0.
[17] T.S. Lan, M.Y. Wang, Competitive parameter optimization of multi-quality CNC turning, Int. J. Adv. Manuf. Technol. 41 (2009) 820–826.doi 10.1007/s00170-008-1495-4.
[18] G. Petropoulos, F. Mata, J.P. Davim, Statistical study of surfaceroughness in turning of peek composites, Mater. Des. 29 (2008) 218–223.
[19] N.I. Galanis, D.E. Manolakos, Surface roughness prediction in turningof femoral head, Int. J. Adv. Manuf. Technol. 51 (2010) 79–86.
[20] N.C. Tsourveloudis, Predictive modeling of the Ti6Al4V alloy surfaceroughness, J. Int. Robot Syst. 60 (2010) 513–530. doi 10.1007/s10846-010-9427-6.
[21] D.I. Lalwani, N.K. Mehta, P.K. Jain, Experimental investigations ofcutting parameters influence on cutting forces and surfaceroughness in finish hard turning of MDN250 steel, J. Mater.Process. Technol. 206 (2008) 167–179.
[22] M.A. Dabnum, M.S.J. Hashmi, M.A. El-Baradie, Surface roughnessprediction model by design of experiments for turning machinableglass–ceramic (Macor), J. Mater. Process. Technol. 164-165 (2005)1289–1293.
[23] I.A. Choudhury, M.A. El-Baradie, Surface roughness prediction in theturning of high-strength steel by factorial design of experiments, J.Mater. Process. Technol. 67 (1997) 55–61.