optimised chilling protocols for fresh fish - matís · optimised chilling protocols for fresh fish...
TRANSCRIPT

Optimised Chilling Protocols for Fresh Fish
Björn Margeirsson Hélène L. Lauzon Lárus Þorvaldsson Sveinn Víkingur Árnason Sigurjón Arason Kristín Líf Valtýsdóttir Emilía Martinsdóttir
Vinnsla, virðisauki og eldi Skýrsla Matís 54-10 Desember 2010 ISSN 1670-7192

Titill / Title
Optimised Chilling Protocols for Fresh Fish
Höfundar / Authors Björn Margeirsson, Hélène L. Lauzon, Lárus Þorvaldsson, Sveinn Víkingur Árnason, Sigurjón Arason, Kristín Líf Valtýsdóttir, Emilía Martinsdóttir
Skýrsla / Report no. 54-10 Útgáfudagur / Date: December 2010 Verknr. / project no. 1682/1704/1852
Styrktaraðilar / funding: AVS R&D Fund of Ministry of Fisheries in Iceland, the Technology Development Fund at the Icelandic Centre for Research, University of Iceland Research Fund and EU (contract FP6-016333-2)
Ágrip á íslensku:
Leiðbeiningar um kælingu á ferskum fiski lýsa áhrifamestu kæliaðferðum á öllum stigum kælikeðjunnar með áherslu á hvítan fisk. Lýst er hvernig eigi að besta kælingu og viðhalda hitastigi til þess að hámarka gæði og öryggi afurða og minnka kostnað og orkunotkun. Í skýrslunni eru bakgrunnsupplýsingar fyrir leiðbeiningar i upplýsingaveituna Kæligátt á heimasíðu Matís sem settar eru fram á notendavænan hátt á íslensku www.kaeligatt.is og ensku www.chillfish.net. Leiðbeiningarnar eru ætlaðar fyrir sjómenn, framleiðendur, flutningsaðila og aðra aðila virðiskeðjunnar. Leiðbeiningarnar byggja á rannsóknum sem framkvæmdar hafa verið innan rannsóknaverkefna eins og Chill‐on, Hermun kæliferla og Kælibótar. Helstu kaflar fjalla um kælingu um borð, í vinnslu, við pökkun, flutning og geymslu á fiski.
Lykilorð á íslensku: Kæling , fiskur, hitastig, vinnsla, pakkningar, flutningur , geymsla
Summary in English
The overall aim of the optimised chilling protocols is to describe the most effective chilling methods for any stage in the food supply chain with emphasis on whitefish. This comprises optimisation of the whole chain for lowering and maintaining low temperature with the aim of maximising quality and safety of the products and minimising costs and energy use. This report is the background for the protocols and guidelines published with open access at Matís website in Icelandic and English in a user‐friendly way: www.chillfish.net. These are protocols to follow aimed for the use of fishermen, manufacturers, transporters and other stakeholders in the fisheries chain. The information is divided into subchapters of different links in the chain. How to chill fish on‐board, during processing, packaging, transport and storage are the main chapters.
English keywords: Cooling, fish, temperature, processing, packaging, transport, storage © Copyright Matís ohf / Matis - Food Research, Innovation & Safety

Contents 1 Introduction 1
2 Catching 1
2.1 How to chill right after catch 1
2.2 Precooling before icing ‐ slurry ice vs. solid ice chilling 2
2.3 Properties of slurry ice 3
2.4 Ice requirement 5
2.4.1 Cooling white fish 5
2.4.2 During storage 6
2.4.3 Calculation of ice requirement 8
2.5 Temperature maintenance 10
3 Processing 11
3.1 Chilled room before processing 11
3.2 Liquid/slurry ice cooling 11
3.3 CBC cooling or similar techniques 13
3.4 Holding time and air temperature in processing room 14
4 Packaging 16
4.1.1 Ice Packs and Expanded Polystyrene vs. Corrugated Plastic 16
4.1.2 Importance of precooling before packaging 20
5 Chilled storage 22
5.1 Daily heat balance 23
6 Transport post processing 24
6.1 Interfaces between different links in the cold chain 24
6.2 Road transport 24
6.3 Sea transport 26
6.4 Air transport 26
7 ACKNOWLEDGEMENTS 27
Nomenclature 28

1
1 Introduction Proper and steady cooling is the key to good quality, long shelf life and high value of seafood. Care must be taken to handle the fish properly at all stages during processing to ensure the highest quality and thus make the most possible valuable products. The condition of the raw material is vital for the quality and utilisation of the fish. Factors which can affect the raw material quality are fishing season, fishing area, fishing gear, nutritional status and age of raw material, rigor mortis and handling before and after processing. Proper cooling during the whole value chain is a key factor in maintaining maximum quality as long as possible. The overall aim of the optimised chilling protocols is to describe the most effective chilling methods for any stage in the food supply chain with emphasis on whitefish. This comprises optimisation of the whole chain for lowering and maintaining low temperature with the aim of maximising quality and safety of the products and minimising costs and energy use. This report is based on theory and experience within several national and international research projects and contains practical information and coverage on cooling and handling of fish at all stages of the value chain from catch to market. The report is the background for the protocols and guidelines published with open access at Matis website in Icelandic and English in a user‐friendly way: www.chillfish.net. These are protocols to follow aimed at fishermen, manufacturers, transporters and other stakeholders in the fisheries chain. The information is divided into subchapters of different links in the chain. How to chill fish on‐board, during processing, packaging, transport and storage are the main chapters.
2 Catching
2.1 How to chill right after catch Once the catch is received it is very important to minimise the holding time and cool it with slurry ice as soon as possible. Once the fish has been allowed to bleed in running seawater/water it should be precooled further down to a temperature as close to the intended storage temperature as possible. The fish should then be stored in the hold with evenly distributed slurry ice in well insulated tubs. Since fish can absorb both salt and water when stored in slurry ice for an excessive amount of time, it is not recommended to store it for more than 24 hours in slurry ice. If prolonged storage is necessary the raw material should be stored in crushed plate ice. Another important factor is the temperature in the hold which should be close to 0°C. By having good control over the hold temperature, both ice and energy can be saved and the rate of spoilage is minimised.

2
2.2 Precooling before icing slurry ice vs. solid ice chilling
Figure 1: Mean temperature of fish stored in insulated tubs as function of time for different types of ice cooling media.
Figure 1 shows results from a cooling experiment conducted in order to compare two different types of slurry ice (denoted as LIA and LIB) and crushed plate ice (Fl+Fl, where +Fl denotes top icing with crushed plate ice).1 The raw material was packed with excessive amount of ice in all cases and the temperature in the flesh was recorded every five minutes. The ice concentration and temperature of the slurry ice cooling media are presented in Table 1. The figure clearly shows the difference in cooling rate for different types of ice, where LIB reaches 0 °C in 20‐30 minutes while the same process takes approximately 4 hours and 20 minutes for the raw material packed in crushed plate ice. Table 1. Properties of slurry ice cooling media used for cooling whole fish by Þorvaldsson et al. (2009).1
Slurry ice group Ice concentration [%] Temperature [°C] LIA+FI 34 ‐2.2 LIB 47 ‐2.4 LIB+FI 34 ‐2.2
In order to slow down spoilage mechanisms and ensure the quality of the raw material by reaching optimal temperature as soon as possible it is therefore recommended to cool it with slurry ice. However, the study also showed that fish cooled in slurry ice and stored up to 8 days had significantly higher TVB‐N and TMA content. This could be caused by the conditions created by the slurry ice environment (salt uptake of flesh), causing an even faster fish deterioration process with increasing prolonged storage period. In fact, an insignificant but measurable salt uptake was found in the flesh after 48 hours while all slurry ice media significantly increased salt content of flesh after 4‐8 days of
1 Lárus Þorvaldsson, Hélène L. Lauzon, Björn Margeirsson, Emilía Martinsdóttir, Sigurjón Arason. Comparison of cooling techniques - Their efficiency during cooling and storage of whole, gutted haddock, and their effect on microbial and chemical spoilage indicators. Matís report 34-10.

3
storage (p<0.05). Should such a long storage period be necessary, it is therefore recommended to re‐ice the raw material in crushed plate ice after 24 hours.
2.3 Properties of slurry ice The relation between ice percentage (concentration), salinity (salt content) and temperature of ice slurries is shown in Figure 2.
Figure 2. Relation between ice percentage by weight, salt content and temperature of slurry ice.2
The same relation for wider salinity range is presented in Figure 3.
2 Crytec Bubble Slurry IceTM fraction calculator, user‘s manual, 2007.

4
Figure 3. Relation between ice percentage, salt concentration and temperature of slurry ice for a wide range of salt concentration.3
The cooling capacity (enthalpy) of ice slurries is shown in Figure 4.
Figure 4. Enthalpy phase diagram of sodium chloride‐water (slurry ice) as a function of additive concentration.4 CI denotes ice mass fraction (ice concentration) and the salt content (additive concentration) is on the x‐axis.
3 Melinder, Å., Granryd, E., 2005. Using property values of aqueous solutions and ice to estimate ice concentrations and enthalpies of ice slurries. International Journal of Refrigeration 28, pp. 13-19.

5
2.4 Ice requirement
2.4.1 Cooling white fish The most important variables when considering the ice requirement for fish cooling are storage time and initial fish temperature. Or in other words: the most important factors in determining how much ice is needed for a certain amount of fish, is the heat contained in it, and the heat absorbed by the contents of the tub from the environment. In order to determine how much heat is contained in the fish the temperature dependent heat capacity of white fish can be used. The apparent specific heat capacity cf at any specific temperature is determined by interpolating the values given in FAO technical paper 340 (Johnston, 1985) and the conductivity k, interpolating data from Zueco et al. (2004). Table 2. Thermodynamic properties of white fish at temperature ranging from ‐30 °C to 30 °C. 5,6
T [°C] cf [kJ/kg/K]
k [W/m/K]
‐30 2.055 1.872‐20 2.595 1.675‐10 4.227 1.479‐6 7.744 1.400‐4 15.111 1.361‐3 26.539 1.341‐2 65.636 1.322‐1 102.72 1.3020 4.144 0.4305 3.641 0.430
10 3.683 0.43020 3.683 0.43030 3.683 0.430
Since the specific heat of fish is very temperature dependent it is necessary to integrate the specific heat over the temperature interval in order to find the energy removed from the fish such that
(1)
where the initial temperature of the fish is T1 and the final temperature after cooling is T0. This integral is solved numerically by using cubic interpolation in between the points displayed in Table 2.
4 Melinder, Å., 2010. Properties and other aspects of aqueous solutions used for single phase and ice slurry applications. International Journal of Refrigeration XXX, pp. 1-7. In press. 5 Zueco, J., Alhama, F., and González Fernández, C.F., 2004. Inverse determination of the specific heat of foods. Journal of Food Engineering, 64(3), pp. 347-353. 6 W.A. Johnston, F. N. 1985. Freezing and refrigerated storage in fisheries. FAO Fisheries Technical Paper - T340 , 143.

6
Figure 5. Energy [MJ] required to lower the temperature of 100 kg of whitefish from T1 to T0.
Figure 5 shows the energy needed to lower the temperature of whitefish from T1 to T0. The contours clearly show the steep increase in heat capacity from ‐1 °C to 0 °C which is largely explained by the phase change of water in the fish.
2.4.2 During storage According to Fourier’s law the heat flow between two points at a constant temperature in a homogenous material with 1‐D geometry follows the relation
ΔA Δ
(2)
where k is the thermal conductivity of the material Δ is the thickness of it, A the area and Δ the temperature difference. Fourier’s law can be used as an approximation for the heat flow into an insulated tub with a lid where convection is neglected. This is a reasonable assumption as long as Δ / 1/ , where h is the convection coefficient for either side of the tub. Assuming that the tub has outer dimensions the inner dimensions are
2Δ 2Δ 2Δ ( 3)
where Δ is the thickness of the walls of the tub. The total inner area of the tub is then
2 (4)
which can be inserted into Fourier’s equation which becomes

7
Δ
(5)
where Te is temperature of the environment. A typical material which is used in such a tub is polyurethane which has thermal conductivity k of around 0.03 W/m/K. By multiplying with the storage time t, the total amount of heat put into the system is found. The total amount of energy needed both for cooling and storage can then be written as
Δ 1
(6)
Convective thermal resistance, 1/h, should not be neglected in case of no wind, here a convective heat transfer coefficient outside the tub, h = 5 W/m2/K was adopted. The amount of slurry ice needed to fulfil this energy need is
(7)
where Lice is the latent heat of ice and xice is the ice concentration (mass ratio of ice in the mixture) of the slurry ice. It should be noted that the enthalpy of the non‐frozen part of slurry ice has been neglected. This is reasonable for slurry ice temperature ranges between ‐3 °C and 0 °C and ice concentration above 10%, which normally is applied when cooling fresh fish with slurry ice. Figure 4 can be applied if more accuracy is needed.

8
2.4.3 Calculation of ice requirement As can be seen from above, the most important variables when considering ice requirement for chilling fish are storage time, surrounding temperature during storage and initial fish temperature.
Figure 6. The ratio mpure ice/mfish as a function of initial temperature of fish for different storage times with ambient temperature 4 °C.
Figure 7. The ratio mpure ice/mfish as a function of initial temperature of fish for different storage times with ambient temperature 0.5 °C.

9
Figure 6 and Figure 7 and show the amount of pure ice required to cool down and maintain the temperature of fish for different storage times assuming ambient temperature of 4 °C and 0.5 °C, respectively. The tub is assumed to be made of polyurethane with conductivity k = 0.03 W/m2/K and dimensions 123 cm 102 cm 58 cm. The raw material is assumed to reach 0 °C at the end of the cooling process. Using Figure 6 the amount of ice with concentration required to cool a certain amount of fish with mass mfish can easily be found once the initial temperature and storage time in tub have been determined. For example, if ice of 30% concentration was to be used to cool down 100 kg of fish with initial temperature 15 °C and stored for 48 hours, one could read mpure,ice/mfish = 0.33 from the chart which could then be translated into the amount of 30% slurry ice needed as
0.33
(8)
i.e.,
0.33 0.33100 kg0.30
110 kg
(9)
which means that 110 kg of 30% slurry ice would be needed for 100 kg of fish given the assumptions above. Table 3 and Table 4 show the ice requirement for several different initial temperatures of fish, assuming storage for 48 hours at 4 °C and 0.5 °C ambient temperature, respectively. Table 3. Ice requirement per kg of fish at different initial temperatures (T0), assuming storage for 48 h at 4 °C (msi,20%: mass of slurry ice with 20% ice ratio) T0 mpure ice [kg] msi,20% [kg] msi,33% [kg] msi,50% [kg] 5 0.09 0.47 0.28 0.19 10 0.15 0.74 0.45 0.30 15 0.20 1.02 0.62 0.41 20 0.26 1.29 0.78 0.52 25 0.31 1.57 0.95 0.63
Table 4. Ice requirement per kg of fish at different initial temperatures (T0), assuming storage for 48 h at 0.5 °C (msi,20%: mass of slurry ice with 20% ice ratio) T0 mpure ice [kg] msi,20% [kg] msi,33% [kg] msi,50% [kg] 5 0.06 0.30 0.18 0.12 10 0.11 0.57 0.35 0.23 15 0.17 0.85 0.51 0.34 20 0.22 1.12 0.68 0.45 25 0.28 1.40 0.85 0.56

10
2.5 Temperature maintenance
Figure 8. Maintenance of temperature as a function of time for different ice types.
Figure 8 shows how temperature was maintained in the raw material for different ice types in a study conducted by Matís in October 2008.1 The same notation is used in this figure as in Figure 1 above. It can be seen that even though the temperature of the crushed plate ice is slightly higher than the temperature of the slurry ice, it is better maintained throughout the storage period. The reason for this is probably a larger contact area for the slurry ice both with the walls of the tub and the fish. This result further supports the recommendation to initially cool the raw material with slurry ice, re‐ice with crushed plate ice after 24 hours, and then maintain the temperature after that with the crushed plate ice. Recommendations:
Allow the fish to bleed in running seawater (cooling in bleeding not required).
Cool the catch in a precooling tub on deck as soon as possible after bleeding.
For faster precooling, slurry ice should be used since it provides a much faster cooling rate
than solid ice (flake ice, plate ice, tube ice).
Efficient icing of fish in tubs will depend on effective mixing of slurry ice with fish.
If slurry ice is not available on board, proper icing can be achieved by using solid ice added in
layers in the fish tub.
If the raw material is to be stored in the hold for a prolonged time period, a top layer of solid
ice should be added as needed to cover the raw material in the tub independently of the
cooling medium used. This is especially important in case of poor temperature control in the
hold.
The temperature in the hold should be close to or just below 0 °C.
Good control over the temperature of the slurry ice is also recommended.
11
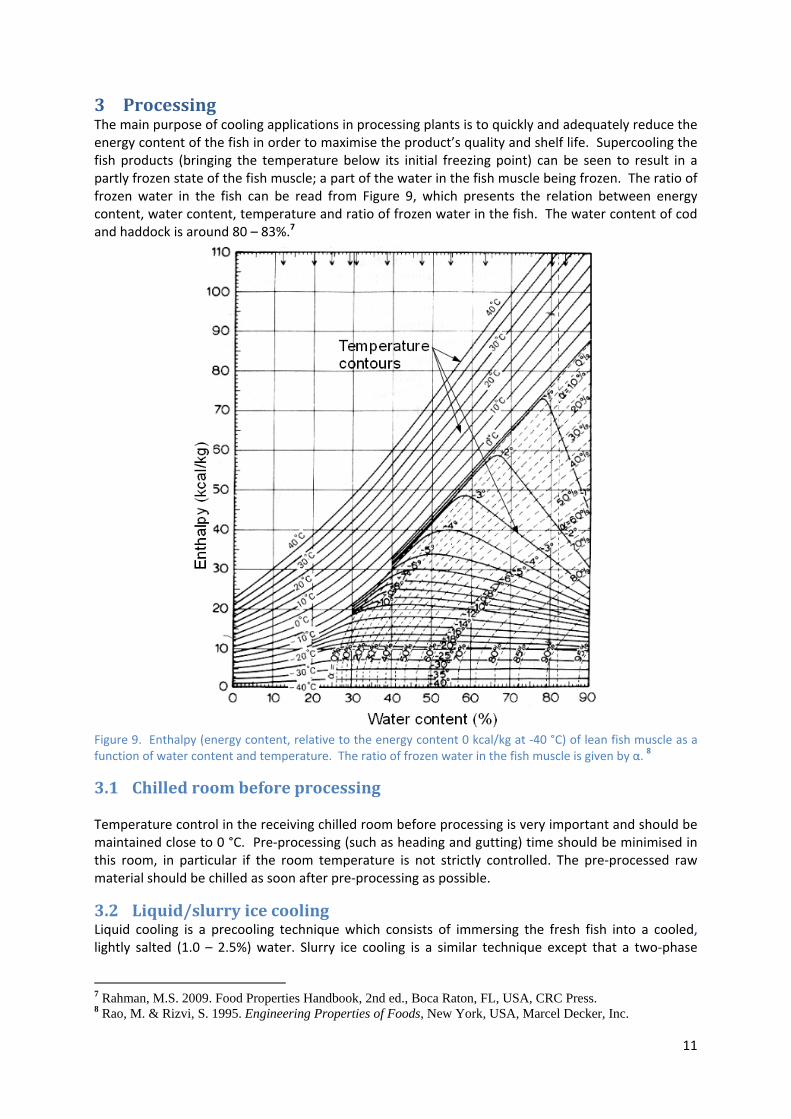
3 Processing The main purpose of cooling applications in processing plants is to quickly and adequately reduce the energy content of the fish in order to maximise the product’s quality and shelf life. Supercooling the fish products (bringing the temperature below its initial freezing point) can be seen to result in a partly frozen state of the fish muscle; a part of the water in the fish muscle being frozen. The ratio of frozen water in the fish can be read from Figure 9, which presents the relation between energy content, water content, temperature and ratio of frozen water in the fish. The water content of cod and haddock is around 80 – 83%.7
Figure 9. Enthalpy (energy content, relative to the energy content 0 kcal/kg at ‐40 °C) of lean fish muscle as a function of water content and temperature. The ratio of frozen water in the fish muscle is given by α. 8
3.1 Chilled room before processing Temperature control in the receiving chilled room before processing is very important and should be maintained close to 0 °C. Pre‐processing (such as heading and gutting) time should be minimised in this room, in particular if the room temperature is not strictly controlled. The pre‐processed raw material should be chilled as soon after pre‐processing as possible.
3.2 Liquid/slurry ice cooling Liquid cooling is a precooling technique which consists of immersing the fresh fish into a cooled, lightly salted (1.0 – 2.5%) water. Slurry ice cooling is a similar technique except that a two‐phase
7 Rahman, M.S. 2009. Food Properties Handbook, 2nd ed., Boca Raton, FL, USA, CRC Press. 8 Rao, M. & Rizvi, S. 1995. Engineering Properties of Foods, New York, USA, Marcel Decker, Inc.

12
slurry ice (mixture of ice crystals and lightly salted water) is used as the cooling medium often with a temperature of ‐1 °C to ‐0.5 °C. Liquid or slurry ice cooling is sometimes used as a standalone solution while it is preferable to have it as part of a CBC cooling system or a similar technique.9 When used with a CBC system it both serves the purpose of cooling the raw material and to increase its salt content slightly in order to lower its freezing temperature in the CBC cooler.
Figure 10. Temperature in fillets as a function of time in liquid cooler.10
Figure 10 shows temperature profiles of three fillets weighing 400 – 600 g chilled in a liquid cooler with liquid temperature of ca. 1 °C for approximately 6 minutes. During that period the temperature of the fillets can be seen to drop by 1 ‐ 2 °C, which depends on the initial temperature and size of the fillets, the temperature and flow of the cooling medium and the time which the fillets/loins spend in the liquid cooling. The results from the aforementioned experiments and others yield the general rule of thumb that the cooling rate can be estimated as 0.12 – 0.20 °C/min or more specifically, ca. 0.029 – 0.031 °C/min per °C difference between initial product and medium temperature. This implies that with the initial product temperature of 6 °C and medium temperature of 0 °C the cooling rate is ca. 0.18 °C/min but a medium temperature of ‐2 °C would give a cooling rate of ca. 0.24 °C min. To chill the product from 6 °C to 1 °C would require 5/0.18 min ≈ 28 min and 5/0.24 min ≈ 21 min for medium temperature of 0 °C and ‐2 °C, respectively. It should be noted that these general recommendations for estimating the required cooling time only apply when the temperature difference between the product and medium is more than ca. 1 °C. Figure 11 illustrates results from another comparable pre‐cooling experiment,11 however, utilizing slurry ice with low salt content (0.5 – 0.8%) and temperature between ‐1 and 0 °C instead of liquid with no ice as in Valtýsdottir et al. (2010). Similar cooling rate was yielded, i.e. around 0.03 °C/min per °C difference between initial product and medium temperature.
9 Kristín Líf Valtýsdóttir, Björn Margeirsson, Sigurjón Arason, Hélène L. Lauzon, Emilía Martinsdóttir. Guidelines for precooling of fresh fish during processing and choice of packaging with respect to temperature control in cold chains. Matís report 40-10, 37 pages. 10 Valtýsdóttir, K.L, Margeirsson, B., Arason, S. 2009. A-3.2: Forkæling fyrir pökkun í vökvakæli. “Thermal modeling of chilling and transportation of fish“ Matís project. 11 D5.4.A. FISH Field Trial Scenario and Mapping Summary Report Chapter 3. Cod supply chain IS-FR (Opale) – Liquid ice chilling. Chill on EU project.
0
1
2
3
4
5
6
13:47 13:48 13:49 13:50 13:50 13:51 13:52 13:53 13:54 13:55
Tempe
rature [°C]
Time
#463 #470 #484

13
Figure 11. Temperature during cooling of cod fillets in a slurry ice tub.11 No. 170 (658 g), 304 (277 g), 317 (263 g) and 457 (467 g) represent cod loin temperature and no. 1, 141 and 437 represent cooling medium temperature. Mass of loin in grams (g) is given for each loin.
Figure 11 shows that the loin mass is not a dominating factor for the cooling rate. In fact, the temperature difference between the cooling media and initial product temperature is more important. The ice concentration in a liquid cooler should be 10% or more, which should result in the desired cooling medium temperature of ‐2 °C (assuming 3.5% salinity). The relationship between salinity, ice concentration and temperature of slurry ice is shown in Figure 2. Despite its advantages the risk of cross contamination is considerable in liquid cooling. In order to minimise the risk the fillets should be kept in the liquid for a limited amount of time and the cooling medium should be renewed frequently.
3.3 CBC cooling or similar techniques CBC cooling is a new cooling technique developed by Skaginn hf. where heat is extracted from fillets both by conduction through a Teflon coated aluminium conveyor belt and by convection, where cold air is simultaneously blasted over the fillets.12 Slurry ice cooling, such as described above, is a part of the CBC cooling process. It is performed before the CBC cooling in order to decrease the temperature of the fillets and slightly increase their salt content. Liquid or slurry ice cooling of fillets can be used to lower the temperature in process prior to packaging. Microbiological quality of the cooling medium, its renewal and temperature control are necessary for success. Otherwise, high microbial load of specific spoilage organisms (SSO, namely Photobacterium phosphoreum, pseudomonads and H2S‐producing bacteria) in the cooling medium will lead to contamination of the fillets and rapid growth of SSO during storage of the products, especially under temperature abuse. However, the impact of CBC cooling on the temperature maintenance of abused fillets has been found to be considerable when compared to liquid cooling (LC) in process or untreated fillets. Abused CBC and LC fillets were found to have 100% and 25% extended shelf life, respectively, compared to similarly abused control fillets with a shelf life of 6 days
12 Skaginn hf. 2003. Improved profitability in shore based processing http://www.skaginn.is/bindata/documents/__CBC_document_EN_03_00147_00012.pdf

14
from processing.13 Ólafsdóttir et al. (2006) also found that CBC cooling can lead to freshness and shelf life extension of cod fillets.14 It is therefore an advantageous method to process fillets to be shipped as fresh products since it will help in maintaining freshness and shelf life despite breakage in the cold chain. Further, a bacterial growth‐retarding effect of CBC processing on SSO has been observed.
Figure 12 shows the temperature development of 5 different fillets weighing 400 – 600 g being transported through a CBC cooler. The temperature of the fillets can be seen to decrease by 2 °C in 10 minutes during the liquid cooling. The rapid cooling of the fillets in the CBC cooler can then be observed where the temperature decreases by approximately 3.5 °C in approximately 7 minutes, down to a temperature where most of the phase change takes place. Another interesting feature in Figure 12 is that once the fillets have gone through the CBC cooler and are stored in an open box at 14 °C their temperature remains stable. The reason for this is that a large part of the cooling energy added to the fillets in the CBC cooler is in the form of phase change, so that the temperature remains stable until most of the ice has melted.
3.4 Holding time and air temperature in processing room The holding time in the processing should be minimised. Research conducted by Matís has shown that the temperature of fillets can increase by 3 ‐ 4 °C for every half an hour they are left without cooling in a processing hall at 20 °C.9 The processing line should be left clear and all raw material kept in chilled storage during coffee and lunch breaks.
13Magnússon, H., Lauzon, H.L., Sveinsdóttir, K., Margeirsson, B., Reynisson, E., Rúnarsson, Á.R., Guðjónsdóttir, M., Þórarinsdóttir, K.A., Arason, S., Martinsdóttir, E. 2009. The effect of different cooling techniques and temperature fluctuations on the storage life of cod fillets (Gadus morhua). Matis report 23-09, 37 p. 14 Olafsdottir, G., Lauzon, H.L., Martinsdottir, E., Kristbergsson, K. 2006. Evaluation of shelf-life of superchilled cod (Gadus morhua) fillets and influence of temperature fluctuations on microbial and chemical quality indicators. J. Food Sci. 71 (2), S97-S109.
‐1
0
1
2
3
4
13:50 14:00 14:10 14:20 14:30
Tempe
rature [°C]
Time
#A #B#C#D#E
CBC‐cooler
Liquid cooler Stored in an open box
Figure 12. The temperature of 5 different fillets as a function of time.10

15
Figure 13. Fillet temperature increasing during break simulation in the trimming area.9
Figure 13 shows the temperature increase in four fillets which were left without cooling in the processing room having initially been cooled in a liquid cooler. The temperature can be seen to increase by up to 6 – 7 °C for every hour they are left without cooling. Such a scenario is very likely for example if the fillets were left without cooling during a lunch break or if the trimming would be a bottleneck in the processing line. It should be noted that this temperature increase depends heavily on the ambient temperature in the trimming/processing room.
Recommendations:
Maintain low and stable temperature in the chilled room before processing.
Use liquid cooling, but avoid cross contamination by limiting the amount of time each fillet is in the cooling medium and be sure to circulate and renew the cooling medium frequently. Liquid cooling has been found to extend the shelf life of fillets subject to temperature abuse by 25%, compared to similarly abused control fillets with a shelf life of 6 days.
Precool fillets/loins before packaging to around ‐1.0 to ‐0.8 °C with CBC‐technique or other similar technique. Fillets cooled with CBC cooling have been found to have extra 3 days shelf life compared to similarly abused control fillets with a shelf life of 6 days.
Minimise holding time during processing. Make sure the processing line is clear during breaks and make sure there are no bottlenecks in the processing line.
Cool the water, which is used in processing, to 1 ‐ 2 °C if possible.
Minimise holding time. This is even more important for loins and fillets than for whole fish.
For more information on precooling during processing a reference should be made to Valtýsdóttir et al. (2010).9
02468
1012141618202224
13:00 13:30 14:00 14:30 15:00 15:30 16:00
Tempe
rature [°C]
Time
Fillet 1
Fillet 2
Fillet 3
On top offillets
Ambienttemperature

16
4 Packaging
4.1.1 Ice Packs and Expanded Polystyrene vs. Corrugated Plastic Some studies15,16 have revealed that temperature control in real fish cold chains is quite often far from what is described in the ATP17 thereby altering product quality, shortening shelf life and decreasing product value. According to Mai et al.15, the temperature regulation in fresh fish distribution chains is actually mainly a problem for air freight, but not sea freight. The negative impact of unsatisfactory ambient temperature fluctuations during distribution of perishable products can still be dampened by thermal insulation of the packaging. Other characteristics of packaging, which can influence the quality of the products, include its strength and space (both internal space for cooling mats or ice in order to maintain low product temperature and space required for storage). Here all focus is on the thermal insulation since that is the most important property for temperature control in cold chains. In large parts of fresh fish distribution chains, the inside boxes of whole pallets are protected against thermal load from the ambient air by the neighbouring boxes and therefore it is important to understand well the temperature distribution inside pallets. This is, however, not always the case because frequently, pallets are broken up before being loaded onboard airplanes in order to maximise volume exploitation of the cargo hold. Thus, results for both single packages and whole pallets are discussed here. Thermal performance of two types of wholesale fresh fish boxes has been investigated,18,19 one made of expanded polystyrene (EPS) and another made of corrugated plastic (CP). The packaging contained fresh white fish fillets, while challenged by ambient temperature conditions similar to or even more severe than Mai et al.15 reported. The ability of ice packs to maintain desired temperatures during temperature abuse was also studied.
15 Mai, N., Margeirsson, B., Margeirsson, S., Bogason, S., Sigurgisladottir, S., Arason, S. In press. Temperature mapping of fresh fish supply chains – air and sea transportation. Journal of Food Process Engineering, doi: 10.1111/j.1745-4530.2010.00611.x. 16 Giannakourou, M. C. and Koutsoumanis, K. and Nychas, G. J. E. and Taoukis, P. S. 2005. Field evaluation of the application of time temperature integrators for monitoring fish quality in the chill chain. International Journal of Food Microbiology, 102(3), p. 323 – 336. 17 ATP, 1970, "Agreement Transport Perishables, Agreement on the international carriage of perishable foodstuffs and on the special equipment to be used for such carriage, United Nations Economic Commission for Europe, Geneva (1970). http://www.unece.org/trans/main/wp11/atp.html. 18 Margeirsson, B., Palsson, H., Arason, S. 2009. Thermal Performance of Corrugated Plastic Boxes and Expanded Polystyrene Boxes. Matis report 01-09. 19Margeirsson, B., Gospavic, R., Palsson, H., Arason, S., Popov, V. Experimental and numerical modelling comparison of thermal performance of expanded polystyrene and corrugated plastic packaging for fresh fish. International Journal of Refrigeration. Published online (doi:10.1016/j.ijrefrig.2010.09.017).
Figure 14. Fresh white fish fillets in wholesale fish boxes. Left: corrugated plastic box with no ice pack. Right: expanded polystyrene box with an ice pack on top of the fillets. Also shown are ibutton temperature loggers used for mapping product temperature.

17
The two different wholesale box types are shown in Figure 14 and their dimensions and thermal properties presented in Table 5 and Table 6, respectively.
Table 5. Dimensions of wholesale fish boxes.19 Type Inner L x W x H (mm) Outer L x W x H (mm) EPS 355.5 x 220 x 85 400 x 264.5 x 135 CP 370 x 230 x 80 395 x 247 x 85
Table 6. Thermal properties of wholesale fresh fish boxes. 19
Type mass (g) ρ (kg/m3) cp (kJ/kg/K) k (W/m/K) EPS 181 22 1.28±0.05 0.031‐0.036 CP 178 150‐270 1.90 0.038‐0.045
It was shown that expanded polystyrene wholesale boxes are more thermally protective than corrugated plastic wholesale boxes18,19 as is illustrated in Figure 15. Furthermore, frozen ice packs are efficient for protecting fresh fish fillets against temperature abuse.
Figure 15. Evolution of ambient temperature (amb) and mean product temperature during four temperature abuse trials with haddock fillets in free standing wholesale fresh fish boxes.19
Valtýsdóttir et al. (2010) showed that distributing the cooling capacity inside the boxes by placing ice packs below and on top of fillets protects the fillets better than only placing them on top of the fillets. The difference in insulation performance of the two packaging types is not as obvious for multiple packages loaded on pallets as for single packages.18

18
But even though EPS boxes are more thermally protective than CP boxes, it has been shown that the EPS boxes can still be improved.20 The product temperature at the most vulnerable position (bottom corner) in two EPS boxes is shown in Figure 16: 1) a new box manufactured by Promens Tempra ehf. (Hafnarfjörður, Iceland) with rounded corners and 2) another box (referred to as “original”) with less rounding of corners, still weighing around 11% more. The environmental temperature fluctuations causing the product temperature fluctuations in Figure 16 are illustrated in Figure 17.
Figure 16. Mean product temperature at the bottom corners of the original (O) and the new (N) EPS boxes during a dynamic temperature period. The mean product temperature was calculated from four bottom corner positions in two boxes for both the original and the new boxes.20
Figure 17. Mean surface temperature for the original (O) and the new (N) EPS boxes during a dynamic temperature period.20
20 Björn Margeirsson, Hélène L. Lauzon, Kolbrún Sveinsdóttir, Eyjólfur Sveinsson, Hannes Magnússon, Sigurjón Arason, Emilía Martinsdóttir. 2010. Effect of improved design of wholesale EPS fish boxes on thermal insulation and storage life of cod loins – simulation of air and sea transport. Matís report 29-10, 38 pages.

19
A simple correlation for the warm up time (in hours) given by BASF21 can be used in order to predict warm up time at steady ambient temperature:
,
,
1 / /ln
3.6fb amb mean init
p pamb mean final
h R d k T Tt m C
A T T+ + −
= ⋅ ⋅ ⋅⋅ −
(10)
From Eqn. 10, the mean temperature (Tt) of fillets in wholesale boxes subject to a steady thermal load of duration t (hours) can be yielded as: The internal area of the box is represented by A [m2] = 2 x (L x W + L x H + W x H), the fillet weight by m (kg), the specific heat capacity of the fillets by cp (3.85 kJ/kg/K), the convective heat transfer between box and ambient air by h (W/m2/K), the thermal resistance between fillets and box by Rfb (m2K/W), the thickness of the box by d (m), the thermal conductivity of the box walls by k (W/m/K) and finally, the initial fillet temperature and ambient temperature by Tinit (°C) and Tamb (°C), respectively.
Figure 18. Effect of ambient temperature on the estimated mean temperature of a 3‐kg bulk of whitefish fillets stored in an EPS box (3 kg capacity) as influenced by time. The initial fillet temperature is assumed to be 1 °C and the convective heat transfer coefficient outside the box is assumed to equal 5 W/m2/K (representing no wind, i.e. natural convection).
21 BASF, Styropor Technical Information. 2001 [accessed 23 Oct 2008]; 2001 Edition:[Available from: http://www.plasticsportal.net/wa/plasticsEU~en_GB/portal/show/content/products/foams/styropor_peripor.
3.6exp(1/ / )
amb initt amb
p fb
T TT TAt
mc h R d k
−= −
⎛ ⎞⎜ ⎟⎜ ⎟+ +⎝ ⎠
(11)

20
Figure 19. Effect of ambient temperature on the estimated mean temperature of a 5‐kg bulk of whitefish fillets stored in an EPS box (5 kg capacity) as influenced by time. The initial fillet temperature is assumed to be 1 °C and the convective heat transfer coefficient outside the box is assumed to equal 5 W/m2/K (representing no wind, i.e. natural convection).
The estimated warm up of fresh white fish fillets is shown in Figure 18 and Figure 19 for a single 3 kg EPS box and a single 5 kg EPS box, respectively. The convective heat transfer coefficient (h) is assumed to be 5 W/m2/K, the thermal resistance inside the box (Rfb) is assumed to be negligible according to BASF but may be taken as high as 0.05 W/m2/K.19 These figures reveal the importance of minimizing the time that packaged fish fillets are stored in single packages at as low temperature as 10 °C even though they are packed in well insulated EPS boxes. They also show that fillets in 3 kg EPS boxes are more negatively affected by thermal loads than fillets in 5 kg EPS boxes.
4.1.2 Importance of precooling before packaging The importance of precooling white fish fillets before packaging is obvious when two thermally abused 5 kg EPS boxes at 15 °C ambient temperature are compared, the first one containing 5 kg of precooled fillets down to ‐1.0 °C, the other one containing 5 kg of fillets at 1.0 °C. The enthalpy of cod at ‐1 °C is 307 kJ/kg compared to 337 kJ/kg at 0 °C. 22 This means that 30 kJ/kg will be transferred into the packaged fillets before their temperature has increased from ‐1.0 °C to 0.0 °C. The heat transfer can be calculated as
∆ 1
∆
(12)
where ∆ is the temperature difference between the ambience and the product, i.e. ca. 15.5 °C in this case. The R‐value can be calculated as (see Eq. (11)):
22 Rao, M.A. and Rizvi, S.S. 1995. Engineering Properties of Foods. 2nd edn. Marcel Dekker, Inc. New York.

21
1 1
50
0.0240.033
0.927
(13)
hence, 1
0.927 /0.254 · 15.5 4.2
(14)
The melting time for 5 kg of fish fillets packed in EPS box and abused at 15°C, i.e. the time it takes the mean temperature of 5 kg of fillets in an EPS box too rise from ‐1 to 0 °C is thus
0 1 °30 · 5
4.2 /35300 . 9.8
(15)
This implies that by precooling white fish fillets down to ‐1 °C before packaging in EPS boxes the products earn an extra protection against a thermal load of 15 °C for almost 10 hours compared to precooled products to 0 °C. Applying Eq. (11) and Figure 19 shows that fillets with initial temperature at 1 °C would have the mean product temperature of 6.6 °C after a 15 °C thermal load for 9.8 hours. Recommendations:
Minimise packaging time and limit the packaging room temperature as possible according to regulations. The temperature of fillets waiting on the line for being packaged can easily rise from 1 °C to 3‐4 °C at packaging room temperature of 20 °C.
Use well insulated fish boxes. Expanded polystyrene (EPS) boxes are preferred rather than corrugated plastic (CP) boxes. Corrugated fibreboard boxes with EPS panels also have high thermal resistance and boxes made of polyurethane (PUR) foam even higher than EPS.23
Apply frozen ice/gel packs on top of fish fillets before closing the fish box. Suitable ice pack size is 125 – 250 g for 3 – 7 kg of fish fillets.
Use as large packaging units as possible (e.g. 5 kg instead of 3 kg), bearing in mind the client‘s requirements. It should, however, be noted that larger temperature gradients inside each thermally loaded box are expected as the box gets larger, resulting in different fish quality inside larger boxes assuming sufficiently great thermal load.
Load packages on pallets and put in a chilled storage as soon as possible after packaging in order to minimise thermal load on packages.
However, less insulated fish boxes are actually preferable when the ambient temperature is lower than the product temperature. This applies when precooling in processing before packaging is inadequate resulting in fish fillet temperature higher than ca. 2 – 3 °C and the chill chain from the processor to the wholesaler/consumer is unbroken. But since the temperature in many (air borne) chill chains can be quite dynamic, effective precooling before packaging should be emphasised and the well precooled products well thermally insulated in EPS/PUR boxes. In containerised sea borne 23 Singh, S.P., Burgess, G., and Singh, J., 2008. Performance comparison of thermal insulated packaging boxes, bags and refrigerants for single-parcel shipments. Packaging Technology and Science, 21(1): pp. 25-35.

22
chill chains the insulation requirements on the packaging are much less and thus more possibilities to use less insulated packaging materials. Applying different types of ice (e.g. plate ice, flake ice, crushed block ice) or cooling packs inside wholesale boxes containing superchilled (e.g. CBC‐chilled) fillets transported in properly functioning mechanically refrigerated containers does not seem to be important with regard to optimised temperature control. This is due to the fact that the product temperature is brought down to ‐1.0 to ‐0.5 °C in the CBC cooling and the ambient temperature normally is very close to the product temperature. For more information on cooling during packaging a reference should be made to Valtýsdóttir et al. (2010).9
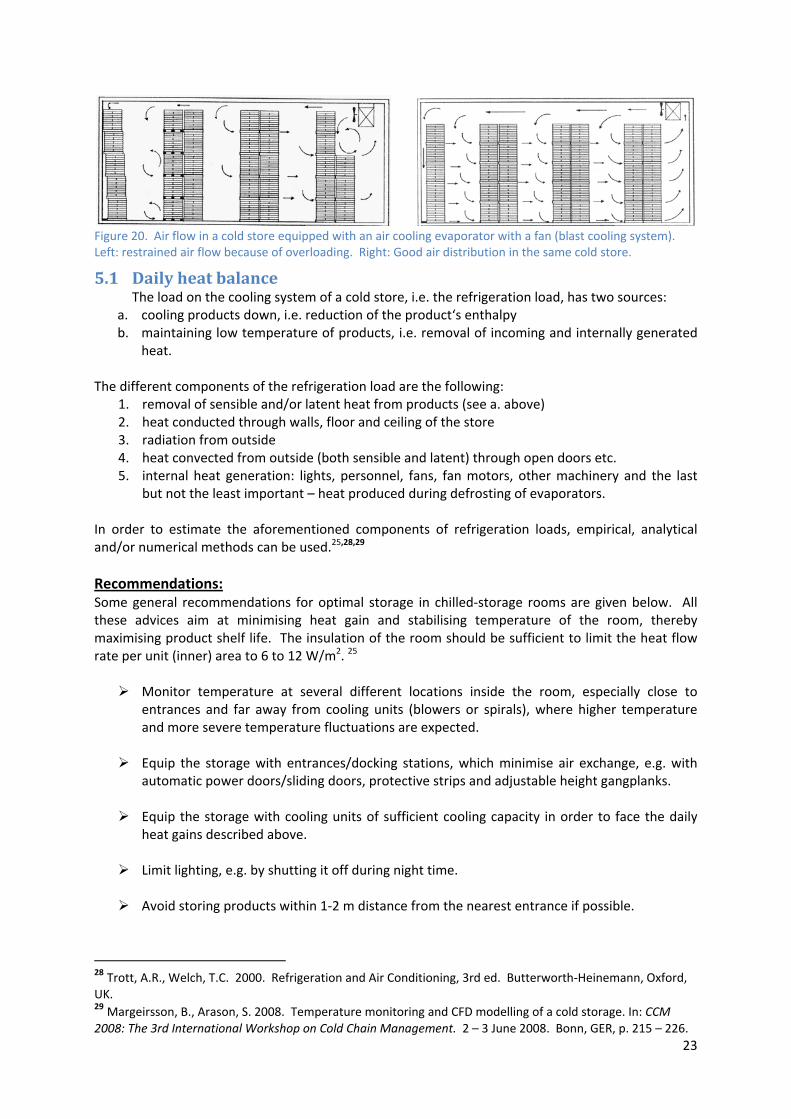
5 Chilled storage Reference should be made to Cold Store Guide (International Institute of Refrigeration‐IIR, 1993)24 and Insulation and airtightness of cold rooms (IIR, 2002)25 for further information on cold stores, in particular their construction, operation and safety aspects. The importance of proper precooling before packaging should be emphasised because specially designed precooling equipment, such as the CBC equipment (see chapter 3) cools the products much faster to the desired temperature than storage in a chilled store after having been packaged. The purpose of the chilled storage room is to maintain low temperature of foodstuff for storage, not to cool the foodstuff to the desirable temperature. Regarding the storage temperature of fresh fish fillets,superchilled storage is advantageous to extend the freshness and shelf life period, while comparison of abused products, either CBC processed, liquid/slurry ice cooled or uncooled in process, has shown the greater benefit of CBC cooling.13 Temperature abuse can be extremely detrimental in “unprotected” or uncooled fish products or in those cooled but produced with poor hygienic conditions and leading to high microbial contamination. Decreasing average fillet temperature to ‐0.8 °C or ‐1.3 °C by CBC cooling and superchilled storage in EPS boxes has been shown to increase freshness period by 20‐25% compared to fillets stored at 0‐1 °C while a smaller gain in shelf life was obtained.26 In general, temperature is more strictly controlled in chilled‐storage rooms than frozen‐storage rooms. This is in accordance to the fact that the temperature inside chilled rooms is closer to the point of initial freezing in food, which is generally close to ‐1 °C. Air temperature should be kept as close to 0 °C, still bearing in mind the danger of ice formation on floors. In order to obtain efficient heat transfer between cooling air and the products, free air flow must be secured throughout the room (see Figure 20)27 and an air circulation ratio of 40 is commonly used.25 This implies that the volume of circulating air in the room in 1 hour equals 40 times the volume of the empty room.
24 International Institute of Refrigeration (IIR), 1993. Cold store guide. Paris, France. 25 International Institute of Refrigeration (IIR), 2002. Insulation and airtightness of cold rooms. Paris, France. 26Martinsdóttir E, Lauzon HL, Tryggvadóttir SV. 2005. Áhrif roðkælingar á gæði fiskflaka. Rannsóknastofnun fiskiðnaðarins/Icelandic Fisheries Laboratories, Verkefnaskýrsla/Project Report 10‐05, 50 p (Icelandic). 27 Johnston, W.A., Nicholson, F.J., Roger, A., Stroud, G.D. Freezing and refrigerated storage in fisheries. FAO Fisheries Technical Paper. No. 340. Rome, FAO. 1994. Available at http://www.fao.org/docrep/003/v3630e/V3630E08.htm
23
5.1 Daily heat balance The load on the cooling system of a cold store, i.e. the refrigeration load, has two sources:
a. cooling products down, i.e. reduction of the product‘s enthalpy b. maintaining low temperature of products, i.e. removal of incoming and internally generated
heat. The different components of the refrigeration load are the following:
1. removal of sensible and/or latent heat from products (see a. above) 2. heat conducted through walls, floor and ceiling of the store 3. radiation from outside 4. heat convected from outside (both sensible and latent) through open doors etc. 5. internal heat generation: lights, personnel, fans, fan motors, other machinery and the last
but not the least important – heat produced during defrosting of evaporators. In order to estimate the aforementioned components of refrigeration loads, empirical, analytical and/or numerical methods can be used.25,28,29 Recommendations: Some general recommendations for optimal storage in chilled‐storage rooms are given below. All these advices aim at minimising heat gain and stabilising temperature of the room, thereby maximising product shelf life. The insulation of the room should be sufficient to limit the heat flow rate per unit (inner) area to 6 to 12 W/m2. 25
Monitor temperature at several different locations inside the room, especially close to entrances and far away from cooling units (blowers or spirals), where higher temperature and more severe temperature fluctuations are expected.
Equip the storage with entrances/docking stations, which minimise air exchange, e.g. with automatic power doors/sliding doors, protective strips and adjustable height gangplanks.
Equip the storage with cooling units of sufficient cooling capacity in order to face the daily heat gains described above.
Limit lighting, e.g. by shutting it off during night time.
Avoid storing products within 1‐2 m distance from the nearest entrance if possible.
28 Trott, A.R., Welch, T.C. 2000. Refrigeration and Air Conditioning, 3rd ed. Butterworth‐Heinemann, Oxford, UK. 29 Margeirsson, B., Arason, S. 2008. Temperature monitoring and CFD modelling of a cold storage. In: CCM 2008: The 3rd International Workshop on Cold Chain Management. 2 – 3 June 2008. Bonn, GER, p. 215 – 226.
Figure 20. Air flow in a cold store equipped with an air cooling evaporator with a fan (blast cooling system). Left: restrained air flow because of overloading. Right: Good air distribution in the same cold store.

24
Restrict unnecessary openings of the chilled room.
Secure free air flow throughout the store and an air circulation ratio of 40.
6 Transport post processing Reference should be made to Guide to refrigerated transport (IIR, 1995)30 for an in‐depth review on refrigerated transport. Research has shown that the temperature in sea freight is much more stable than in air freight relying on the existence of various interfaces of the segmental air transport chains.15 Below, special consideration is given to interfaces, which are found in most chill chains since they normally are discrete, i.e. made up of different transport modes. Advice is given on transport by air, road and sea, separately. The reader interested in rail transport is referred to IIR (1995).30
6.1 Interfaces between different links in the cold chain The risk of a commonly experienced temperature abuse at various interfaces in the chill chain should be minimised. This can be done with e.g. technical solutions such as well designed docking stations with door sealing cushions to minimise air flow and heat transfer to the packaged products. Satisfactory information flow, both upstream and downstream the chain, is also essential in order to minimise unnecessary delays at the interfaces. An important issue regarding certain handover points in certain chill chains is that master packaging is commonly broken up, often in order to maximise volume utilization. This is the way large part of chilled fish products are handled before being loaded on board airplanes and the processor should prepare his product with adequate precooling before packaging and insulation of the packaging.
6.2 Road transport Recommendations:
Check product temperature before loading.
Air temperature should be kept between as close to ‐1 °C and no higher than 4 °C for optimal storage of superchilled fish products. The importance of maintaining actually as low temperature as ‐1 °C is governed by the insulation performance of the packaging and duration of the transport.
Permit free flow of cooling air around the cargo (similar to what is shown for a chilled storage room in Figure 20).
Utilise forced air circulation, i.e. distribute flow of chilled air from cooling unit throughout the whole truck/container (see Figure 21).31
30 International Institute of Refrigeration (IIR), 1995. Guide to refrigerated transport. Paris, France. 31 Moureh, J., Flick, D, 2004. Airflow pattern and temperature distribution in a typical refrigerated truck configuration loaded with pallets. International Journal of Refrigeration, 27(2004), p. 464-474.

25
Monitor the air temperature inside the container, especially far away from the cooling unit. Since the cooling unit is most often at the front, the most sensitive location is at the back close to the roof. Preferably, the performance of the cooling system inside the body should be studied by mapping the temperature distribution under real circumstances (with the truck loaded) before a decision on placement of recording thermometers (temperature loggers) is made.
Mechanically refrigerated containers with overall heat transfer coefficient (K‐ or U‐coefficient) equal to or less than 0.4 W/m2/K are needed in most carriages with fresh fish products. However, if the road transport time is only a few hours, insulated containers (i.e. equipment of which the body is built with insulating walls, doors, floor and roof such that K < 0.7 W/m2/K but not equipped with any refrigeration equipment) can be used, especially when the environmental temperature is close to 0 °C.
Figure 21. a) and b): Numerical results concerning contours of iso‐temperatures in the most sensitive plane of a truck without and with air ducts. c): Schematic layout of air ducts and air distribution in the studied truck.
c)

26
6.3 Sea transport The main advantage that sea transport has compared to air transport is continuity in the transport, i.e. the chain has few and relatively secure handover points regarding temperature control. Containers (refrigerated and non‐refrigerated) are multimodal equipment, which generally allow goods to be switched between land and sea transport without the need of breaking up the cargo. Recommendations:
Check product temperature before loading the container.
Permit free flow of cooling air around the cargo by not over‐loading the container.
Air temperature should be kept between ‐1 °C and 0 °C for optimal storage of superchilled fish products. The superchilled storage conditions during sea transport are in general more important than during road transport since normally, sea transport lasts longer.
There is not a definite need for melting ice on top of fresh fish fillets when transported in containers with proper temperature control. If used then make sure melted ice water does not stay in contact with the products or that cross contamination is not caused by melted water from one fish box to another.
6.4 Air transport Recommendations: Temperature during air freight is in general not as well controlled as during surface (land and sea) transport.15 However, the consignor/shipper can follow the following recommendations in order to minimise the risk of undesirable thermal loads on the perishable freight:
Apply precooling before packaging as one step of the processing (see chapter 3). Fish products packaged at ‐0.5 °C simply can take more temperature abuse than products at 4 °C when packaged.
Use well insulated packaging solutions and pack as densely as possible, given the products requirements (see chapter 4).
Check product temperature before shipping the products.
Ship products to the departing airport as late as possible, especially if refrigerated storage is unavailable there. Still, the products must be in time at the airport according to the freight forwarder‘s/transporter‘s specification. It follows that temperature controlled transport to the airport should be used.
Protect the products from challenging climatic conditions such as rain and direct sun. Thin polyethylene films protect against rain but not sunshine.
Select a direct flight to minimise the number of thermally hazardous interfaces in the chill chain.
Make sure that all necessary documentation is sent beforehand to the collector of the cargo at the destination airport. Furthermore, make sure that the freight is collected as soon as

27
possible in a temperature controlled vehicle and no delays are in the transport to the client/market.
When a new freight forwarder/airline is taking care of the air transport, the temperature control in the chill chain should be investigated in at least three separate shipments with the help of ca. 4 – 6 temperature loggers. The cost related to such tests is minimal compared to the value of the goods and this can give valuable information on room for improvements in the chill chain.
7 ACKNOWLEDGEMENTS This report is based on results from the research of the EU‐funded Integrated Research Project CHILL‐ON (contract FP6‐016333‐2), the Chill‐add‐on (Samþætting kælirannsókna – Kælibót) funded by the AVS research fund under the Ministry of Fisheries (project no. R 061‐06), the Technology Development Fund at the Icelandic Centre for Research (project no. 061358006) and Thermal modelling of chilling and transport of fish (Hermun kæliferla) funded by AVS Fund of Ministry of Fisheries in Iceland (project no. R037‐08), Technology Development Fund of the Icelandic Centre for Research (project. no. 081304508) and University of Iceland Research Fund. The financing of these projects is gratefully acknowledged.

28
Nomenclature A Area of fish box (m2),
surface area of fish tub walls (m2) cp, Temperature dependent specific heat, of white
fish (kJ/kg/K) CI Ice mass fraction (ice concentration, %) d Fish box wall thickness (m) Δ Thickness of the tub walls (m, mm) Δ Temperature difference between fish and
environment (°C) Total amount of energy needed for cooling
and storage (kJ) Inner height of tub (m, mm)
H Height of tub (m, mm) h Convective heat transfer coefficient outside
fish box/tub (W/m2/K) k Thermal conductivity (W/m/K) L Length of tub (m, mm)
Inner length of tub (m, mm) Lice Latent heat of ice (kJ/kg) m Fillet mass inside fish box (kg)
Mass of fish (kg) Mass of pure ice (kg) Mass of slurry ice (kg)
Rfb Thermal resistance between fish and box, i.e. inside fish box (m2K/W)
Heat flow into fish tub (W) Tamb Ambient temperature (°C) Tinit Fillet temperature before thermal load is
applied (°C) Tt Fillet temperature at time t of thermal load
(°C) t Storage time (seconds, hours) U,K
Overall heat transfer coefficient (W/m2/K)
W Width of tub (m, mm) Inner width of tub (m, mm) Ice concentration (%)