optimising portfolio hedging strategies - cboe
TRANSCRIPT

Portfolio Hedging Strategies Alessandro Esposito

2
CBOE
Optimising Portfolio Hedging Strategies

3
• The case for Consistent Hedging
•Optimizing Hedging Strategies
• Sizing initial trades and managing positions over time
•Cross Asset Hedging
•Conclusions

4
The Case for Consistent Hedging Hedging adds convexity to your portfolio
Mitigating the effect of adverse market moves justifies hedging across strategies

5
50
60
70
80
90
100
110
120
130
140
150
Feb-08 Jun-08 Oct-08 Feb-09 Jun-09 Oct-09 Feb-10 Jun-10 Oct-10 Feb-11 Jun-11 Oct-11 Feb-12 Jun-12 Oct-12 Feb-13 Jun-13
SPXT SPXT + SPX 3M 95% Put
The Case for Consistent Hedging Buying puts simply won’t do the trick
Buying puts simply won’t do the trick Consistent hedging requires a more structured approach
SPX total return chart vs. 3m put hedged portfolio rolled monthly
Source: Bloomberg, Bank of America Merrill Lynch
6
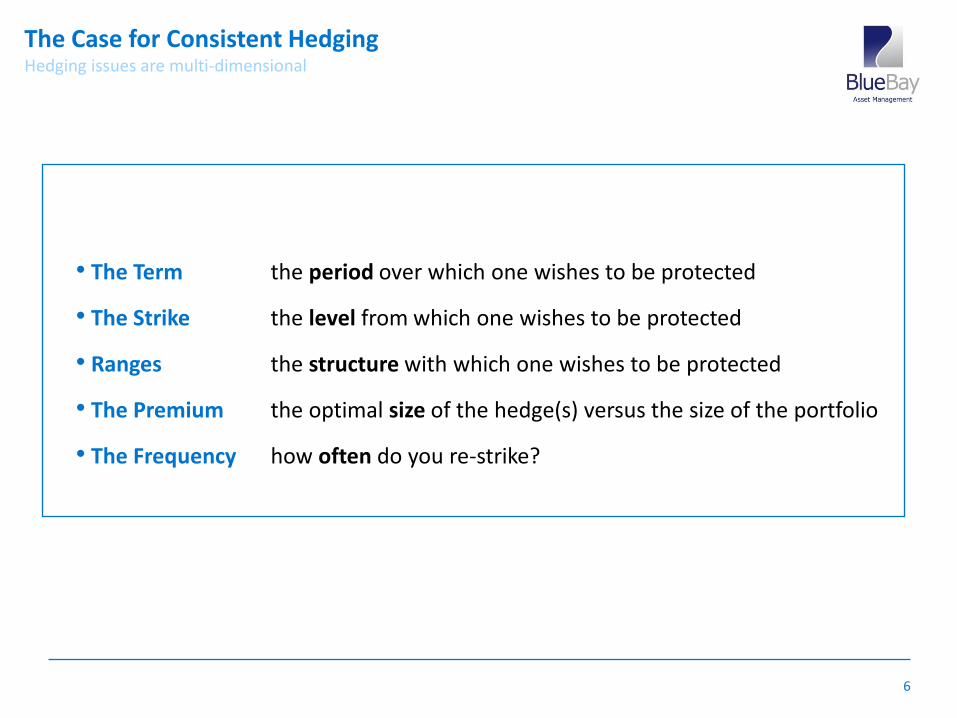
The Case for Consistent Hedging Hedging issues are multi-dimensional
• The Term the period over which one wishes to be protected
• The Strike the level from which one wishes to be protected
• Ranges the structure with which one wishes to be protected
• The Premium the optimal size of the hedge(s) versus the size of the portfolio
• The Frequency how often do you re-strike?

7
• The case for Consistent Hedging
•Optimizing Hedging Strategies
• Sizing initial trades and managing positions over time
•Cross Asset Hedging
•Conclusions

8
Optimising Hedging Strategies The avoidance of market timing risk
Straight Puts
Put Spreads
Calendars Collars
COMPLEXITY
PREDICTABILITY
The complexity of the payout increases the predictability of the hedged strategy
9
Optimising Portfolio Hedging Strategies
In order to optimise portfolio hedging strategies, we need to be able to compare them : By evaluating the VaR of the hedged portfolio we are able to size different strategies by evaluating their impact on the risk of the portfolio
Q : How do you compare different strategies ? A : Look at their volatility
10
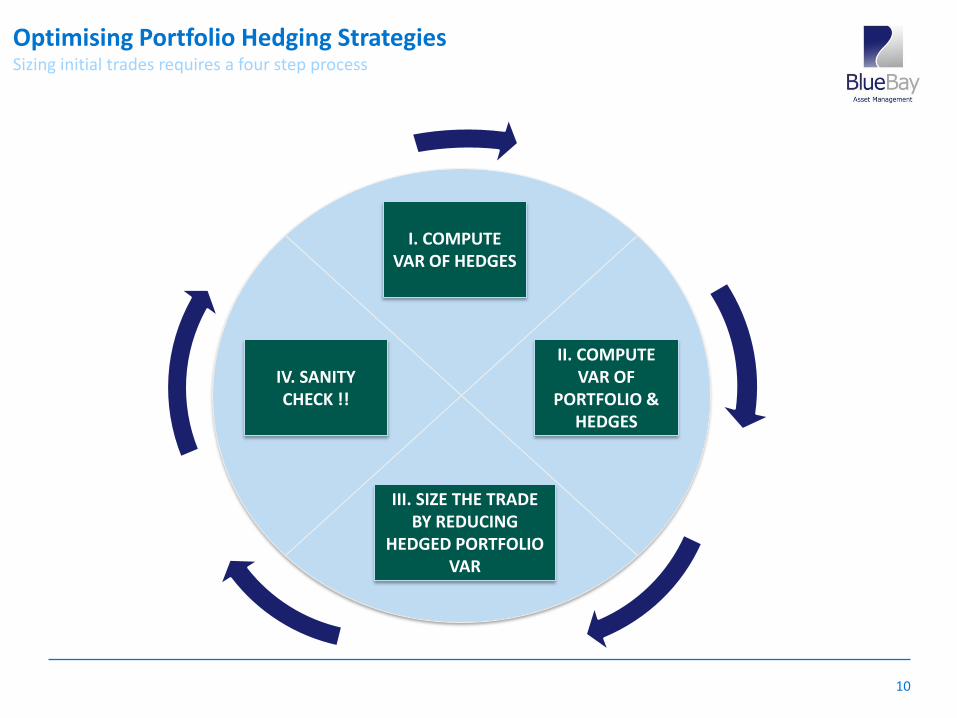
I. COMPUTE VAR OF HEDGES
II. COMPUTE VAR OF
PORTFOLIO & HEDGES
III. SIZE THE TRADE BY REDUCING
HEDGED PORTFOLIO VAR
IV. SANITY CHECK !!
0
Optimising Portfolio Hedging Strategies Sizing initial trades requires a four step process
11
• The case for Consistent Hedging
•Optimizing Hedging Strategies
• Sizing initial trades and managing positions over time
•Cross Asset Hedging
•Conclusions

12
Sizing Initial Trades and Managing Positions Over Time
Using the S&P 500 as our proxy portfolio we target a 10% risk reduction via a 3m 95%/85% put spread
0%
2%
4%
6%
8%
10%
12%
14%
16%
18%
20%
0%
20%
40%
60%
80%
100%
120%
140%
29-Feb-08 28-Feb-09 28-Feb-10 28-Feb-11 29-Feb-12 28-Feb-13
3m 95p-85p
Index
Hedged Strategy
SPX return chart vs. 3m put spread hedged portfolio rolled daily
Source: Bloomberg, Bank of America Merrill Lynch, Bluebay
• Sizing the put spread to 118% of its notional VaR goes from 0.42 to 0.38. • The Sharpe ratio improves from 0.13 to 0.15 • The high correlation between the portfolio and the hedged strategy indicates the ability to include • hedging as part of portfolio management

13
SPX 1m95p 3m95p 12m90p 1m95-85ps 3m 95-85ps 1m95p-12m90p
Sharpe Ratio 0.134 0.16 0.16 0.15 0.15 0.15
Multiplier 0.55 0.40 0.33 1.14 1.18 VaR can't
be improved
• Hedge ratios diminish with longer time horizons for single put trades • Long Calendar put spreads additive to risk
Sizing Initial Trades and Managing Positions Over Time VaR Equivalent Hedging Strategies
Source: Bloomberg, Bank of America Merrill Lynch, Bluebay
Sharpe Ratio and Notional Hedge Ratio of SPX portfolio hedged with different strategies

14
1m95p 3m95p 12m90p 1m95-85ps 3m 95-85ps
Hedge Ratio Monthly Rolls
0.20 0.20 0.15 0.40 0.50
Hedge Ratio Daily Rolls 0.55 0.40 0.33 1.14 1.18
Sizing Initial Trades and Managing Positions Over Time
• Lower frequency dramatically reduces the hedge ratios • For shorter maturities, option strategies can be additive to VaR
Readily available data demonstrate the impracticality of rolling hedges daily We compare daily vs. monthly rolls
Impact of Re-Hedging over time
Notional Hedge Ratio of SPX portfolio hedged with different strategies, Daily vs. Monthly Roll
Source: Bloomberg, Bank of America Merrill Lynch, Bluebay

15
Sizing Initial Trades and Managing Positions Over Time Re-hedging frequency and the impact on returns
• Lower frequency dramatically differentiates returns among strategies
40%
60%
80%
100%
120%
140%
160%
29-Feb-08 31-Aug-08 28-Feb-09 31-Aug-09 28-Feb-10 31-Aug-10 28-Feb-11 31-Aug-11 29-Feb-12 31-Aug-12 28-Feb-13
SPXT SPXT + SPX 1M 95% Put SPXT + SPX 1M 95%-85% Put Spread
SPXT + SPX 3M 95% Put SPXT + SPX 3M 95%-85% Put Spread SPXT + 12M 90% Put
SPXT + SPX 1M 95% Put - 12M 90% Put
Percentage Cumulative Returns of SPX hedged porfolios for a VaR reduction of 10%, using monthly rolls
Source: Bloomberg, Bank of America Merrill Lynch
16
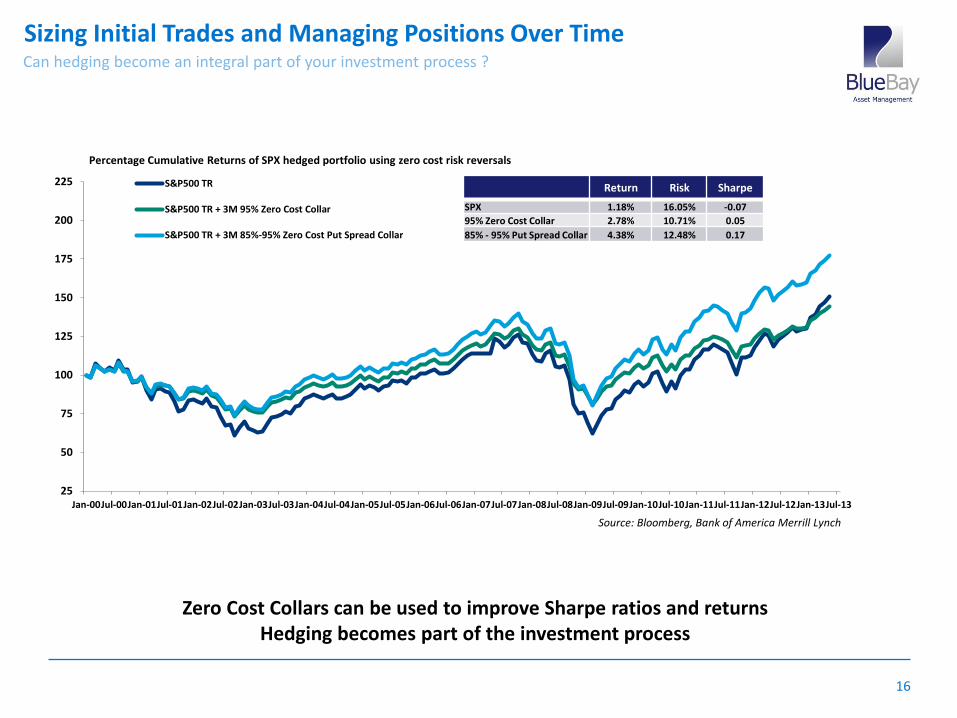
Can hedging become an integral part of your investment process ?
25
50
75
100
125
150
175
200
225
Jan-00Jul-00Jan-01Jul-01Jan-02Jul-02Jan-03Jul-03Jan-04Jul-04Jan-05Jul-05Jan-06Jul-06Jan-07Jul-07Jan-08Jul-08Jan-09Jul-09Jan-10Jul-10Jan-11Jul-11Jan-12Jul-12Jan-13Jul-13
S&P500 TR
S&P500 TR + 3M 95% Zero Cost Collar
S&P500 TR + 3M 85%-95% Zero Cost Put Spread Collar
Source: Bloomberg, Bank of America Merrill Lynch
Return Risk Sharpe
SPX 1.18% 16.05% -0.07
95% Zero Cost Collar 2.78% 10.71% 0.05
85% - 95% Put Spread Collar 4.38% 12.48% 0.17
Zero Cost Collars can be used to improve Sharpe ratios and returns Hedging becomes part of the investment process
Sizing Initial Trades and Managing Positions Over Time
Percentage Cumulative Returns of SPX hedged portfolio using zero cost risk reversals
17
• The case for Consistent Hedging
•Optimizing Hedging Strategies
• Sizing initial trades and managing positions over time
•Cross Asset Hedging
•Conclusions

18
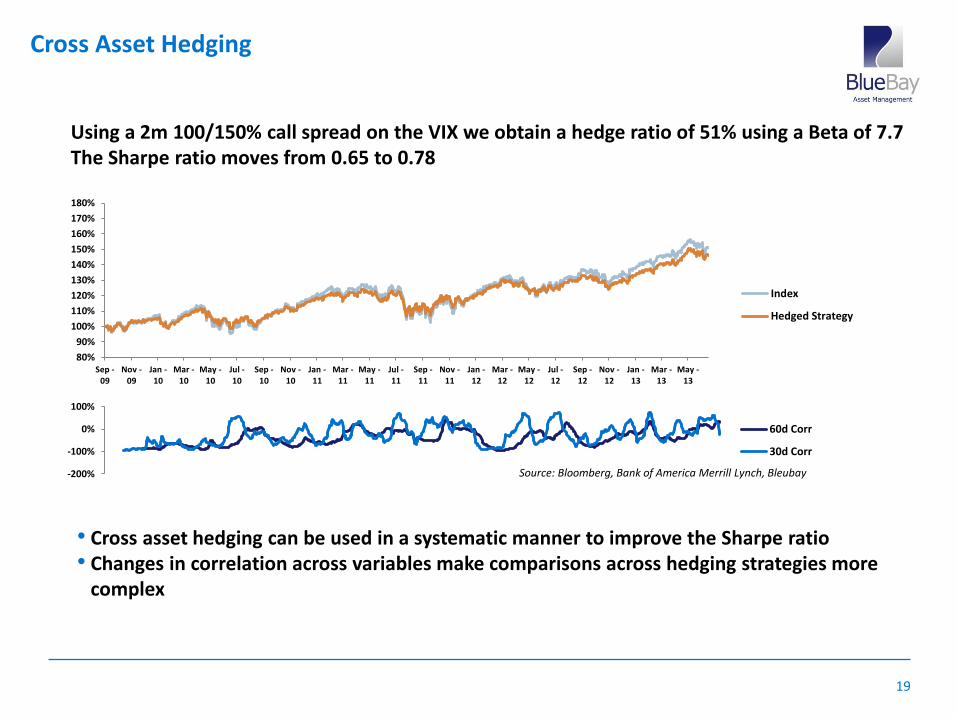
Cross Asset Hedging
For cross asset hedging regression analysis is used to compare the variables
VIX vs SPX returns over the past year give a Beta of 7.7
This is not a stable relationship over time Rolling correlations need to be monitored
Vix Linear regression regression on SPX returns
Source: Bloomberg
19
Cross Asset Hedging
80%
90%
100%
110%
120%
130%
140%
150%
160%
170%
180%
Sep -09
Nov -09
Jan -10
Mar -10
May -10
Jul -10
Sep -10
Nov -10
Jan -11
Mar -11
May -11
Jul -11
Sep -11
Nov -11
Jan -12
Mar -12
May -12
Jul -12
Sep -12
Nov -12
Jan -13
Mar -13
May -13
Index
Hedged Strategy
• Cross asset hedging can be used in a systematic manner to improve the Sharpe ratio • Changes in correlation across variables make comparisons across hedging strategies more • complex
Using a 2m 100/150% call spread on the VIX we obtain a hedge ratio of 51% using a Beta of 7.7 The Sharpe ratio moves from 0.65 to 0.78
-200%
-100%
0%
100%
60d Corr
30d Corr
Source: Bloomberg, Bank of America Merrill Lynch, Bleubay

20
• The case for Consistent Hedging
•Optimizing Hedging Strategies
• Sizing initial trades and managing positions over time
•Cross Asset Hedging
•Conclusions

21
CONCLUSIONS
• Hedging can become an integral part of the investment process
• VaR methodologies can be used to compare hedges, including cross asset hedges
• Frequency of re-hedging is a key factor sizing and comparing trades
• Systematic hedging requires more complex payoff
• Correlation changes affect cross asset hedges

22
Disclaimer
V2 – Data end June 2013. Published 16 July 2013
This document is issued in the United Kingdom (UK) by BlueBay Asset Management LLP (BlueBay), which is authorised and regulated by the UK Financial Conduct Authority (FCA), registered with the US Securities and Exchange Commission, the Commodities Futures Trading Commission and is a member of the National Futures Association. In the United States by BlueBay Asset Management USA LLC which is registered with the US Securities and Exchange Commission. In Japan by BlueBay Asset Management International Limited which is registered with the Kanto Local Finance Bureau of Ministry of Finance, Japan. In Hong Kong by BlueBay Hong Kong Limited which is registered by the Securities and Futures Commission. In Australia BlueBay is exempt from the requirement to hold an Australian financial services licence under the Corporations Act in respect of financial services as it is regulated by the FCA under the laws of the UK which differ from Australian laws. All data has been sourced by BlueBay. To the best of BlueBay’s knowledge and belief this document is true and accurate at the date hereof. BlueBay makes no express or implied warranties or representations with respect to the information contained in this document and hereby expressly disclaim all warranties of accuracy, completeness or fitness for a particular purpose. The document is intended for “professional clients” and “eligible counterparties” (as defined by the FCA) only and should not be relied upon by any other category of customer. This document does not constitute an offer to sell or the solicitation of an offer to purchase any security or investment product in any jurisdiction and is for information purposes only. This document is not available for distribution in any jurisdiction where such distribution would be prohibited and is not aimed at such persons in those jurisdictions. Except where agreed explicitly in writing, BlueBay does not provide investment or other advice and nothing in this document constitutes any advice, nor should be interpreted as such. Past performance is not indicative of future results. No BlueBay Fund will be offered, except pursuant and subject to the offering memorandum and subscription materials (the "Offering Materials"), which in Canada may be provided to Canadian permitted clients only, and not to any other category of investor. This document is for general information only and is not a complete description of an investment in any BlueBay Fund. If there is an inconsistency between this document and the Offering Materials for the BlueBay Fund, the provisions in the Offering Materials shall prevail. The investments discussed may fluctuate in value and investors may not get back the amount invested. You should read the Offering Materials carefully before investing in any BlueBay fund. In Canada, BlueBay is not registered under securities laws and is relying on the international dealer exemption under applicable provincial securities legislation, which permit BlueBay to carry out certain specified dealer activities for those Canadian residents that qualify as "a Canadian permitted client”, as such term is defined under applicable securities legislation . Any indices shown are presented only to allow for comparison of the BlueBay funds performance to that of certain widely recognised indices. Indices are not managed. Investors cannot invest directly in an index. Gross performance figures reflect the reinvestment of all dividends and earnings, but do not reflect the deduction of fees and expenses. The fund return will be reduced by the deduction of the applicable fees. A description of the specific fee is contained in the fund’s prospectus. No part of this document may be reproduced in any manner without the prior written permission of BlueBay Asset Management LLP. Copyright 2013 © BlueBay, the investment manager, advisor and global distributor of the BlueBay Funds, is a wholly-owned subsidiary of Royal Bank of Canada and the BlueBay Funds may be considered to be related and/or connected issuers to Royal Bank of Canada and its other affiliates. ® Registered trademark of Royal Bank of Canada. RBC Global Asset Management is a trademark of Royal Bank of Canada. BlueBay Asset Management LLP, registered office 77 Grosvenor Street, London W1K 3JR, partnership registered in England and Wales number OC370085. All rights reserved.