optimising use of bladder ultrasound scanners to improve the
TRANSCRIPT
Optimising the use of bladder ultrasound scanners to improve the quality and safety of patient care and reduce costs
An economic assessment to establish the best, most cost-efficient way to manage the provision and use of bladder ultrasound scanners in a hospital NHS trust
Dr Jacqui Prieto, Associate Professor and Clinical Nurse Specialist, March 2016
Abstract Background Portable bladder ultrasound scanning technology offers a non-invasive, fast and painless method to measure urine volume in the bladder. As an alternative to bladder catheterisation, it has been shown to significantly reduce urinary tract infection (UTI), as well as increasing patient comfort and satisfaction. Bladder scanning has become routine in acute care settings, yet despite its availability to the NHS for over 2 decades, its adoption has been slow and inconsistent. In order to optimise use in a hospital NHS trust and secure further investment an economic assessment was undertaken to establish the best management and investment strategy for the future. Method A detailed, monetised case study was undertaken. Cost avoidance analysis was used to demonstrate avoided spend associated with use of the bladder scanner. This enabled an assessment of the positive benefits to patients from the perspective of negative outcomes avoided, namely unnecessary bladder catheterisation and UTI. Data on actual use of bladder scanners during a one-month trust-wide audit was used to inform the assessment. The impact of bladder scanning in both high and low use environments was analysed in order to provide a balanced consideration of the implications for the trust as a whole. Cost consequence analysis was used to compare the existing approach to the management of bladder scanners, namely localised management by wards, with a proposed centralised approach using the trust’s Medical Equipment Library (MEL). Findings The avoided spend associated with the cost of bladder catheterisation and UTI was estimated to be in the region of £1,226,822 per year. This did not include the cost of bacteraemia attributed to UTI. Avoided spend associated with other benefits of using a scanner, such as avoidance of treatment delays and avoiding overnight stay in hospital were recognised as additional cost efficiencies. The set up and running costs of a scanner were estimated to be met within 6 to 24 months, depending on usage, after which significant ongoing cost efficiencies would be realised over its 8-10-year lifespan. Management of the trust’s fleet of bladder scanners within the MEL was considered advantageous in order to create efficiencies within the system, improving access, use and training across the trust and ensuring optimal maintenance. Conclusion Bladder scanners improve the quality and safety of patient care and reduce costs. This economic assessment has demonstrated the significant avoided spend associated with scanner use and identified the key benefits to patients, staff and the organisation as a whole. A compelling case has been made for management of bladder scanners within a MEL. Although this would not be expected to generate major cost savings, it would ensure resources are better allocated and best use is made of this technology, together with a coordinated system for capital replacement.
Optimising the use of bladder ultrasound scanners to improve the quality and safety of patient care and reduce costs
2
1. Introduction Portable bladder ultrasound scanning technology offers a non-invasive, fast and painless method to measure urine volume in the bladder. It is used to assess patients with symptoms of voiding difficulty or dysfunction, superseding urethral catheterisation as the method of choice. With minimal training it allows the precise assessment of urine volume, which underpins the decision to catheterise patients with acute urinary retention (the inability to void despite a full bladder), thereby avoiding unnecessary catheterisation. By contrast, catheterisation is an invasive, time-consuming and uncomfortable procedure, which carries the risk of urinary tract infection (UTI), UTI-related bacteraemia and other complications, as well as placing an increased demand on nursing time1. A recent meta-analysis of research on the effectiveness of the bladder scanner found it significantly reduces UTI, as well as increasing patient comfort and satisfaction2. The use of bladder scanning technology has become routine in acute care settings, yet despite its availability to the NHS for over 2 decades, its adoption has been slow and inconsistent. Undoubtedly this is due, at least in part, to the substantial upfront cost of a scanner, which is around £8-9K. At the hospital NHS trust where this case study is based bladder scanners were first introduced in 2002. There are now 32 scanners in use across the trust, which is an 1100-bed teaching hospital. The set-up and running costs associated with use of a scanner are compensated by the benefits and avoided spend resulting from the prevention of UTI and the avoidance of delays in treatment and discharge from hospital. However, the additional investment needed by the trust in order to maximise the benefits of scanning and further reduce costs was unclear. Moreover, as the existing localised approach to management of the trust’s fleet of scanners was known to be fragmented and inefficient, the case for a centralised approach within the trust’s Medical Equipment Library (MEL) required consideration. In order to sustain investment in bladder scanners and optimise their use a robust assessment was needed to determine the best, most cost-efficient approach for the future. 2. Key contexts and drivers Since 2011 the reduction of catheter-associated urinary tract infection (CA-UTI) has been a key work-stream within the trust and is linked to several local and national policy drivers for quality improvement. UTI is the second most common healthcare associated infection in hospitals3 and overuse of indwelling urinary catheters is a known problem4. In 2009, reducing UTI was identified as one of the Chief Nursing Officer for England’s eight High Impact Actions for Nursing and Midwifery5. Latterly, the NHS Safety Thermometer6 was launched and included CA-UTI as one of four harms to be measured and reduced, along with pressure ulcers, falls and venous thromboembolism. The need to improve care and lower costs underlies the Department of Health Quality, Innovation, Productivity and Prevention (QIPP) programme7 and local providers and commissioners have agreed standards and measures to reduce avoidable harm from CA-UTI, including participation in the NHS Safety Thermometer. In 2009 the Department of Health Procurement, Investment and Commercial Division (PICD) invited industry to submit proposals for innovative technologies that could be adopted by the NHS to make a positive contribution to the QIPP challenge. Verathon Medical Ltd, a leading manufacturer of portable bladder ultrasound scanners, submitted a successful proposal on the cost savings associated with use of bladder scanners and avoidance of CA-UTI. Consequently the device was listed under the Innovative Technology Adoption Procurement Programme (iTAPP) as a technology
Jacqui Prieto, March 2016
Optimising the use of bladder ultrasound scanners to improve the quality and safety of patient care and reduce costs
3
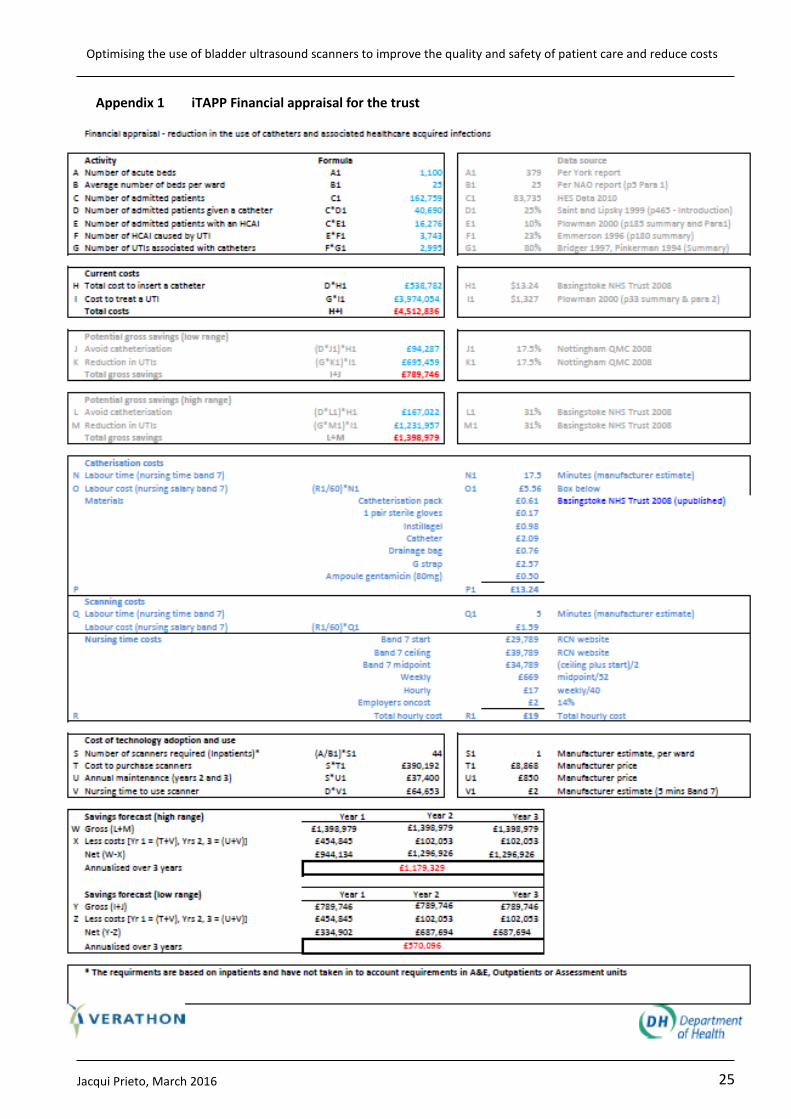
that reduces costs in planned care primarily by treatment avoidance. A framework to determine estimated cost savings was developed for use by Verathon Medical Ltd, together with NHS trusts. Appendix 1 illustrates the estimated cost savings to the trust, annualised over 3 years, as calculated using the framework. Projected cost savings were calculated to be between £570,096 and £1,179,329. However, these calculations are based on estimated rather than actual data and the sources of information used are now dated. Moreover, not all assumptions underlying the framework are clear. For example, the urine volume measurement that is assumed to necessitate urethral catheterisation is not stated, which affects the estimated savings associated with the avoidance of CA-UTI. Also, since the lifespan of a bladder scanner is 8-10 years the assessment of costs and benefits is required for this period of time. For these reasons it is difficult to determine the accuracy of the costs provided using the iTAPP framework. 3. Purpose of Economic Assessment This economic assessment examines the current arrangements, costs and benefits associated with the use of bladder scanners at the trust in order to inform the best management and investment strategy for the future. It comprises a detailed monetised case study using the most appropriate approaches to economic assessment for this purpose, namely a cost avoidance analysis and a cost consequence analysis. The cost avoidance analysis demonstrates the avoided spend associated with use of the bladder scanner. More specifically, it identifies the positive benefits to patients when their clinical assessment and care is delivered with access to a bladder scanner from the perspective of negative outcomes avoided (e.g. unnecessary bladder catheterisation, adverse events including UTI, prolonged stay in hospital). The cost consequence analysis compares the existing approach to the management of bladder scanners with a proposed centralised approach using the trust’s Medical Equipment Library (MEL). Data on actual use of bladder scanners during a one-month trust-wide audit is used to inform the assessment. Since scanner use across the trust is unlikely to change significantly from one month to the next, the data captured is extrapolated to estimate usage over one year. 4. Cost avoidance analysis A cost avoidance analysis is presented to demonstrate how use of a bladder scanner enables the costs associated with its absence to be avoided. Two scenarios are described to illustrate how use of the scanner in high and low usage environments prevents unnecessary bladder catheterisation, thereby avoiding CA-UTI, in patients assessed for urinary retention. Drawing on these examples, together with trust-wide audit data, the implications for the Trust as a whole are considered. 4.1 Scenario 1: A high use environment: Ward 21 (now Ward 22), trauma and orthopaedics 4.1.1 High requirement for bladder scanner use in trauma and orthopaedics The incidence of post-operative urinary retention (POUR) is reported to be much higher in patients undergoing orthopaedic lower limb surgery than in the general surgical population, occurring in at least 40% of patients8, which is 10 times greater than in general surgery9. Advanced age, pain, spinal anaesthesia, opioid analgesia, intravenous fluid replacement during surgery and immobility are among the many factors that may influence the development of POUR9,10. Acute urinary retention may also develop prior to surgery in patients with hip fracture11. Consequently, trauma and orthopaedic (T&O) units have a high requirement for use of the bladder scanner in order to assess
Jacqui Prieto, March 2016
Optimising the use of bladder ultrasound scanners to improve the quality and safety of patient care and reduce costs
4
for urinary retention and determine when a patient requires urinary catheterisation, both pre and post-operatively.
The T&O Unit at the trust comprises 137 beds on 5 wards: 3 trauma wards, 1 elective ward and 1 rehabilitation ward. In the 10 months between 01/05/2015 – 29/02/2016 there were 704 emergency fractured neck of femur operations and 648 elective joint replacement operations, averaging 70 and 65 operations respectively per month. Prior to April 2015 there were 2 bladder scanners in the T&O Unit, one located on Ward 7, the elective ward, and the other on Ward 22, a trauma ward. At the time of this case study in 2015, Ward 21 was a 34-bed trauma ward. The nursing team has since moved to Ward 22, which has 24 beds. This has not affected the total number of beds or types of patient in the T&O Unit as a whole, as the move was a direct swap with Ward 22. However the case as presented here needs to be considered accordingly and so illustrations of costs based on data collected on Ward 21 have also been adjusted to reflect projected use on Ward 22. 4.1.2 Bladder scanner use on Ward 21 Prior to April 2015 Ward 21 did not have its own bladder scanner, but instead borrowed one from adjacent wards, usually Ward 22. This meant it was difficult to scan patients repeatedly in order to monitor their condition over time, as the scanner would need to be returned to the host ward after each use. During a month-long trust-wide audit of bladder scanner use in Nov-Dec 2014, the scanner on Ward 22 was unavailable, as it had been sent away for repair. Instead, nurses on Ward 21 located a scanner on other wards. The total number of scans recorded on Ward 21 during the audit was 4, a rate of 1 scan per week. All 4 scans were to assess for urinary retention. The time recorded to locate a scanner for use was recorded as 15 minutes per scan, amounting to 1 hour of nursing time. This is likely to be an underestimate of the actual number of scans taken during the month given the requirement for nurses to complete an entry in the log record each time the scanner was used, which they may not have done. Nonetheless, it was considerably lower than expected for a T&O ward. In January 2015 the ward was provided with a loan scanner for its sole use for 8 weeks to provide a more accurate assessment of required usage. The total number of scans recorded during this period was 112, a rate of 14 scans per week (61 per calendar month). Between 0-7 scans per day were recorded. Most (94/112; 84%) scans were to assess for urinary retention, with 18 scans undertaken for other reasons, namely low urine output (n=15) and suspected catheter blockage (n=3). In all, 75 patients were scanned for urinary retention, some of whom were scanned more than once during the same day (19 repeat scans in total). This gives a rate of 5 scans for every 4 patients (1.25). Of these 75 patients, 15 were catheterised as a result of the scan; a rate of 1 catheterisation for every 5 patients scanned. 4.1.3 Projected bladder scanner use and urinary catheterisations on Ward 21 over one year Based on the above data, assuming that an average of 61 scans is conducted per calendar month, there would be 51 (84%) scans undertaken per month to assess for urinary retention. Assuming the ratio of scanning per patient with urinary retention is consistent at 5 scans for every 4 patients (1.25), this would equate to 41 patients per calendar month scanned at least once for urinary retention. Figure 1 provides an estimation of catheterisations avoided with use of the bladder scanner. It assumes all patients scanned for retention would otherwise have been catheterised with an
Jacqui Prieto, March 2016
Optimising the use of bladder ultrasound scanners to improve the quality and safety of patient care and reduce costs
5
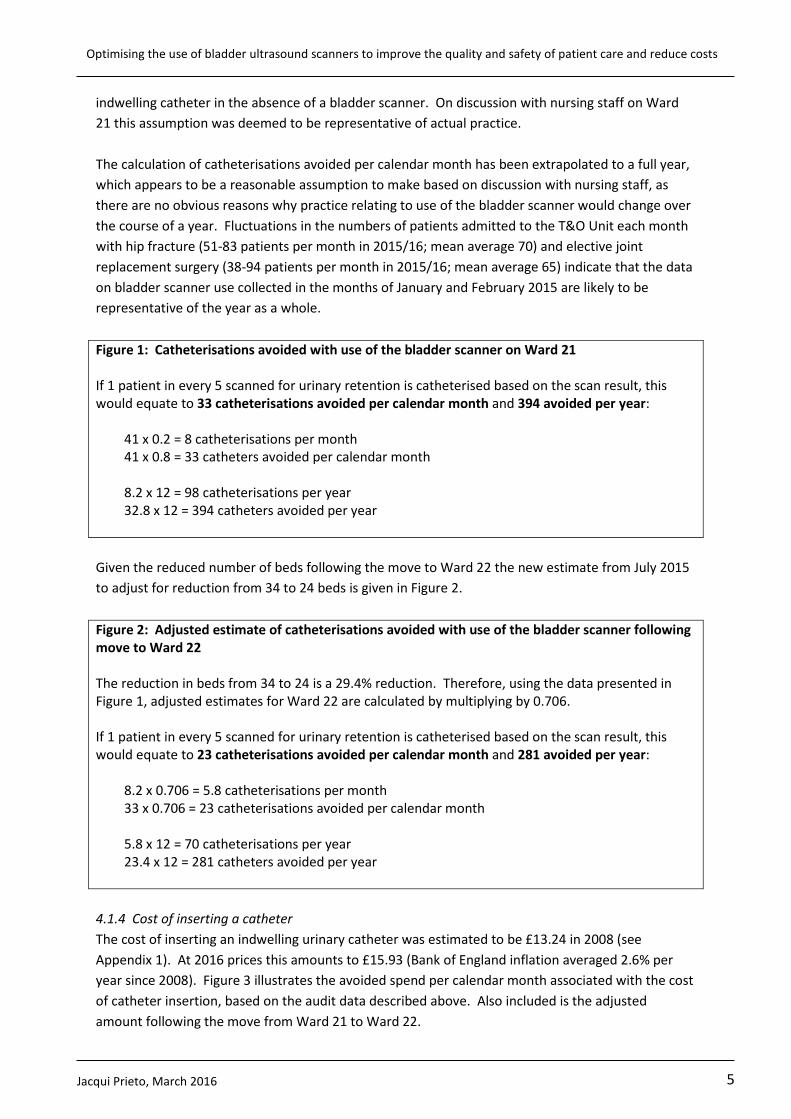
indwelling catheter in the absence of a bladder scanner. On discussion with nursing staff on Ward 21 this assumption was deemed to be representative of actual practice. The calculation of catheterisations avoided per calendar month has been extrapolated to a full year, which appears to be a reasonable assumption to make based on discussion with nursing staff, as there are no obvious reasons why practice relating to use of the bladder scanner would change over the course of a year. Fluctuations in the numbers of patients admitted to the T&O Unit each month with hip fracture (51-83 patients per month in 2015/16; mean average 70) and elective joint replacement surgery (38-94 patients per month in 2015/16; mean average 65) indicate that the data on bladder scanner use collected in the months of January and February 2015 are likely to be representative of the year as a whole. Figure 1: Catheterisations avoided with use of the bladder scanner on Ward 21 If 1 patient in every 5 scanned for urinary retention is catheterised based on the scan result, this would equate to 33 catheterisations avoided per calendar month and 394 avoided per year:
41 x 0.2 = 8 catheterisations per month 41 x 0.8 = 33 catheters avoided per calendar month 8.2 x 12 = 98 catheterisations per year 32.8 x 12 = 394 catheters avoided per year
Given the reduced number of beds following the move to Ward 22 the new estimate from July 2015 to adjust for reduction from 34 to 24 beds is given in Figure 2. Figure 2: Adjusted estimate of catheterisations avoided with use of the bladder scanner following move to Ward 22 The reduction in beds from 34 to 24 is a 29.4% reduction. Therefore, using the data presented in Figure 1, adjusted estimates for Ward 22 are calculated by multiplying by 0.706. If 1 patient in every 5 scanned for urinary retention is catheterised based on the scan result, this would equate to 23 catheterisations avoided per calendar month and 281 avoided per year:
8.2 x 0.706 = 5.8 catheterisations per month 33 x 0.706 = 23 catheterisations avoided per calendar month 5.8 x 12 = 70 catheterisations per year 23.4 x 12 = 281 catheters avoided per year
4.1.4 Cost of inserting a catheter The cost of inserting an indwelling urinary catheter was estimated to be £13.24 in 2008 (see Appendix 1). At 2016 prices this amounts to £15.93 (Bank of England inflation averaged 2.6% per year since 2008). Figure 3 illustrates the avoided spend per calendar month associated with the cost of catheter insertion, based on the audit data described above. Also included is the adjusted amount following the move from Ward 21 to Ward 22.
Jacqui Prieto, March 2016
Optimising the use of bladder ultrasound scanners to improve the quality and safety of patient care and reduce costs
6
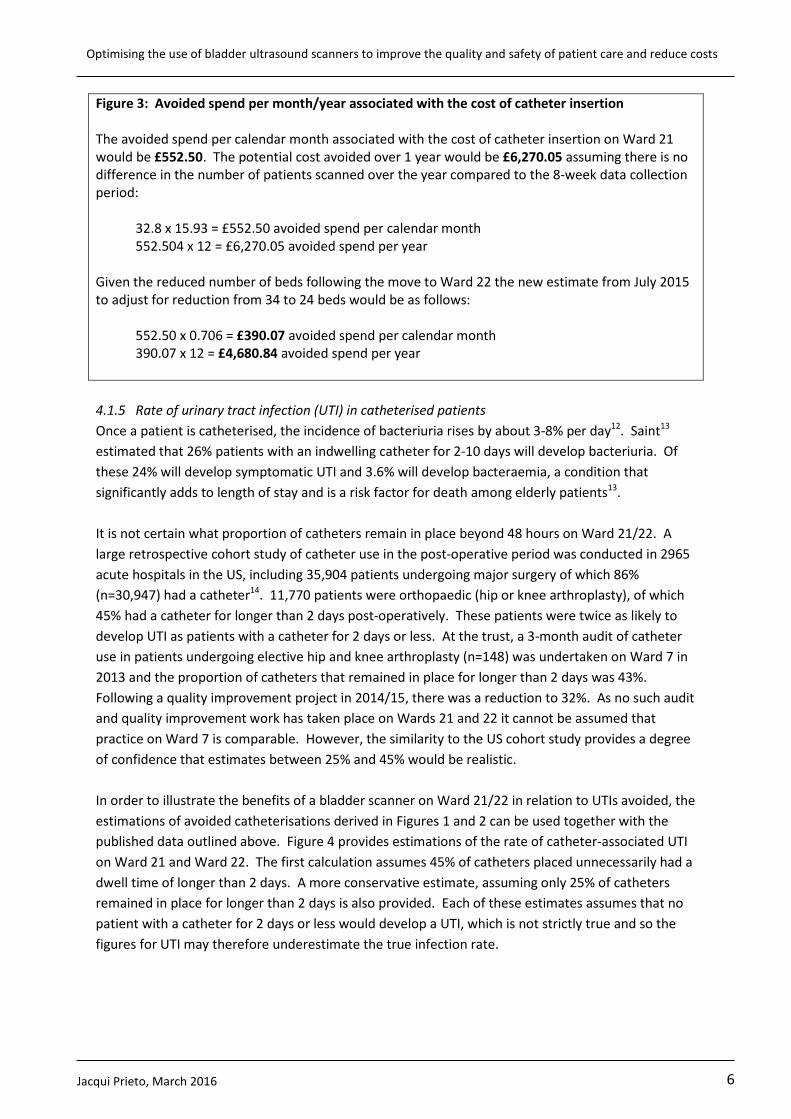
Figure 3: Avoided spend per month/year associated with the cost of catheter insertion The avoided spend per calendar month associated with the cost of catheter insertion on Ward 21 would be £552.50. The potential cost avoided over 1 year would be £6,270.05 assuming there is no difference in the number of patients scanned over the year compared to the 8-week data collection period:
32.8 x 15.93 = £552.50 avoided spend per calendar month 552.504 x 12 = £6,270.05 avoided spend per year
Given the reduced number of beds following the move to Ward 22 the new estimate from July 2015 to adjust for reduction from 34 to 24 beds would be as follows:
552.50 x 0.706 = £390.07 avoided spend per calendar month 390.07 x 12 = £4,680.84 avoided spend per year
4.1.5 Rate of urinary tract infection (UTI) in catheterised patients Once a patient is catheterised, the incidence of bacteriuria rises by about 3-8% per day12. Saint13 estimated that 26% patients with an indwelling catheter for 2-10 days will develop bacteriuria. Of these 24% will develop symptomatic UTI and 3.6% will develop bacteraemia, a condition that significantly adds to length of stay and is a risk factor for death among elderly patients13. It is not certain what proportion of catheters remain in place beyond 48 hours on Ward 21/22. A large retrospective cohort study of catheter use in the post-operative period was conducted in 2965 acute hospitals in the US, including 35,904 patients undergoing major surgery of which 86% (n=30,947) had a catheter14. 11,770 patients were orthopaedic (hip or knee arthroplasty), of which 45% had a catheter for longer than 2 days post-operatively. These patients were twice as likely to develop UTI as patients with a catheter for 2 days or less. At the trust, a 3-month audit of catheter use in patients undergoing elective hip and knee arthroplasty (n=148) was undertaken on Ward 7 in 2013 and the proportion of catheters that remained in place for longer than 2 days was 43%. Following a quality improvement project in 2014/15, there was a reduction to 32%. As no such audit and quality improvement work has taken place on Wards 21 and 22 it cannot be assumed that practice on Ward 7 is comparable. However, the similarity to the US cohort study provides a degree of confidence that estimates between 25% and 45% would be realistic. In order to illustrate the benefits of a bladder scanner on Ward 21/22 in relation to UTIs avoided, the estimations of avoided catheterisations derived in Figures 1 and 2 can be used together with the published data outlined above. Figure 4 provides estimations of the rate of catheter-associated UTI on Ward 21 and Ward 22. The first calculation assumes 45% of catheters placed unnecessarily had a dwell time of longer than 2 days. A more conservative estimate, assuming only 25% of catheters remained in place for longer than 2 days is also provided. Each of these estimates assumes that no patient with a catheter for 2 days or less would develop a UTI, which is not strictly true and so the figures for UTI may therefore underestimate the true infection rate.
Jacqui Prieto, March 2016
Optimising the use of bladder ultrasound scanners to improve the quality and safety of patient care and reduce costs
7
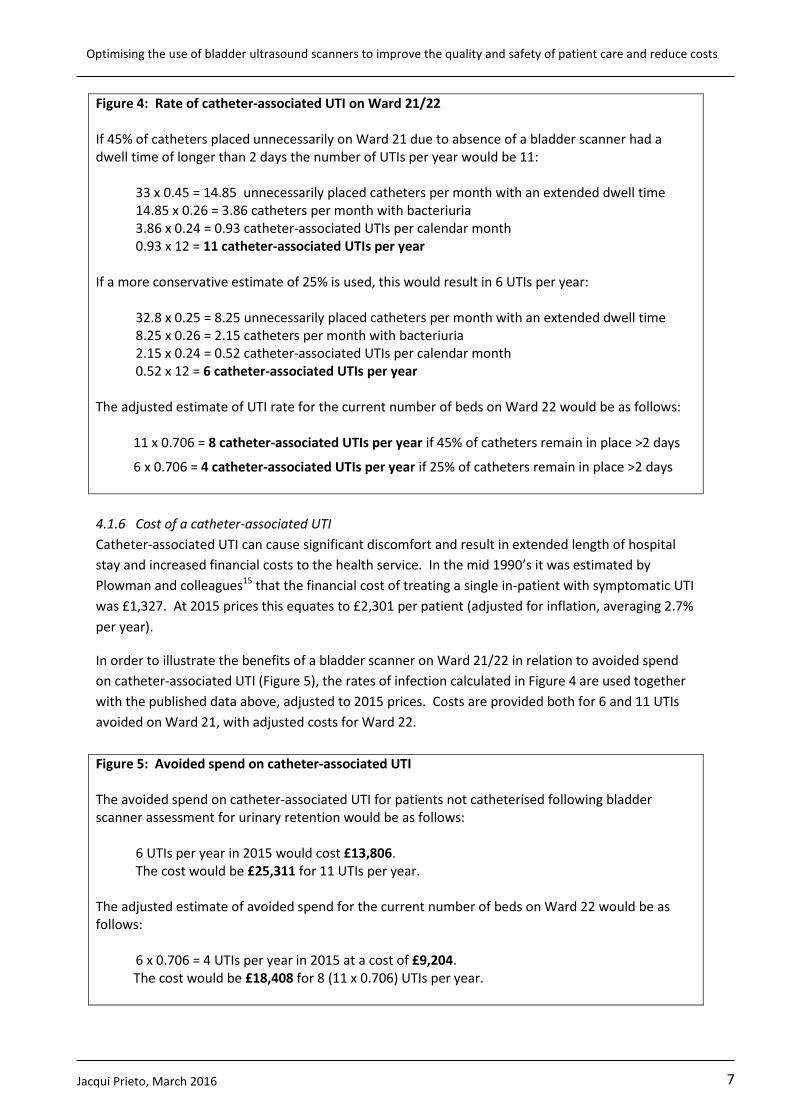
Figure 4: Rate of catheter-associated UTI on Ward 21/22 If 45% of catheters placed unnecessarily on Ward 21 due to absence of a bladder scanner had a dwell time of longer than 2 days the number of UTIs per year would be 11:
33 x 0.45 = 14.85 unnecessarily placed catheters per month with an extended dwell time 14.85 x 0.26 = 3.86 catheters per month with bacteriuria 3.86 x 0.24 = 0.93 catheter-associated UTIs per calendar month 0.93 x 12 = 11 catheter-associated UTIs per year
If a more conservative estimate of 25% is used, this would result in 6 UTIs per year:
32.8 x 0.25 = 8.25 unnecessarily placed catheters per month with an extended dwell time 8.25 x 0.26 = 2.15 catheters per month with bacteriuria 2.15 x 0.24 = 0.52 catheter-associated UTIs per calendar month 0.52 x 12 = 6 catheter-associated UTIs per year
The adjusted estimate of UTI rate for the current number of beds on Ward 22 would be as follows:
11 x 0.706 = 8 catheter-associated UTIs per year if 45% of catheters remain in place >2 days
6 x 0.706 = 4 catheter-associated UTIs per year if 25% of catheters remain in place >2 days
4.1.6 Cost of a catheter-associated UTI Catheter-associated UTI can cause significant discomfort and result in extended length of hospital stay and increased financial costs to the health service. In the mid 1990’s it was estimated by Plowman and colleagues15 that the financial cost of treating a single in-patient with symptomatic UTI was £1,327. At 2015 prices this equates to £2,301 per patient (adjusted for inflation, averaging 2.7% per year).
In order to illustrate the benefits of a bladder scanner on Ward 21/22 in relation to avoided spend on catheter-associated UTI (Figure 5), the rates of infection calculated in Figure 4 are used together with the published data above, adjusted to 2015 prices. Costs are provided both for 6 and 11 UTIs avoided on Ward 21, with adjusted costs for Ward 22. Figure 5: Avoided spend on catheter-associated UTI The avoided spend on catheter-associated UTI for patients not catheterised following bladder scanner assessment for urinary retention would be as follows:
6 UTIs per year in 2015 would cost £13,806. The cost would be £25,311 for 11 UTIs per year.
The adjusted estimate of avoided spend for the current number of beds on Ward 22 would be as follows:
6 x 0.706 = 4 UTIs per year in 2015 at a cost of £9,204. The cost would be £18,408 for 8 (11 x 0.706) UTIs per year.
Jacqui Prieto, March 2016
Optimising the use of bladder ultrasound scanners to improve the quality and safety of patient care and reduce costs
8
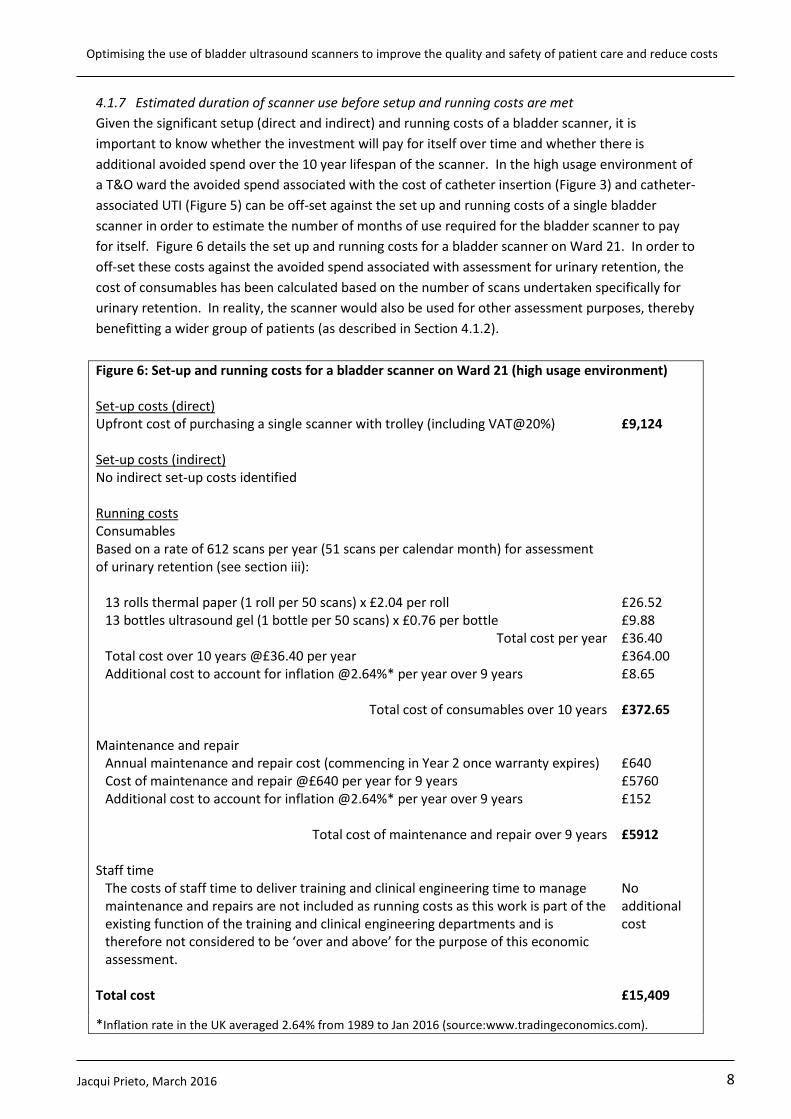
4.1.7 Estimated duration of scanner use before setup and running costs are met Given the significant setup (direct and indirect) and running costs of a bladder scanner, it is important to know whether the investment will pay for itself over time and whether there is additional avoided spend over the 10 year lifespan of the scanner. In the high usage environment of a T&O ward the avoided spend associated with the cost of catheter insertion (Figure 3) and catheter-associated UTI (Figure 5) can be off-set against the set up and running costs of a single bladder scanner in order to estimate the number of months of use required for the bladder scanner to pay for itself. Figure 6 details the set up and running costs for a bladder scanner on Ward 21. In order to off-set these costs against the avoided spend associated with assessment for urinary retention, the cost of consumables has been calculated based on the number of scans undertaken specifically for urinary retention. In reality, the scanner would also be used for other assessment purposes, thereby benefitting a wider group of patients (as described in Section 4.1.2). Figure 6: Set-up and running costs for a bladder scanner on Ward 21 (high usage environment) Set-up costs (direct) Upfront cost of purchasing a single scanner with trolley (including VAT@20%) Set-up costs (indirect) No indirect set-up costs identified Running costs Consumables Based on a rate of 612 scans per year (51 scans per calendar month) for assessment of urinary retention (see section iii):
13 rolls thermal paper (1 roll per 50 scans) x £2.04 per roll 13 bottles ultrasound gel (1 bottle per 50 scans) x £0.76 per bottle
Total cost per year Total cost over 10 years @£36.40 per year Additional cost to account for inflation @2.64%* per year over 9 years
Total cost of consumables over 10 years
Maintenance and repair
Annual maintenance and repair cost (commencing in Year 2 once warranty expires) Cost of maintenance and repair @£640 per year for 9 years Additional cost to account for inflation @2.64%* per year over 9 years
Total cost of maintenance and repair over 9 years
Staff time The costs of staff time to deliver training and clinical engineering time to manage maintenance and repairs are not included as running costs as this work is part of the existing function of the training and clinical engineering departments and is therefore not considered to be ‘over and above’ for the purpose of this economic assessment.
Total cost
£9,124 £26.52 £9.88 £36.40 £364.00 £8.65 £372.65 £640 £5760 £152 £5912 No additional cost £15,409
*Inflation rate in the UK averaged 2.64% from 1989 to Jan 2016 (source:www.tradingeconomics.com).
Jacqui Prieto, March 2016
Optimising the use of bladder ultrasound scanners to improve the quality and safety of patient care and reduce costs
9
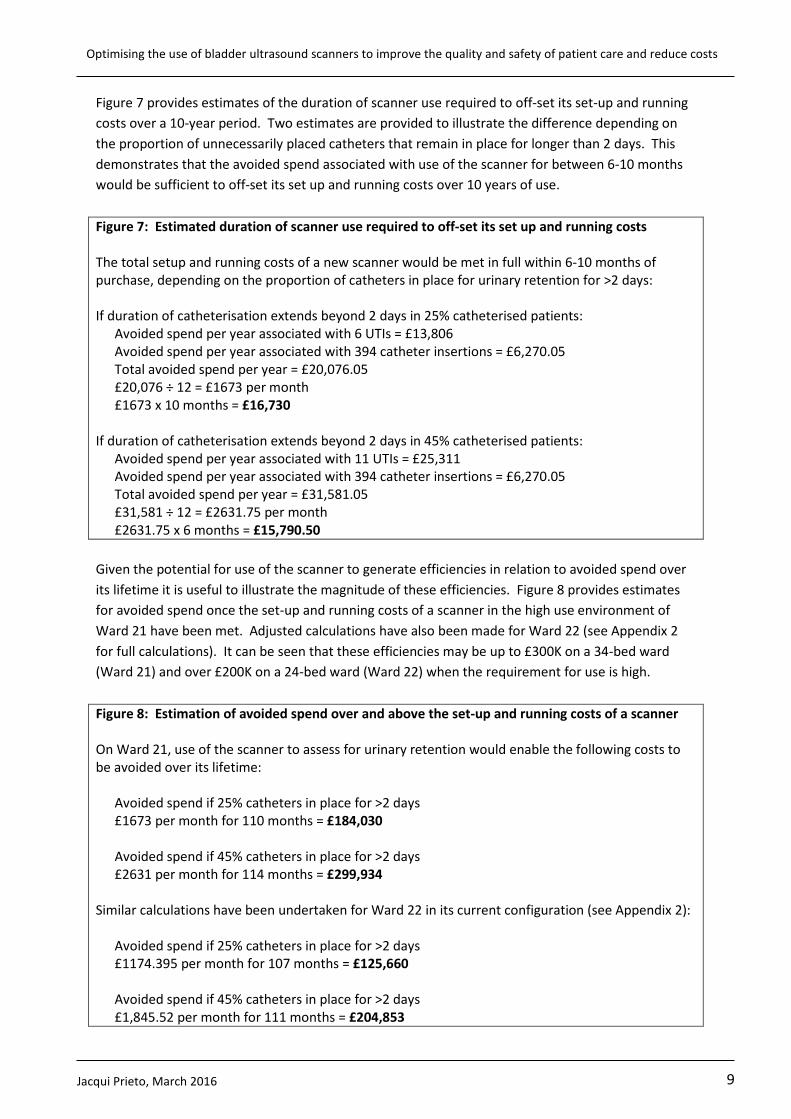
Figure 7 provides estimates of the duration of scanner use required to off-set its set-up and running costs over a 10-year period. Two estimates are provided to illustrate the difference depending on the proportion of unnecessarily placed catheters that remain in place for longer than 2 days. This demonstrates that the avoided spend associated with use of the scanner for between 6-10 months would be sufficient to off-set its set up and running costs over 10 years of use. Figure 7: Estimated duration of scanner use required to off-set its set up and running costs The total setup and running costs of a new scanner would be met in full within 6-10 months of purchase, depending on the proportion of catheters in place for urinary retention for >2 days: If duration of catheterisation extends beyond 2 days in 25% catheterised patients:
Avoided spend per year associated with 6 UTIs = £13,806 Avoided spend per year associated with 394 catheter insertions = £6,270.05 Total avoided spend per year = £20,076.05 £20,076 ÷ 12 = £1673 per month £1673 x 10 months = £16,730
If duration of catheterisation extends beyond 2 days in 45% catheterised patients:
Avoided spend per year associated with 11 UTIs = £25,311 Avoided spend per year associated with 394 catheter insertions = £6,270.05 Total avoided spend per year = £31,581.05 £31,581 ÷ 12 = £2631.75 per month £2631.75 x 6 months = £15,790.50
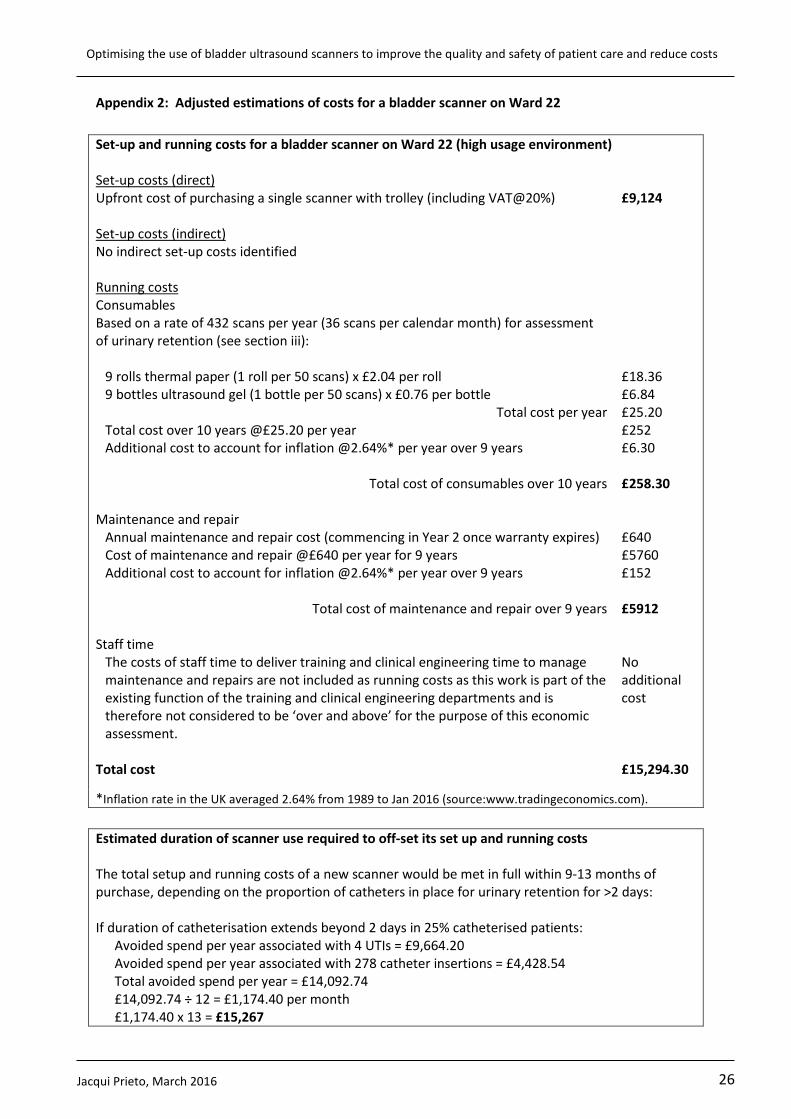
Given the potential for use of the scanner to generate efficiencies in relation to avoided spend over its lifetime it is useful to illustrate the magnitude of these efficiencies. Figure 8 provides estimates for avoided spend once the set-up and running costs of a scanner in the high use environment of Ward 21 have been met. Adjusted calculations have also been made for Ward 22 (see Appendix 2 for full calculations). It can be seen that these efficiencies may be up to £300K on a 34-bed ward (Ward 21) and over £200K on a 24-bed ward (Ward 22) when the requirement for use is high. Figure 8: Estimation of avoided spend over and above the set-up and running costs of a scanner On Ward 21, use of the scanner to assess for urinary retention would enable the following costs to be avoided over its lifetime:
Avoided spend if 25% catheters in place for >2 days £1673 per month for 110 months = £184,030 Avoided spend if 45% catheters in place for >2 days £2631 per month for 114 months = £299,934
Similar calculations have been undertaken for Ward 22 in its current configuration (see Appendix 2):
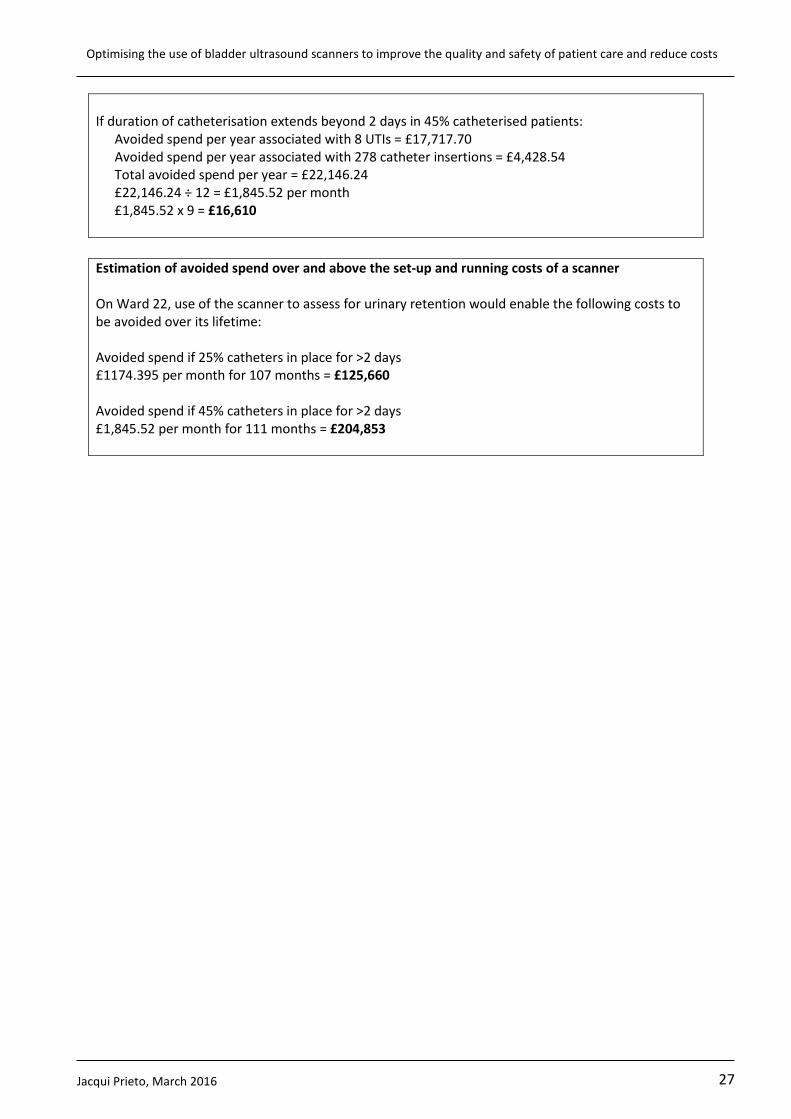
Avoided spend if 25% catheters in place for >2 days £1174.395 per month for 107 months = £125,660 Avoided spend if 45% catheters in place for >2 days £1,845.52 per month for 111 months = £204,853
Jacqui Prieto, March 2016
Optimising the use of bladder ultrasound scanners to improve the quality and safety of patient care and reduce costs
10
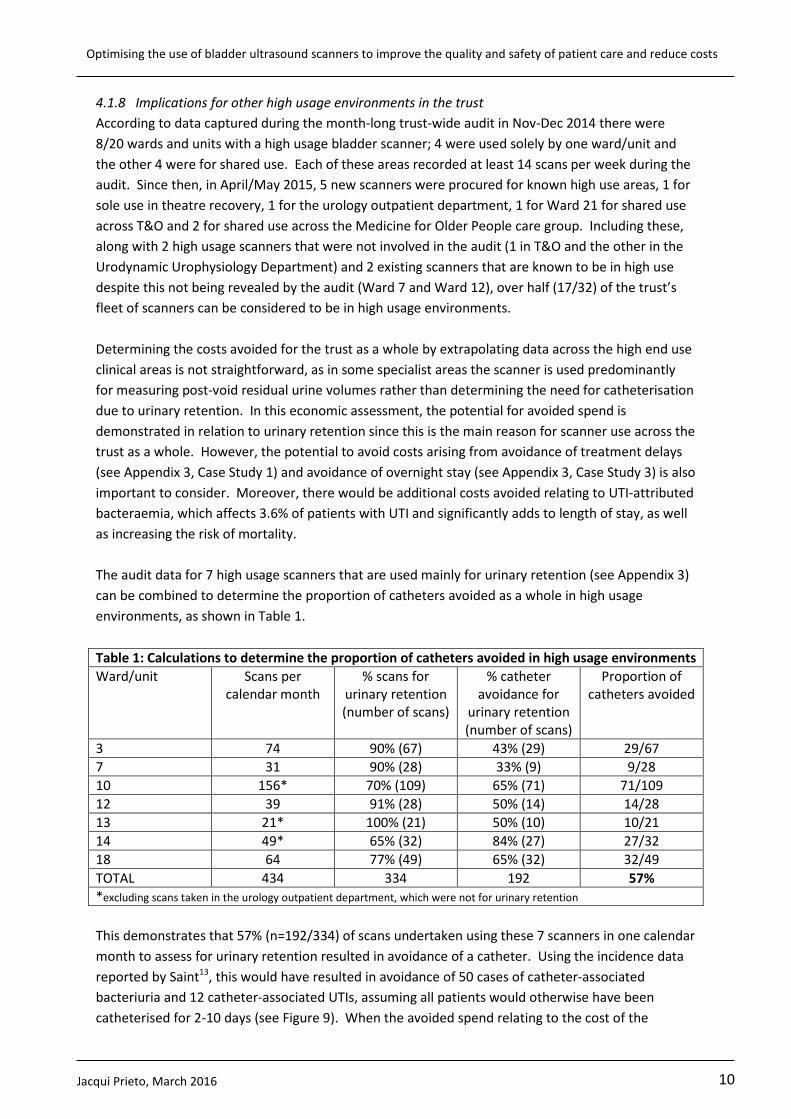
4.1.8 Implications for other high usage environments in the trust According to data captured during the month-long trust-wide audit in Nov-Dec 2014 there were 8/20 wards and units with a high usage bladder scanner; 4 were used solely by one ward/unit and the other 4 were for shared use. Each of these areas recorded at least 14 scans per week during the audit. Since then, in April/May 2015, 5 new scanners were procured for known high use areas, 1 for sole use in theatre recovery, 1 for the urology outpatient department, 1 for Ward 21 for shared use across T&O and 2 for shared use across the Medicine for Older People care group. Including these, along with 2 high usage scanners that were not involved in the audit (1 in T&O and the other in the Urodynamic Urophysiology Department) and 2 existing scanners that are known to be in high use despite this not being revealed by the audit (Ward 7 and Ward 12), over half (17/32) of the trust’s fleet of scanners can be considered to be in high usage environments. Determining the costs avoided for the trust as a whole by extrapolating data across the high end use clinical areas is not straightforward, as in some specialist areas the scanner is used predominantly for measuring post-void residual urine volumes rather than determining the need for catheterisation due to urinary retention. In this economic assessment, the potential for avoided spend is demonstrated in relation to urinary retention since this is the main reason for scanner use across the trust as a whole. However, the potential to avoid costs arising from avoidance of treatment delays (see Appendix 3, Case Study 1) and avoidance of overnight stay (see Appendix 3, Case Study 3) is also important to consider. Moreover, there would be additional costs avoided relating to UTI-attributed bacteraemia, which affects 3.6% of patients with UTI and significantly adds to length of stay, as well as increasing the risk of mortality. The audit data for 7 high usage scanners that are used mainly for urinary retention (see Appendix 3) can be combined to determine the proportion of catheters avoided as a whole in high usage environments, as shown in Table 1. Table 1: Calculations to determine the proportion of catheters avoided in high usage environments Ward/unit Scans per
calendar month % scans for
urinary retention (number of scans)
% catheter avoidance for
urinary retention (number of scans)
Proportion of catheters avoided
3 74 90% (67) 43% (29) 29/67 7 31 90% (28) 33% (9) 9/28 10 156* 70% (109) 65% (71) 71/109 12 39 91% (28) 50% (14) 14/28 13 21* 100% (21) 50% (10) 10/21 14 49* 65% (32) 84% (27) 27/32 18 64 77% (49) 65% (32) 32/49 TOTAL 434 334 192 57% *excluding scans taken in the urology outpatient department, which were not for urinary retention This demonstrates that 57% (n=192/334) of scans undertaken using these 7 scanners in one calendar month to assess for urinary retention resulted in avoidance of a catheter. Using the incidence data reported by Saint13, this would have resulted in avoidance of 50 cases of catheter-associated bacteriuria and 12 catheter-associated UTIs, assuming all patients would otherwise have been catheterised for 2-10 days (see Figure 9). When the avoided spend relating to the cost of the
Jacqui Prieto, March 2016
Optimising the use of bladder ultrasound scanners to improve the quality and safety of patient care and reduce costs
11
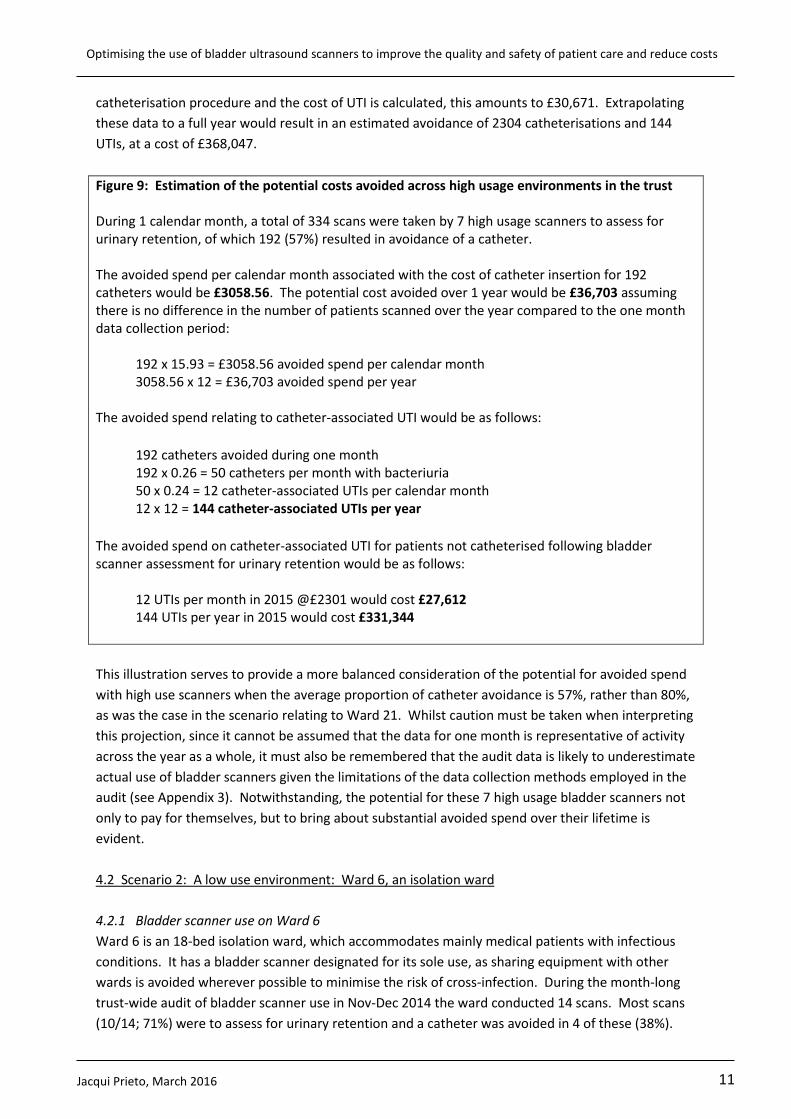
catheterisation procedure and the cost of UTI is calculated, this amounts to £30,671. Extrapolating these data to a full year would result in an estimated avoidance of 2304 catheterisations and 144 UTIs, at a cost of £368,047. Figure 9: Estimation of the potential costs avoided across high usage environments in the trust During 1 calendar month, a total of 334 scans were taken by 7 high usage scanners to assess for urinary retention, of which 192 (57%) resulted in avoidance of a catheter. The avoided spend per calendar month associated with the cost of catheter insertion for 192 catheters would be £3058.56. The potential cost avoided over 1 year would be £36,703 assuming there is no difference in the number of patients scanned over the year compared to the one month data collection period:
192 x 15.93 = £3058.56 avoided spend per calendar month 3058.56 x 12 = £36,703 avoided spend per year
The avoided spend relating to catheter-associated UTI would be as follows:
192 catheters avoided during one month 192 x 0.26 = 50 catheters per month with bacteriuria 50 x 0.24 = 12 catheter-associated UTIs per calendar month 12 x 12 = 144 catheter-associated UTIs per year
The avoided spend on catheter-associated UTI for patients not catheterised following bladder scanner assessment for urinary retention would be as follows:
12 UTIs per month in 2015 @£2301 would cost £27,612 144 UTIs per year in 2015 would cost £331,344
This illustration serves to provide a more balanced consideration of the potential for avoided spend with high use scanners when the average proportion of catheter avoidance is 57%, rather than 80%, as was the case in the scenario relating to Ward 21. Whilst caution must be taken when interpreting this projection, since it cannot be assumed that the data for one month is representative of activity across the year as a whole, it must also be remembered that the audit data is likely to underestimate actual use of bladder scanners given the limitations of the data collection methods employed in the audit (see Appendix 3). Notwithstanding, the potential for these 7 high usage bladder scanners not only to pay for themselves, but to bring about substantial avoided spend over their lifetime is evident. 4.2 Scenario 2: A low use environment: Ward 6, an isolation ward 4.2.1 Bladder scanner use on Ward 6 Ward 6 is an 18-bed isolation ward, which accommodates mainly medical patients with infectious conditions. It has a bladder scanner designated for its sole use, as sharing equipment with other wards is avoided wherever possible to minimise the risk of cross-infection. During the month-long trust-wide audit of bladder scanner use in Nov-Dec 2014 the ward conducted 14 scans. Most scans (10/14; 71%) were to assess for urinary retention and a catheter was avoided in 4 of these (38%).
Jacqui Prieto, March 2016
Optimising the use of bladder ultrasound scanners to improve the quality and safety of patient care and reduce costs
12
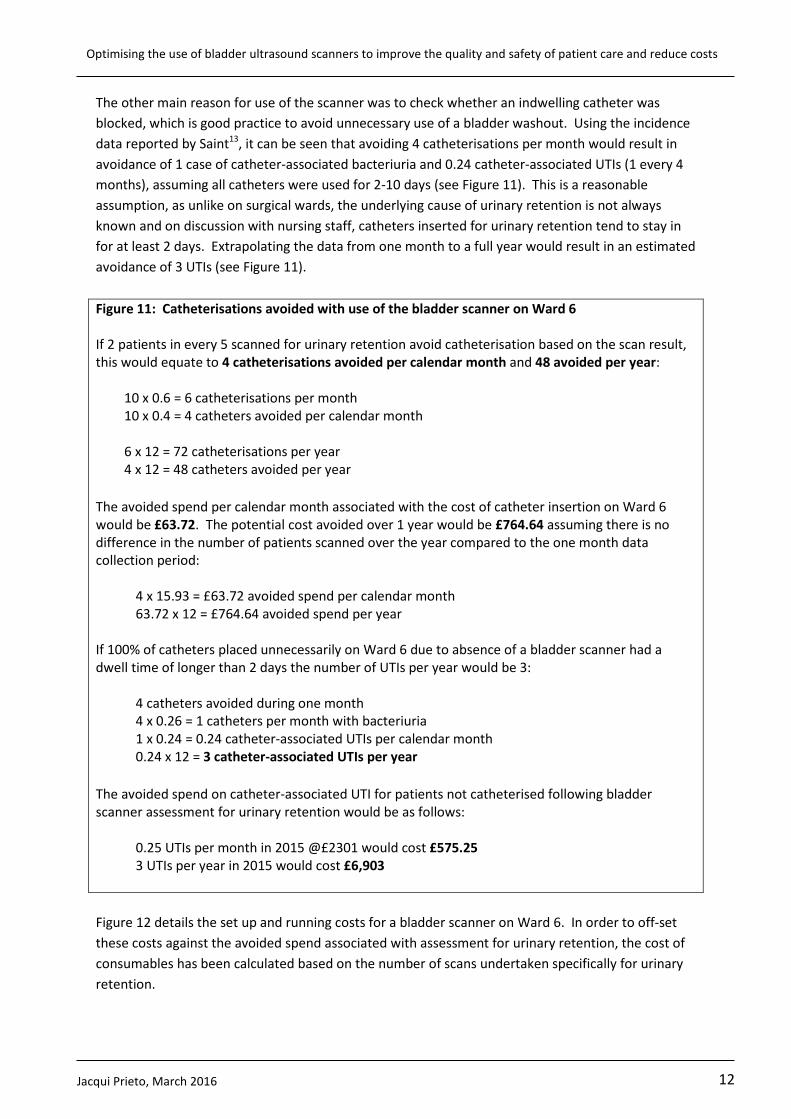
The other main reason for use of the scanner was to check whether an indwelling catheter was blocked, which is good practice to avoid unnecessary use of a bladder washout. Using the incidence data reported by Saint13, it can be seen that avoiding 4 catheterisations per month would result in avoidance of 1 case of catheter-associated bacteriuria and 0.24 catheter-associated UTIs (1 every 4 months), assuming all catheters were used for 2-10 days (see Figure 11). This is a reasonable assumption, as unlike on surgical wards, the underlying cause of urinary retention is not always known and on discussion with nursing staff, catheters inserted for urinary retention tend to stay in for at least 2 days. Extrapolating the data from one month to a full year would result in an estimated avoidance of 3 UTIs (see Figure 11). Figure 11: Catheterisations avoided with use of the bladder scanner on Ward 6 If 2 patients in every 5 scanned for urinary retention avoid catheterisation based on the scan result, this would equate to 4 catheterisations avoided per calendar month and 48 avoided per year:
10 x 0.6 = 6 catheterisations per month 10 x 0.4 = 4 catheters avoided per calendar month 6 x 12 = 72 catheterisations per year 4 x 12 = 48 catheters avoided per year
The avoided spend per calendar month associated with the cost of catheter insertion on Ward 6 would be £63.72. The potential cost avoided over 1 year would be £764.64 assuming there is no difference in the number of patients scanned over the year compared to the one month data collection period:
4 x 15.93 = £63.72 avoided spend per calendar month 63.72 x 12 = £764.64 avoided spend per year
If 100% of catheters placed unnecessarily on Ward 6 due to absence of a bladder scanner had a dwell time of longer than 2 days the number of UTIs per year would be 3:
4 catheters avoided during one month 4 x 0.26 = 1 catheters per month with bacteriuria 1 x 0.24 = 0.24 catheter-associated UTIs per calendar month 0.24 x 12 = 3 catheter-associated UTIs per year
The avoided spend on catheter-associated UTI for patients not catheterised following bladder scanner assessment for urinary retention would be as follows:
0.25 UTIs per month in 2015 @£2301 would cost £575.25 3 UTIs per year in 2015 would cost £6,903
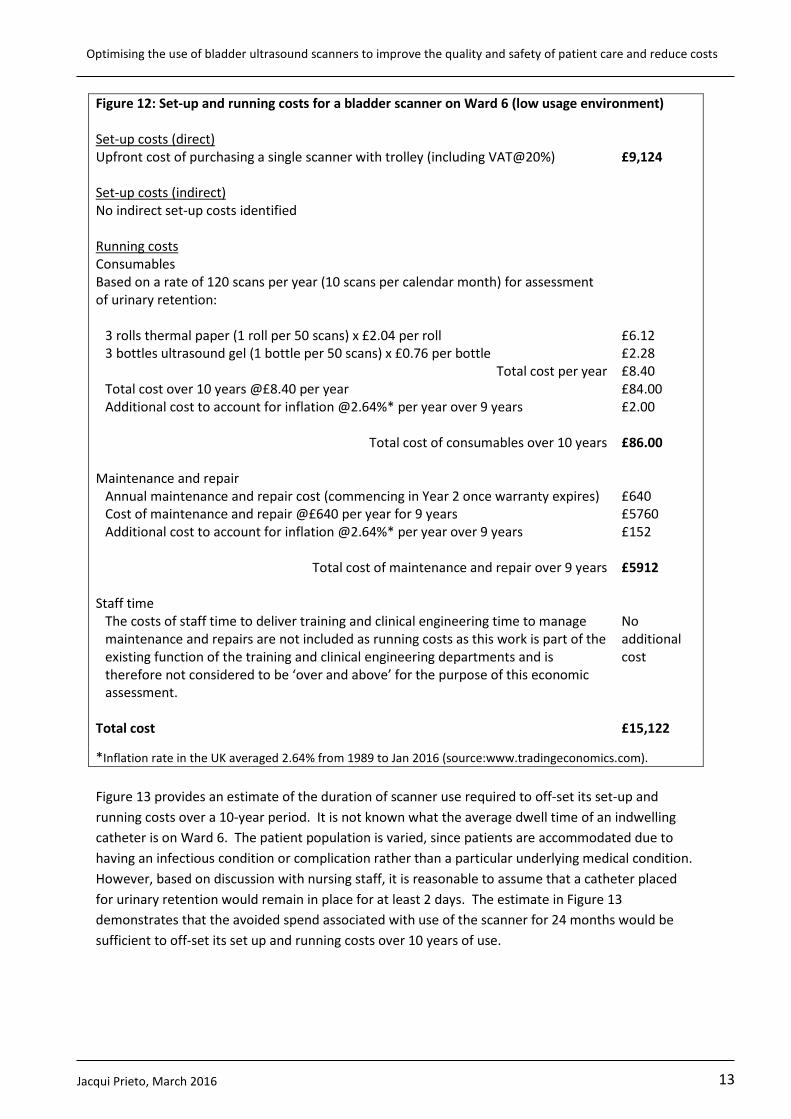
Figure 12 details the set up and running costs for a bladder scanner on Ward 6. In order to off-set these costs against the avoided spend associated with assessment for urinary retention, the cost of consumables has been calculated based on the number of scans undertaken specifically for urinary retention.
Jacqui Prieto, March 2016
Optimising the use of bladder ultrasound scanners to improve the quality and safety of patient care and reduce costs
13
Figure 12: Set-up and running costs for a bladder scanner on Ward 6 (low usage environment) Set-up costs (direct) Upfront cost of purchasing a single scanner with trolley (including VAT@20%) Set-up costs (indirect) No indirect set-up costs identified Running costs Consumables Based on a rate of 120 scans per year (10 scans per calendar month) for assessment of urinary retention:
3 rolls thermal paper (1 roll per 50 scans) x £2.04 per roll 3 bottles ultrasound gel (1 bottle per 50 scans) x £0.76 per bottle
Total cost per year Total cost over 10 years @£8.40 per year Additional cost to account for inflation @2.64%* per year over 9 years
Total cost of consumables over 10 years
Maintenance and repair
Annual maintenance and repair cost (commencing in Year 2 once warranty expires) Cost of maintenance and repair @£640 per year for 9 years Additional cost to account for inflation @2.64%* per year over 9 years
Total cost of maintenance and repair over 9 years
Staff time The costs of staff time to deliver training and clinical engineering time to manage maintenance and repairs are not included as running costs as this work is part of the existing function of the training and clinical engineering departments and is therefore not considered to be ‘over and above’ for the purpose of this economic assessment.
Total cost
£9,124 £6.12 £2.28 £8.40 £84.00 £2.00 £86.00 £640 £5760 £152 £5912 No additional cost £15,122
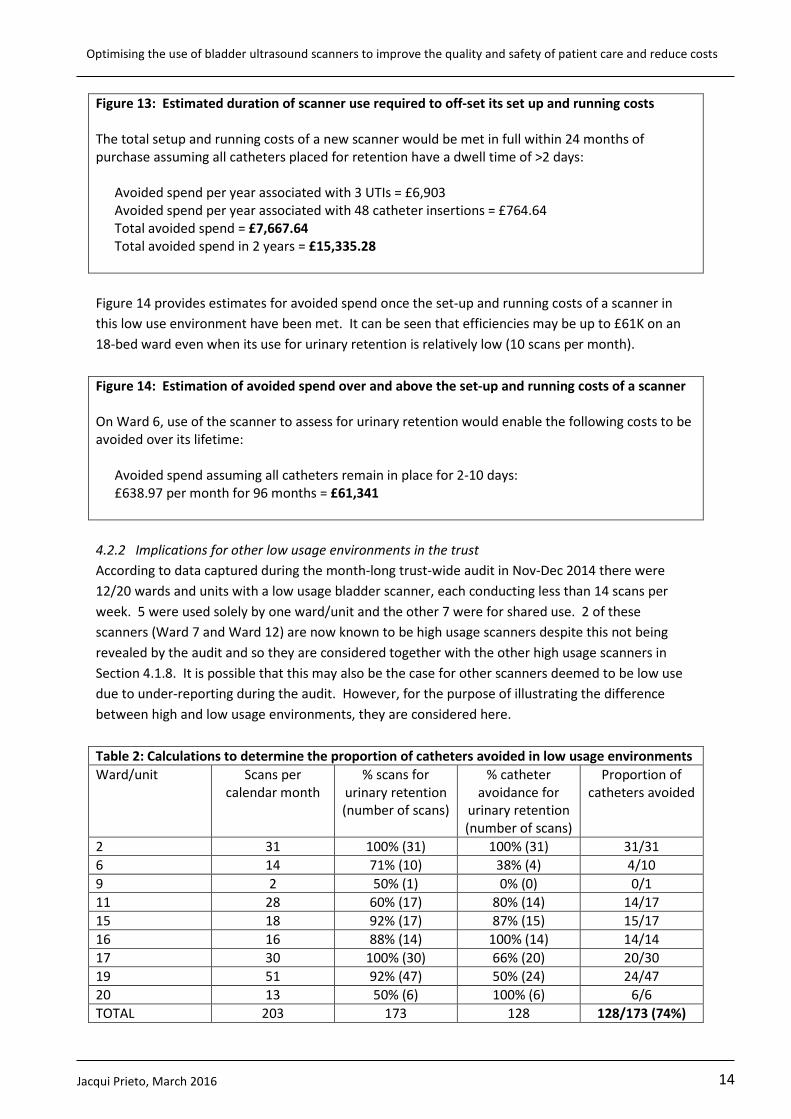
*Inflation rate in the UK averaged 2.64% from 1989 to Jan 2016 (source:www.tradingeconomics.com). Figure 13 provides an estimate of the duration of scanner use required to off-set its set-up and running costs over a 10-year period. It is not known what the average dwell time of an indwelling catheter is on Ward 6. The patient population is varied, since patients are accommodated due to having an infectious condition or complication rather than a particular underlying medical condition. However, based on discussion with nursing staff, it is reasonable to assume that a catheter placed for urinary retention would remain in place for at least 2 days. The estimate in Figure 13 demonstrates that the avoided spend associated with use of the scanner for 24 months would be sufficient to off-set its set up and running costs over 10 years of use.
Jacqui Prieto, March 2016
Optimising the use of bladder ultrasound scanners to improve the quality and safety of patient care and reduce costs
14
Figure 13: Estimated duration of scanner use required to off-set its set up and running costs The total setup and running costs of a new scanner would be met in full within 24 months of purchase assuming all catheters placed for retention have a dwell time of >2 days:
Avoided spend per year associated with 3 UTIs = £6,903 Avoided spend per year associated with 48 catheter insertions = £764.64 Total avoided spend = £7,667.64 Total avoided spend in 2 years = £15,335.28
Figure 14 provides estimates for avoided spend once the set-up and running costs of a scanner in this low use environment have been met. It can be seen that efficiencies may be up to £61K on an 18-bed ward even when its use for urinary retention is relatively low (10 scans per month). Figure 14: Estimation of avoided spend over and above the set-up and running costs of a scanner On Ward 6, use of the scanner to assess for urinary retention would enable the following costs to be avoided over its lifetime:
Avoided spend assuming all catheters remain in place for 2-10 days: £638.97 per month for 96 months = £61,341
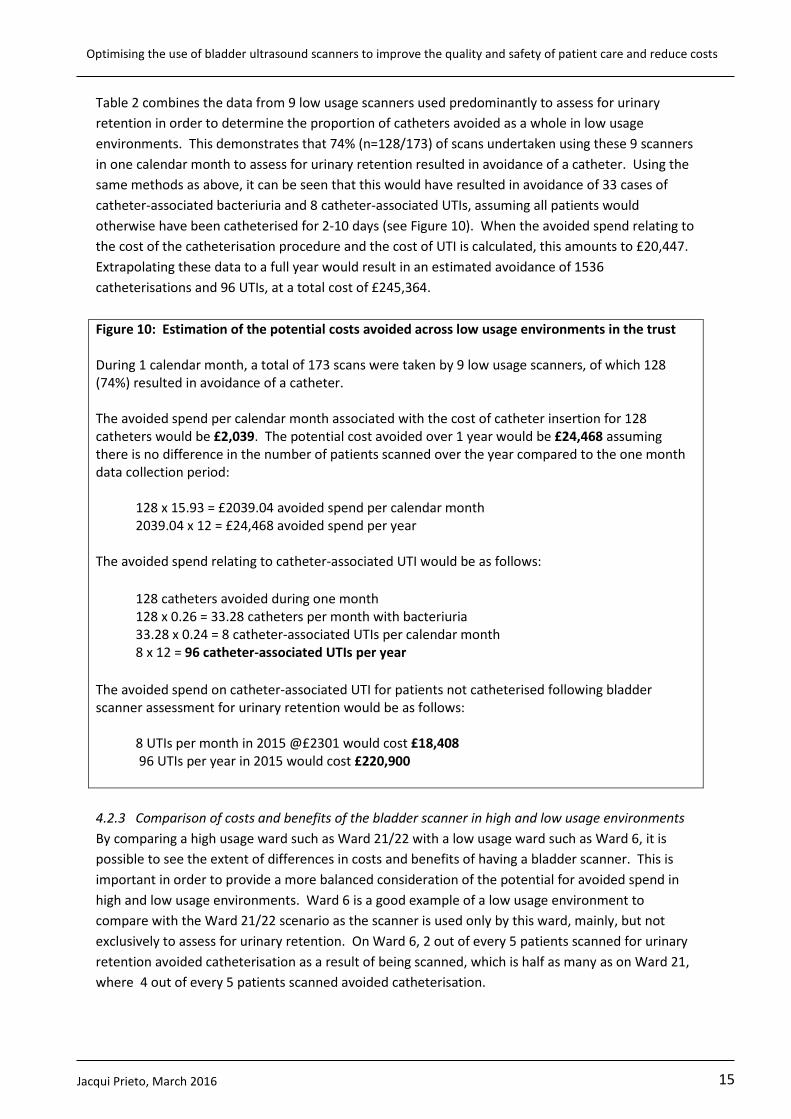
4.2.2 Implications for other low usage environments in the trust According to data captured during the month-long trust-wide audit in Nov-Dec 2014 there were 12/20 wards and units with a low usage bladder scanner, each conducting less than 14 scans per week. 5 were used solely by one ward/unit and the other 7 were for shared use. 2 of these scanners (Ward 7 and Ward 12) are now known to be high usage scanners despite this not being revealed by the audit and so they are considered together with the other high usage scanners in Section 4.1.8. It is possible that this may also be the case for other scanners deemed to be low use due to under-reporting during the audit. However, for the purpose of illustrating the difference between high and low usage environments, they are considered here. Table 2: Calculations to determine the proportion of catheters avoided in low usage environments Ward/unit Scans per
calendar month % scans for
urinary retention (number of scans)
% catheter avoidance for
urinary retention (number of scans)
Proportion of catheters avoided
2 31 100% (31) 100% (31) 31/31 6 14 71% (10) 38% (4) 4/10 9 2 50% (1) 0% (0) 0/1 11 28 60% (17) 80% (14) 14/17 15 18 92% (17) 87% (15) 15/17 16 16 88% (14) 100% (14) 14/14 17 30 100% (30) 66% (20) 20/30 19 51 92% (47) 50% (24) 24/47 20 13 50% (6) 100% (6) 6/6 TOTAL 203 173 128 128/173 (74%)
Jacqui Prieto, March 2016
Optimising the use of bladder ultrasound scanners to improve the quality and safety of patient care and reduce costs
15
Table 2 combines the data from 9 low usage scanners used predominantly to assess for urinary retention in order to determine the proportion of catheters avoided as a whole in low usage environments. This demonstrates that 74% (n=128/173) of scans undertaken using these 9 scanners in one calendar month to assess for urinary retention resulted in avoidance of a catheter. Using the same methods as above, it can be seen that this would have resulted in avoidance of 33 cases of catheter-associated bacteriuria and 8 catheter-associated UTIs, assuming all patients would otherwise have been catheterised for 2-10 days (see Figure 10). When the avoided spend relating to the cost of the catheterisation procedure and the cost of UTI is calculated, this amounts to £20,447. Extrapolating these data to a full year would result in an estimated avoidance of 1536 catheterisations and 96 UTIs, at a total cost of £245,364. Figure 10: Estimation of the potential costs avoided across low usage environments in the trust During 1 calendar month, a total of 173 scans were taken by 9 low usage scanners, of which 128 (74%) resulted in avoidance of a catheter. The avoided spend per calendar month associated with the cost of catheter insertion for 128 catheters would be £2,039. The potential cost avoided over 1 year would be £24,468 assuming there is no difference in the number of patients scanned over the year compared to the one month data collection period:
128 x 15.93 = £2039.04 avoided spend per calendar month 2039.04 x 12 = £24,468 avoided spend per year
The avoided spend relating to catheter-associated UTI would be as follows:
128 catheters avoided during one month 128 x 0.26 = 33.28 catheters per month with bacteriuria 33.28 x 0.24 = 8 catheter-associated UTIs per calendar month 8 x 12 = 96 catheter-associated UTIs per year
The avoided spend on catheter-associated UTI for patients not catheterised following bladder scanner assessment for urinary retention would be as follows:
8 UTIs per month in 2015 @£2301 would cost £18,408 96 UTIs per year in 2015 would cost £220,900
4.2.3 Comparison of costs and benefits of the bladder scanner in high and low usage environments By comparing a high usage ward such as Ward 21/22 with a low usage ward such as Ward 6, it is possible to see the extent of differences in costs and benefits of having a bladder scanner. This is important in order to provide a more balanced consideration of the potential for avoided spend in high and low usage environments. Ward 6 is a good example of a low usage environment to compare with the Ward 21/22 scenario as the scanner is used only by this ward, mainly, but not exclusively to assess for urinary retention. On Ward 6, 2 out of every 5 patients scanned for urinary retention avoided catheterisation as a result of being scanned, which is half as many as on Ward 21, where 4 out of every 5 patients scanned avoided catheterisation.
Jacqui Prieto, March 2016
Optimising the use of bladder ultrasound scanners to improve the quality and safety of patient care and reduce costs
16
The amount of time it would take on a low use 18-bed ward such as Ward 6 for the benefits of avoided spend to off-set the set-up and running costs of a bladder scanner over its 10-year lifespan would be 24 months. This is probably one of the lowest use environments in the trust to compare with a high use environment, where a scanner would cover its costs in 6-10 months on a 34-bed ward such as Ward 21 and 9-13 months on a 24-bed ward such as Ward 22. The implications for high and low usage environments across the trust as a whole, as detailed in Section 4.1.8 and Section 4.2.2., reveal how 7 high use scanners would avoid 2304 catheterisations and 144 UTIs per year at a cost of £368,047 and 9 low use scanners would avoid 1536 catheterisations and 96 UTIs per year at a cost of £245,364. In total, this amounts to 3840 catheterisations avoided and 240 UTIs, an avoided spend of £613,411. Given the trust has 32 scanners and over half of these (n=17) are in high usage environments, avoided spend for the assessment of urinary retention alone may be at least double this amount, i.e. £1,226,822 per year. Avoided spend associated with other benefits of using a scanner, such as avoidance of treatment delays and avoiding overnight stay in hospital (see case studies in Appendix 3), as well as avoidance of UTI-attributed bacteraemia, would result in additional cost efficiencies. Interestingly, the above estimate of avoided spend relating to the assessment of urinary retention is not dissimilar to the savings forecast predicted in the trust per year using the iTAPP framework (Appendix 1). This forecasts that for a trust with 1100 beds, 44 scanners would generate annualised cost savings of between £570,096 and £1,179,329. 4.2.4 Costs and benefits to the patient Optimising bladder monitoring routines using the bladder scanner is important not only to avoid unnecessary indwelling catheterisation and infection, but also to avoid long-term damage to the bladder caused by over-distension, which can lead to the patient experiencing ongoing problems with micturition. The costs to the patient arising from avoidable bladder damage due to over-distension during hospitalisation were investigated by Joelsson-Alm and colleagues16 . They reported how patients experienced constraints in daily life due to dependence on disposables, access to toilets, clothing restrictions and limitations on social life and career. Patients reported suffering pain, infections, impaired sex life and leakage and were fearful of worsening symptoms with age. Safe bladder management during hospitalisation is therefore crucial in order to avoid long-term harm to patients. Aside from long-term bladder damage, acute urinary retention is a painful condition and the experience of having to wait a long time for a scan to be taken is an unpleasant one. Ready access to a bladder scanner is therefore important when it comes to ensuring the quality of the patient experience while in hospital. 4.2.5 Improving practice in the T&O unit and across the trust as a whole There is much scope to improve the use of bladder scanning in the T&O unit, and across the trust as a whole, in order to ensure all patients receive the most clinically appropriate and timely care. In the T&O unit in particular, it is important to ensure that all patients at risk of urinary retention, both pre and post-operatively, benefit from routine and timely assessment. As outlined in section (i), this patient group is known to be at increased risk of urinary retention owing to several risk factors.
Jacqui Prieto, March 2016
Optimising the use of bladder ultrasound scanners to improve the quality and safety of patient care and reduce costs
17
Currently there is no protocol for management of urinary retention for patients with hip fracture in the T&O unit and so patients are scanned according to the clinician’s own discretion rather than routinely. It could therefore be argued that the cost avoidance associated with routine use of the bladder scanner would be further increased by introducing a protocol to improve clinical practice. Ready access to a bladder scanner is an essential requirement for timely assessment and saves valuable nursing time. In the case study on Ward 21, after the loan scanner was returned at the end of the trial period staff were able to borrow the scanner from the nearby Ward 22, as this had been returned following repair. During the one-month period that followed, staff continued to record bladder scanning activity. They recorded a scanning rate of 2 scans per week (8 per month) for suspected urinary retention, of which 7/8 (88%) patients scanned avoided catheterisation. The time taken to locate the scanner was 5 minutes per scan, amounting to 40 minutes in total. This demonstrated how access to a scanner on a nearby ward resulted in twice the number of scans being undertaken compared to the pre-trial period. However, having a scanner based on Ward 21 resulted in 7 times the number of scans being undertaken with no loss of nursing time. For patients undergoing elective lower limb joint surgery a 2-year practice development project, funded by the Foundation of Nursing Studies, has been underway since June 2014 on Ward 7 to improve bladder management in the post-operative period. Embedding the routine use of bladder scanning in the immediate post-operative period has been instrumental in the early identification and management of POUR, as well as avoiding unnecessary catheterisation post-operatively. The improvements in practice achieved in year 1 of the project enabled a successful case to be made for a bladder scanner to be purchased for use in the theatre recovery ward. Since April 2015, all patients undergoing elective lower limb joint surgery who are not catheterised in theatre have been scanned routinely in the theatre recovery ward within 2 hours of surgery. This has led to improved monitoring and earlier intervention for patients with confirmed urinary retention, thereby minimising pain and discomfort. Routine use of the bladder scanner, both in theatre recovery and on the ward, has also opened up the possibility of using intermittent (in-out) catheterisation as an alternative to indwelling for the management of urinary retention. Intermittent catheterisation is an under-exploited strategy to avoid indwelling catheterisation in hospitals, even though it is used widely in primary care, where it has transformed the lives of people with long-term bladder emptying problems. International guidelines on the prevention of CA-UTI recommend intermittent catheterisation as an alternative to indwelling in order to reduce bacteriuria and infection, yet it has not been adopted widely in the trust. Its introduction in the T&O unit, and more widely across the trust, together with reliable and timely use of the bladder scanner, would further reduce the need for indwelling catheterisation. Avoiding unnecessary indwelling catheterisation is likely to benefit patients, not only by avoiding UTI, UTI-related bacteraemia and other complications, but also by earlier return of normal bladder function17, earlier mobilisation18 and potentially, earlier discharge home. 5. Cost consequence analysis A cost consequence analysis is presented to compare two approaches to the management of bladder scanners at the trust. The existing arrangement, namely localised management by wards, is compared to a proposed centralised approach using the trust’s Medical Equipment Library (MEL). For ease of comparison the costs and benefits of each option are set out using a ‘Pathways to
Jacqui Prieto, March 2016
Optimising the use of bladder ultrasound scanners to improve the quality and safety of patient care and reduce costs
18
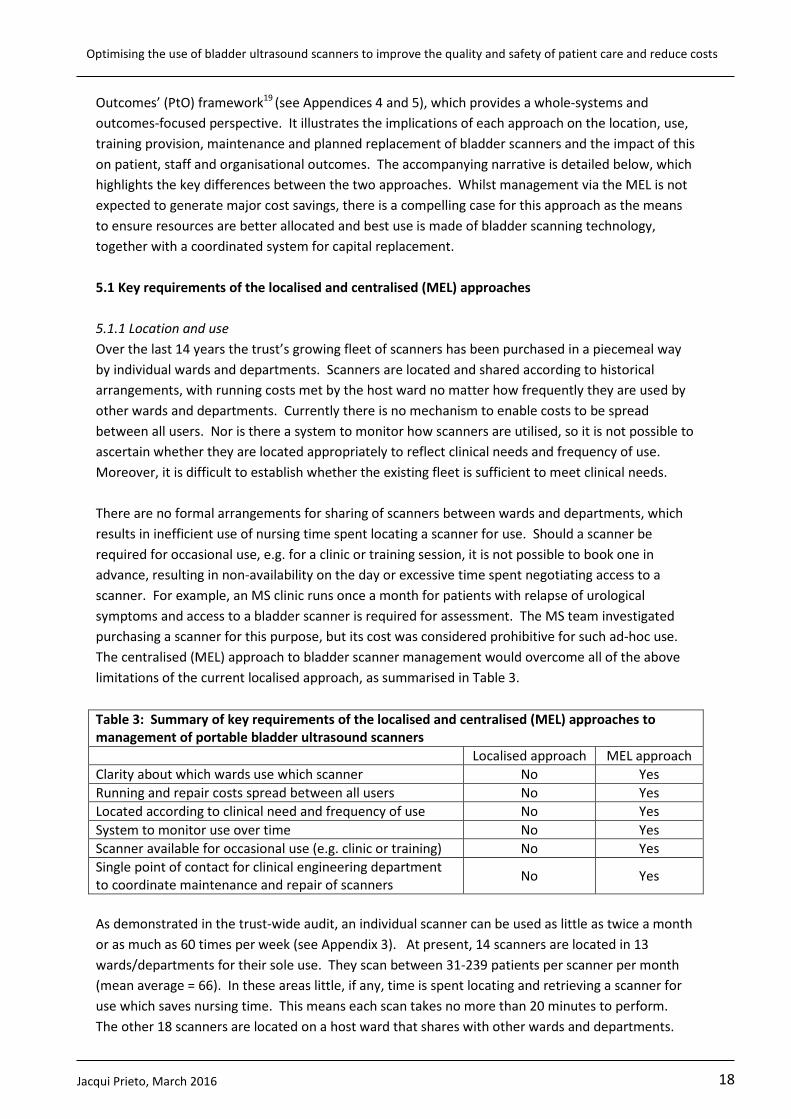
Outcomes’ (PtO) framework19 (see Appendices 4 and 5), which provides a whole-systems and outcomes-focused perspective. It illustrates the implications of each approach on the location, use, training provision, maintenance and planned replacement of bladder scanners and the impact of this on patient, staff and organisational outcomes. The accompanying narrative is detailed below, which highlights the key differences between the two approaches. Whilst management via the MEL is not expected to generate major cost savings, there is a compelling case for this approach as the means to ensure resources are better allocated and best use is made of bladder scanning technology, together with a coordinated system for capital replacement. 5.1 Key requirements of the localised and centralised (MEL) approaches 5.1.1 Location and use Over the last 14 years the trust’s growing fleet of scanners has been purchased in a piecemeal way by individual wards and departments. Scanners are located and shared according to historical arrangements, with running costs met by the host ward no matter how frequently they are used by other wards and departments. Currently there is no mechanism to enable costs to be spread between all users. Nor is there a system to monitor how scanners are utilised, so it is not possible to ascertain whether they are located appropriately to reflect clinical needs and frequency of use. Moreover, it is difficult to establish whether the existing fleet is sufficient to meet clinical needs. There are no formal arrangements for sharing of scanners between wards and departments, which results in inefficient use of nursing time spent locating a scanner for use. Should a scanner be required for occasional use, e.g. for a clinic or training session, it is not possible to book one in advance, resulting in non-availability on the day or excessive time spent negotiating access to a scanner. For example, an MS clinic runs once a month for patients with relapse of urological symptoms and access to a bladder scanner is required for assessment. The MS team investigated purchasing a scanner for this purpose, but its cost was considered prohibitive for such ad-hoc use. The centralised (MEL) approach to bladder scanner management would overcome all of the above limitations of the current localised approach, as summarised in Table 3. Table 3: Summary of key requirements of the localised and centralised (MEL) approaches to management of portable bladder ultrasound scanners Localised approach MEL approach Clarity about which wards use which scanner No Yes Running and repair costs spread between all users No Yes Located according to clinical need and frequency of use No Yes System to monitor use over time No Yes Scanner available for occasional use (e.g. clinic or training) No Yes Single point of contact for clinical engineering department to coordinate maintenance and repair of scanners No Yes
As demonstrated in the trust-wide audit, an individual scanner can be used as little as twice a month or as much as 60 times per week (see Appendix 3). At present, 14 scanners are located in 13 wards/departments for their sole use. They scan between 31-239 patients per scanner per month (mean average = 66). In these areas little, if any, time is spent locating and retrieving a scanner for use which saves nursing time. This means each scan takes no more than 20 minutes to perform. The other 18 scanners are located on a host ward that shares with other wards and departments.
Jacqui Prieto, March 2016
Optimising the use of bladder ultrasound scanners to improve the quality and safety of patient care and reduce costs
19
Each of these scanners is used by 2 to >6 clinical areas and scans between 13-265 patients per scanner per week (mean average = 73). For wards and departments without a scanner it can take staff an extra 5-45 minutes to locate one, in addition to the time taken to perform the scan itself. This means not all patients benefit from timely assessment and some may not be scanned at all if a scanner cannot be located or if there is no staff member available to retrieve one. Host wards can be without their scanner for up to 6 hours per week and most do not maintain a booking out system, so they do not always know of its whereabouts when off the ward. There is a clear need to monitor use of and access to all scanners within the Trust to ensure they are located according to clinical need and frequency of use. This in turn would enable assessment of the optimum number of bladder scanners needed in the trust based on activity and workload in each ward and department. Managing bladder scanners within the MEL would allow their locations to be determined according to clinical need and frequency of use. The 14 scanners designated for specialist use would remain in their current location on permanent loan. The 18 scanners designated for shared use would be located on a host ward, with a formal arrangement for shared use by specified wards/units. The location of shared scanners would be reviewed on a regular basis as part of the ongoing monitoring system set up by the MEL. This would ensure the use of each scanner is optimised. The cost of purchase and maintenance of 2 additional scanners, together with consumables, has been included in Option 2 (see Appendix 5). These scanners would be held in the MEL store for temporary short-term or ad-hoc use by wards, clinics and clinical educators. Alternatively, it may be possible to negotiate an increase in the number of loan scanners supplied to the trust by the maintenance contract provider for use when scanners are sent off-site for maintenance and repair. Only 1 scanner is provided at present, which is insufficient to meet the trust’s needs. 5.1.2 Training Training on use of the bladder scanner is available from the manufacturer as part of their service to the Trust. Visits are arranged on an ad-hoc rather than regular basis and there is no centralised record of staff who have received training. Most staff learn from each other rather than a trainer and so the quality of this informal teaching and learning cannot be assured. This has obvious implications for ensuring scanners are used and handled correctly, both to ensure accurate patient assessment and to avoid damaging the scanner. The clinical engineering department maintain records of equipment they receive for repair due to user error or damage. In general across the trust, this accounts for approximately 25% of equipment in need of repair. According to their records a higher proportion of bladder scanners (around 36%) are received for repair due to user error or damage, which is potentially avoidable with improved training provision. Managing bladder scanners within the MEL would allow training to be provided by the trust’s clinical skills team, enabling access to all clinical staff. The team have indicated their willingness to incorporate a competency-based assessment on use of the bladder scanner into the current training provision on urinary catheterisation, which is delivered to doctors, nurses and healthcare assistants on a regular basis. This means there would be no requirement to provide a separate training session. The clinical skills team would be able to pre-book a scanner held in the MEL for scheduled training sessions. A one-off direct cost of £300 is included in Option 2 (see Appendix 5) for the purchase of a ‘model’ bladder for use by the clinical skills team to demonstrate and assess use of the scanner.
Jacqui Prieto, March 2016
Optimising the use of bladder ultrasound scanners to improve the quality and safety of patient care and reduce costs
20
5.1.3 Maintenance and replacement Since 2002 the number of bladder scanners in the trust has increased from 2 to 32. Each scanner requires an annual maintenance service and is off-site for a minimum of 5 days per year. The current cost of the maintenance contract is £640 per scanner, which is less than 10% of the purchase cost of a scanner and is therefore considered to represent good value. During the past 14 years the mean average rate of repair per scanner was once every 2 years, although some scanners had a much higher repair rate than others. Whereas most repair costs are met within the maintenance contract and so incur no additional charge, around 2-3 scanner chargers go missing each year, at a cost of £300 per charger. These direct costs are included in Option 1 (see Appendix 4), as part of the existing approach to management of bladder scanners. In 2015 a total of 25 repairs were required for 18 scanners. Where possible, servicing and repair are done at the same time in order to minimise the amount of time a scanner is sent off-site. In all, scanners were sent away at least 35 times in 2015 for at least 5 days at a time, amounting to a minimum of 175 days off-site. The actual time off-site is likely to be higher than this, as the turnaround time for a scanner requiring repair is often much longer than 5 days. Moreover, as this time estimate does not include 4 of the 5 new scanners purchased in 2015, which were under warranty for the first year and did not require maintenance or repair, the number of scanners and total amount of time off-site in 2016 will be higher. A single loan scanner is made available by the maintenance contract provider for when a scanner is sent off-site for maintenance and repair. This is issued by the clinical engineering department on a first come, first served basis. However, since more than one scanner can be off-site at any one time, this is insufficient to meet the trust’s needs. It takes approximately 1 hour of clinical engineering time to arrange servicing or repair of a single scanner, requiring a minimum of 35 hours in 2015. In addition, the clinical engineering department are responsible for maintaining accurate records of all medical devices and organising the annual maintenance contract. These costs are met within the existing function of the clinical engineering department and therefore no additional set up or running costs have been identified for the purpose of this economic assessment. However, it is inevitable that increasing the number of scanners, as well as other medical devices, in the Trust over time has implications for the number of engineers and administrative staff required to provide this service in future. With regard to replacement of old and damaged stock, the trust prioritises equipment managed by the MEL over equipment managed outside of this system. Once a year, individual wards and departments are invited to submit a bid to the trust’s medical equipment panel for new or replacement equipment. However, this is vastly oversubscribed and so there is less likelihood of a successful outcome compared to bids submitted by the MEL. In 2015 no bids were submitted to the panel for new or replacement bladder scanners even though 4 scanners within the trust’s fleet were over 10 years old. The system depends on host wards and departments recognising that a scanner is due for replacement and submitting a bid, which is not altogether reliable. In 2016 a further 3 scanners will have been in service for 10 years. As these 7 scanners represent only one fifth of the trust’s stock, a rolling replacement programme, whereby the entire fleet would be replaced over a period of 4 years, is unlikely to be considered before 2018. Managing bladder scanners within the MEL would allow a more coordinated approach to their maintenance and replacement. The MEL would be able to monitor more closely the rate of repair of
Jacqui Prieto, March 2016
Optimising the use of bladder ultrasound scanners to improve the quality and safety of patient care and reduce costs
21
individual scanners over time according to their age, location and use. The system for borrowing a loan scanner to replace one sent off-site for repair or maintenance would be clearer for clinical staff. As the MEL would maintain a live system to record the location of each scanner, it would be better placed than the clinical engineering department to coordinate use of the replacement loan scanner. In the event of there being a lack of availability of a loan scanner, the MEL would identify which scanner the affected wards/units would need to share temporarily. It would be possible to spread running and repair costs between all wards that use a scanner. For the clinical engineering department, having a single point of contact with the MEL, rather than individual wards and departments, would be more efficient. The replacement of old and damaged scanners would be a higher priority when managed inside of the MEL. In addition, it would be easier to secure the best possible price for new scanners when purchased in a planned way, achieving the best discounts for multiple equipment purchases. Scanners purchased by the MEL would be added to the trust’s asset register by the clinical engineering department. Previously, the clinical engineering department has not always been notified of scanners purchased individually by wards and departments. This has resulted in the device not being listed on the asset register and therefore not being covered by a maintenance contract or maintained appropriately. 5.1.4 Additional costs required for the MEL approach The additional costs required to manage bladder scanners within the MEL are listed in Option 2 (Appendix 5). As the MEL is already established within the trust, no additional costs have been attributed to setting up the system for bladder scanners, as this would be delivered within the existing function. The additional costs therefore include the purchase of two bladder scanners to be housed within the MEL for short-term or ad-hoc use, consumables, annual maintenance contracts and a ‘model’ bladder for use by the clinical skills team to deliver in-house competency-based training for staff. The ongoing running costs for the use and maintenance of the entire fleet of scanners, which are currently met by host wards and units, would be re-distributed to all wards and units that use them. 5.1.5 Potential for cost efficiencies and improved outcomes Using a cost consequence analysis to compare the current system with the proposed MEL approach has allowed a wider consideration of the various costs and benefits of each approach, not just those that can be expressed in monetary terms. This can assist decision-makers when considering the potential for improved outcomes across the trust as a whole. The cost avoidance analysis in Section 4 of this economic assessment presents costs avoided only in relation to the current system of management of bladder scanners within the trust. It is likely there would be additional potential for cost avoidance over and above the current system by adopting the MEL approach. In the example of Ward 21 (see pages 3-8), the costs avoided in one month by access to a scanner illustrates the potential to create efficiencies within the system when a high use environment without a scanner is given access to one. With the MEL approach, it would be possible to identify other high use wards without a scanner that could avoid costs by improved access. Whilst it is beyond the scope of this assessment to demonstrate this in further detail, it is clear that improved access to scanners across the trust would ensure all patients benefit from the most clinically appropriate and timely care, thereby avoiding costs associated with unnecessary catheterisation and UTI, UTI-related bacteraemia, delays in treatment and delayed discharge from hospital.
Jacqui Prieto, March 2016
Optimising the use of bladder ultrasound scanners to improve the quality and safety of patient care and reduce costs
22
5.1.6 Recommendations to improve monitoring of scanner location and use Whichever approach is adopted for the future management of bladder scanners, it is recommended that a booking out system is introduced for wards and departments that host a scanner for shared use. This would enable improved monitoring of scanner location and use by other wards and departments over time. Given the amount of time spent tracking down the whereabouts of scanners, both by nurses and clinical engineers, consideration should be given to the purchase of an electronic tracking system in the longer term, which could also be used for other shared equipment. 6. Conclusion Bladder scanners improve the quality and safety of patient care and reduce costs. This economic assessment has demonstrated the significant avoided spend associated with scanner use and identified the key benefits to patients, staff and the organisation as a whole. The avoided spend associated with the cost of bladder catheterisation and UTI has been estimated to be in the region of £1,226,822 per year. This does not include the cost of bacteraemia attributed to UTI. Avoided spend associated with other benefits of using a scanner, such as avoidance of treatment delays and avoiding overnight stay in hospital would result in additional cost efficiencies. The set up and running costs of a scanner can be met within 6 to 24 months, depending on usage, after which significant ongoing cost efficiencies are realised over its 10-year lifespan. A compelling case has been put forward for management of the trust’s fleet of bladder scanners within the MEL, in order to create efficiencies within the system, improving access, use and training across the Trust and ensuring optimal maintenance. Although this would not be expected to generate major cost savings, it would ensure resources are better allocated and best use is made of this technology, together with a coordinated system for capital replacement.
Jacqui Prieto, March 2016
Optimising the use of bladder ultrasound scanners to improve the quality and safety of patient care and reduce costs
23
References 1. Frederickson M, Neitzel JJ, Miller EH, Reuter S, Graner T, Heller J. The implementation of bedside bladder ultrasound technology: effects on patient and cost postoperative outcomes in tertiary care. Orthopaedic Nursing 2000, 19(3): 79-87. 2. Palese A, Buchini S, Deroma L, Barbone F. The effectiveness of the ultrasound bladder scanner in reducing urinary tract infections: a meta-analysis. Journal of Clinical Nursing (2010), 19: 2970-2979. 3. Health Protection Agency. English national point prevalence survey on healthcare-associated infections and antimicrobial use, 2011. Health Protection Agency, May 2012. 4. Meddings J, Saint S, Fowler KE, Gaies E, Hickner A, Krein SL, Bernstein SJ. The Ann Arbor Criteria for appropriate urinary catheter use in hospitalized medical patients: Results obtained using the RAND/UCLA Appropriate Method. Annals of Internal Medicine 2015; 162:S1-S34. Doi:10.7326/M14-1304. 5. NHS Institute for Innovation and Improvement (2009). High Impact Actions for Nursing and Midwifery. Coventry: NHS Institute for Innovation and Improvement. Available from URL: tinyurl.com/impact-actions 6. Department of Health QIPP Safe Care Team. Delivering the NHS Safety Thermometer CQUIN 2012/13; A Preliminary Guide to Delivering 'Harm Free' Care. May 2012. Available from URL: https://www.gov.uk/government/uploads/system/uploads/attachment_data/file/216534/dh_134329.pdf 7. Department of Health. Quality, Innovation, Productivity and Prevention (QIPP). Available from URL: (http://www.dh.gov.uk/en/Healthcare/Qualityandproductivity/ QIPP/index.htm) 8. Bjerregaard LS, Bogo S, Raaschou S, Troldborg C, Hornum U, Poulsen AM, Bagi P, Kehlet H. Incidence of and risk factors for postoperative urinary retention in fast-tract hip and knee arthroplasty. Acta Orthopaedica 2015; 86(2): 183-88. 9. Balderi T and Carli F. Urinary retention after total hip and knee arthroplasty. Minerva Anestesiologica 2010; 76: 120-130. 10. Baldini G, Bagry H, Aprikian A, Carli F. Postoperative urinary retention. Anesthesiology 2009; 110: 1139-1157. 11. Rees J. Guidelines on use of catheters in hip fracture patients. Nursing Times 2007; 103(16): 30-31. 12. Hooton TM, Bradley SF, Cardenas DD, Colgan R, Geerlings SE, Rice JC, Saint S, Schaeffer AJ, Tambayh PA, Tenke P, Nicolle LE. Diagnosis, prevention and treatment of catheter-associated urinary tract infection in adults: 2009 International Clinical Practice Guidelines from the Infectious Diseases Society of America. Clinical Infectious Diseases 2010; 50: 625-63. 13. Saint S. Clinical and economic consequences of nosocomial catheter-related bacteriuria. Am J Infect Control 2000; 28: 68-75.
Jacqui Prieto, March 2016
Optimising the use of bladder ultrasound scanners to improve the quality and safety of patient care and reduce costs
24
14. Plowman R, Graves N, Griffin M, Roberts JA, Swan AV, Cookson B, Taylor L. The socioeconomic burden of hospital acquired infection. Executive Summary. Public Health Laboratory Service 1999, 1-16. 15. Wald HL, Ma A, Bratzler DW, Kramer AM. Indwelling urinary catheter use in the post-operative period. Archives of Surgery 2008; 143(6): 551-557. 16. Joelsson-Alm E, Nyman CR, Svensen C, Ulfvarson J. Micturition problems after bladder distension during hospitalization in Sweden. Nursing Research 2014; 63(6): 418-25. 17. Halleberg Nyman M, Gustafsson M, Languis-Eklof A, Johansson J-E, Norlin R, Hagberg L. Intermittent versus indwelling urinary catheterisation in hip surgery patients: A randomised controlled trial with cost-effectiveness analysis. International Journal of Nursing Studies 2013; 50:1589-98. 18. Saint S, Lipsky BA, Gould SD. Indwelling urinary catheters: A one-point restraint? Annals of Internal Medicine 2002; 137(2): 125-27. 19. McMahon A, Sin CH. Introduction to economic assessment – part 3. Nursing Management 2014; 21(6): 30-35.
Jacqui Prieto, March 2016
Optimising the use of bladder ultrasound scanners to improve the quality and safety of patient care and reduce costs
25
Appendix 1 iTAPP Financial appraisal for the trust
Jacqui Prieto, March 2016
Optimising the use of bladder ultrasound scanners to improve the quality and safety of patient care and reduce costs
26
Appendix 2: Adjusted estimations of costs for a bladder scanner on Ward 22 Set-up and running costs for a bladder scanner on Ward 22 (high usage environment) Set-up costs (direct) Upfront cost of purchasing a single scanner with trolley (including VAT@20%) Set-up costs (indirect) No indirect set-up costs identified Running costs Consumables Based on a rate of 432 scans per year (36 scans per calendar month) for assessment of urinary retention (see section iii):
9 rolls thermal paper (1 roll per 50 scans) x £2.04 per roll 9 bottles ultrasound gel (1 bottle per 50 scans) x £0.76 per bottle
Total cost per year Total cost over 10 years @£25.20 per year Additional cost to account for inflation @2.64%* per year over 9 years
Total cost of consumables over 10 years
Maintenance and repair
Annual maintenance and repair cost (commencing in Year 2 once warranty expires) Cost of maintenance and repair @£640 per year for 9 years Additional cost to account for inflation @2.64%* per year over 9 years
Total cost of maintenance and repair over 9 years
Staff time The costs of staff time to deliver training and clinical engineering time to manage maintenance and repairs are not included as running costs as this work is part of the existing function of the training and clinical engineering departments and is therefore not considered to be ‘over and above’ for the purpose of this economic assessment.
Total cost
£9,124 £18.36 £6.84 £25.20 £252 £6.30 £258.30 £640 £5760 £152 £5912 No additional cost £15,294.30
*Inflation rate in the UK averaged 2.64% from 1989 to Jan 2016 (source:www.tradingeconomics.com). Estimated duration of scanner use required to off-set its set up and running costs The total setup and running costs of a new scanner would be met in full within 9-13 months of purchase, depending on the proportion of catheters in place for urinary retention for >2 days: If duration of catheterisation extends beyond 2 days in 25% catheterised patients:
Avoided spend per year associated with 4 UTIs = £9,664.20 Avoided spend per year associated with 278 catheter insertions = £4,428.54 Total avoided spend per year = £14,092.74 £14,092.74 ÷ 12 = £1,174.40 per month £1,174.40 x 13 = £15,267
Jacqui Prieto, March 2016
Optimising the use of bladder ultrasound scanners to improve the quality and safety of patient care and reduce costs
27
If duration of catheterisation extends beyond 2 days in 45% catheterised patients:
Avoided spend per year associated with 8 UTIs = £17,717.70 Avoided spend per year associated with 278 catheter insertions = £4,428.54 Total avoided spend per year = £22,146.24 £22,146.24 ÷ 12 = £1,845.52 per month £1,845.52 x 9 = £16,610
Estimation of avoided spend over and above the set-up and running costs of a scanner On Ward 22, use of the scanner to assess for urinary retention would enable the following costs to be avoided over its lifetime: Avoided spend if 25% catheters in place for >2 days £1174.395 per month for 107 months = £125,660 Avoided spend if 45% catheters in place for >2 days £1,845.52 per month for 111 months = £204,853
Jacqui Prieto, March 2016
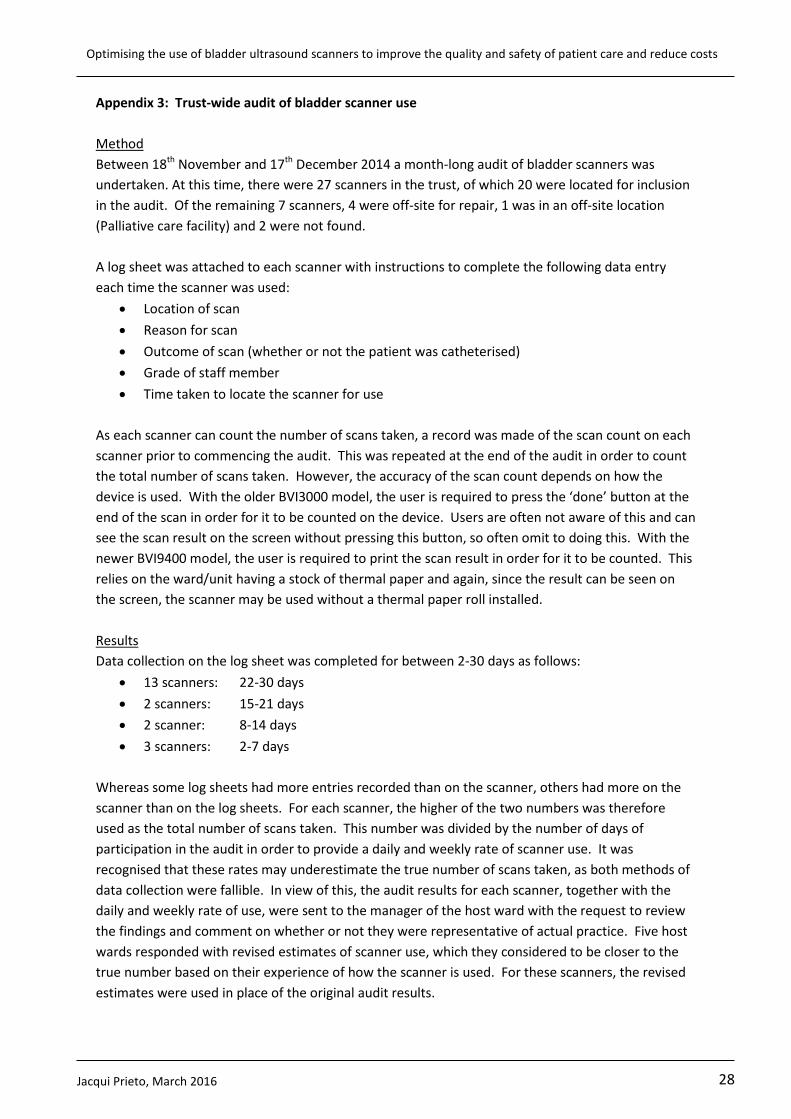
Optimising the use of bladder ultrasound scanners to improve the quality and safety of patient care and reduce costs
28
Appendix 3: Trust-wide audit of bladder scanner use Method Between 18th November and 17th December 2014 a month-long audit of bladder scanners was undertaken. At this time, there were 27 scanners in the trust, of which 20 were located for inclusion in the audit. Of the remaining 7 scanners, 4 were off-site for repair, 1 was in an off-site location (Palliative care facility) and 2 were not found. A log sheet was attached to each scanner with instructions to complete the following data entry each time the scanner was used:
• Location of scan • Reason for scan • Outcome of scan (whether or not the patient was catheterised) • Grade of staff member • Time taken to locate the scanner for use
As each scanner can count the number of scans taken, a record was made of the scan count on each scanner prior to commencing the audit. This was repeated at the end of the audit in order to count the total number of scans taken. However, the accuracy of the scan count depends on how the device is used. With the older BVI3000 model, the user is required to press the ‘done’ button at the end of the scan in order for it to be counted on the device. Users are often not aware of this and can see the scan result on the screen without pressing this button, so often omit to doing this. With the newer BVI9400 model, the user is required to print the scan result in order for it to be counted. This relies on the ward/unit having a stock of thermal paper and again, since the result can be seen on the screen, the scanner may be used without a thermal paper roll installed. Results Data collection on the log sheet was completed for between 2-30 days as follows:
• 13 scanners: 22-30 days • 2 scanners: 15-21 days • 2 scanner: 8-14 days • 3 scanners: 2-7 days
Whereas some log sheets had more entries recorded than on the scanner, others had more on the scanner than on the log sheets. For each scanner, the higher of the two numbers was therefore used as the total number of scans taken. This number was divided by the number of days of participation in the audit in order to provide a daily and weekly rate of scanner use. It was recognised that these rates may underestimate the true number of scans taken, as both methods of data collection were fallible. In view of this, the audit results for each scanner, together with the daily and weekly rate of use, were sent to the manager of the host ward with the request to review the findings and comment on whether or not they were representative of actual practice. Five host wards responded with revised estimates of scanner use, which they considered to be closer to the true number based on their experience of how the scanner is used. For these scanners, the revised estimates were used in place of the original audit results.
Jacqui Prieto, March 2016
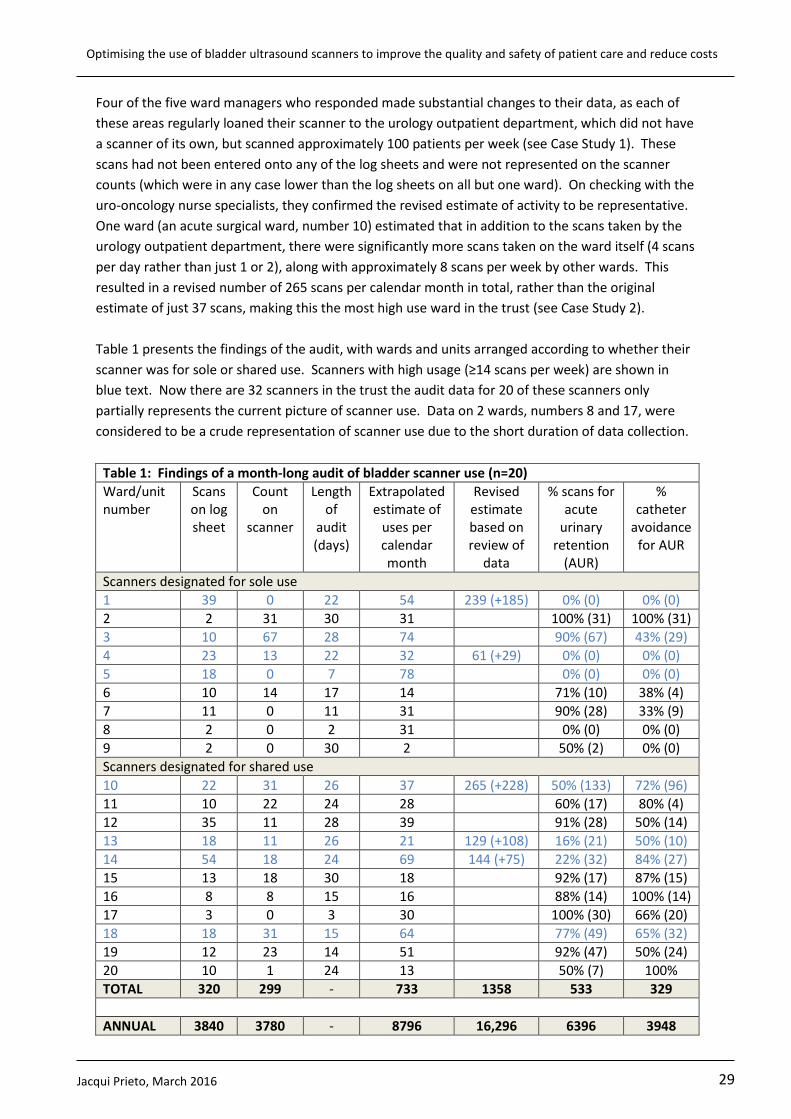
Optimising the use of bladder ultrasound scanners to improve the quality and safety of patient care and reduce costs
29
Four of the five ward managers who responded made substantial changes to their data, as each of these areas regularly loaned their scanner to the urology outpatient department, which did not have a scanner of its own, but scanned approximately 100 patients per week (see Case Study 1). These scans had not been entered onto any of the log sheets and were not represented on the scanner counts (which were in any case lower than the log sheets on all but one ward). On checking with the uro-oncology nurse specialists, they confirmed the revised estimate of activity to be representative. One ward (an acute surgical ward, number 10) estimated that in addition to the scans taken by the urology outpatient department, there were significantly more scans taken on the ward itself (4 scans per day rather than just 1 or 2), along with approximately 8 scans per week by other wards. This resulted in a revised number of 265 scans per calendar month in total, rather than the original estimate of just 37 scans, making this the most high use ward in the trust (see Case Study 2). Table 1 presents the findings of the audit, with wards and units arranged according to whether their scanner was for sole or shared use. Scanners with high usage (≥14 scans per week) are shown in blue text. Now there are 32 scanners in the trust the audit data for 20 of these scanners only partially represents the current picture of scanner use. Data on 2 wards, numbers 8 and 17, were considered to be a crude representation of scanner use due to the short duration of data collection.
Table 1: Findings of a month-long audit of bladder scanner use (n=20) Ward/unit number
Scans on log sheet
Count on
scanner
Length of
audit (days)
Extrapolated estimate of
uses per calendar month
Revised estimate based on review of
data
% scans for acute
urinary retention
(AUR)
% catheter
avoidance for AUR
Scanners designated for sole use 1 39 0 22 54 239 (+185) 0% (0) 0% (0) 2 2 31 30 31 100% (31) 100% (31) 3 10 67 28 74 90% (67) 43% (29) 4 23 13 22 32 61 (+29) 0% (0) 0% (0) 5 18 0 7 78 0% (0) 0% (0) 6 10 14 17 14 71% (10) 38% (4) 7 11 0 11 31 90% (28) 33% (9) 8 2 0 2 31 0% (0) 0% (0) 9 2 0 30 2 50% (2) 0% (0) Scanners designated for shared use 10 22 31 26 37 265 (+228) 50% (133) 72% (96) 11 10 22 24 28 60% (17) 80% (4) 12 35 11 28 39 91% (28) 50% (14) 13 18 11 26 21 129 (+108) 16% (21) 50% (10) 14 54 18 24 69 144 (+75) 22% (32) 84% (27) 15 13 18 30 18 92% (17) 87% (15) 16 8 8 15 16 88% (14) 100% (14) 17 3 0 3 30 100% (30) 66% (20) 18 18 31 15 64 77% (49) 65% (32) 19 12 23 14 51 92% (47) 50% (24) 20 10 1 24 13 50% (7) 100% TOTAL 320 299 - 733 1358 533 329
ANNUAL 3840 3780 - 8796 16,296 6396 3948
Jacqui Prieto, March 2016
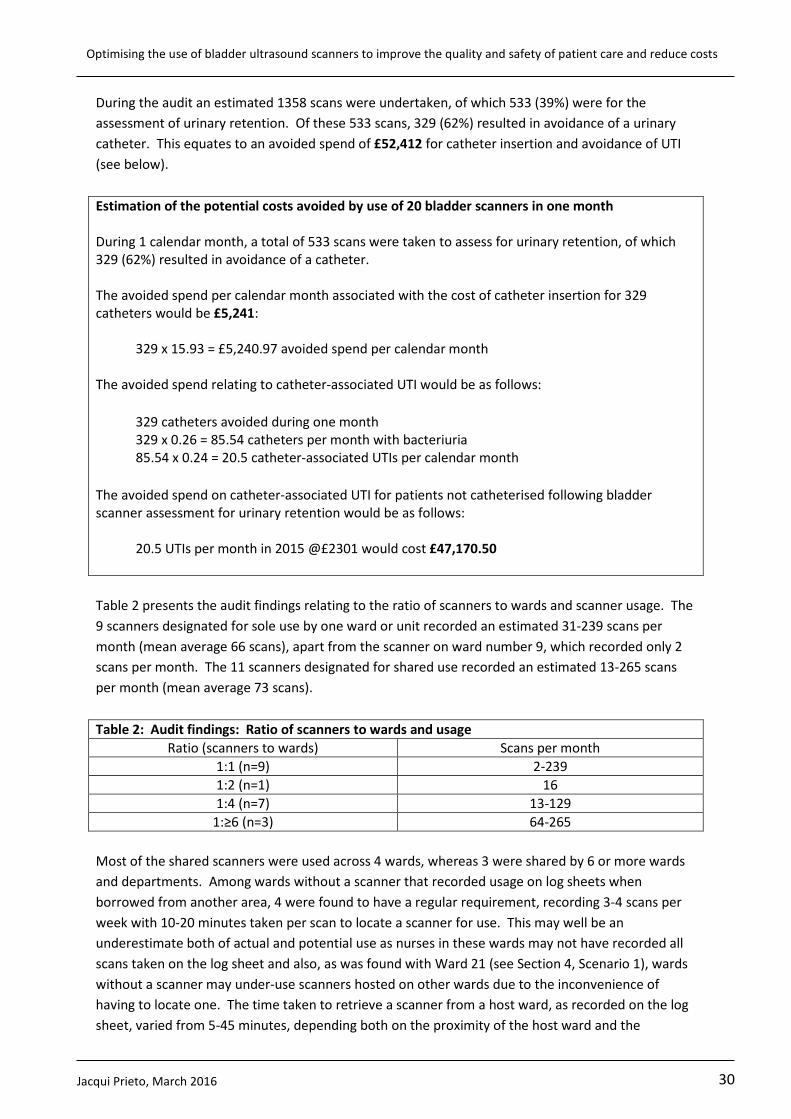
Optimising the use of bladder ultrasound scanners to improve the quality and safety of patient care and reduce costs
30
During the audit an estimated 1358 scans were undertaken, of which 533 (39%) were for the assessment of urinary retention. Of these 533 scans, 329 (62%) resulted in avoidance of a urinary catheter. This equates to an avoided spend of £52,412 for catheter insertion and avoidance of UTI (see below). Estimation of the potential costs avoided by use of 20 bladder scanners in one month During 1 calendar month, a total of 533 scans were taken to assess for urinary retention, of which 329 (62%) resulted in avoidance of a catheter. The avoided spend per calendar month associated with the cost of catheter insertion for 329 catheters would be £5,241:
329 x 15.93 = £5,240.97 avoided spend per calendar month
The avoided spend relating to catheter-associated UTI would be as follows:
329 catheters avoided during one month 329 x 0.26 = 85.54 catheters per month with bacteriuria 85.54 x 0.24 = 20.5 catheter-associated UTIs per calendar month
The avoided spend on catheter-associated UTI for patients not catheterised following bladder scanner assessment for urinary retention would be as follows:
20.5 UTIs per month in 2015 @£2301 would cost £47,170.50
Table 2 presents the audit findings relating to the ratio of scanners to wards and scanner usage. The 9 scanners designated for sole use by one ward or unit recorded an estimated 31-239 scans per month (mean average 66 scans), apart from the scanner on ward number 9, which recorded only 2 scans per month. The 11 scanners designated for shared use recorded an estimated 13-265 scans per month (mean average 73 scans).
Table 2: Audit findings: Ratio of scanners to wards and usage
Ratio (scanners to wards) Scans per month 1:1 (n=9) 2-239 1:2 (n=1) 16 1:4 (n=7) 13-129
1:≥6 (n=3) 64-265 Most of the shared scanners were used across 4 wards, whereas 3 were shared by 6 or more wards and departments. Among wards without a scanner that recorded usage on log sheets when borrowed from another area, 4 were found to have a regular requirement, recording 3-4 scans per week with 10-20 minutes taken per scan to locate a scanner for use. This may well be an underestimate both of actual and potential use as nurses in these wards may not have recorded all scans taken on the log sheet and also, as was found with Ward 21 (see Section 4, Scenario 1), wards without a scanner may under-use scanners hosted on other wards due to the inconvenience of having to locate one. The time taken to retrieve a scanner from a host ward, as recorded on the log sheet, varied from 5-45 minutes, depending both on the proximity of the host ward and the
Jacqui Prieto, March 2016
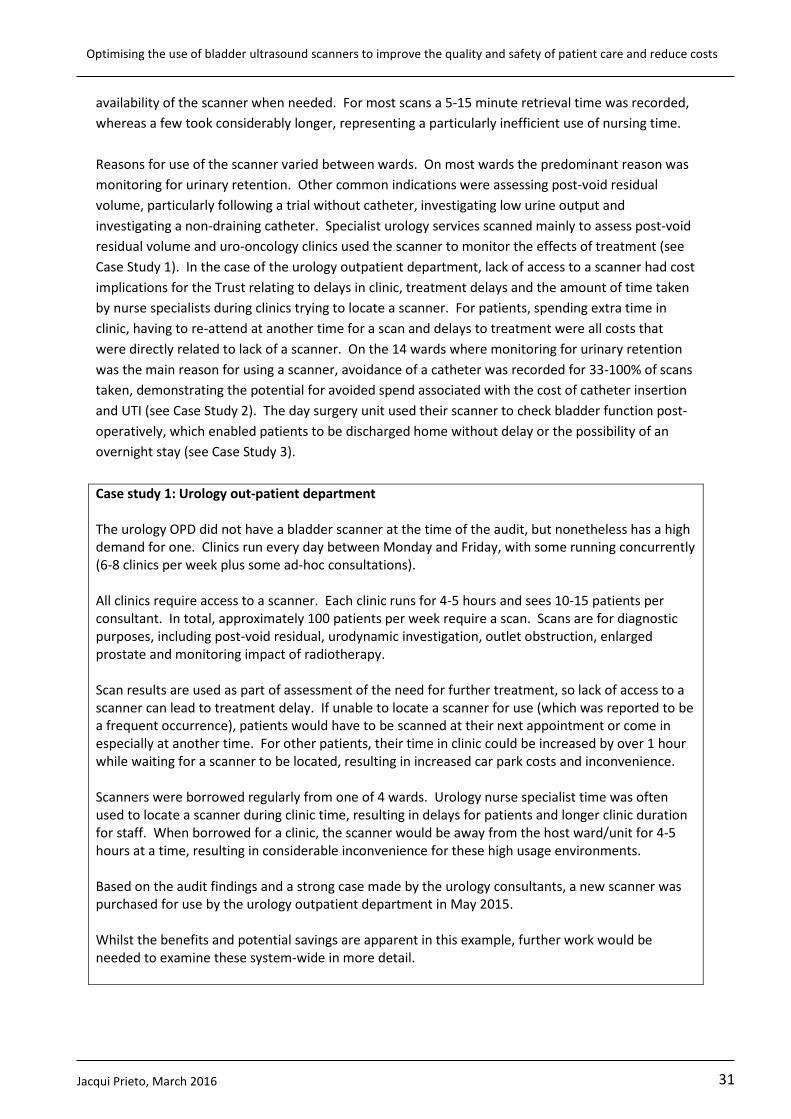
Optimising the use of bladder ultrasound scanners to improve the quality and safety of patient care and reduce costs
31
availability of the scanner when needed. For most scans a 5-15 minute retrieval time was recorded, whereas a few took considerably longer, representing a particularly inefficient use of nursing time. Reasons for use of the scanner varied between wards. On most wards the predominant reason was monitoring for urinary retention. Other common indications were assessing post-void residual volume, particularly following a trial without catheter, investigating low urine output and investigating a non-draining catheter. Specialist urology services scanned mainly to assess post-void residual volume and uro-oncology clinics used the scanner to monitor the effects of treatment (see Case Study 1). In the case of the urology outpatient department, lack of access to a scanner had cost implications for the Trust relating to delays in clinic, treatment delays and the amount of time taken by nurse specialists during clinics trying to locate a scanner. For patients, spending extra time in clinic, having to re-attend at another time for a scan and delays to treatment were all costs that were directly related to lack of a scanner. On the 14 wards where monitoring for urinary retention was the main reason for using a scanner, avoidance of a catheter was recorded for 33-100% of scans taken, demonstrating the potential for avoided spend associated with the cost of catheter insertion and UTI (see Case Study 2). The day surgery unit used their scanner to check bladder function post-operatively, which enabled patients to be discharged home without delay or the possibility of an overnight stay (see Case Study 3). Case study 1: Urology out-patient department The urology OPD did not have a bladder scanner at the time of the audit, but nonetheless has a high demand for one. Clinics run every day between Monday and Friday, with some running concurrently (6-8 clinics per week plus some ad-hoc consultations). All clinics require access to a scanner. Each clinic runs for 4-5 hours and sees 10-15 patients per consultant. In total, approximately 100 patients per week require a scan. Scans are for diagnostic purposes, including post-void residual, urodynamic investigation, outlet obstruction, enlarged prostate and monitoring impact of radiotherapy. Scan results are used as part of assessment of the need for further treatment, so lack of access to a scanner can lead to treatment delay. If unable to locate a scanner for use (which was reported to be a frequent occurrence), patients would have to be scanned at their next appointment or come in especially at another time. For other patients, their time in clinic could be increased by over 1 hour while waiting for a scanner to be located, resulting in increased car park costs and inconvenience. Scanners were borrowed regularly from one of 4 wards. Urology nurse specialist time was often used to locate a scanner during clinic time, resulting in delays for patients and longer clinic duration for staff. When borrowed for a clinic, the scanner would be away from the host ward/unit for 4-5 hours at a time, resulting in considerable inconvenience for these high usage environments. Based on the audit findings and a strong case made by the urology consultants, a new scanner was purchased for use by the urology outpatient department in May 2015. Whilst the benefits and potential savings are apparent in this example, further work would be needed to examine these system-wide in more detail.
Jacqui Prieto, March 2016
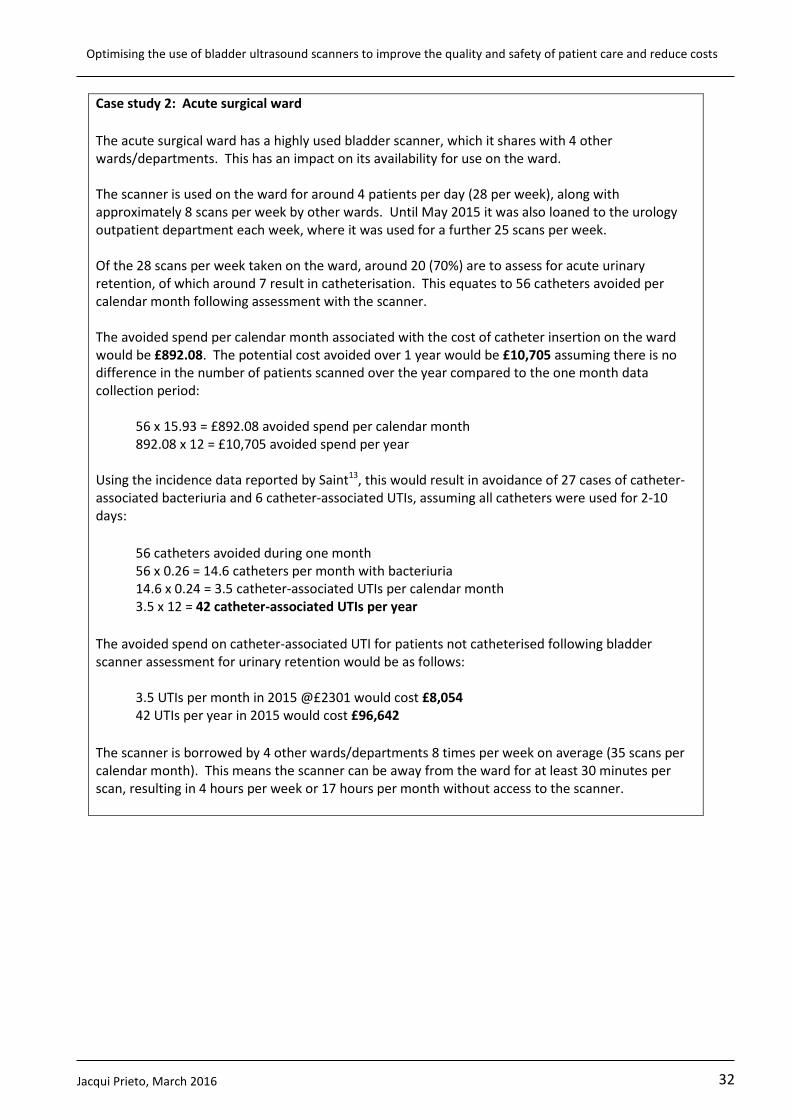
Optimising the use of bladder ultrasound scanners to improve the quality and safety of patient care and reduce costs
32
Case study 2: Acute surgical ward The acute surgical ward has a highly used bladder scanner, which it shares with 4 other wards/departments. This has an impact on its availability for use on the ward. The scanner is used on the ward for around 4 patients per day (28 per week), along with approximately 8 scans per week by other wards. Until May 2015 it was also loaned to the urology outpatient department each week, where it was used for a further 25 scans per week. Of the 28 scans per week taken on the ward, around 20 (70%) are to assess for acute urinary retention, of which around 7 result in catheterisation. This equates to 56 catheters avoided per calendar month following assessment with the scanner. The avoided spend per calendar month associated with the cost of catheter insertion on the ward would be £892.08. The potential cost avoided over 1 year would be £10,705 assuming there is no difference in the number of patients scanned over the year compared to the one month data collection period:
56 x 15.93 = £892.08 avoided spend per calendar month 892.08 x 12 = £10,705 avoided spend per year
Using the incidence data reported by Saint13, this would result in avoidance of 27 cases of catheter-associated bacteriuria and 6 catheter-associated UTIs, assuming all catheters were used for 2-10 days:
56 catheters avoided during one month 56 x 0.26 = 14.6 catheters per month with bacteriuria 14.6 x 0.24 = 3.5 catheter-associated UTIs per calendar month 3.5 x 12 = 42 catheter-associated UTIs per year
The avoided spend on catheter-associated UTI for patients not catheterised following bladder scanner assessment for urinary retention would be as follows:
3.5 UTIs per month in 2015 @£2301 would cost £8,054 42 UTIs per year in 2015 would cost £96,642
The scanner is borrowed by 4 other wards/departments 8 times per week on average (35 scans per calendar month). This means the scanner can be away from the ward for at least 30 minutes per scan, resulting in 4 hours per week or 17 hours per month without access to the scanner.
Jacqui Prieto, March 2016
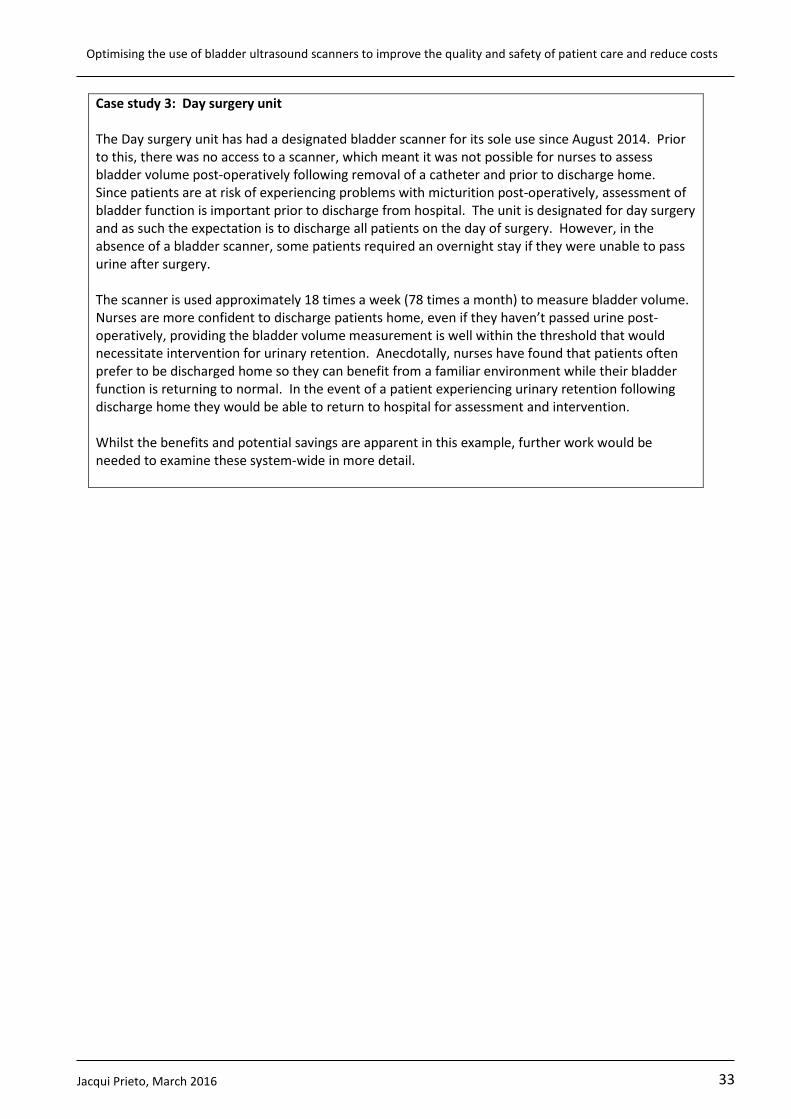
Optimising the use of bladder ultrasound scanners to improve the quality and safety of patient care and reduce costs
33
Case study 3: Day surgery unit The Day surgery unit has had a designated bladder scanner for its sole use since August 2014. Prior to this, there was no access to a scanner, which meant it was not possible for nurses to assess bladder volume post-operatively following removal of a catheter and prior to discharge home. Since patients are at risk of experiencing problems with micturition post-operatively, assessment of bladder function is important prior to discharge from hospital. The unit is designated for day surgery and as such the expectation is to discharge all patients on the day of surgery. However, in the absence of a bladder scanner, some patients required an overnight stay if they were unable to pass urine after surgery. The scanner is used approximately 18 times a week (78 times a month) to measure bladder volume. Nurses are more confident to discharge patients home, even if they haven’t passed urine post-operatively, providing the bladder volume measurement is well within the threshold that would necessitate intervention for urinary retention. Anecdotally, nurses have found that patients often prefer to be discharged home so they can benefit from a familiar environment while their bladder function is returning to normal. In the event of a patient experiencing urinary retention following discharge home they would be able to return to hospital for assessment and intervention. Whilst the benefits and potential savings are apparent in this example, further work would be needed to examine these system-wide in more detail.
Jacqui Prieto, March 2016
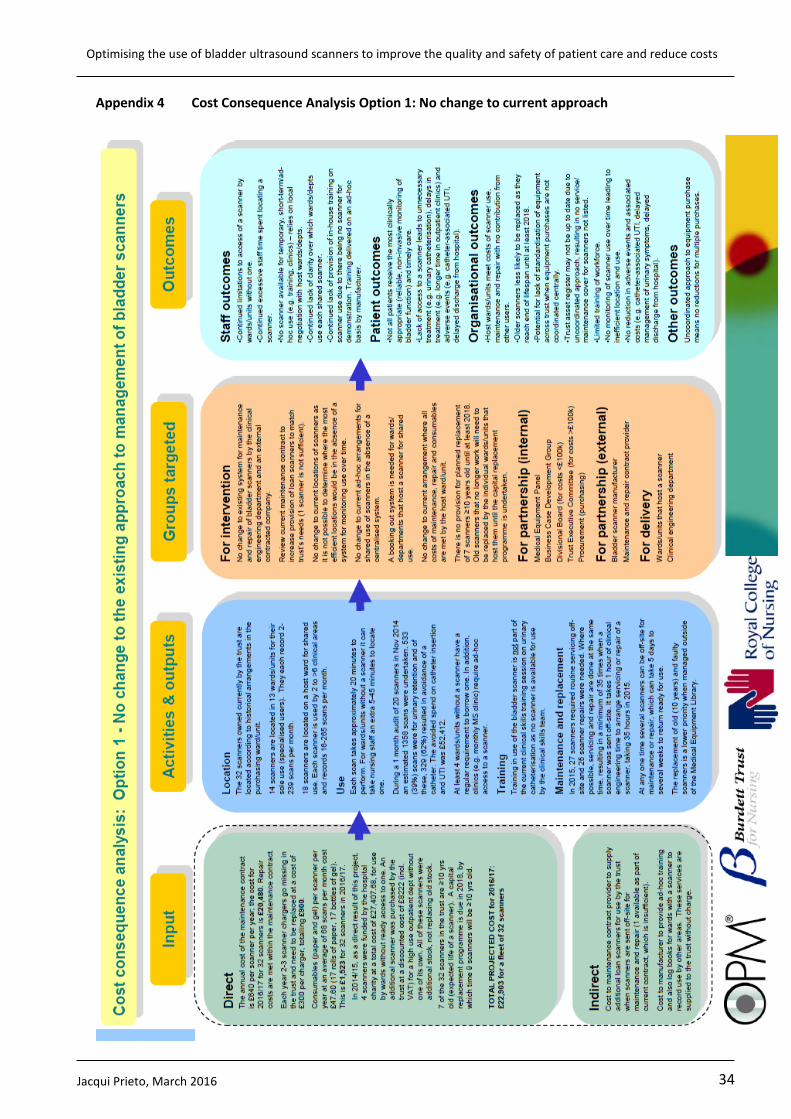
Optimising the use of bladder ultrasound scanners to improve the quality and safety of patient care and reduce costs
34
Appendix 4 Cost Consequence Analysis Option 1: No change to current approach
Jacqui Prieto, March 2016
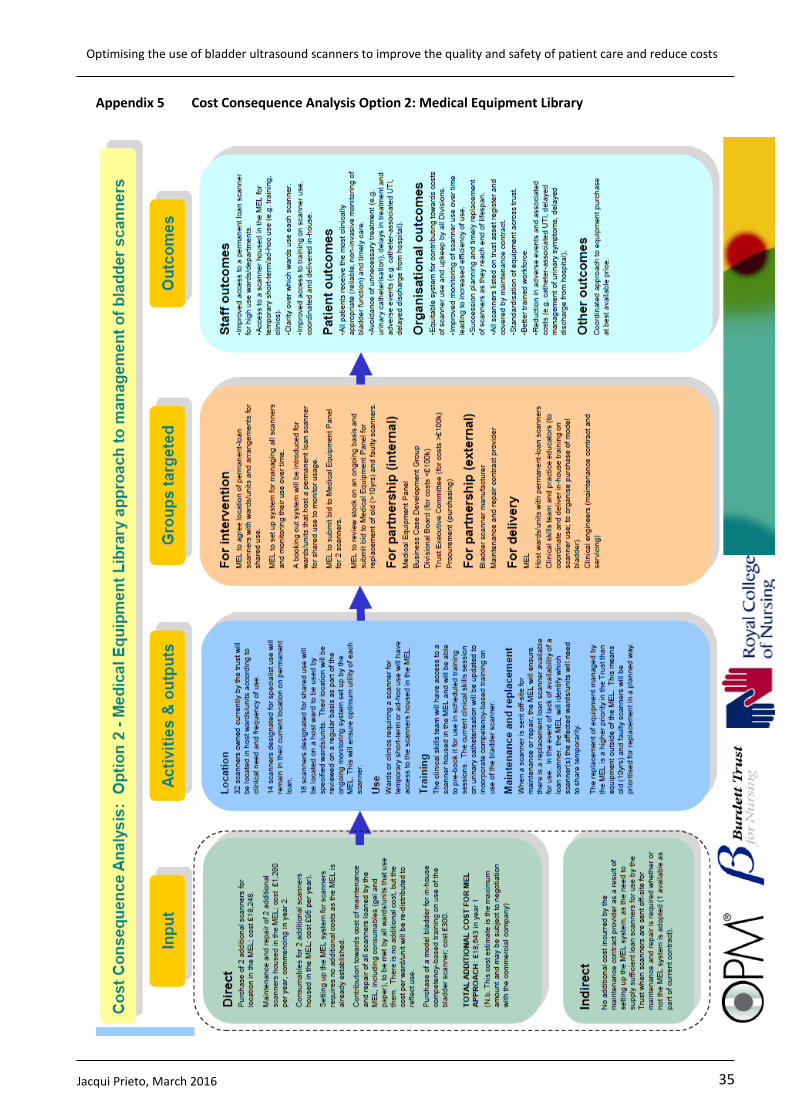
Optimising the use of bladder ultrasound scanners to improve the quality and safety of patient care and reduce costs
35
Appendix 5 Cost Consequence Analysis Option 2: Medical Equipment Library
Jacqui Prieto, March 2016