optimization and evaluation of electroporation delivery of
TRANSCRIPT

Linköping University Post Print
Optimization and evaluation of electroporation
delivery of siRNA in the human leukemic CEM
cell line
Anna Fyrberg and Kourosh Lotfi
N.B.: When citing this work, cite the original article.
The original publication is available at www.springerlink.com:
Anna Fyrberg and Kourosh Lotfi, Optimization and evaluation of electroporation delivery of
siRNA in the human leukemic CEM cell line, 2010, CYTOTECHNOLOGY, (62), 6, 497-
507.
http://dx.doi.org/10.1007/s10616-010-9309-6
Copyright: Springer Science Business Media
http://www.springerlink.com/
Postprint available at: Linköping University Electronic Press
http://urn.kb.se/resolve?urn=urn:nbn:se:liu:diva-63397
Optimization and evaluation of electroporation delivery of siRNA
in the human leukemic CEM cell line.
Anna Fyrberga and Kourosh Lotfi
a,b
aDivision of Drug Research/Clinical Pharmacology, Department of Medicine and Health,
Faculty of Health Sciences, SE-581 85 Linköping b Department of Hematology, Linköping
University Hospital, SE-581 83 Linköping, Sweden
Key words: RNAi, electroporation, microarray, deoxycytidine kinase, nucleoside analog
address correspondence to:
Anna Fyrberg, Division of Drug Research/Clinical Pharmacology, Department of Medicine
and Health, SE-581 85 Linköping, Sweden
Fax: +46(0)13-104195. Phone: +46(0)10-1032029. E-mail: [email protected]

Introduction
Nucleoside analogs are drugs used for cancer chemotherapy and are prodrugs needed to be
phosphorylated intracellular in order to become active. The cytosolic enzyme deoxycytidine
kinase (dCK, E.C.2.7.1.74) activates both natural nucleosides and nucleoside analogs to
monophosphates that can further be phosphorylated to di- and triphosphates (Arner and
Eriksson, 1995). Decreasing the expression of this enzyme experimentally may help in the
understanding of resistance mechanisms to nucleoside analogs, since dCK activity and
expression often are reduced in nucleoside analog-resistant patients and cell lines (Bai et al.,
1998; Lotfi et al., 1999). Nucleoside analogs exert their effect by incorporating into growing
DNA, terminating the synthesis, and by disturbing RNA synthesis or the enzyme
ribonucleotide reductase. This enzyme is involved in ribo- and deoxyribonucleotide pool
maintenance by reducing ribonucleotides (NTPs) to the corresponding deoxyribonucleotides
(dNTPs). The intracellular nucleotides and the nucleotides of the activated nucleoside analog
compete for the same incorporation sites in the cell. The ribonucleotide reductase is made up
of two non-identical subunits called R1 and R2. The R1 protein is expressed constantly and
predominantly in proliferating cells, while the smaller R2 protein is cell cycle regulated
(Nordlund and Reichard, 2006). Another protein called p53-induced R2 protein (p53R2) has
been shown to form an active RR complex with the R1 subunit in G1- or non-proliferating
cells (Guittet et al., 2001; Wang et al., 2009). Nucleoside analog resistance can sometimes be
explained by increased expression of one or several of these subunits leading to increased
endogenous dNTPs competing with the active nucleoside analogs for the same place of
incorporation (Bergman et al., 2005; Goan et al., 1999; Mansson et al., 2003).
To study the intracellular activation of nucleoside analogs to deoxynucleotides, we decided to
downregulate the dCK enzyme using siRNA. Electroporation was chosen to transiently
transfect and downregulate dCK in the human T-cell acute lymphoblastic leukemia CEM cell
line. This cell line was chosen because it, like other hematopoietic cells, express high levels of
dCK, and since nucleoside analogs primarily is used to treat different types of leukemias (Fox
et al., 1991). There were limited data available on transient siRNA transfection in CEM cells
using electroporation, and therefore attempts were carried out to optimize a protocol
addressing this. The gene expressions in untreated CEM cells, electroporated cells, and
siRNA-treated cells were also evaluated using whole-genome microarray analysis.
Cytotoxicity measurements, using several clinically relevant nucleoside analogs, were
performed comparing dCK siRNA- and negative control transfected cells.

Materials and methods
Materials
Cells were purchased from American Type Culture Collection (Rockville, MD, USA), while
cladribine (Leustatin®
) was from Johnson & Johnson (Schaffhausen, Germany), cytarabine
(Cytosar®) was from Pharmacia & Upjohn (Stockholm, Sweden), clofarabine (2-chloro-2´-
arabino-fluoro-2´-deoxyadenosine, Evoltra®), was a gift from Dr. Howard Cottam, University
of California (San Diego, CA, USA), nelarabine (9-β-D-arabinofuranosylguanine, Atriance®)
was from R.I. Chemical (Orange, CA, USA), fludarabine (2-fluoroarabinosyladenine,
Fludara®) was kindly provided by Dr. Zeév Shaked, Berlex (Alameda, CA, USA), and
daunorubicin (Cerubidin®
) was from Rhône-Poulenc Rorer (Bristol, UK). Electroporation
devices and chemicals were from Bio-Rad Laboratories (Hercules, CA, USA), cell culturing
reagents were from Gibco, Life Technologies (Paisley, UK), siRNAs were from Ambion, Inc.
(Huntington, Cambridge, UK), real-time PCR equipment and reagents were from Applied
Biosystems (Foster City, CA,USA), microarray reagents and equipment were from
Affymetrix (Buckinhamshire, UK), and additional chemicals were purchased from Sigma-
Aldrich (Stockholm, Sweden).
Cells and siRNA transfection
CEM cells (acute T-lymphoblastic leukemia) were kept in RPMI-1640 media with 10% fetal
calf serum (FCS), 100 IU/ml penicillin, 100 g/ml streptomycin (PEST), and 2 mM L-
glutamine. Prior to siRNA transfection cells were washed in RPMI-1640 media and
resuspended in the same media. Cells were electroporated in 0.4 cm cuvettes with a Gene
Pulser Xcell Electroporation System. Small interfering RNAs used were the Silencer®
Validated siRNA # 68, #69 and #70 for human deoxycytidine kinase. Silencer®
negative
control siRNA that did not bind to any human mRNA sequences was used and transfected
into control cells, and Silencer® GAPDH siRNA was used as a positive control during
optimization of the transfection. Optimization parameters are presented in table 1, and final
transfection protocol is presented in the results section. The CEM cells used were an average
of 13 m in diameter and the appropriate range of voltage to be tested was estimated using
this formula (www.eppendorf.com):
EC=VC/(0,75dcell)
where EC: critical field strength (V/cm)
VC: permeation voltage of the membrane ( 1V at 20oC, 2V at 4
oC)
dcell: Cell diameter (cm)
and V=ECdcuv
where V: voltage setting on electroporator
dcuv: electrode distance (gap width, cm)
RNA extraction and PCR
RNA was extracted from the cells using the RNeasy Mini Kit (Qiagen, Solna, Sweden).
Complementary DNA was produced using the High Capacity Archive Kit (Applied
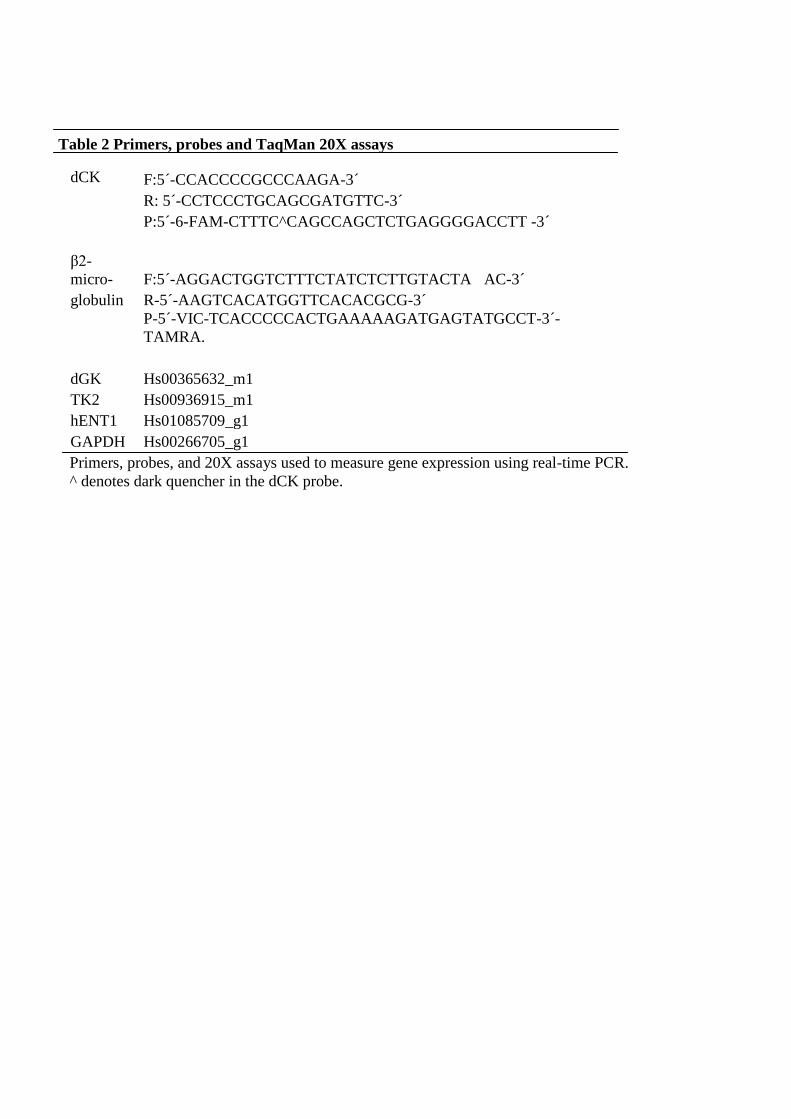
Biosystems) according to the manufacturer’s instructions. Primers and probe for dCK and the
housekeeping gene β2-microglobulin, as well as Taqman® Gene Expression Assays (20X) for
deoxyguanosine kinase (dGK), thymidine kinase 2 (TK2), human equilibrative nucleoside
transporter 1 (hENT1), and glyceraldehyde 3-phosphate dehydrogenase (GAPDH,) are shown
in table 2. Reactions were carried out in a 7500 Fast Real-time PCR System.
Protein extraction and enzyme activity measurements
Cells were centrifuged at 600 × g and washed three times with ice-cold PBS, and cell pellets
were resuspended in a protein extraction buffer (50 mM Tris-HCl (pH 7.6), 4 mM
dithiothreitol, 0.5 mM phenylmethylsulfonyl fluoride, 20% glycerol, and 0.5% Nonidet P40)
and lysed in liquid nitrogen. After a 15 min centrifugation at 15,000 × g, supernatants were
collected and assayed for dCK activity as previously described in (Fyrberg et al., 2007) using
10 M deoxycytidine ([8-3H]-2´-deoxycytidine, specific activity 8.3 Ci/mmol) as substrate.
Activities were expressed as pmol of formed product per min per mg of protein and protein
contents (mg/ml) were determined by the method of Lowry (Lowry et al., 1951) using the DC
protein assay (Bio-Rad Laboratories).
Drug cytotoxicity assay
The methyl thiazole tetrazolium (MTT) assay (Mosmann, 1983) was used to assess nucleoside
analog cytotoxicity in siRNA transfected cells as described in (Fyrberg et al., 2007). After
siRNA transfection, the cells were allowed to recover for 24 hrs before initiating the
experiments, and drug incubations were carried out during 48 hrs. Absorbance was measured
at a wavelength of 540 nm with the reference at 650 nm and an IC50 value was calculated as
the percent survival compared to control cells.

Western blot
Protein expressions were visualized using Western blot. Forty g of proteins were loaded on a
Criterion Precast 4-15% Tris-HCl gel and run in a sodium dodecyl sulphate (SDS) running
buffer (0.4 M glycine, 50 mM Tris-HCl, 14 mM SDS) at 100 V for 2 hrs. The Precision Plus
Protein Kaleidoscope
Standard was used to determine molecular weight. Proteins were
transferred onto an Immune Blot PVDF membrane in a transfer buffer (25 mM Tris-HCl, 192
mM glycine, 20% methanol) at 50 V for 1 hr. A monoclonal mouse anti-R1 antibody
(AD03, 1:1000) was from InRo Biomedtek (Umeå, Sweden), polyclonal rat anti-R2
antibody (1:1000) was kindly provided by Dr. D. Lembo at the Department of Public Health
and Microbiology, University of Turin (Lembo et al., 2000), polyclonal rabbit anti-p53R2
(ab8105, 1:1000) and polyclonal rabbit anti--actin (ab8227, 1:1000) were from Abcam
(Cambridge, UK). All secondary peroxidase-labeled antibodies (1:1000) were from
Amersham Biosciences (Little Chalfont, UK). The blots were developed using Supersignal®
West Pico Chemiluminescent Substrate (Pierce Biotechnology, Rockford, IL, US).
HPLC analysis of intracellular nucleotide pools
Five million CEM cells were harvested at 600 × g and washed three times in ice-cold PBS.
The cell pellets were resuspended in 200 l H20 and boiled for 5 min. After a centrifugation at
15,000 × g for 15 min, the supernatants were collected and analyzed for NTP pool content on
a Purospher Star 4 × 55 mm column (Waters) at 30oC. Twenty-five l of the sample was
injected onto the column and eluated at a flow rate of 1.23 ml/min using a 0-25% gradient
with acetonitrile and 20 mM K2HPO4 buffer (20 mM K2HPO4, pH 7.0, 2.1 mM
tetrabutylammonium bisulphate, 3% acetonitrile). A mixture of all ribonucleotides with
known concentrations was used as a reference. The amount of each NTP pool was calculated
by comparing the area under the curve/height with a standard. The concentrations of GTP and
ATP were measured at 262 nm and UTP and CTP were monitored at 271 nm.
Microarray analysis
The GeneChip
Human Gene 1.0 ST Array was used and RNA from one representative
experiment was analyzed using these arrays. Samples were prepared according to the
manufacturer’s instructions. Chip data were analyzed using the GeneSpring GX® 11.0
Software (Agilent Technologies, Sweden AB). Background correction, normalization and
probe summarization were done using the robust multichip averaging (RMA) algorithm
(Irizarry et al., 2003), and significantly differentially expressed genes were found using
Welch´s t-test followed by Benjamin-Hochberg post hoc test. Samples were filtered on
expression, p-value computation was asymptotic, and the cut-off limit was drawn at 0.05.
DCK and three additional genes from the DNA chip were verified using real-time PCR.

Results
Optimizing electroporation parameters
Different parameters were tested in order to optimize the electroporation conditions (table 1).
Cell viability was evaluated by counting the cells, 1 hr after transfection at the earliest in an
automated Beckman Coulter Counter (Beckman Coulter, Inc., Brea, CA, US). Transfection
efficiency was evaluated measuring dCK mRNA expression at first, and later on also the dCK
enzyme activity. Square waves were superior to exponential decay for transfection efficiency
but not for survival, and increased the amount of transfected cells with approximately 15 %
from an initially 25% dCK mRNA down-regulation to 40% dCK mRNA down-regulation
compared to control cells. Different voltage, pulse length and number of pulses were also
evaluated, as well as temperature, cell density and cuvette volume. Optimizing these
parameters slightly enhanced the transfection efficiency but had no effect on cell viability
(table 1).
Three different validated siRNAs targeting the dCK mRNA were evaluated, and the siRNA
#70 was the optimal in these cells and led to approximately 40% dCK down-regulation
compared to control cells of the activity but more pronounced down-regulation of the mRNA
expression (fig. 1A). This siRNA had equal or slightly higher effect when used at 500 nM but
to avoid off-target effects of the siRNA, the lower concentration of 250 nM was chosen.
Adding 1.25% DMSO to the cells before electroporation, and 20% FCS just after
electroporation increased the transfection efficiency with approximately 15% to 75% dCK
down-regulation at the mRNA and enzyme activity level compared to control cells. DMSO
and FCS had a pronounced effect on cell viability, and reduced cell death to approximately
90% viable cells compared to 60%. DMSO may affect the cells negatively, and therefore dCK
expression was monitored in cells electroporated with or without 1.25% DMSO (without

siRNA) and compared to the dCK expression in untreated logarithmically grown CEM cells.
As depicted in fig. 1B, there were basically no differences in dCK expression between the two
conditions. Another siRNA was also tested, and this was a validated positive control against
GAPDH. The downregulation of GAPDH was also highly efficient in the CEM cells (fig. 1C).
Cell viability was estimated by counting the cells approximately 1 hr after electroporation and
then after 24, 48, and 72 hrs. Cell number was only moderately affected using the final
optimized protocol but cells proliferated more slowly up to 48 hrs after the electroporation
procedure compared to untreated CEM cells.
Figure 1 A Three different validated siRNAs (250 nM) against dCK were evaluated by
measuring mRNA expression and enzyme activity in CEM cells 24 hrs after electroporation.
B The effect of 1.25% DMSO on the expression of dCK was measured in cells electroporated
with or without DMSO and compared to the dCK expression in logarithmically grown
untreated CEM cells (% of control meaning compared to logarithmically grown, untreated
CEM cells, mean of two experiments). C The effect of dCK downregulation was measured at
the mRNA level after using dCK (■) or positive control GAPDH (□) siRNA in CEM cells.
Mean of two different experiments. D Three or more experiments were performed to evaluate
the optimized electroporation method using dCK siRNA in CEM cells.

Several experiments were conducted using the final optimized protocol. Cells (4 106
cells/ml) were electroporated in RPMI-1640 supplemented with 1.25% DMSO and 125 nM
siRNA (#70) at room temperature in 0.4 cm cuvttes in a volume of 400 l. They were pulsed
at 340 V for 10ms, repeated once after 10 s. Cells were rinsed out of the cuvette using a pre-
heated (37oC) post-electroporation media containing RPMI-1640, L-glutamine (2mM) and
20% FCS. Using this protocol, the dCK downregulation was approximately 75% of control at
mRNA and activity level at 24 hrs, then rose, but was present up to 72 hrs (fig. 1D).
Cytotoxicity measurement in siRNA transfected cells
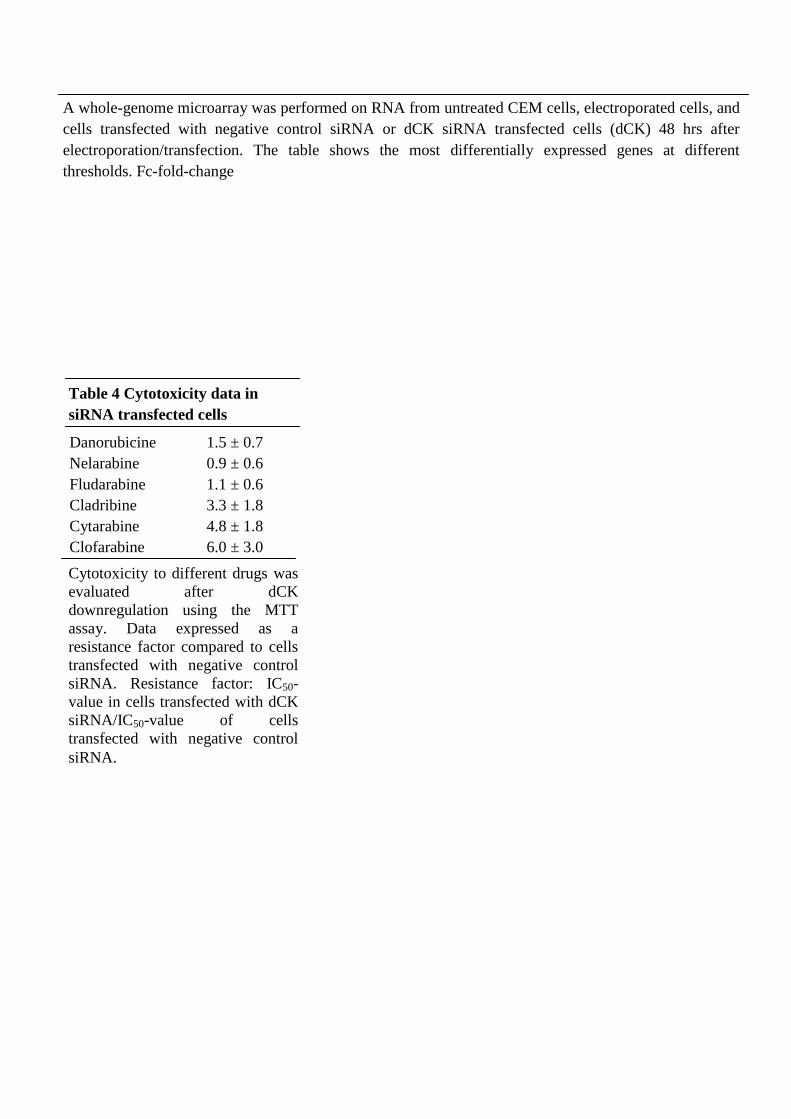
Cytotoxicity measurements were performed in siRNA transfected cells using MTT assay to
evaluate the effect of dCK downregulation. The sensitivity to the nucleoside analogs
cladribine, cytarabine, and clofarabine were 3 to 6-fold decreased in cells transfected with
dCK siRNA compared to cells transfected with negative control siRNA (table 4) with
clofarabine being most dependent on dCK phosphorylation and cladribine the least dependent
of these three. The nucleoside analogs fludarabine and nelarabine showed unaltered toxicity in
the cells after dCK down-regulation (table 4). The cytotoxicity to the anthracycline
daunorubicin was unchanged since its activity is independent of dCK.
Expression of ribonucleotide reductase subunits
Levels of the ribonucleotide reductase subunits were measured using western blot. This was
done since altered levels of this enzyme may also confer resistance against nucleoside
analogs, and we wanted to make sure that altered sensitivity to nucleoside analogs was not
due to changes in this enzyme. The subunits, R1, R2, and p53R2 were not significantly altered
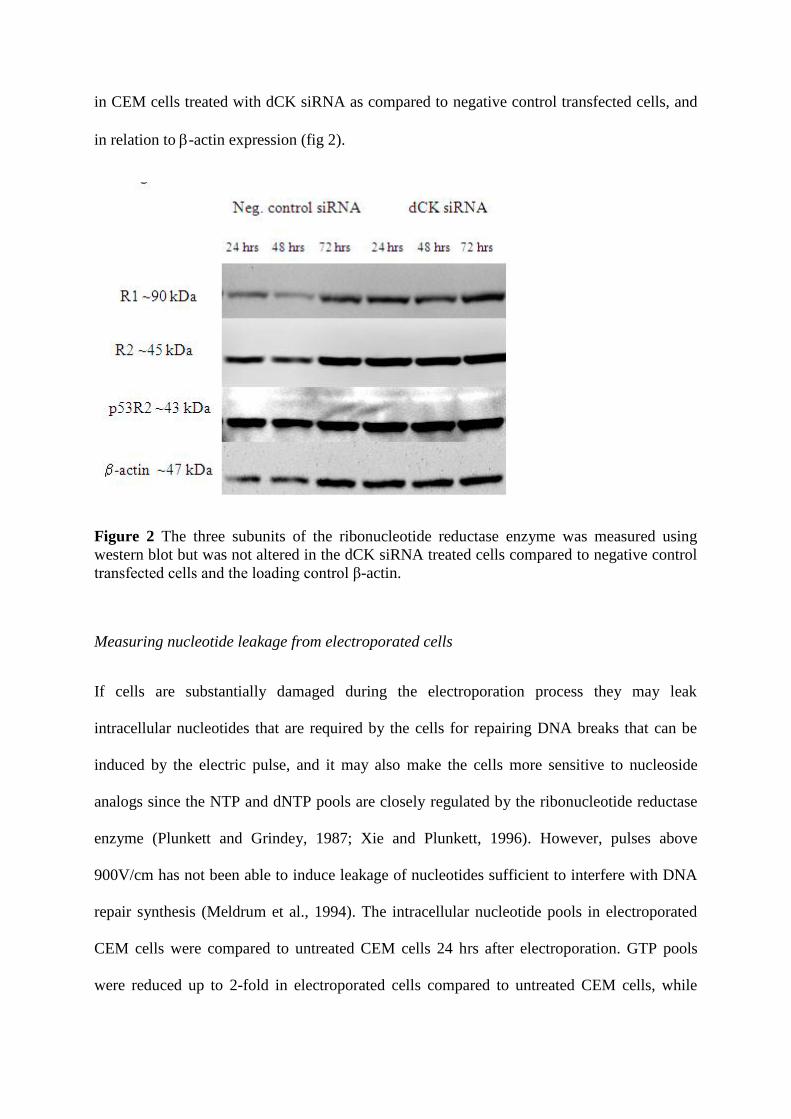
in CEM cells treated with dCK siRNA as compared to negative control transfected cells, and
in relation to -actin expression (fig 2).
Figure 2 The three subunits of the ribonucleotide reductase enzyme was measured using
western blot but was not altered in the dCK siRNA treated cells compared to negative control
transfected cells and the loading control β-actin.
Measuring nucleotide leakage from electroporated cells
If cells are substantially damaged during the electroporation process they may leak
intracellular nucleotides that are required by the cells for repairing DNA breaks that can be
induced by the electric pulse, and it may also make the cells more sensitive to nucleoside
analogs since the NTP and dNTP pools are closely regulated by the ribonucleotide reductase
enzyme (Plunkett and Grindey, 1987; Xie and Plunkett, 1996). However, pulses above
900V/cm has not been able to induce leakage of nucleotides sufficient to interfere with DNA
repair synthesis (Meldrum et al., 1994). The intracellular nucleotide pools in electroporated
CEM cells were compared to untreated CEM cells 24 hrs after electroporation. GTP pools
were reduced up to 2-fold in electroporated cells compared to untreated CEM cells, while

CTP, UTP and ATP pools were elevated 3-fold, 10-fold, and 1.3-fold respectively (fig. 3A).
All NTP pools were reduced in dCK siRNA transfected cells compared to negative control
transfected cells at 24 hrs after electroporation (fig. 3B) but had normalized again after 96 hrs
(fig. 3C).
Figure 3 A Leak of nucleotides was examined in electroporated cells using HPLC, and
nucleotide pool content was compared to untreated logarithmically grown CEM cells. At 24
hrs after electroporation no leakage occured, instead the UPT pool was markedly increased.
X-fold difference on Y-axis B Nucleotide pool content at 24 hrs after electroporation in cells
transfected with dCK siRNA was compared to cells transfected with negative control siRNA.
All pools were slightly reduced but had normalized again or were slightly increased 96 hrs
after transfection C.

Whole-genome microarray analysis of electroporated cells
A genome-wide microarray was performed 48 hrs post-electroporation. This was done in
order to see the effects of the electroporation procedure on the cells, and the effects of the
negative control siRNA and the dCK siRNA on the cells. We wanted to see if the dCK down-
regulation was specific or if the siRNA had off-target effects on any other genes. The time-
point of 48 hrs was chosen because it was the time-point in the middle of the cytotoxicity
measurement with nucleoside analogs. We also wanted genes affected by the electroporation
procedure itself to stabilize and to see effects on genes exerted by the siRNA only. When
comparing untreated CEM cells compared to electroporated CEM cells, a total of 124 genes
were differentially expressed when looking above a 2-fold difference in gene expression.
When changing the settings to above 4-fold difference a total of 10 genes were upregulated.
There were genes involved in apoptosis, fatty acid metabolism, cholesterol biosynthesis, and
glucose metabolism (table 3). When comparing the electroporated cells with cells transfected
with the negative control siRNA, one gene was differentially expressed corresponding to the
complete genome of the mitochondrion (table 3). When comparing dCK siRNA transfected
cells to the negative control cells the cut-off was drawn at 1.7-fold difference since that was
the level of dCK downregulation, and this was also the only gene down-regulated. At this cut-
off, additionally two genes were upregulated. However, these were genes with unknown
function or with very little knowledge about (table 3), and hence it is not possible to speculate
about their potential role in dCK downregulation.
In addition to dCK, three other genes were examined and verified using realtime-PCR in
relation to the microarray expression. The genes of two additional kinases also able to activate
some nucleosides and nucleoside analogs, dGK and TK2, were examined. The expression of a
nucleoside transporter involved in transportation of nucleoside analogs across the cell
membrane, called hENT1, was also examined in order to see if altered expression of these

genes could help explain part of the reduced activation of nucleoside analogs. DCK
expression was 43% of control using realtime-PCR, while for dGK, TK2, and hENT1 it was
118, 130, and 104% of control respectively. These data were more or less in agreement with
the chip data and these enzymes/transporter were probably not involved in any nucleoside
analog resistance since we then had expected altered levels of these.

Discussion
Electroporation has direct toxic effect on cells, but so has the lipid-mediated transfection
reagents as well, and by optimizing the parameters used during transfection one can avoid
toxicity and still receive high transfection efficiency. Two types of pulses can be applied, the
exponential decay which decreases during time and square waves, which allows a controlled
pulse of fixed amplitude for a fixed period of time. In these experiments transfection
efficiency, but not cell viability, was enhanced, using square waves, as has been shown in
other studies as well (Liu and Bergan, 2001). One would also like to apply sufficiently high
enough voltage to permeabilize cells without a major cell loss. The threshold for reaching
permeabilization is lower the larger the cell, and since cells grown in culture do not have the
exact same size due to different age, membrane thickness and volume it is virtually
impossible to permeate all cells simultaneously (Ferret et al., 2000). The CEM cells used in
this study were approximately 13 m in diameter and most suppliers recommend the voltage
settings to be in the range of 200-500V. The length of the applied pulse is important for
permeation, but also has a significant effect on the DNA strand breaks and cell rupture
induced by the electroporation (Meaking et al., 1995).
Adding different reagents to the electroporation media may improve both survival and
transfection efficiency substantially. Bahnson et al., showed that some low-molecular weight
molecule(s) in serum had a sealing effect on electroporated cells and also enhanced the
transfection efficiency (Bahnson and Boggs, 1990). They showed that 20 min after
electroporation at a serum concentration of 20%, virtually all cells were impermeable to
lucifer yellow (Bahnson and Boggs, 1990). Electroporation with FCS slightly reduced the
transfection efficiency, probably due to protein-siRNA binding, and therefore 20% serum was
used in the post-electroporation media since this was shown to increase the downregulation
and enhance cell viability. The effect of DMSO on electroporated cells is unclear so the

mRNA expression of dCK was measured in cells electroporated with or without DMSO and
compared to untreated CEM cells. The expression profiles resembled each other, and the
initial drop-down was probably due to the decreased proliferative capacity of the
electroporated cells, since we have shown before that at least the activity of dCK closely
follow the S-phase distribution of the cells (Fyrberg et al., 2007). It is speculated that DMSO
take part in the permeation process of membranes and stabilizes the cell membrane so that
transfected cells survive after electroporation (Melkonyan et al., 1996), and is also a
scavenger of reactive oxygen species (Yu and Quinn, 1994) that could potentially harm the
fragile electroporated cells. Antibiotics were avoided during electroporation since the
intracellular concentration of antibiotics may reach high and potentially toxic levels if allowed
to flow into the open pores of electroporated cells.
Three different validated siRNA sequences were tested and data clearly showed that one
siRNA (#70) was superior to the other two. A mixture of all three siRNAs did not enhance
downregulation further (data not shown). Of randomly chosen siRNAs, 70-90% are able to
create an 80% knock-down of the target gene, but since suspension cells are more difficult to
transfect they require even more efficient siRNA. Also, genes with highly abundant protein
products or very stable proteins may be difficult to silence with traditional siRNAs (Verma
and Dey, 2004). A 40-75% downregulation of dCK mRNA and activity, as in this case, was
apparently sufficient to see an effect on nucleoside analog activation. dCK expression and
activity started to normalize shortly after down-regulation. At 96 hrs after electroporation,
mRNA expression was approximately 75% of control cells, while dCK enzyme activity was
125% of control. This may be an overcompensation mechanism occurring after the repression
of the enzyme. Because the cells are highly dependent on dCK for normal function and
salvage of nucleosides for DNA synthesis (Arner and Eriksson, 1995) they may increase dCK
activity in order to make up for its decreased activity during the siRNA suppression.

Three of the nucleoside analogs tested were less toxic to the cells after downregulation of
dCK, indicating they are highly dependent on dCK phosphorylation to become activated. It
was not very surprising that nelarabine and fludarabine showed unaltered sensitivity in the
cells since nelarabine is also efficiently activated by the mithochondrial enzyme
deoxyguanosine kinase (Zhu et al., 2000) and that resistance mechanismsm against
fludarabine has been shown to include altered activity of the ribonucleotide reductase enzyme
rather than decreased dCK activity (Mansson et al., 2003). During these experimental
conditions both deoxyguanosine kinase and the ribonucleotide enzyme seemed unaffected by
the dCK downregulation, which probably is one of the reasons for the sustained cytotoxicity
of nelarabine and fludarabine.
Intracellular nucleotide pools were monitored in electroporated cells in order to see if
nucleotide leakage occurred, that could possibly affect DNA repair synthesis, and nucleoside
analog efficiency. The GTP pool was reduced in the electroporated cells, while the CTP, UTP
and ATP pools were increased in the cells. These measurements reflect the NTP content at 24
hrs post-electroporation and the elevated pools may be seen as an over-compensation of the
nucleotide leakage that possibly took place immediately after electroporation. Therefore it
may be possible that the intracellular NTP pools would look different choosing another time-
point for measuring, since we had expected some degree of NTP leakage from the
electroporated cells. On the other hand we expected the cells to be slightly more vulnerable
directly after electroporation and we therefore waited 24 hrs before preparing them for
measuring of NTP content. The reduction of all NTP pools in dCK siRNA transfected cells
may be a consequence of the dCK down-regulation. dCK can provide the cell with all four
dNTPs needed for DNA synthesis (Arner and Eriksson, 1995), and if dCK activity decreases
so may dNTP and possibly NTP pools do as well.
In order to determine if the electroporation itself or if any of the siRNAs used could influence
gene expression besides dCK downregulation, a whole-genome microarray experiment was
conducted. Even though several genes were upregulated in the electroporated cells, these
changes were rather modest and involved in systems likely to be affected during
electroporation and were probably upregulated in order to help the cells cope with the
electroporation process. This was not very surprising since electroporation is stressful to the
cells, may damage their membranes, and sometimes lead to apoptosis, and the genes
upregulated were most probably increased to help the cells repair their membrane damages,
increase glucose uptake, or help the cells die if irreversibly damaged. When downregulating
dCK, additionally two genes were affected and upregulated, they were however of unknown
function. Three additional genes besides dCK, and involved in nucleoside analog metabolism,
were evaluated using realtime-PCR. For dCK and TK2 there were a slightly higher difference
between the microarray expression value and realtime-PCR expression value. This may be
due to the fact that the array uses several housekeeping genes for normalization, while the
realtime-PCR only normalized to one gene, GAPDH.
Conclusions
Based on the above results, this shows that suspensions cells can be transiently transfected
with siRNA to a rather high efficiency and specificity, and that siRNA is a powerful tool to
study nucleoside analog metabolism. It also shows that the decreased sensitivity is seen
against nucleoside analogs and not to anthracyclines, as is seen when making cells nucleoside
analog-resistant using nucleoside analogs in the cell media during several months (Lotfi et al.,
2002). We aim to use this technique further in the study of nucleoside analog resistance.

Acknowledgement
This work was supported by grants from the Swedish Cancer Foundation, the Signe and Olof
Wallentin Foundation, Capio's Research Foundation, the Swedish Fund for Research without
Animal Experiments, and the County Council of Östergötland.
Statement of competing interests
None to declare

References
Arner E.S., Eriksson S. Mammalian deoxyribonucleoside kinases. Pharmacol Ther
1995;67:155-186.
Bahnson A.B., Boggs S.S. Addition of serum to electroporated cells enhances survival and
transfection efficiency. Biochem Biophys Res Commun 1990;171:752-757.
Bai L., Yamaguchi M., Tatsumi M., Kon K., Brautigam M. Mechanisms responsible for
resistance of sublines derived from leukemia cell lines to an antitumor agent 9-beta-D-
arabinofuranosyl-2-fluoroadenine. J Cancer Res Clin Oncol 1998;124:367-373.
Bergman A.M., Eijk P.P., Ruiz van Haperen V.W., Smid K., Veerman G., Hubeek I., van den
Ijssel P., Ylstra B., Peters G.J. In vivo induction of resistance to gemcitabine results in
increased expression of ribonucleotide reductase subunit M1 as the major determinant.
Cancer Res 2005;65:9510-9516.
Ferret E., Evrard C., Foucal A., Gervais P. Volume changes of isolated human K562 leukemia
cells induced by electric field pulses. Biotechnol Bioeng 2000;67:520-528.
Fox M., Boyle J.M., Kinsella A.R. Nucleoside salvage and resistance to antimetabolite
anticancer agents. Br J Cancer 1991;64:428-436.
Fyrberg A., Albertioni F., Lotfi K. Cell cycle effect on the activity of deoxynucleoside
analogue metabolising enzymes. Biochem Biophys Res Commun 2007;357:847-853.
Goan Y.G., Zhou B., Hu E., Mi S., Yen Y. Overexpression of ribonucleotide reductase as a
mechanism of resistance to 2,2-difluorodeoxycytidine in the human KB cancer cell line.
Cancer Res 1999;59:4204-4207.
Guittet O., Hakansson P., Voevodskaya N., Fridd S., Graslund A., Arakawa H., Nakamura Y.,
Thelander L. Mammalian p53R2 protein forms an active ribonucleotide reductase in vitro
with the R1 protein, which is expressed both in resting cells in response to DNA damage and
in proliferating cells. J Biol Chem 2001;276:40647-40651.
Irizarry R.A., Hobbs B., Collin F., Beazer-Barclay Y.D., Antonellis K.J., Scherf U., Speed
T.P. Exploration, normalization, and summaries of high density oligonucleotide array probe
level data. Biostatistics 2003;4:249-264.
Lembo D., Gribaudo G., Hofer A., Riera L., Cornaglia M., Mondo A., Angeretti A., Gariglio
M., Thelander L., Landolfo S. Expression of an altered ribonucleotide reductase activity
associated with the replication of murine cytomegalovirus in quiescent fibroblasts. J Virol
2000;74:11557-11565.
Liu Y., Bergan R. Improved intracellular delivery of oligonucleotides by square wave
electroporation. Antisense Nucleic Acid Drug Dev 2001;11:7-14.
Lotfi K., Mansson E., Peterson C., Eriksson S., Albertioni F. Low level of mitochondrial
deoxyguanosine kinase is the dominant factor in acquired resistance to 9-beta-D-
arabinofuranosylguanine cytotoxicity. Biochem Biophys Res Commun 2002;293:1489-1496.
Lotfi K., Mansson E., Spasokoukotskaja T., Pettersson B., Liliemark J., Peterson C., Eriksson
S., Albertioni F. Biochemical pharmacology and resistance to 2-chloro-2'-arabino-fluoro-2'-
deoxyadenosine, a novel analogue of cladribine in human leukemic cells. Clin Cancer Res
1999;5:2438-2444.
Lowry O.H., Rosebrough N.J., Farr A.L., Randall R.J. Protein measurement with the Folin
phenol reagent. J Biol Chem 1951;193:265-275.
Mansson E., Flordal E., Liliemark J., Spasokoukotskaja T., Elford H., Lagercrantz S.,
Eriksson S., Albertioni F. Down-regulation of deoxycytidine kinase in human leukemic cell
lines resistant to cladribine and clofarabine and increased ribonucleotide reductase activity
contributes to fludarabine resistance. Biochem Pharmacol 2003;65:237-247.

Meaking W.S., Edgerton J., Wharton C.W., Meldrum R.A. Electroporation-induced damage
in mammalian cell DNA. Biochim Biophys Acta 1995;1264:357-362.
Meldrum R.A., Meaking W.S., Wharton C.W. The kinetics and mechanism of repair of UV
induced DNA damage in mammalian cells. The use of 'caged' nucleotides and electroporation
to study short time course events in DNA repair. Nucleic Acids Res 1994;22:1234-1241.
Melkonyan H., Sorg C., Klempt M. Electroporation efficiency in mammalian cells is
increased by dimethyl sulfoxide (DMSO). Nucleic Acids Res 1996;24:4356-4357.
Mosmann T. Rapid colorimetric assay for cellular growth and survival: application to
proliferation and cytotoxicity assays. J Immunol Methods 1983;65:55-63.
Nordlund P., Reichard P. Ribonucleotide reductases. Annu Rev Biochem 2006;75:681-706.
Plunkett W., Grindey G.B. Pharmacokinetics of the 5'-triphosphates of arabinosylcytosine and
2',2'-difluorodeoxycytidine in L1210 cells. Nucleic Acids Symp Ser 1987:77-79.
Wang X., Zhenchuk A., Wiman K.G., Albertioni F. Regulation of p53R2 and its role as
potential target for cancer therapy. Cancer Lett 2009;276:1-7.
Verma N.K., Dey C.S. RNA-mediated gene silencing: mechanisms and its therapeutic
applications. J Clin Pharm Ther 2004;29:395-404.
Xie K.C., Plunkett W. Deoxynucleotide pool depletion and sustained inhibition of
ribonucleotide reductase and DNA synthesis after treatment of human lymphoblastoid cells
with 2-chloro-9-(2-deoxy-2-fluoro-beta-D-arabinofuranosyl) adenine. Cancer Res
1996;56:3030-3037.
Yu Z.W., Quinn P.J. Dimethyl sulphoxide: a review of its applications in cell biology. Biosci
Rep 1994;14:259-281.
Zhu C., Johansson M., Karlsson A. Differential incorporation of 1-beta-D-
arabinofuranosylcytosine and 9-beta-D-arabinofuranosylguanine into nuclear and
mitochondrial DNA. FEBS Lett 2000;474:129-132.
Tables
Expression Activity Viability
Voltage-time ED SW
ED SW
300V-10ms* 87 80
~60 ~60
340V-10ms 75 60
~60 ~60
360V-10ms 80 74
~60 ~60
400V-10ms 75 70
~60 ~60
440V-10ms 80 85
~50 ~50
SW, 340V, siRNA #68 250 nM*
Voltage-time 1 pulse 2 pulses
5ms 1/2 pulse(s) 65 60
~60
10ms 1/2 pulse(s) 60 50
~60
15ms 1/2 pulse(s) 60 60
~60
SW, 340V, 10 ms2,
siRNA #68 250 nM*
4 degrees 52
~60
room temperature** 50
~60
0.4 ml** 48
~60
0.8 ml 54
~60
1 mil/ml 50
~60
4 mil/ml** 45
~60
8 mil/ml 67
~60
340V 10ms2
125nM (#68-#69-#70) 82-67-77
~60
250nM (#68, #69, #70) fig. 1A fig. 1A ~60
500nM (#68-#69-#70) 50-42-23
~60
340V 10ms2 250nM #70
PBS 27 42 ~60
RPMI-1640** 24 38 ~60
PEST 39 49 ~60
-PEST 28 41 ~60
+FCS p.e +DMSO 27 25 ~90
-FCS p.e -DMSO 32 40 ~65
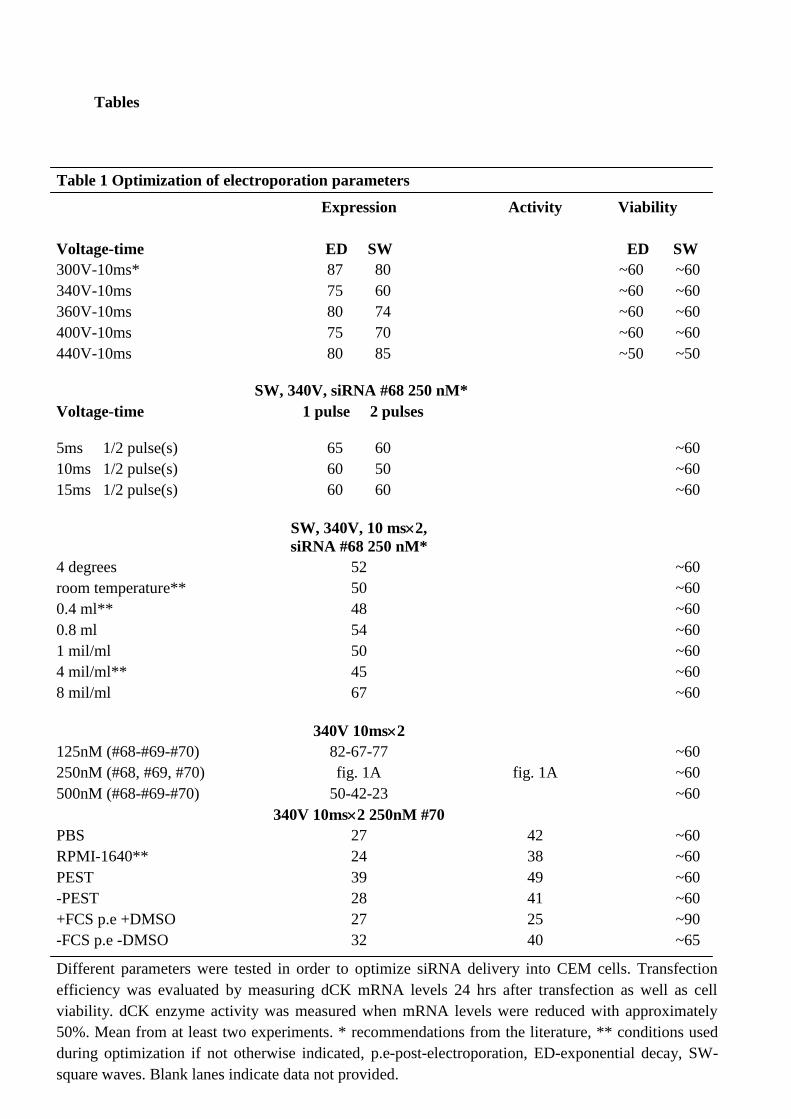
Table 1 Optimization of electroporation parameters
Different parameters were tested in order to optimize siRNA delivery into CEM cells. Transfection
efficiency was evaluated by measuring dCK mRNA levels 24 hrs after transfection as well as cell
viability. dCK enzyme activity was measured when mRNA levels were reduced with approximately
50%. Mean from at least two experiments. * recommendations from the literature, ** conditions used
during optimization if not otherwise indicated, p.e-post-electroporation, ED-exponential decay, SW-
square waves. Blank lanes indicate data not provided.
dCK F:5´-CCACCCCGCCCAAGA-3´
R: 5´-CCTCCCTGCAGCGATGTTC-3´
P:5´-6-FAM-CTTTC^CAGCCAGCTCTGAGGGGACCTT -3´
β2-
micro- F:5´-AGGACTGGTCTTTCTATCTCTTGTACTA AC-3´
globulin R-5´-AAGTCACATGGTTCACACGCG-3´
P-5´-VIC-TCACCCCCACTGAAAAAGATGAGTATGCCT-3´-
TAMRA.
dGK Hs00365632_m1
TK2 Hs00936915_m1
hENT1 Hs01085709_g1
GAPDH Hs00266705_g1
Table 2 Primers, probes and TaqMan 20X assays
Primers, probes, and 20X assays used to measure gene expression using real-time PCR.
^ denotes dark quencher in the dCK probe.

genbank fc regulation genesymbol genedescription
CEM vs electroporated 4-fold
AF097514 5.3 up SCD stearoyl-CoA desaturase (delta-9-desaturase)
AF002697 5.5 up BNIP3 BCL2/adenovirus E1B 19kDa interacting protein 3
AF108658 4.8 up FADS2 fatty acid desaturase 2
AB209607 7.8 up SLC2A3
solute carrier family 2 (facilitated glucose
transporter)
BC003613 15.5 up ALDOC aldolase C. fructose-bisphosphate
AF426269 4.3 up C21orf90 chromosome 21 open reading frame 90
AK125918 4.9 up GBE1 glycogen branching enzyme
BC107879 4.6 up SC4MOL sterol-C4-methyl oxidase-like
BC083514 6.0 up HMGCS1
3-hydroxy-3-methylglutaryl-Coenzyme A synthase
1
BC001880 7.0 up INSIG1 insulin induced gene 1
electroporated vs neg. control 2-fold
NC_001807 2.1 down
mitochondrion complete genome
negative control vs dCK 1.7-fold
BC103764 1.7 down DCK deoxycytidine kinase
AF495523 1.8 up REXO1L1 REX1. RNA exonuclease 1 homolog
BC130374 1.7 up GAGE13 G antigen 13
Table 3 Whole-genome microarray data on electroporated cells
Danorubicine 1.5 ± 0.7
Nelarabine 0.9 ± 0.6
Fludarabine 1.1 ± 0.6
Cladribine 3.3 ± 1.8
Cytarabine 4.8 ± 1.8
Clofarabine 6.0 ± 3.0
A whole-genome microarray was performed on RNA from untreated CEM cells, electroporated cells, and
cells transfected with negative control siRNA or dCK siRNA transfected cells (dCK) 48 hrs after
electroporation/transfection. The table shows the most differentially expressed genes at different
thresholds. Fc-fold-change
Table 4 Cytotoxicity data in
siRNA transfected cells
Cytotoxicity to different drugs was
evaluated after dCK
downregulation using the MTT
assay. Data expressed as a
resistance factor compared to cells
transfected with negative control
siRNA. Resistance factor: IC50-
value in cells transfected with dCK
siRNA/IC50-value of cells
transfected with negative control
siRNA.