optimization in online content recommendation … · optimization in online content recommendation...
TRANSCRIPT
Optimization in Online Content Recommendation Services:
Beyond Click-Through Rates
Omar Besbes
Columbia University
Yonatan Gur
Stanford University
Assaf Zeevi
Columbia University
first version: February 28, 2014, last revised: April 7, 2015
Abstract
A new class of online services allows internet media sites to direct users from articles they are
currently reading to other content they may be interested in. This process creates a “browsing path”
along which there is potential for repeated interaction between the user and the provider, giving rise
to a dynamic optimization problem. A key metric that often underlies this recommendation process
is the click-through rate (CTR) of candidate articles. While CTR is a measure of instantaneous
click likelihood, we analyze the performance improvement that one may achieve by some lookahead
that accounts for the potential future path of users. To that end, by using some data of user path
history at major media sites, we introduce and derive a representation of content along two key
dimensions: clickability, the likelihood to click to an article when it is recommended; and engage-
ability, the likelihood to click from an article when it hosts a recommendation. We then propose a
class of heuristics that leverage both clickability and engageability, and provide theoretical support
for favoring such path-focused heuristics over myopic heuristics that focus only on clickability (no
lookahead). We conduct a live pilot experiment that measures the performance of a practical proxy
of our proposed class, when integrated into the operating system of a worldwide leading provider of
content recommendations, allowing us to estimate the aggregate improvement in clicks-per-visit rel-
ative to the CTR-driven current practice. The documented improvement highlights the importance
and the practicality of efficiently incorporating the future path of users in real time.
Keywords: online services, dynamic assortment selection, data-driven optimization, recommenda-
tion systems, content marketing, digital marketing, path data.
1 Introduction
1.1 Background and motivation
Diversity and sheer number of content sites on the world wide web has been increasing at an extraor-
dinary rate. One of the great technological challenges, and a major achievement of search portals, is
the ability to successfully navigate users through this complex forest of information to their desired
content. However, search is just one route for users to seek content, and one that is mostly effective
when users have a fairly good idea of what they are searching for. Recent years have witnessed the
1

emergence of dynamically customized content recommendations, a new class of online services that com-
plement search by allowing media sites to direct users from articles they are currently reading to other
web-based content they may be interested in consuming. This paper focuses on performance assessment
and optimization for this new class of services.
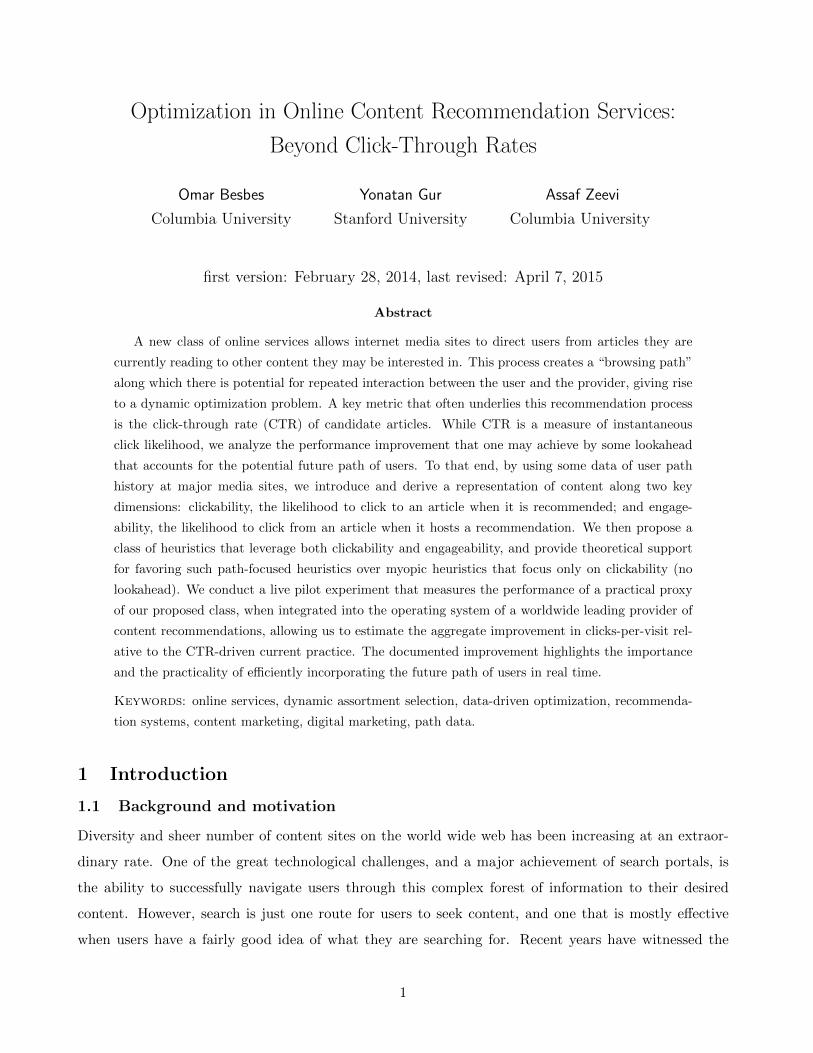
Brief overview of the service. When a reader arrives to an online article (for example, by clicking
a link placed at the publisher’s front page), a customized recommendation is generated at the bottom
of the article (Figure 1 depicts such an example). The recommendation typically contains 3 to 12 links
Figure 1: Online content recommendation. (Left) The position of the recommendation, at the bottom of aCNN article. (Right) The enlarged recommendation, containing links to recommended articles. The right side ofthis recommendation contains internal links to other articles on CNN’s website, or CNN owned blogs. The leftside of the recommendations contains external (sponsored) links to articles from other media sites.
that point readers to recommended articles, typically specifying the titles of these articles. By clicking
on one of these links the reader is sent to the recommended article, at the bottom of which a new
recommendation is often provided. In most cases these recommendations are generated by a service
provider (not the media site). Recommended articles may be internal (organic), leading readers to
other articles published in the host media site, or external (sponsored), in general leading readers to
other publishers. While internal recommendations are typically given as a service to the host publisher,
external links are sponsored (either by the site on the receiving end of the recommendation, or by
a third party that promotes the content) based on a fee-per-click, which is split between the service
provider and the publisher that hosts the recommendation. This simple revenue sharing business model
is predicated on the service’s success in matching users with customized content that is relevant for them
at the time of their visit. The problem of dynamically matching users and content lies at the heart of
both the service provider’s and online publishers’ revenue maximization problems, and determines the
value of the service to the publishers and their readers.
2
At a high level, the process of matching a reader with a bundle of recommended articles takes the
following form. When a reader arrives to an article, a request for a recommendation is sent by the host
publisher to the service provider. Such a request may include information on the host article as well as
the reader. The service provider also holds a database of feasible articles, including information such
as the topic classification, the publish date, or the click history. The available information is processed
by several competing and complementary algorithms that analyze different aspects of it: the contextual
connection between the host article and the candidates for recommendation; the reading behavior and
patterns associated with articles and readers; and additional information such as general traffic trends
in the content network. These inputs are combined to generate a customized content recommendation.
Various characteristics distinguish this process from more traditional product recommendation ser-
vices (such as Amazon or Netflix). These features include the rate at which new “products” (articles)
are added to the system (millions of articles added daily), and the typical short shelf life of many ar-
ticles, which often lose relevancy in a matter of hours/days after publication. Moreover, the content
recommendation service is mostly not subscription-based, which limits the quality of the information
that can be gathered on readers. Together, these introduce practical challenges that go beyond the
traditional product recommendation problem (e.g., the need to base recommendations on dynamic and
limited information on users’ preferences and available products).
Main questions. A key feature defining the content recommendation service is that it stimulates
ongoing user engagement in each interaction. While many online services are terminated after a single
click, the content recommendation service is dynamic, as each successful recommendation leads to a new
opportunity for interaction: following the first click, the user arrives to a new article, at the bottom of
which a new recommendation is generated, and so on. Thus, content recommendations often serve as a
navigation tool for readers, inducing a chain of articles. In such an environment, a central question is how
to measure (and optimize) the performance of the recommendation service? This fundamental question
is followed by practical ones: when constructing recommendations, what is the value of considering the
potential future path of a reader as opposed to accounting only for her current position in the content
network? How can one efficiently account for path factors in real time, while noting the computational
and information availability limitations of the recommendation system?
1.2 Main contributions
A key performance indicator that is widely used in practice to evaluate various articles as candidates for
recommendation is the click-through rate (CTR): the number of times a link to an article was clicked,
divided by the number of times that link was shown. The CTR metric is commonly adopted by online
3
services that aim to generate a single click per user. In such a context, the focus is typically on in-
tegrating the click probability with the potential revenue generated by a click (see Jansen and Mullen
(2008) and Feng et al. (2007) for an overview). Following this common approach, content recommenda-
tion algorithms used in current practice are primarily designed to maximize the instantaneous CTR (or
alternatively, the instantaneous revenue) of the generated recommendation. While high CTR signals
that the service is frequently being used, CTR also has an important limitation in the context of the
dynamic service at hand: it measures the probability to click at the current step, but does not account
for interactions that may come after the click, and in particular, future clicks along the potential visit
path of the reader. The present paper aims to challenge this practice by demonstrating theoretically and
practically, i.) the value to be captured by accounting for the future path of users; and ii.) a relatively
simple and practical approach for doing so. The study is based on a large data set of user path history
at a few major media sites, as well as data from a live experiment. The present paper makes three main
contributions: we model and demonstrate the value of a new dimension of content through predictive
analytics; we develop heuristics to optimize dynamic recommendations based on this new dimension;
we validate the value of these heuristics theoretically, through simulation, and also through a live ex-
periment at a leading content recommendation provider. We next discuss each of these contributions
in more detail.
From a diagnostic to the notion of engageability. We first highlight the importance of account-
ing for the future path of users. Considering the path readers took through internal recommendations
in our data set, we observe that between 15% and 30% of users’ clicks on recommendations were
generated after the first click, and that articles differ in how much they induce clicks when hosting
recommendations. We then introduce and estimate a choice model, capturing key characteristics of
the reader-recommendation interaction that impact click behavior. We calibrate this model based on a
large data set, in a manner that accounts for the evolution of articles’ relevancy over time. Based on our
model, we develop a representation of content along two key dimensions: (1) clickability, the likelihood
to click to an article when it is recommended; and (2) engageability, the likelihood to click from an
article when it hosts a recommendation; the full meaning of this terminology will become apparent in
what follows.
Our suggested representation of the “space of articles” is compact, but captures a key new dimension
(engageability) and therefore significantly enriches the one adopted by current practice (which, as we
explain later, may be interpreted as focusing mainly on clickability). This new space quantifies both
the likelihood to click on each article, and the likelihood to continue using the service in the next step,
if this article is indeed clicked and becomes the host of a recommendation.
4
From engageability to path-focused optimization. We formulate the optimal content rec-
ommendation problem and show that it is NP-hard in general, and practically intractable. We then
formalize a myopic heuristic whose objective is to maximize the probability to click on the current
recommendation, and establish that the gap between the performance of optimal recommendations
and that of the myopic heuristic may be arbitrarily large. In that sense, theoretically, myopic rec-
ommendations may perform poorly. To close this performance gap, and based on the aforementioned
content representation, we propose a path-focused heuristic that considers both the clickability and the
engageability of candidate articles.
Validating the proposed heuristic. We demonstrate through theoretical lower bounds and sim-
ulation results that this heuristic yields performance that is close to the one of the optimal recommen-
dations (which are computationally intractable for large instances). Armed with this backing, we move
to test the proposed heuristics in the system operated by Outbrain, our industry collaborator and a
worldwide leading provider of content recommendations. The challenge in testing our ideas is two-fold:
i.) the information available to process in real-time is limited; and ii.) one needs to isolate the impact
of our proposed ideas and heuristics relative to the ones adopted by current practice.
To address the first challenge, we study an “adjusted-myopic” implementation of one-step look-ahead
recommendation policies, using proxies that are observed in real time throughout the recommendation
process, without increasing the computational complexity of existing practice. To address the second
challenge, we ensure that we do not simply add another algorithm to the list of existing algorithms
used by the operator, as in such a case it would be impossible to fully isolate the impact. Rather, from
the existing algorithms, all of which aim at maximizing CTR, we select one class of algorithms that do
so by estimating the CTR of candidate articles based on click observations. This class is considered
successful, and is responsible for generating roughly one third of the links that are recommended in each
assortment. We then design and implement a controlled experiment where we modify this class on a
test group in a manner that isolates the effect of accounting for the future path of readers through an
observable proxy of the engageability parameter. The experiment measures the impact of said change
on the performance of that class, finding an aggregate increase of 9.86 percent in clicks-per-visit. The
improvement was statistically significant at the aggregate level even though the improvement measured
at a more disaggregate level is not always statistically significant, due to a small sample effect. The
results of the experiment imply that there is value to be captured by efficiently accounting for the future
path of users in real time. Moreover, capturing such value does not necessarily require the development
of new methods or technologies; it can be done by adjusting existing policies that have been designed
to maximize myopic objectives.
5
1.3 Relation to literature
Aspects of our study relate to literature streams in operations, information systems, and marketing.
Assortment planning. At a technical level, the service provider aims to dynamically select a list
of recommended links from a broader set of available candidates. Thus, while our main focus is on
practical aspects of this problem, our formulation has some similarities to the assortment planning
problem studied in the operations management literature under various settings and demand models
(for a comprehensive review see Kok et al. 2009). When assortment selection is dynamic and demand
is unknown, Caro and Gallien (2007) have studied the tradeoff between exploration and exploitation;
see also Rusmevichientong et al. (2010), Alptekinoglu et al. (2012), and Saure and Zeevi (2013). A
paper that studies dynamic assortment selection in an environment that is closer to the one of content
recommendations is that of Caro et al. (2014). In their formulation the attractiveness of products
decays over time once they are introduced in the assortment, and products can be introduced only
once. Yet, our formulation is quite different from theirs; a key distinction is that in Caro et al. (2014)
one needs to decide in advance the timing at which each product is introduced in the assortment,
while in the current study decisions depend on the realized path of the reader. In addition, in our
formulation relevant features of articles change independently of the decision sequence, and articles can
be recommended many times.
Performance in online services. The current paper also relates to studies that focus on perfor-
mance metrics and heuristics in online services; see, e.g., Kumar et al. (2006), Mehta et al. (2007),
Ghose and Yang (2009), and Araman and Fridgeirsdottir (2011) for methodological as well as empirical
approaches in the context of online advertising. The main distinction of the current study from this
line of work lies in the dynamic nature that governs the service at hand, and thus, calls for performance
metrics (and appropriate heuristics) that account for the future path of users.
Path data. Our study also relates to papers that study operational challenges and benefits of using
path data to model and analyze consumers’ behavior in retail, e-commerce, and advertising; for an
overview cf. Hui et al. (2009). In the context of online marketing and retail, which is the closest to ours,
various papers study the use of large data sets to better model and predict user decisions. While using
such data typically involves methodological and technical challenges (see, e.g., Bucklin et al. 2002),
it may lead to concrete benefits. For example, Bucklin and Sismeiro (2003) use information on the
browsing path of internet users to calibrate a model of click behavior, and Montgomery et al. (2004)
demonstrate that path data can lead to a more accurate prediction of purchase decisions in an online
bookseller; for an overview cf. a survey by Bucklin and Sismeiro (2009). Our study differs from that line
of work in three main aspects. First, while these papers typically study the consideration of path data to
6

maximize instantaneous objectives (such as the probability that a consumer will buy a suggested book),
the current paper studies the use of data to maximize a path objective (the number of clicks along the
visit of a reader). Second, contrasting with the focus of the above literature stream on the past path
of users for optimization purposes, the present paper accounts for the potential future path of users.
Finally, compared to the above line of work the current paper also pursues performance optimization
while considering the information stream and computational limitations of existing practice. This allows
us to go beyond explanatory or predictive analysis, and to validate the proposed approach through a
live experiment that measures added value captured in practice.
Recommender systems. An active stream of literature has been studying recommender systems,
focusing on tactical aspects that concern modeling and maintaining connections between users and
products, as well as implementing practical algorithms based on these considerations; see the book by
Ricci et al. (2011) and the survey by Adomavicius and Tuzhilin (2005) for an overview. A typical
perspective that is taken in this rich line of work is that of the consumer, focusing on an objective
of maximizing the probability to click on a recommendation. Common approaches that are used for
this purpose are nearest neighbor methods, relevance feedback methods, probabilistic (non-parametric
or Bayesian) learning methods, and linear classification methods; for an overview of such so-called
content-based methods see Pazzani and Billsus (2007). Another common class of algorithms focuses on
collaborative filtering; see the survey by Su and Khoshgoftaar (2009) and references therein, as well as
the industry report by Linden et al. (2003) on Amazon’s item-based collaborative filtering approach.
The current paper does not focus on these tactical questions, but rather on the higher level principles
that guide the design of such algorithms when one aims to account for the future path of a user. By
doing so, to the best of our knowledge the current paper is the first to focus on the perspective of the
recommender system (the service provider) in a context of a multi-step service in which the system’s
objective is not necessarily aligned with that of the consumer.
User engagement. The notion of engageability is concretely defined in this paper as an element
of a choice model, capturing the impact an article may have on the likelihood of readers to click on
recommendations that originate from it. It is worthwhile to identify early on the difference between
engageability, as it is defined here, and user engagement, a common notion that has been (potentially
ambiguously) mentioned in the media as well as in several academic studies. These studies define user
engagement rather loosely and in various manners (on the internet as well as in other contexts) and
study the way it relates to several measurable factors. Among others, these factors include the format of
the media (see, e.g., Webster and Ahuja 2006), and interactivity (see, e.g., Haywood and Cairns 2006);
see also O’Brien and Toms (2008) and O’Reilly (2009) for an overview, as well as Lee et al. (2014)
7

and references therein for more recent work in the context of social media. Based on such elements
there have been a few attempts to define and measure user engagement; see, e.g., O’Brien and Toms
(2010). Nevertheless, we are not aware of any study directly connecting some form of user engagement to
performance metrics that account for the future path of users. Establishing potential relations between
aspects of user engagement and a performance-related quantity such as engageability (as it is defined
in the current paper), is indeed a natural avenue for future research.
Structure of the paper. In §2 we introduce the notion of engageability, validate it based on
a rich data set, and construct a compact representation of articles. In §3 we formulate the content
recommendation problem, highlight computational challenges, and suggest a path-focused heuristic
based on the aforementioned representation. §4 suggests an efficient implementation of path-focused
recommendations, and studies its impact relative to current practice in a controlled experiment. §5
includes some concluding remarks. Proofs and other auxiliary material appear in an online companion.
2 Introducing and validating the notion of engageability
2.1 Preliminaries
Available (and unavailable) data. Our database includes access to over 5 billion internal recommen-
dations that were shown on various media sites (all generated by Outbrain), including some anonymous
information about articles, readers, recommendations, and observed click/no-click feedback. Every ar-
ticle that was visited or recommended in the database has a unique id. Using this id, one may trace the
publish date of the article, and its main topic (which is classified into 84 topic categories; representative
ones include “news: politics,” “sports: tennis,” and “entertainment: celebrities”). Each event in which
a reader arrives to an article is documented by a unique recommendation id, reader id, and the id of the
article that hosts the recommendation (at its bottom). Using the recommendation id, one may trace:
• the id list of articles consisting of the internal recommendation (ordered by position),
• the time at which the recommendation was created,
• the time that was spent by the reader on the host article before leaving it (for some media sites),
• the recommendation id that the reader clicked on to arrive to the current page (if the reader
arrived by clicking on an internal recommendation).
Our data set does not include information about additional article features such as the number of
paragraphs, appearance of figures/pictures, or links presented in the text. The data set neither includes
the sponsored links that were shown, or clicks on them. In addition, we note that due to technical reasons
8
(for example, this recommendation service is not subscription-based), information on the preferences of
readers is typically of limited detail and reliability, and is not included in our data set.
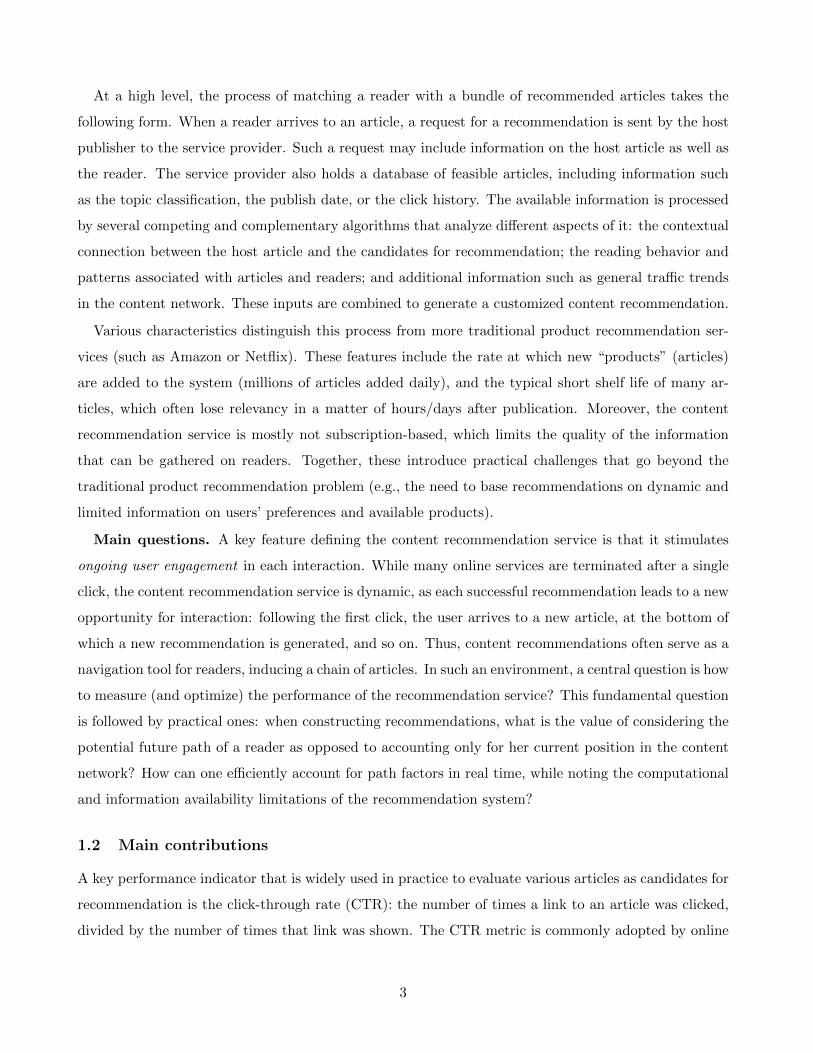
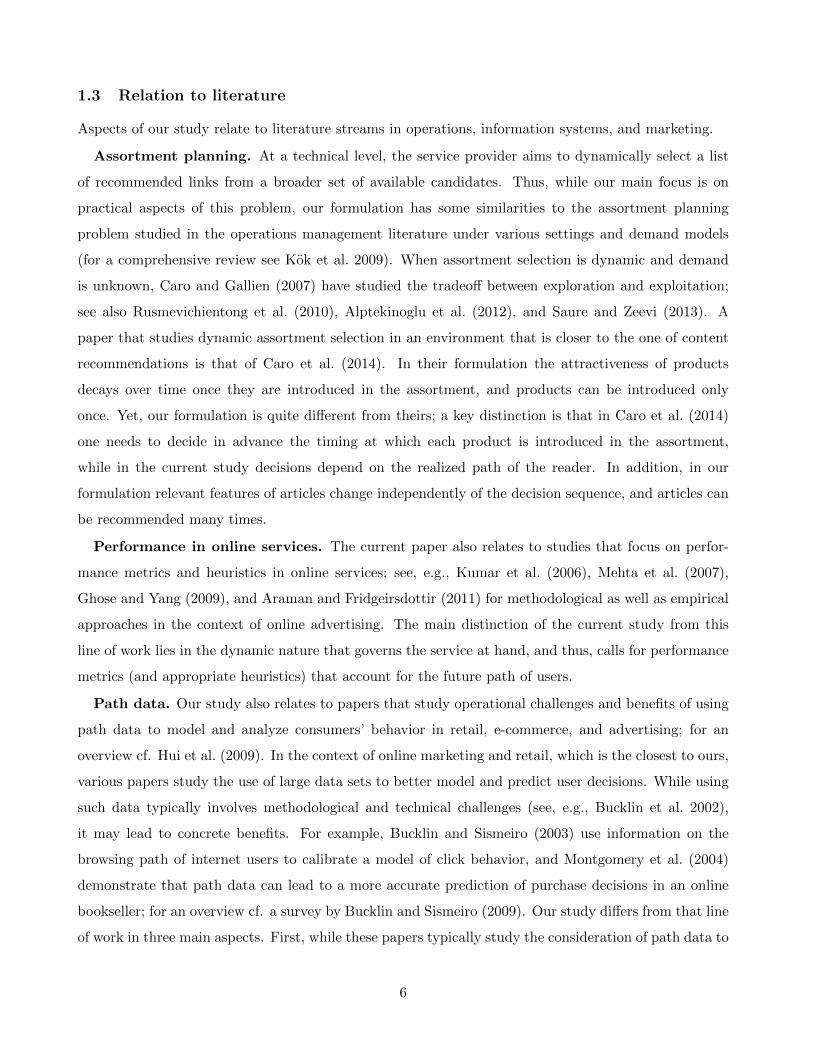
Preliminary empirical insights: click distribution and host effect. We construct the visit
paths of readers from an arrival to some host article through a sequence of clicks (if such clicks take
place) on internal links. The distribution of clicks along visit steps in two representative media sites
is shown on the left part of Figure 2. We observe that a significant portion of the service is provided
0
20
40
60
80
100
1 2 3 4 5
Step of visit (or more)
Clicks distribution along the path
Publisher B Publisher A
30
25
20
15
10
5
0
Likelihood to continue to step 2
Publisher A
Probability of a 2nd click, conditional on a 1st one (%)
0-2 2-4 4-6 6-8 8-10 10-12 12-14 14-16
% of articles among those clicked
at the 1st step
% of clicks
Click-to probability of 0.78 percent
Figure 2: Aggregate analysis of clicks along the visit path. (Left) The distribution of clicks along visitsteps in two representative media sites (A and B). (Right) The distribution of the probability to click again amongarticles to which readers arrived after their first click (in media site A).
along the visit path: between 15% and 30% of clicks were generated after the first click; this range is
representative of other publishers as well. The portion of clicks along the path is significant even though
the future path is not taken into account by the first recommendation; one can only expect this portion
of the business volume to grow if recommendations account for the future path of readers.
Next, we focus on the set of all the links that were clicked on in the first step, and more precisely,
the articles these links lead to. In the right part of Figure 2, for all these articles, we construct a
histogram based on the probability of a second click (conditional on the first click); the x-axis has
bins of conditional probabilities and the y-axis represents the frequency (% of all the articles that were
clicked on in the first step) of such occurrences. For example, roughly 28% of articles clicked on in the
first step are characterized by a conditional “click-from” likelihood between 8% and 10%, and only 7%
of such articles are characterized by a conditional “click-from” likelihood between 12% and 14%. We
observe significant variation in this conditional probability in the space of articles. This points out that
the link that is selected by a reader at the first step clearly affects clicks generated along the future
path of the reader. Moreover, we note that the average CTR to articles along different bins may be
similar; for example, the mean probability to click to articles at both the third and the fifth bins is
∼ 0.78 percent.
9
As mentioned in §1, the key performance indicator that is commonly used in practice to evaluate each
article as a candidate for recommendation is its estimated CTR, namely, the probability that a link that
leads to it will be clicked, if recommended by the service provider. As the CTR does not account for
future clicks along the potential visit path of the reader, the observations above imply that CTR-driven
recommendations might be “leaving clicks on the table.” Intuitively, while content recommendations aim
to match readers with attractive links, the host article describes the environment in which the matching
takes place, and therefore potentially affects the click behavior. These observations lead to the following
questions. First, are readers indeed more likely to continue the service after visiting certain articles?
Second, if so, to what extent can one identify such articles in real time and adjust the CTR indicator
accordingly, in a manner that is compatible with the practical limitations of the service? Third, how
much additional value can be captured in this manner?
In §2.2 we introduce the notion of engageability as an element of a choice model; engageability
quantitatively captures the impact of the host article on the click behavior of readers. Our model leads
to a compact representation of articles in a content space, which is introduced and discussed in §2.3.
We validate that engageability is a significant click driver in §2.4, through out-of-sample testing.
2.2 Choice model
As the recommendation service aims to suggest attractive links, a key element on which recommendation
algorithms focus is the id of recommended articles. Other considerable elements include the position of
links within recommended assortments, the topics of candidate articles, and the level of familiarity the
reader has with the service. Our model accounts for these elements, as well as the id of the article that
hosts the recommendation, an element that has been overlooked so far.
As discussed in §2.1, our data set does not include access to some of the factors that may affect the
likelihood to click on internal recommendations. Taking this limitation in mind, the purpose of our
model will not be to entirely quantify the environment in which readers of media sites make clicking
decisions, but rather to demonstrate that the host article significantly affects such decisions, while
accounting for other reasonable click drivers that are considered in practice. In particular, the model
is selected while keeping in mind important practical considerations. First, we aim at a parsimonious
model to avoid overfitting. Second, as the relevancy of content changes over time, we will need to refresh
estimates of key parameters. Finally, later on (in §4) we will aim at implementing practical algorithms
that are based on this model (in particular, these will account for the host effect in addition to the
link effect) via proxies that are observable in real time, to measure in a controlled experiment the value
captured by accounting for the host effect (relative to current practice where it is not considered).
10

We consider a multinomial logit model to capture the impact of the following elements on clicking
behavior. (These elements will be discussed after the model is set.) The dummy variable βx captures
the effect of a host article x. The dummy variable γy captures the effect of a recommended article
y. The variable µx,y captures the interaction effect of (x, y). The variable θu captures the effect of
user familiarity with the recommendation service. Given an article y that appears in a recommended
assortment A, we denote the position of article y in the assortment by p : (y,A) → {0, . . . , 5}, 0 being
the highest position. Then, the variable λp(y,A) captures the effect of the position of y in A.
Given a reader type u ∈ U , a recommended assortment A, and a host article x, we denote the
probability to click on a link to article y by Pu,x,y(A), and define:
Pu,x,y(A) =
φu,x,y(A)
1+∑
y′∈A φu,x,y′ (A) if y appears in A
0 otherwise.(1)
Whenever y appears in A, we define:
φu,x,y(A) = exp{α+ βx + γy + µx,y + θu + λp(y,A)
}. (2)
Engageability (host effect) and clickability (link effect). The parameter β is associated with
the likelihood to click from an article whenever it hosts a recommendation, and is driven by the actual
content of the article. We refer to β as the engageability of an article. Under our model, the engageability
of an article may account for two potentially different effects. The first one is “homogeneous” with
respect to all recommended links that may be placed at its bottom. The intuition underlying this
parameter is that when an article is well-written, interesting, relevant, and of reasonable length, the
reader is more likely to read through it, arrive to its bottom, and click on a recommendation. On the
other hand, when content is poor or irrelevant, a reader is more likely to terminate the service rather
than scrolling down through the article, and therefore she is less likely to see the recommendation
and click on it. Engageability of an article may also capture in an aggregate fashion an effect that is
“heterogeneous” with respect to different links.1 The engageability of an article may change with time,
along with its drivers, which may include the relevancy of its content.
The parameter γ is associated with the likelihood to click to an article whenever it is recommended,
and is driven by the title of the article (which is typically the only information given on the link itself).
We refer to γ as the clickability of an article. The clickability of articles may change with time as well.
1Theoretically, such connections between articles may potentially be separated from the first, “homogeneous” engage-ability effect, by using a more complex description of contextual relation between articles/topics (an example of such adescription is given in Appendix A.2). In this study we do not aim to separate between “homogenous” and “heterogeneous”effects, but rather focus on the value of accounting for the future path of users through the engageability parameter.
11
Control parameters. The parameter θu is a dummy variable that captures the effect of the user
type, and in particular, of experienced users. We differentiate between two types of users: experienced
users (that have clicked on an Outbrain recommendation before) and inexperienced users. Thus, we
have θu ∈ {θexp, θinexp} for each user, where we normalize by setting θinexp = 0 (treating unexperienced
users as a benchmark) and estimate θexp from the data. Experienced readers were defined as ones that
clicked on a recommendation during an initial period of 10 days. Then, during the 30 days over which
the model was estimated we update reader types from “inexperienced” to “experienced” once they
click on an internal recommendation. The main motivation for distinguishing between experienced and
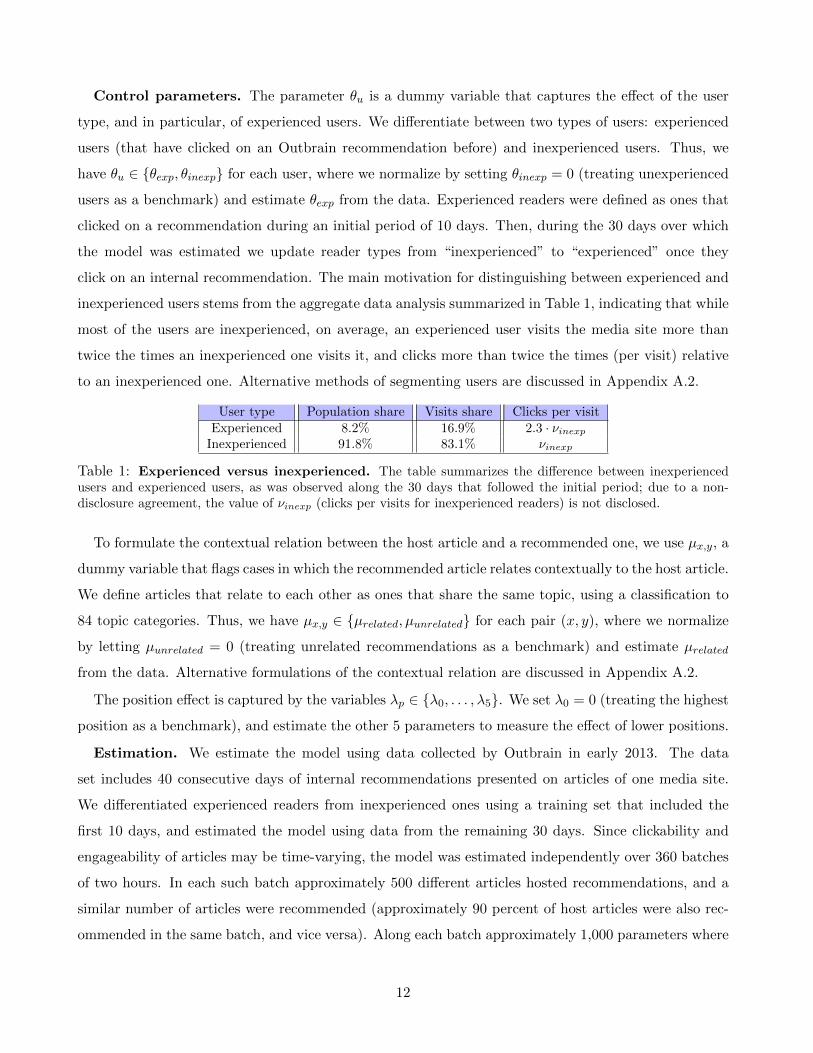
inexperienced users stems from the aggregate data analysis summarized in Table 1, indicating that while
most of the users are inexperienced, on average, an experienced user visits the media site more than
twice the times an inexperienced one visits it, and clicks more than twice the times (per visit) relative
to an inexperienced one. Alternative methods of segmenting users are discussed in Appendix A.2.
User type Population share Visits share Clicks per visitExperienced 8.2% 16.9% 2.3 · νinexp
Inexperienced 91.8% 83.1% νinexp
Table 1: Experienced versus inexperienced. The table summarizes the difference between inexperiencedusers and experienced users, as was observed along the 30 days that followed the initial period; due to a non-disclosure agreement, the value of νinexp (clicks per visits for inexperienced readers) is not disclosed.
To formulate the contextual relation between the host article and a recommended one, we use µx,y, a
dummy variable that flags cases in which the recommended article relates contextually to the host article.
We define articles that relate to each other as ones that share the same topic, using a classification to
84 topic categories. Thus, we have µx,y ∈ {µrelated, µunrelated} for each pair (x, y), where we normalize
by letting µunrelated = 0 (treating unrelated recommendations as a benchmark) and estimate µrelated
from the data. Alternative formulations of the contextual relation are discussed in Appendix A.2.
The position effect is captured by the variables λp ∈ {λ0, . . . , λ5}. We set λ0 = 0 (treating the highest
position as a benchmark), and estimate the other 5 parameters to measure the effect of lower positions.
Estimation. We estimate the model using data collected by Outbrain in early 2013. The data
set includes 40 consecutive days of internal recommendations presented on articles of one media site.
We differentiated experienced readers from inexperienced ones using a training set that included the
first 10 days, and estimated the model using data from the remaining 30 days. Since clickability and
engageability of articles may be time-varying, the model was estimated independently over 360 batches
of two hours. In each such batch approximately 500 different articles hosted recommendations, and a
similar number of articles were recommended (approximately 90 percent of host articles were also rec-
ommended in the same batch, and vice versa). Along each batch approximately 1,000 parameters where
12

estimated (including the control parameters). Estimation in each batch was based on approximately 2M
recommendations (of 6 links each) and 100,000 clicks. The model was estimated by applying a Newton
step method to maximize the log-likelihood of the model. The estimation results in all 360 estimation
batches were very similar in their statistical patterns. Scaled values of the control parameters’ estimates
from the first estimation batch are presented in Table 2.
Effect Parameter Estimate Standard errorIntercept α −1 8.8 · 10−7
User θexp 0.254 3.82 · 10−4
Contextual relation µrelated −2.25 · 10−2 4.49 · 10−3
Position
λ1 −0.247 1.10 · 10−4
λ2 −0.384 3.15 · 10−6
λ3 −0.456 4.27 · 10−6
λ4 −0.512 4.72 · 10−6
λ5 −0.515 4.72 · 10−6
Table 2: Estimation of control parameters: scaled results. The shifted control parameters’ estimates andstandard errors for one media site, in the first estimation batch; due to a non-disclosure agreement, all the valuesshown in the table were obtained by dividing original estimates and standard errors by the absolute value of α.All estimates are at significance level p < 0.01.
The estimate of θexp quantifies the effect of user experience on the likelihood to click. It supports
the statistics presented in Table 1: users that are familiar with the recommendation service tend to use
it more often than inexperienced users. The estimate of µrelated quantifies the effect of the contextual
relation between the host and recommended articles. Interestingly, it suggests that on average, users
tend to click less when the recommended article directly relates to the article they just finished reading,
relative to cases in which such direct relation does not exist. The estimates of λ1, . . . , λ5 quantify the
“cost of a lower position” in the recommendation box, relative to the highest position. As one would
expect, the lower the position of the link is, the lower the likelihood of a reader to click on that link.
Next, we discuss in more detail the estimates of the engageability (β) and clickability (γ) parameters.
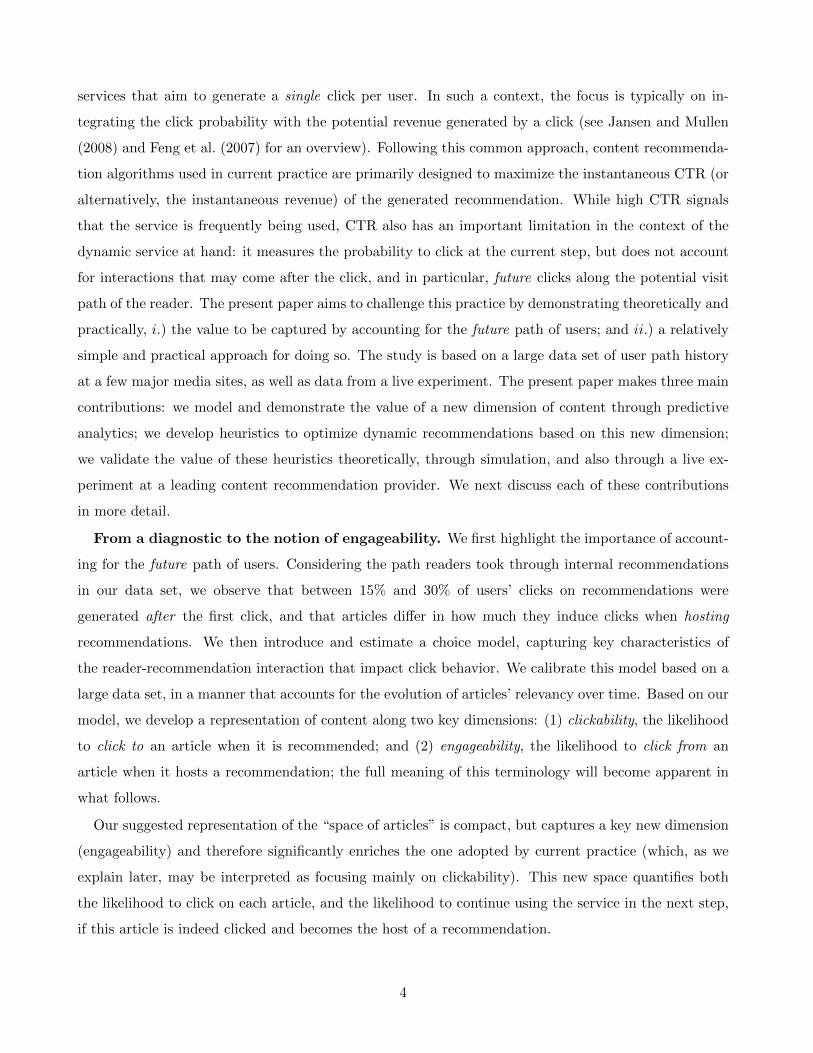
2.3 Content representation
To summarize the estimates of the clickability and engageability parameters, one may visualize the space
of articles using a scatter plot of all articles (identified by their id and the time window) along β and γ.
The resulting plot is depicted in Figure 3. The plot leads to a representation of the articles available
in a “content space” with two dimensions that have a “physical” meaning when examining articles as
candidates for recommendation: it captures not only the likelihood to click on an article when it is
recommended, but also the likelihood of readers to continue using the service if this article is indeed
clicked, and thus hosts the recommendation in the following step. Figure 3 implies that engageability
and clickability (and intuitively, the attractiveness of the title, and the actual content) are fundamentally
13

β
γ
(Engageability)
(Clickability)
Figure 3: Articles in the content space. Every article is positioned in the content space according to itstwo estimates, β (engageability) and γ (clickability). The 5012 articles that appear in the plot have at least 500appearances as a host and as a recommended link during the estimation segment. The estimated values in thefigure range from −3 to 3 along both axes.
different click drivers. In fact, the correlation between the two is very low (0.03). Compared with current
practice that focuses on clickability/CTR, this representation allows one to differentiate between articles
that have similar clickability. We will demonstrate the value of the β-dimension in §5 and §6.
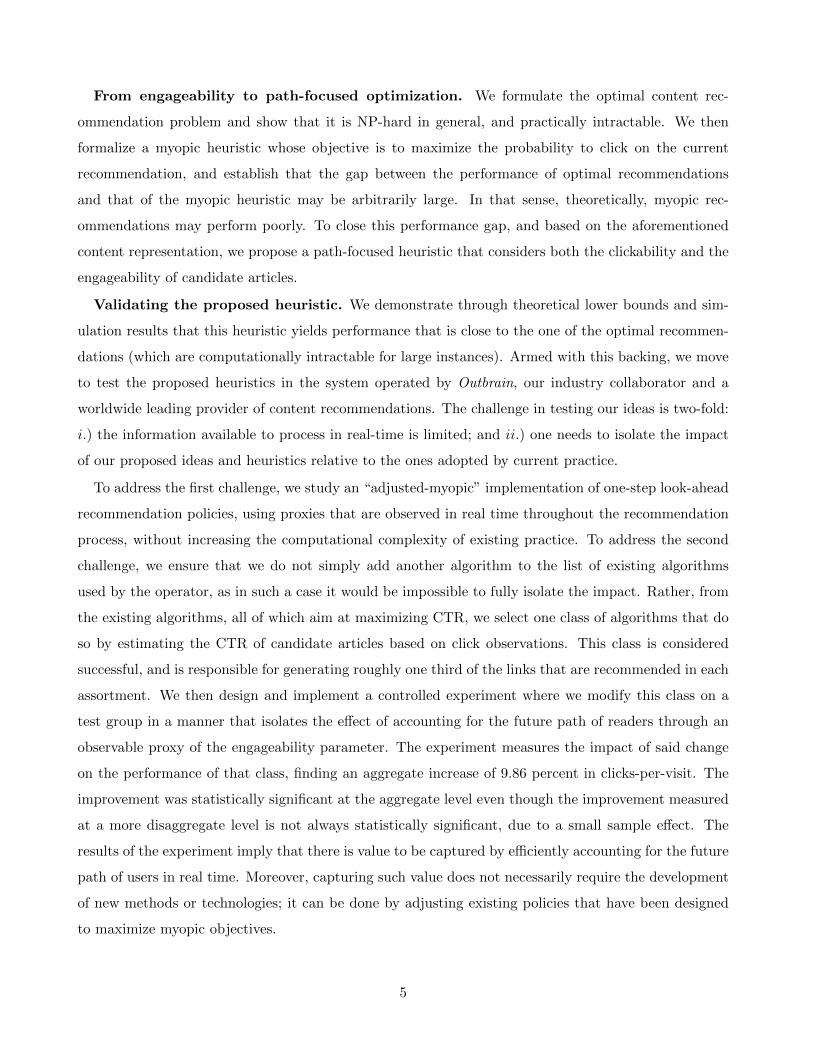
The content matrix. The content space may be used as a visualization tool to depict and un-
derstand representative classes of articles (illustrated in Figure 4). In that spirit, one may develop a
high level 2×2 view of content. We refer to articles with high clickability and high engageability as
“good articles”: readers are likely to click on them, and are also likely to click from them and continue
the service. On the other hand, the class of “bad articles” is characterized by low clickability and low
engageability. We refer to articles with high clickability but low engageability as “traffic traps”: these
Niche Opportunities
Good Articles
Bad Articles
Traffic Traps
High Engageability
Low Engageability
Low Clickability
High Clickability
β
γ
Figure 4: The content matrix.
articles attract a lot of readers, but these readers tend to terminate the service upon arrival. Unlike bad
articles, that are naturally screened out of the recommendation pool due to their low clickability, traffic
traps represent a threat to a clickability-focused system: since they are being clicked on, they keep on
being recommended despite potentially poor content that harms the service performance in the short
14

term (along the path of readers) and in the long term (decreasing the value of the service for readers).
We refer to articles with low clickability and high engageability as “niche opportunities”: readers do
not tend to click on these articles, but those who click on them tend to continue the service afterwards.
We finally note that the introduced content space may be useful for descriptive as well as prescriptive
purposes; a few practical applications of this formulations are discussed in §5.
2.4 Validating the notion of engageability
In-sample testing. In each estimation batch we perform a likelihood ratio test with the null
hypothesis being that click observations follow a link-focused model. This model follows the structure
in (1) with φu,x,y(A) defined by φlfu,x,y(A) = exp{α+ γy + µx,y + θu + λp(y,A)
}, where the control
parameters µx,y, θu, and λp(y,A) are defined as in §2.2. In the link-focused model engageability is always
constrained to be zero. For each two-hour batch we measure:
R = −2 ln
[likelihood for link-focused model
likelihood for nominal model
],
which is approximately distributed according to a chi-squared distribution with the number of degrees
of freedom being the number of engageability parameters (which is the number of articles, roughly 500
in each batch). The obtained p-values of the various batches were all smaller than 0.05. We next turn
to establish a stronger notion of validation through out-of-sample testing and predictive analysis.
Out-of-sample testing. We use each set of estimates generated in a batch to predict click/no-click
outcomes in the following batch. We test the ability to predict a click on the whole recommendation
(rather than on a specific link) in impressions where all the recommended articles were estimated in the
previous batch. The procedure of testing the predictive power of the model is as follows.
Out-of-sample testing procedure. Input: δ ∈ [0, 1]
1. For each 2-hour data batch 1 ≤ j ≤ 359:
(a) Estimate model parameters according to §2.2, using the data set of segment j.
(b) Test predictive power in the following 2-hour batch: for any recommended assortment A in
batch j + 1, calculate the assortment click probability according to the estimates of batch j:
Pu,x(A) =∑y∈A
Pu,x,y(A),
where Pu,x,y(A) is defined according to (1) and φu,x,y(A) according to (2). Then, classify:
Cδ(A) =
1 if Pu,x(A) ≥ δ
0 if Pu,x(A) < δ
2. Using the actual click/no-click reader’s feedback, calculate throughout the entire data horizon:
15

(a) the false positive rate:Rfpδ =
# {A : not clicked, Cδ(A) = 1}# {A : not clicked}
(b) the true positive rate:Rtpδ =
# {A : clicked, Cδ(A) = 1}# {A : clicked}
Benchmarks. We compare the predictive power of the model to one of the following benchmarks.
1. Random click probabilities. A random classifier in which Pu,x(A) is an independent uniform dis-
tribution over [0, 1].
2. Link-focused model. We estimated the model in (1) with φu,x,y(A) defined by:
φlfu,x,y(A) = exp{α+ γy + µx,y + θu + λp(y,A)
}, (3)
where the control parameters µx,y, θu, and λp(y,A) are defined as in §2.2.
3. Host-focused model. We estimated the model in (1) with φu,x,y(A) defined by:
φhfu,x,y(A) = φhfu,x(A) = exp {α+ βx + θu} , (4)
where θu is defined as in §2.2.
We repeat the above testing procedure for our model as well as for the three benchmarks for various
values of δ ∈ [0, 1]. To put the predictive power of our model into perspective, we compare it with the
three benchmarks in the receiver operating characteristic (ROC) space, in which the true positive rate
is presented as a function of the false positive rate, for a spectrum of δ values in [0, 1].
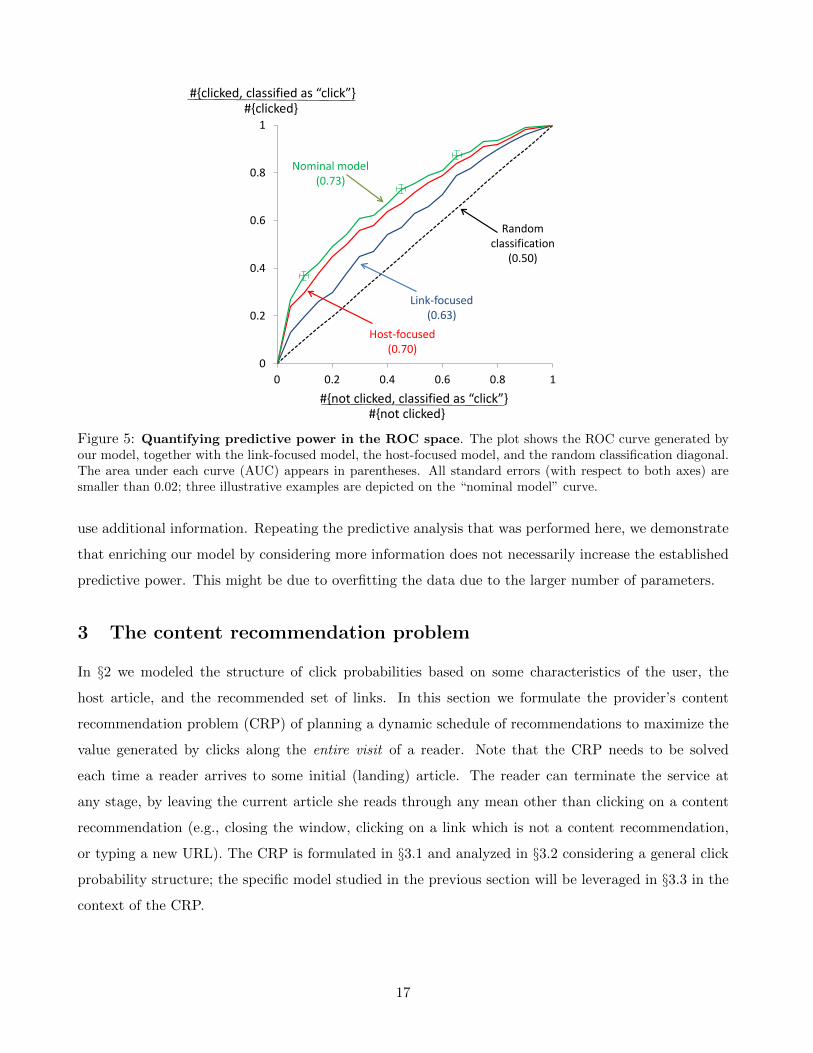
Predictive power. Figure 5 details the ROC curve of our nominal model, compared to that of
the link-focused and the host-focused benchmarks, as well as the random classification diagonal. The
large gap between the ROC curves of the nominal and the link-focused models suggests that indeed,
host engageability has a key impact on clicking behavior of readers. Thus, developing heuristics and
practical recommendation algorithms that leverage the engageability feature might lead to improved
performance relative to myopic methods that ignore engageability. The importance of the host effect
is also suggested by the relatively small gap between the ROC curves of the nominal and the host-
focused models. Indeed, the predictive power of a model that accounts only for the host effect and the
reader experience, significantly exceeded that of the richer link-focused model, that does not account for
host engageability. We note that contrasting the predictive power for experienced versus inexperienced
readers showed similar results; the two obtained ROC curves were statistically indistinguishable.
Robustness of the model. The model that was estimated in §2.2 considers basic inputs in our
data, in a manner that allows one to demonstrate the predictive power that is captured when accounting
for the engageability of the host article. In Appendix A.2 we consider two variants of this model that
16
0
0.2
0.4
0.6
0.8
1
0 0.2 0.4 0.6 0.8 1
Nominal model(0.73)
Host-focused(0.70)
Link-focused(0.63)
#{not clicked, classified as “click”}#{not clicked}
#{clicked, classified as “click”}#{clicked}
Randomclassification
(0.50)
Figure 5: Quantifying predictive power in the ROC space. The plot shows the ROC curve generated byour model, together with the link-focused model, the host-focused model, and the random classification diagonal.The area under each curve (AUC) appears in parentheses. All standard errors (with respect to both axes) aresmaller than 0.02; three illustrative examples are depicted on the “nominal model” curve.
use additional information. Repeating the predictive analysis that was performed here, we demonstrate
that enriching our model by considering more information does not necessarily increase the established
predictive power. This might be due to overfitting the data due to the larger number of parameters.
3 The content recommendation problem
In §2 we modeled the structure of click probabilities based on some characteristics of the user, the
host article, and the recommended set of links. In this section we formulate the provider’s content
recommendation problem (CRP) of planning a dynamic schedule of recommendations to maximize the
value generated by clicks along the entire visit of a reader. Note that the CRP needs to be solved
each time a reader arrives to some initial (landing) article. The reader can terminate the service at
any stage, by leaving the current article she reads through any mean other than clicking on a content
recommendation (e.g., closing the window, clicking on a link which is not a content recommendation,
or typing a new URL). The CRP is formulated in §3.1 and analyzed in §3.2 considering a general click
probability structure; the specific model studied in the previous section will be leveraged in §3.3 in the
context of the CRP.
17

3.1 General formulation of the CRP
The CRP is formalized as follows. Let 1, . . . , T be the horizon of the CRP throughout a visit of a single
reader. We denote by ` the number of links that are introduced in each recommendation. We denote
by xt−1 the article that hosts the recommendation at epoch t (for example, x0 denotes the article that
hosts the recommendation at t = 1; the article from which the reader starts her journey). We denote
by Xt the set of articles that are available to be recommended at epoch t. The initial set of available
articles is X0, and we assume this set is updated at each epoch by Xt = Xt−1 \ {xt−1} (for example, at
t = 1 all the articles that are initially available can be recommended, except for x0, that hosts the first
recommendation). We assume T ≤ |X0| − `, meaning that there are always enough available articles.
We denote by U the set of reader (user) types. We denote by u0 the initial reader type. This type
may account for various reader’s characteristics (e.g., geographical location), as well as her reading and
clicking history. We assume the reader type to be updated at each epoch according to ut = ft(ut−1, xt−1).
This update may account for articles being read, as well as for epoch-dependent effects such as fatigue
(for example, u1, the type at t = 1, may account for the initial type u0, the initial article x0, and the
fact that the reader sees the recommendation after having read one article). While we do not specify
here a concrete structure for ft(·, ·), we note that a special case of this update rule was used in §2.2,
where u0 ∈ {uexp, uinexp} was set based on a training set; whenever u0 = uexp one had ut = u0 for all t,
and whenever u0 = uinexp one had u1 = u0 and ut = uexp for all t ≥ 2.
A recommendation assortment is an ordered list of ` links to articles that are available for recommen-
dation. We denote by A`(Xt) the set of all possible assortments at epoch t (all ordered lists of items from
Xt). At each epoch t = 1, . . . , T the recommendation provider selects a recommendation assortment
At ∈ A`(Xt) to present the reader with. For a given user type u, a host article x and a recommendation
assortment A, we denote by Pu,x,y(A) the click probability to any article y ∈ A.2 Finally, we denote
by w(x) the value (for the service provider) generated when a reader clicks on a link to article x. We
assume that the value of clicking on each article is known; it may represent actual revenue (in sponsored
links), or tangible value (in organic links that drive publishers to partner with the provider).
The structure described above assumes Markovian dynamics, that are considered in the following.
Given an initial reader type u0, an initial set of articles X0, and a host article x0, the CRP of maximizing
the value generated by clicks throughout the visit is defined by the following Bellman equations:
2With some abuse of notation we sometimes denote assortments as sets of links, and note that the probability to clickon a link that belongs to an assortment depends on all the links in the assortment as well as on the way they are ordered.Therefore, y ∈ A and y ∈ A′ does not imply Pu,x,y(A) = Pu,x,y(A′). Similarly, A and A′ containing the same articles doesnot imply
∑y∈A Pu,x,y(A) =
∑y∈A′ Pu,x,y(A′), as articles may be ordered differently in each assortment.
18

V ∗t (ut,Xt, xt−1) = maxA∈A`(Xt)
{∑xt∈A
Put,xt−1,xt(A)(w(xt) + V ∗t+1(ut+1,Xt+1, xt)
)}, (5)
for t = 1, . . . , T , where V ∗T+1(uT+1,XT+1, xT ) = 0 for all uT+1,XT+1, and xT .
3.2 Complexity and myopic policy performance
Since the CRP accounts for the future path of the reader, the computational complexity that is associ-
ated with finding its optimal solution increases rapidly when the set of available articles gets large.
Proposition 1 (Hardness of CRP) The content recommendation problem defined by (5) is NP-hard.
In the proof of the proposition we establish that the Hamiltonian path problem, a known NP-hard
problem (cf. Gary and Johnson (1979); see also Uehara and Uno (2005) and Karger et al. (1997) for
various relaxations and approximation approaches to this problem), can be reduced to a special case of
the CRP, and therefore, even when click probabilities from hosting articles to recommended articles are
known for each arriving reader, the CRP is NP-hard. Given the large number of available articles and
the high volume of reader arrivals, Proposition 1 implies that it is impractical for the service provider
to look for an optimal solution for the CRP for each arriving reader. This motivates the introduction
of customized recommendation algorithms that, although lacking performance guarantees for arbitrary
problem instances, perform well empirically given the special structure of the problem at hand.
The myopic heuristic. One class of such algorithms is CTR-driven, with the objective of recom-
mending at each epoch t (until the reader terminates the service) an assortment of links that maximizes
the instantaneous performance, without accounting for the future path of the reader. We refer to this
approach as the myopic content recommendation problem (MCRP), and formally define it by:
V mt (ut,Xt, xt−1) =
∑xt∈Am
t
Put,xt−1,xt(Amt ) (w(xt) + V m
t (ut+1,Xt+1, xt)) ; t = 1, . . . , T, (6)
where
Amt ∈ arg maxA∈A`(Xt)
{∑xt∈A
Put,xt−1,xt(A)w(xt)
}; t = 1, . . . , T,
and where V mT+1(uT+1,XT+1, xT ) = 0 for all uT+1, XT+1, and xT . The MCRP can be solved at each
epoch separately, based on the current host article, reader type, and set of available articles.
The sub-optimality of myopic recommendations. While recommending articles myopically
is a practical approach, simple problem instances reveal that myopic recommendations may generate
poor performance compared to the optimal schedule of recommendations. In one such instance that is
depicted in Figure 6, myopic recommendations generate only two thirds of the expected clicks generated
by optimal recommendations.
19

Arriving user
1
0.75
0 1
A
B
Starlet arreSted again !!!
Saturn miSSion haS new reportS
(new)
(1 month old)
x 0
Figure 6: Sub-optimality of myopic recommendations. A content recommendation instance, with ` = 1,T = 2, X0 = {x0, A,B}, and uniform click values. x0 is the initial host. The click probabilities illustrate ascenario where article B has attractive title but irrelevant content that drives users to terminate the service.Myopic schedule first recommends B and then A, generating a single click. An optimal schedule first recommendsA and then B, generating 0.75 + 0.75× 1 = 1.5 expected clicks.
Figure 6 depicts an instance of significant gap between the performance of myopic recommendations
and that of optimal recommendations. In fact, this performance gap may be arbitrarily large in general.
To demonstrate that, we consider a special case of the problem where ` = 1 (single link recommenda-
tions), and the user type u is fixed over time. Then, we can denote the probability to click from article
x to a recommended article y simply by Pu,x(y). Let GT+1 denote the class of all networks induced
by sets X0 of T + 1 articles and sets of transition probabilities Pu0 = {Pu,x(y) |x ∈ X0, y ∈ X0}. The
following result shows that myopic recommendations may yield arbitrarily poor performance compared
to optimal recommendations when the size of the network and the problem horizon grow.
Proposition 2 (Performance gap for MCRP) Let X0 be an initial set of articles, let X1 be a set
of articles available for recommendation from an initial article x0 ∈ X0, and let u be a user type, as
defined in §3.1. Let Pu0 be the set of transition probabilities induced by X0 and u, as defind in §3.2.
Then,
inf(X0,Pu
0 )∈GT+1,x0∈X0,u∈U
{V m
1 (u,X1, x0)
V ∗1 (u,X1, x0)
}−→ 0 as T →∞.
We note that the type u is fully specified by the set Pu0 ; with some abuse of notation, we omit the
explicit dependence of the value function on the transition probabilities. The proof of the proposition
is constructive; we explicitly exhibit a set of available articles with appropriate transition probabilities
such that when the number of articles grows large the performance of the myopic heuristic, defined by
(6), becomes arbitrarily poor compared to the one of optimal recommendations, defined by (5).
To summarize, we have established that while finding an optimal recommendation schedule may not
be practical, theoretically, algorithms that follow a myopic heuristic may significantly under-perform
20

relative to optimal recommendations. These results add context to the empirical insights discussed in
§2.1, as these insights suggest that a gap between the performance of myopic recommendations and that
of the optimal recommendations may appear not only in theory, but in real content networks as well.
3.3 Leveraging engageability: path-focused approach
Having established in §2.4 the importance of engageability in predicting click behavior, we next turn
to study the value one may capture by accounting for engageability for the purpose of optimizing
recommendations. Adopting the model studied in §2, we suggest a heuristic that accounts for one step
forward in a reader’s path when creating each recommendation, and analyze its performance.
One-step look-ahead heuristic. We suggest recommending articles with the objective of solving
the one-step look-ahead recommendation problem, defined by the following set of equations:
V onet (ut,Xt, xt−1) =
∑xt∈Aone
t
Put,xt−1,xt(Aonet )
(w(xt) + V one
t+1 (ut+1,Xt+1, xt)), (7)
for t = 1, . . . , T − 1, where
Aonet ∈ arg maxA∈A`(Xt)
∑xt∈A
Put,xt−1,xt(A)
w(xt) + maxA′∈A`(Xt+1)
∑xt+1∈A′
Put+1,xt,xt+1(A′)w(xt+1)
,
for t = 1, . . . , T − 1, where V oneT (uT ,XT , xT−1) = V m
T (uT ,XT , xT−1) for all uT , XT , and xT−1, that is,
in the last time slot one-step lookahead recommendations are simply myopic. We first provide some
backing for these heuristics, and in §4 we document a controlled experiment that demonstrates the value
captured in practice by implementing such heuristic.
Simulation. We conducted a simulation based on our model estimates, to evaluate the performance
gap (measured in clicks per visit) between optimal and myopic recommendations, and the portion of this
gap that may be captured by one-step look-ahead recommendations. The setup and the results of the
simulation are detailed in Appendix A.1. Our results show that while optimal recommendations that
account for the entire future path of readers may generate an increase of approximately 50 percent in
clicks per visit relative to myopic recommendations, a major part (between 70 percent and 90 percent) of
this performance gap may be captured by one-step lookahead recommendations. In addition, the impact
of one-step look-ahead recommendations is similar for “experienced” and “inexperienced” readers.
Theoretical near optimality. We show that under mild structural assumptions, the performance
gap between the one-step look-ahead policy and that of the optimal recommendation policy is suitably
small. For simplicity we consider a special case of the CRP in which the user type does not update
(ut = u0 = u for all t = 1, . . . , T ), every recommendation consists of a single link, w(x) = 1 for any
21

available article x, and that the set of available articles X to be continuous and convex (and therefore
it is not updated throughout the problem horizon). Specifically, we assume the set X is defined by:
X = {(γ, β) : −1 ≤ γ ≤ 1, −1 ≤ β ≤ 1, β ≤ 2− ε− γ} , (8)
for some ε ∈ [0, 1]. The set X is depicted in Figure B-4, which appears in the Appendix. Intuitively,
ε represents the tradeoff between clickability and engageability in the efficient frontier set of available
articles; when ε is small, this tradeoff is mild in the sense that there are “many” articles with high
clickability and high engageability.
Proposition 3 (Near optimality of one-step look-ahead recommendations) Let X be the set
of available articles defined in (8), and assume that Pu,x(y) ≤ p for all x ∈ X , y ∈ X , and u ∈ U . Then,
for any u ∈ U and x0 ∈ X ,
V one1 (u,X , x0)
V ∗1 (u,X , x0)≥ e−2ε
(1 + e−2εp
1 + p
)T−1
.
Recall that T is the horizon of the content recommendation problem, p is an upper bound on the tran-
sition probabilities, and ε introduces a tradeoff between engageability and clickability over the efficient
frontier of available articles, as is captured by the definition of X in (8). Thus, proposition 3 implies
that the performance of the one-step look-ahead policy approaches that of the optimal recommendation
policy when the (optimal) click probabilities are small, and when the efficient frontier set of available
articles satisfy a mild tradeoff between engageability and clickability.
4 Pilot study: a controlled field experiment
The analysis presented in §3.3 implies that there might be significant value in accounting for a single
future step in the potential path of readers. To test this, together with Outbrain we designed a live
experiment that compares the performance of recommendations that account for a single future step,
with the performance of those that myopically aim at maximizing CTR. To take into account the
information and complexity limitations of the operating recommendation system, we consider a practical
and simple class of one-step look-ahead recommendation policies that suitably adjusts the approach
described in §3.3.
4.1 Methodology
Process overview. Whenever a reader arrives to an article, an assortment of recommended links is
produced, through a process that involves various classes of recommendation algorithms. Outbrain uses
several different classes of algorithms to make organic recommendations, and mixes the recommendations
22

of its different algorithms in the final assortment of recommended articles. At a high level, these
algorithms operate as index policies: first, they assign grades to candidate articles; once grades are
assigned, a typically randomized selection process takes place, where articles with higher grades are
more likely to be recommended. Different algorithms may vary one from the other by their ranking
system as well as by their randomized selection process. For example, while a certain ranking system
may use estimates of CTR based on past clicks, other ranking systems may use characteristics of
articles (such as their main topic), the extent of relation to the article the reader is currently positioned
at, as well as documented performance of similar articles. To maintain variability in the produced
assortment, a supervising mechanism typically ensures that each recommendation contains links selected
by different classes of algorithms; yet, more successful classes have, on average, more “representatives”
in recommended assortments.
To test the impact of accounting for engageability of candidate articles throughout the recommen-
dation process, we will focus on a certain class of algorithms. As we later explain in more detail, in a
test group we will adjust the ranking system of this class to account for engageability, and will measure
the impact of the performance of that class relative to a control group where the class will maintain its
original ranking system. The class we will adjust is designed to maximize the CTR of recommended
articles; moreover, it ranks articles by estimating their CTR directly from click observations. It is
considered a very successful class, and therefore typically generates a relatively large portion (roughly
one third) of the organic links that are recommended in each assortment. It is worthwhile to mention
that all the rest of the algorithms (that will not be adjusted) are also designed and tuned to maximize
the CTR of recommended articles, but do so following different methods and using other inputs such
as the ones discussed above.
Myopic approach: CTR-based class. At a high level, the class we adjust operates as follows.
CTR-based procedure P. Input: a set X of available articles.
1. For each article x ∈ X calculate CTR(x) along a window of recent observations.
2. For each x ∈ X assign a weight q(x) = ψ [CTR(x)], where ψ : R → R is some strictly increasing
mapping.
3. For each x ∈ X assign a probability p(x) = q(x)∑x′∈X q(x
′) .
4. Draw an article to recommend according to the distribution {p(x)}x∈X .
The mapping ψ (together with the normalization that follows it) transforms an ordered list of observed
CTRs into a distribution from which articles are sampled. The essential characteristic of ψ is in being
strictly increasing: an article with higher observed CTR has higher probability of being recommended.3
3Due to a non-disclosure agreement the structure of ψ is not explicitly disclosed here.
23

We further note that the set X considers some system constraints (for example, the article that currently
hosts the recommendation cannot be recommended).
Adjusted-myopic proxy for the one-step look-ahead heuristic. Finding a solution for the
one-step look-ahead problem involves worst case computational complexity of order |X |2, compared to
order |X | that is required in order to find the best myopic recommendation. Since the set of available
articles is typically very large, a first step towards implementation was to find a proxy for the one-step
look-ahead policy that requires computational complexity of order |X |, and that follows a procedure
similar to the policy currently in place. Moreover, since the clickability and the engageability of articles
(the sequences of γ and β estimates) are obtained by an off-line estimation and currently are not
available online, we use proxies that are collected and measured in an online fashion throughout the
recommendation process. An intuitive proxy for probability to click to an article is the CTR of the
article, defined by
CTR(x) =# {clicks to x}
# {times x is recommended },
for each article x. The CTR of each article is calculated over some time window along which offerings
and click observations are documented. The correlation between the values of Put,xt−1,xt(A), when con-
structed by our estimators (considering the recommended article (xt), the host article (xt−1), the reader
type (ut) and the whole assortment that was offered), and the values of CTR(xt) (of the recommended
article, xt) that were calculated based on observations from the same estimation batch is 0.29. Similarly,
a potential proxy for probability to click from an article is the exit-CTR of an article, defined by:
exit-CTR(x) =# {events of at least one additional page-view after reading x}
# {times x was viewed}.
This exit-CTR measure accounts not only for clicks on organic links, but also for other events, such as
an additional article that was read at the same publisher shortly after visiting article x (for example,
after a short visit in the front page of the media site). We found the correlation between the values
of maxA′∈A`(Xt+1)
{∑xt+1∈A′ Put+1,xt,xt+1(A′)
}, when constructed by our estimators (considering the
recommended article (xt), the host article (xt−1), the reader type (ut), the whole assortment that was
offered, as well as the set of articles that were available for recommendation at the following step),
and the values of exit-CTR(xt) (of the host article, xt) that were calculated based on observations
documented in the same estimation batch to be 0.25.
Based on these findings, and assuming a uniform article value w(·) = 1, we suggest the following
adjusted-myopic recommendation policy that recommends the ` articles with the highest index value:
Index(y) = CTR(y) [1 + exit-CTR(y)] .
24

Recalling the one-step look-ahead heuristic in (7), the adjusted myopic policy uses observable proxies of
the heuristic’s elements to recommend articles based on a proxy of their one-step look-ahead value. This
policy accounts for the potential future path of the reader upfront, without increasing the computational
complexity of index policies that are currently used by the system.
Accounting for the future path of readers. As an alternative to the procedure P we suggest a
class of recommendation policies that account for the engageability of candidate articles.
A simple look-ahead procedure P. Input: a set X of available articles.
1. For each article x ∈ X calculate CTR(x) and exit-CTR(x) along a window of recent observations.
2. For each x ∈ X assign a weight q(x) = ψ [CTR(x) · (1 + exit-CTR(x))], where ψ [·] is the same
mapping as in the procedure P.
3. For each x ∈ X assign a probability p(x) = q(x)∑x′∈X q(x
′) .
4. Draw an article to recommend according to the distribution {p(x)}x∈X .
We note that since the same mapping ψ is used both in P and in P, the only difference between
these recommendation procedures is in the argument of ψ: in P it is the CTR of candidate articles; in
P this argument is adjusted by the engageability of candidate articles, through the exit-CTR proxy.
To motivate the implementation of the adjusted-myopic procedure, and to evaluate the potential
improvement one could hope for when applying it (relative to the CTR-based procedure) we repeated
the simulation mentioned in §3.3 (and detailed in AppendixA.1) to measure the performance of rec-
ommendations that were selected to maximizes the adjusted-myopic objective in every step, observing
that the adjusted-myopic policy achieved roughly 12% improvement compared to the myopic policy.
Alternatively, roughly 25% of the improvement achieved by the one-step look-ahead policy over the
myopic policy was captured by the adjusted-myopic one. The performance gap between the one-step
look-ahead policy and the adjusted-myopic one can be explained by the imperfect correlation between
the elements of the one-step look-ahead objective and those of the adjusted-myopic objective.
4.2 Experiment Setup
Each Outbrain reader has a unique user id (a number that is uniquely matched with an IP address) that
typically does not change with time and is assumed to be independent of the clicking behavior of the
reader. In the experiment each reader was assigned either to a test group or to a control group based
on this unique id, in an arbitrary, pre-determined manner that was designed to create a control group
that is roughly four times larger than the test group. Each reader was assigned to the same group (test
or control) in all his/her arrivals throughout the entire time over which the experiment took place.
25

Whenever a reader arrived to an article, roughly one third of the shown organic links were generated
by the class described above. When the reader belonged to the control group, these links were generated
by the procedure P, that is, considering the CTR of candidate articles. When the reader belonged to
the test group, these links were generated by P, that is, considering both the CTR and the exit-CTR of
candidate articles. The rest of the organic links were generated by other CTR-maximizing algorithms,
whose process was not affected by the group each user belonged to.4 The exact number of links that
were generated in each impression by the algorithm class described above was determined independently
of the group which the user belonged to. The group to which a reader belonged did not impact the
sponsored links that were offered, or any other characteristics of the web-page.
We emphasize that the classes P and P are identical except for the objective their produced indexed
lists maximize: CTR (in P) versus a combination of CTR and exit-CTR (in P). Therefore, comparing
the performance of the class P with the one of the class P, and having the rest of the algorithms not
affected by the group which each user belonged to, the experiment isolates the impact of accounting for
the future path of users from the potential effect of the algorithmic method itself.
To limit the scope of the experiment, it was designed to focus on active readers that have just clicked
on an organic recommended link (active readers represent a special subset of experienced readers). A
reader “entered” the experiment after the first click, and we do not differentiate with respect to the
algorithm that generated the first clicked link. From that point, we tracked the path of the reader
throughout organic recommendations generated by the described algorithm class, and compared the
performance of that class of algorithms in the test group relative to the control group. In both test and
control groups CTR and exit-CTR values were updated every 3 hours, based on observations documented
in the previous 3 hours. The experiment took place during December 2013, over 56 consecutive hours
beginning at midnight between a Monday and a Tuesday, in a single media site.
Performance indicators. We follow the number of consecutive clicks made by each active reader
on links that were generated by the algorithm class on which we focus. When the reader clicks on a
sponsored link or an organic link that was not generated by that class, or when the reader terminates the
session in any way without clicking on a recommended link, the path of the reader ends. We partition
the experiment period into 14 batches of four hours each. Along each batch we calculate, in both groups,
the average clicks per active reader’s visit (not counting the first click after which the reader “entered”
the experiment). We denote by νcontrol(t) the average clicks per visit in the control group along batch t,
and by νtest(t) the average clicks per visit in the test group along batch t. We further denote by r(t)
the relative difference in performance in the test group relative to the control group, in batch t:
4Due to a non-disclosure agreement with Outbrain we do not further disclose these algorithms here.
26
r(t) = 100 · νtest(t)− νcontrol(t)νcontrol(t)
.
4.3 Results
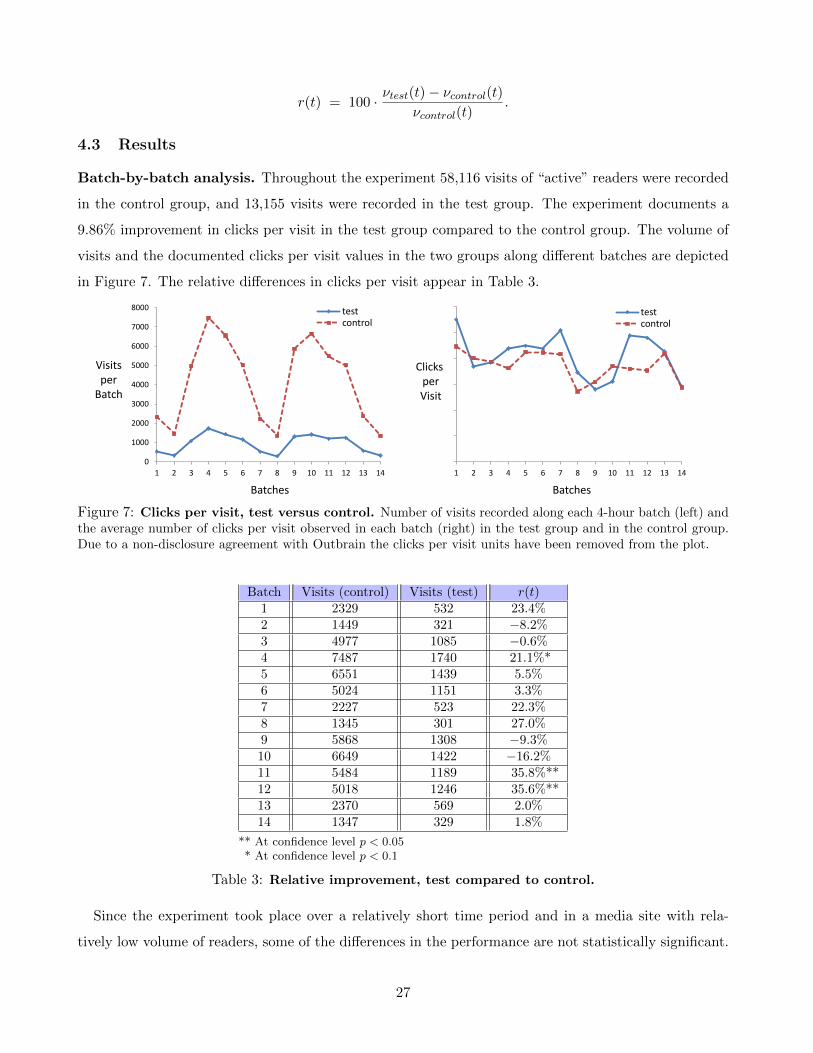
Batch-by-batch analysis. Throughout the experiment 58,116 visits of “active” readers were recorded
in the control group, and 13,155 visits were recorded in the test group. The experiment documents a
9.86% improvement in clicks per visit in the test group compared to the control group. The volume of
visits and the documented clicks per visit values in the two groups along different batches are depicted
in Figure 7. The relative differences in clicks per visit appear in Table 3.
Batches Batches
0
1000
2000
3000
4000
5000
6000
7000
8000
1 2 3 4 5 6 7 8 9 10 11 12 13 14
test control
1 2 3 4 5 6 7 8 9 10 11 12 13 14
test control
Clicks per Visit
Visits per
Batch
Figure 7: Clicks per visit, test versus control. Number of visits recorded along each 4-hour batch (left) andthe average number of clicks per visit observed in each batch (right) in the test group and in the control group.Due to a non-disclosure agreement with Outbrain the clicks per visit units have been removed from the plot.
Batch Visits (control) Visits (test) r(t)1 2329 532 23.4%2 1449 321 −8.2%3 4977 1085 −0.6%4 7487 1740 21.1%*5 6551 1439 5.5%6 5024 1151 3.3%7 2227 523 22.3%8 1345 301 27.0%9 5868 1308 −9.3%10 6649 1422 −16.2%11 5484 1189 35.8%**12 5018 1246 35.6%**13 2370 569 2.0%14 1347 329 1.8%
** At confidence level p < 0.05* At confidence level p < 0.1
Table 3: Relative improvement, test compared to control.
Since the experiment took place over a relatively short time period and in a media site with rela-
tively low volume of readers, some of the differences in the performance are not statistically significant.
27

Nevertheless, in most of the batches there was an improvement in the test group relative to the control
group; in three batches (4, 11, and 12) this performance improvement is statistically significant.
Aggregate analysis. To estimate the aggregate impact of the treatment, we estimate a linear
regression over the 58,116 documented visits. We denote by νi the number of clicks along visit i. We
denote by TESTi a dummy variable indicating whether visit i was in the test group (equals one if it was
in the test group, zero otherwise); the associated coefficient gtest captures the impact of the treatment
on the performance relative to the control group. For t ∈ {2, . . . , 14} we denote by BATCHi,t a dummy
variable indicating whether visit i occurred in batch t; the coefficients b2, . . . , b14 capture the various
batches effects relative to the first batch. We denote by εi the error term associated with visit i. We
estimate the following linear model:
νi = α+ gtest · TESTi +
14∑t=2
bt ·BATCHi,t + εi.
Scaled results of the regression are detailed in Table 4 (divided by the absolute value of the intercept
estimate). The estimate of the treatment coefficient gtest is positive at confidence level p < 0.05,
indicating that adjusting the CTR objective by the engageability proxy improved the performance of
the algorithm class in a statistically significant manner.
Effect Parameter Estimate Standard errorIntercept α 1* 0.066
Group gtest 0.079* 0.035
Batch
b2 −0.153 0.105b3 −0.170* 0.078b4 −0.192* 0.074b5 −0.078 0.078b6 −0.087 0.078b7 −0.109 0.096b8 −0.389* 0.109b9 −0.349* 0.079b10 −0.227* 0.079b11 −0.179* 0.079b12 −0.188* 0.079b13 −0.100 0.092b14 −0.384* 0.109
* At confidence level p < 0.05
Table 4: Linear regression: scaled results. Due to a non-disclosure agreement, values in the table wereobtained by dividing original estimates and standard errors by the absolute value of the intercept estimate.
Discussion. We note that the improvements above are witnessed even though the adjusted myopic
policy could potentially be fine-tuned to enhance performance; for example, one could only suspect
that the mapping ψ could be tuned to optimize the adjusted-myopic objective. Moreover, we note
that the exit-CTR proxy accounts not only for clicks on Outbrain’s links but also for other events of
28
future page views. Indeed, other proxies that have higher correlation with elements of the one-step
look-ahead heuristic may yield better performance. One example is the following exit-CTR measure,
which accounts only for clicks on the recommendation that is hosted by the article:
exit-CTR′(x) =# {clicks on recommendation from x}
# {times x hosts a recommendation along τ}.
We found the correlation between the values of maxA′∈A`(Xt+1)
{∑xt+1∈A′ Put+1,xt,xt+1(A′)
}, and the
values of the above exit-CTR(xt) values calculated based on observations documented in the same
estimation batch to be 0.36 (higher than the one of proxy that was used in the pilot). The latter
suggests that the performance improvement that was documented in the pilot may be further increased
by using alternative and more suitable engageability proxies.
5 Concluding remarks
This study introduces the emerging practice of dynamic content recommendation services, and suggests
a practical approach to improve the performance of such services by accounting for the potential future
path of users. Our proposed path-focused approach was validated by theoretical bounds, simulation,
and predictive analysis. Furthermore, we tested the approach in a live pilot experiment to compare
its performance to myopic CTR-maximizing recommendations that are widely used in current practice.
The pilot experiment documented a statistically significant aggregate improvement of 9.86% in clicks-
per-visit when recommendations accounted also for the future path of readers through a proxy of the
engageability parameters. These results indicate that accounting for the future path of users in real
time may significantly improve performance. Moreover, such an improvement does not necessarily
require the development of new recommendation technologies; it may be obtained by adjusting existing
algorithms that have been fine-tuned to maximize a myopic objective such as CTR. Indeed, the key
tradeoff between instantaneous payoff and potential future payoff may exist in many dynamic/sequential
services (a related example being YouTube’s video recommendations, but other online services such as
Amazon’s recommendations may exhibit similar tradeoffs). Thus, while our analysis quantifies this
tradeoff in the context of a dynamic service that recommends articles, the insights demonstrated by the
introduced content space and the practical approach of approximating a one-step look-ahead heuristic
via observable proxies may have broader implications.
To visualize the aforementioned tradeoff between instantaneous and future payoffs in the context of
articles, we developed a representation of articles in a compact content space along two dimensions:
clickability and engageability. Various practical applications arise from this new representation. For
example, our framework allows one to track the dynamics of clickability and engageability, which may
29

be referred to as the aging process of articles. Since most of the articles lose relevancy rapidly from the
time they are published, tracking this process is a practical challenge that is crucial for the provider’s
ability to screen out articles that became irrelevant. Tracking the varying coefficients shows that most
of the articles exhibit a decreasing trend in both dimensions from the time they are published until
they are not recommended anymore (typically due to their declining clickability). However, some
articles exhibit a decrease in engageability while maintaining high clickability, becoming potential “traffic
traps.” In addition, topics may be visualized and better understood through the lens of the content
space dimensions. In Appendix A.3 we suggest a representation of topics in the content space through
confidence sets, and demonstrate this for two representative topics.
Various avenues for future research also emerge. In particular, a broader question is how to adequately
measure performance/quality of a service. While engageability might be one important measure, there
are other potential metrics to consider. For example, in the present case, we also measured the average
time that was spent by readers on articles (time spent is an independent and common characteristic of
online services; see, e.g., Shahabi et al. (1997), and Gunduz and Ozsu (2003)). While both engageability
and time spent potentially capture different aspects of quality, an observed positive correlation (0.28)
seems to indicate a relation between the two. Developing a framework for measuring the quality of a
service is indeed an ambitious avenue of future research.
Acknowledgments
The authors are grateful to Alan Scheller-Wolf, an associate editor and three reviewers for their feedback
that helped to improve the paper. The authors deeply thank their industrial partner, Outbrain Inc.,
with special thanks to Itai Hochman and Rani Nelken, who participated in this study from its inception.
This work was supported by NSF grant 0964170, BSF grant 2010466, the Eugene M. Lang support fund,
and the W. E. Deming center for quality, productivity, and competitiveness.
References
Adomavicius, G. and A. Tuzhilin (2005). Toward the next generation of recommender systems: A survey of thestate-of-the-art and possible extensions. Knowledge and Data Engineering, IEEE Transactions on 17, 734–749.
Alptekinoglu, A., D. Honhon, and C. Ulu (2012). Learning consumer tastes through dynamic assortments.Operations Research 60, 833–849.
Araman, V. and K. Fridgeirsdottir (2011). A uniform allocation mechanism and cost-per-impression pricing foronline advertising. Working paper .
Bucklin, R. E., J. M. Lattin, A. Ansari, S. Gupta, D. Bell, E. Coupey, J. D. C. Little, C. Mela, A. Montgomery,and J. Steckel (2002). Choice and the internet: From clickstream to research stream. Marketing Letters 13,245–258.
30

Bucklin, R. E. and C. Sismeiro (2003). A model of web site browsing behavior estimated on clickstream data.Journal of Marketing Research 40, 249–267.
Bucklin, R. E. and C. Sismeiro (2009). Click here for internet insight: Advances in clickstream data analysis inmarketing. Journal of Interactive Marketing 23, 35–48.
Caro, F. and J. Gallien (2007). Dynamic assortment with demand learning for seasonal consumer goods. Man-agement Science 53, 276–292.
Caro, F., V. Martinez-de-Albeniz, and P. Rusmevichientong (2014). The assortment packing problem: Multiperiodassortment planning for short-lived products. Management Science 60, 2701–2721.
Feng, J., H. K. Bhargava, and D. M. Pennock (2007). Implementing sponsored search in web search engines:Computational evaluation of alternative mechanisms. INFORMS Journal on Computing 19, 137–148.
Gary, M. R. and D. S. Johnson (1979). Computers and Intractability: A Guide to the Theory of NP-Completeness.W. H. Freeman and Company, New York.
Ghose, A. and S. Yang (2009). An empirical analysis of search engine advertising: Sponsored search in electronicmarkets. Management Science 55, 1605–1622.
Gunduz, S. and M. T. Ozsu (2003). A web page prediction model based on click-stream tree representation ofuser behavior. In Proceedings of the ninth ACM SIGKDD international conference on Knowledge discoveryand data mining , 535–540.
Haywood, N. and P. Cairns (2006). Engagement with an interactive museum exhibit. In T. McEwan, J. Gulliksen,and D. Benyon (Eds.), People and Computers XIX - The Bigger Picture, pp. 113–129. Springer London.
Hui, S., P. Fader, and E. Bradlow (2009). Path data in marketing: An integrative framework and prospectus formodel building. Marketing Science 28, 320–335.
Jansen, B. J. and T. Mullen (2008). Sponsored search: An overview of the concept, history, and technology.International Journal of Electronic Business 6, 114–131.
Karger, D., R. Motwani, and G. D. S. Ramkumar (1997). On approximating the longest path in a graph.Algorithmica 18, 82–98.
Kok, G. A., M. L. Fisher, and R. Vaidyanathan (2009). Assortment planning: Review of literature and industrypractice. In Retail Supply Chain Management. Springer US.
Kumar, S., V. S. Jacob, and C. Sriskandarajah (2006). Scheduling advertisements on a web page to maximizerevenue. European journal of operational research 173, 1067–1089.
Lee, D., K. Hosanagar, and H. Nair (2014). The effect of social media marketing content on consumer engagement:Evidence from facebook. Available at SSRN 2290802 .
Linden, G., B. Smith, and J. York (2003). Amazon.com recommendations: Item-to-item collaborative filtering.Internet Computing, IEEE 7, 76–80.
Mehta, A., A. Saberi, U. Vazirani, and V. Vazirani (2007). Adwords and generalized online matching. Journal ofthe ACM (JACM) 54, 22.
Montgomery, A. L., S. Li, K. Srinivasan, and J. C. Liechty (2004). Modeling online browsing and path analysisusing clickstream data. Marketing Science 23, 579–595.
O’Brien, H. L. and E. G. Toms (2008). What is user engagement? a conceptual framework for defining userengagement with technology. Journal of the American Society for Information Science and Technology 59,938–955.
31

O’Brien, H. L. and E. G. Toms (2010). The development and evaluation of a survey to measure user engagement.Journal of the American Society for Information Science and Technology 61, 50–69.
O’Reilly, T. (2009). What is web 2.0. O’Reilly Media, Inc.
Pazzani, M. J. and D. Billsus (2007). Content-based recommendation systems. In P. Brusilovsky, A. Kobsa, andW. Nejdl (Eds.), The Adaptive Web, pp. 325–341. Springer-Varlag Berlin Heidelberg.
Ricci, F., L. Rokach, and B. Shapira (2011). Introduction to recommender systems handbook. Springer US.
Rusmevichientong, P., Z. M. Shen, and D. B. Shmoys (2010). Dynamic assortment optimization with a multino-mial logit choice model and capacity constraint. Operations Research 58, 1666–1680.
Saure, D. and A. Zeevi (2013). Optimal dynamic assortment planning with demand learning. Manufacturing &Service Operations Management 15, 387–404.
Shahabi, C., A. M. Zarkesh, J. Adibi, and V. Shah (1997). Knowledge discovery from users web-page navigation.In Proceedings of the IEEE Seventh International Workshop on Research Issues in Data Engineering , 20–29.
Su, X. and T. M. Khoshgoftaar (2009). A survey of collaborative filtering techniques. Advances in artificialintelligence 2009: article number 4 .
Uehara, R. and Y. Uno (2005). Efficient algorithms for the longest path problem. In Algorithms and computation,pp. 871–883. Springer Berlin Heidelberg.
Webster, J. and J. S. Ahuja (2006). Enhancing the design of web navigation systems: the influence of userdisorientation on engagement and performance. MIS Quarterly (2006), 661–678.
32

Online Companion:
Optimization in Online Content Recommendation Services:Beyond Click-Through-Rates
A Auxiliary analysis
A.1 Simulation
We conduct the following simulation based on our model estimates (that include approximately 500
articles in each estimation batch). We assume ` = 5, that is, each assortment contains exactly five links,
and that prices are uniform, that is, w(·) = 1, for each article. We simulate the performance of different
recommendation approaches using the following procedure:
Simulation procedure. Inputs: k ∈ {5, 10, 25, 50, 75, 100}, and a reader type u0 ∈ {uexp, uinexp}
1. Set batch index j = 1
2. Repeat from τ = 1 to τ = 1, 000:
• Construct X0 by randomly drawing k articles (uniformly) out of those appearing in batch j.
• From the set of available articles, draw randomly one article (uniformly) to be x0.
• Set T = k − 1. For all t = 1, . . . , T follow the update rules: Xt = Xt−1 \ {xt−1}; ut = uinexp
if u0 = uinexp and t ≤ 1, otherwise ut = uexp. Based on the estimates of the drawn
articles and those of the control parameters in batch j, calculate recommendation schedules
that solve: the content recommendation problem (5), the myopic content recommendation
problem (6), and the one-step lookahead content recommendation problem (7), obtaining
V ∗j,τ = V ∗1 (u1,X1, x0), V mj,τ = V m
1 (u1,X1, x0), and V onej,τ = V one
1 (u1,X1, x0).
3. Update batch index j → j + 1, and while j ≤ 360 go back to step 2.
4. Calculate average clicks-per-visit performances:
V ∗ =
360∑j=1
1,000∑τ=1
V ∗j,τ ; V m =
360∑j=1
1,000∑τ=1
V mj,τ ; V one =
360∑j=1
1,000∑τ=1
V onej,τ .
We determine the schedules selected for the various solutions (including the optimal one) by exhaustively
searching over potential schedules of recommendations to maximize the objective of each policy given the
estimates of candidate articles, and then calculating the expected clicks per visit using these estimates.
To reduce the computation time we used the monotonicity of the value function in (5) with respect
to the engageability and clickability values of recommended articles to dismiss a set of suboptimal
1

schedules. We repeated the simulation procedure for combinations of k ∈ {5, 10, 25, 50, 75, 100} and
u0 ∈ {uexp, uinexp}. The average performances for different sizes of articles’ sets are depicted in Figure A-
1. Note that Figure A-1 includes also the simulated performance of adjusted-myopic recommendations
0
0.1
0.2
0.3
0.4
0 25 50 75 100
Optimal One-step Adjusted myopic Myopic
Experienced readers
Inexperienced readers
Number of available articles Number of available articles
Clicks per Visit
0
0.1
0.2
0.3
0.4
0 25 50 75 100
Clicks per Visit
Figure A-1: The near-optimality of one-step look-ahead recommendations. (Left) The average per-formance, in clicks per visit, of optimal, one-step lookahead, and adjusted-myopic (defined in §4), and myopicrecommendations, for readers that recently clicked on internal recommendations. (Right) The average perfor-mances for readers that did not click recently on an internal recommendation.
discussed in §4. We note that its simulated performance is only slightly below that of an index policy
that maximizes γ(x) · [1 + β(x)]; to avoid overload the latter does not appear in Figure A-1 (its elements
are not observed online). Figure A-1 shows that while optimal recommendations that account for the
whole future path of readers may generate an increase of approximately 50 percent in clicks per visit
compared to myopic recommendations, the major part of this performance gap may be captured by
one-step lookahead recommendations. While readers that are familiar with internal recommendations
and have clicked on those before tend to generate approximately twice as many clicks per visit compared
to readers that did not click on internal recommendations recently, the significant impact of one-step
look-ahead recommendations is similar for both “experienced” as well as “inexperienced” readers.
A.2 Robustness of the model
We consider two model variants that use additional information (and thus a larger number of pa-
rameters). Repeating the predictive analysis from §2.4, we demonstrate that enriching our model by
considering more information does not necessarily increase the established predictive power. This may
result from various reasons, one of which is overfitting the data due to the larger number of parameters.
We first consider a path-rich model, correspond to the model in (1) with φu,x,y(A) defined by:
φpru,x,y(A) = exp{α+ βx + γy + µx,y + θ′u + λp(y,A)
}, (A-1)
2

where βx, γy, µx,y, and λp(y,A) are defined as in §2.2, and θ′u captures the length of the current session:
the number of articles viewed during the current visit including the current host article. In particular,
θ′u ∈ {1, 2, 3, 4} where a value of 1 implies a session length of 1 (the current host article is the first article
that is viewed in the session), a value of 2 implies a session length of 2 (the current host article is the
second article that is viewed in the session), a value of 3 implies a session length of 3, and a value of 4
implies a session length of 4 or more. The path-rich model aims to capture the reader type at a finer
level (relative to the nominal model in §2.2) based on information on the length of the current session.
The second model we consider is the following context-rich model, in which φu,x,y(A) is defined by:
φcru,x,y(A) = exp{α+ βx + γy + µ′x,y + θu + λp(y,A)
}, (A-2)
where βx, γy, θu, and λp(y,A) are defined as in §2.2, and µ′x,y are entries of a 9 by 9 (non-symmetric)
topic transition matrix that use classification of articles into 9 major topics. For example, µ′1,4 is the
transition entry from the topic “news” into the topic “sport,” and is used whenever the host article
x is classified as “news” and the recommended article y is classified as “sport”. While the number
of parameters in this model is clearly higher, this model aims to better identify the cross effect µx,y’
relative to the indicator µx,y that is used in the nominal model defined in §2.2 to identify only the cases
in which the host and the recommended article belong to the same sub-topic (recall that in the nominal
model defined in §2.2, we use a classification into 84 sub-topics; for example, both the sub-topics “news:
politics” and “news: crime” fall under the topic “news” that is used here).
We repeat the predictive analysis described in §2.4 to construct the (out-of-sample) ROC curves of
the path-rich and the context-rich model. Figure A-2 depicts the ROC curves of the considered model
relative to the one of the nominal model. Figure A-2 demonstrates that both of the considered models
do not achieve a better predictive power than the one achieved by the nominal model in §2.4. The area
under the curve (AUC) of the path-rich model is the same as the one of the nominal model; the two
ROC curves are not statistically distinguishable. The AUC of the context-rich model is lower than the
one of the nominal model; while accounting for more information, this model achieves lower predictive
power than the one achieved by the nominal model in §2.4, which is probably due to overfitting.
Overfitting and in-sample predictive analysis. Since in each two-hour batch we estimate (in
the nominal model) approximately 1,000 parameters, a natural issue to be concerned about is that of
overfitting. To investigate the extent of overfitting, we tested the predictive power of the nominal model
in-sample as well (that is, tested each set of estimators along the batch over which these estimators were
produced). We depict in Figure A-2 the in-sample ROC curve of the nominal model and observe that
3

0
0.2
0.4
0.6
0.8
1
0 0.2 0.4 0.6 0.8 1
Nominal model(0.73)
Context-rich(0.71)
#{not clicked, classified as “click”}#{not clicked}
#{clicked, classified as “click”}#{clicked}
Path-rich(0.73)
In-sample: Nominal(0.76)
In-sample: Context-rich(0.78)
Figure A-2: Alternative models: predictive analysis . The plot depicts the out-of-sample ROC curvegenerated by the basic model defined in §2.2, together with the path-rich model and the context-rich model. Inaddition, the in-sample ROC curves are added for our model as well as the context-rich model. The area undereach curve (AUC) appears in parentheses. All standard errors (with respect to both axes) are smaller than 0.02;three illustrative examples are depicted on the “nominal model” curve.
it is similar to the out-of-sample one, which is reassuring. While the in-sample AUC of this model is
slightly higher at 0.76, it is important to recognize that: first, of course, the in-sample predictive power
of any model is expected to be higher than an out-of-sample one; second, clickability and engageability
are time varying, and therefore predictive power may be lost as time goes by.
In Figure A-2, we also depict the in-sample ROC curve associated with the context-rich model. We
observe that there is a larger gap between the in-sample AUC (0.78) and and the out-of-sample AUC
(0.71). This, in conjunction with the fact that the context-rich model has lower out-of-sample predictive
power than the nominal model, may indicate that the context-rich model suffers from overfitting in this
context. Indeed, it includes roughly 10% more parameters compared to the nominal model.
A.3 Contrasting topics in the content space
We illustrate how topics may be visualized and understood through the lens of the content space.
Consider a topic τ with associated articles {xτi }Ni=1 that are assumed to be positioned in the content
space according to a bivariate normal distribution with a mean µ = (µβ, µγ) and a covariance matrix
Σ = diag (σβ, σγ). One may represent τ though confidence sets, by estimating:
µτβ =1
N
N∑i=1
βi, στβ =
√√√√ 1
N − 1
N∑i=1
(βi − µτβ
)2; µτγ =
1
N
N∑i=1
γi, στγ =
√√√√ 1
N − 1
N∑i=1
(γi − µτγ
)2.
4

Figure A-3 depicts confidence sets of two topics: architecture and celebrities. While the celebrities
β
γ
(Engageability)
(Clickability)
Architecture Celebrities
Figure A-3: Contrasting topics in the content space. The 90% confidence sets of the topics architectureand celebrities are illustrated. The corresponding estimates (obtained using our whole data set) are µarcβ = 0.29,
µarcγ = −0.47, σarcβ = 1.13, σarcγ = 1.06; and µcelβ = 0.13, µcelγ = 0.72, σcelβ = 0.88, σcelγ = 1.01.
category might lead to more instantaneous clicks, it does not dominate architecture in terms of future
clicks.
B Proofs
Proof of Proposition 1. We establish that the CRP is NP-hard by showing that the Hamiltonian
path problem (HPP), a known NP problem (Gary and Johnson 1979) can be reduced to a special case
of the CRP. We denote by G(V, E) a directed graph, where V is the set of nodes and E is the set of
arcs. An arc connecting one node v with another node v′ is denoted by ev,v′ . When v ∈ V is connected
to v′ ∈ V, one has ev,v′ ∈ E . Given a graph G(V, E), the HPP is to determine whether there exists a
connected path of arcs in E , that visits all the vertices in V exactly once.
We next show that the HPP can be reduced to a special case of the CRP. Fix a general, directed
graph G(V, E), and consider the following special case of the CRP, with a fixed x0, in which:
• T = |X0| − `.
• X1 = V, with w(x) = 1 for each article in x ∈ X1.
• ut = u0 = u for all t = 1, . . . , T (the reader type is fixed, and in particular, independent of the
length of her path and on the articles she visits along her path).
• ` = 1, i.e., every recommendation consists of a single link. Whenever fan article x hosts a
recommendation A that includes a link to article y, we denote for simplicity Pu,x,y(A) = Pu,x(y).
• Pu,x(y) ∈ {0, 1} for all y ∈ Xt, for all t = 1, . . . , T (the click probabilities for any potential
recommended link are binary at any epoch). In particular, for any x, y ∈ X1 we set:
5

Pu,x(y) =
1 if ex,y ∈ E
0 otherwise.
• Pu,x0(y) = 1 for all y ∈ X1 (the first link is clicked, regardless of the selected recommendation).
Then, given the landing article x0 ∈ X0, the CRP takes the following form:
V ∗t (u,Xt, xt−1) = maxxt∈Xt
{Pu,xt−1(xt)
(1 + V ∗t+1(u,Xt+1, xt)
)},
for t = 1, . . . , T − 1, and
V ∗T (u,XT , xT−1) = maxxT∈XT
{Pu,xT−1(xT )
}.
To complete the reduction argument, we observe that there exists a connected path of arcs in E that
visits any vertex in V exactly once if and only if V ∗t (u,X1, x0) = T , and therefore, by obtaining a solution
to the CRP one solves the HPP. Since the HPP is NP-hard, the CRP must be NP-hard as well. This
concludes the proof.
Proof of Proposition 2. To analyze the performance gap between an optimal recommendations and
a sequence of myopic recommendations, we focus on a special case of the CRP in which: T = |X0| − `;
ut = u0 = u for all t = 1, . . . , T (the reader type is fixed, and independent of the length of her path and
on the articles she visits along her path); ` = 1, i.e., every recommendation consists of a single link; and
w(x) = 1 for any available article x. Whenever an article x hosts a recommendation A that includes a
link to article y, we denote for simplicity Pu,x,y(A) = Pu,x(y). Then, the CRP in (5) can be written as:
V ∗t (u,Xt, xt−1) = maxxt∈Xt)
{Pu,xt−1(xt)
(1 + V ∗t+1(u,Xt+1, xt)
)},
for t = 1, . . . , T − 1, and
V ∗T (u,XT , xT−1) = maxxT∈XT
{Pu,xT−1(xT )
}.
Fix u ∈ U and ε ∈ (0, 1/2). Consider the next construction of a set of available articles and a set of
transition probabilities (X0,Pu0 ) ∈ GT+1, with a selection x0 ∈ X0, in which there exists a sequence of
articles x0, . . . , xT , such that:
Pu,x(y) =
1/2− ε if x = x0 and y = x1
1 if x = xt−1 and y = xt for some t ∈ {2, . . . , T}
1/2 + ε if x = x0 and y = xT
0 otherwise.
Then, the optimal schedule of recommendation is to recommend article xt at epoch t, generating
(1/2− ε)T expected clicks. Moreover, any myopic schedule of recommendation will begin with rec-
6

ommending xT at epoch t = 1, generating (1/2 + ε) expected clicks. Therefore, one has:
inf(X0,Pu
0 )∈GT+1,x0∈X0,u∈U
{V m
1 (u,X1, x0)
V ∗1 (u,X1, x0)
}≤
12 + ε(
12 − ε
)T−→ 0 as T →∞,
which concludes the proof.
Proof of Proposition 3. We consider a special case of the CRP in which: ut = u0 = u for all
t = 1, . . . , T ; ` = 1, i.e., every recommendation consists of a single link; and w(x) = 1 for any
available article x. Whenever a an article x hosts a recommendation A that includes a link to ar-
ticle y, we denote for simplicity Pu,x,y(A) = Pu,x(y). Recall that the set X is defined by X =
{(γ, β) : −1 ≤ γ ≤ 1, −1 ≤ β ≤ 1, β ≤ 2− ε− γ}, for some ε ∈ [0, 1]. The set X is depicted in Figure
B-4. In addition, let the efficient frontier set X ∗ be defined as:
1
1
ε
ε y
εyχ
β
γ
(engageability)
(clickability)
χ*
Figure B-4: Convex set of available articles. The optimal recommendation schedule is dominated by apolicy that recommends y at any epoch (if y was an available article). The best one-step look-ahead scheduledominates a policy that recommends yε at each epoch.
X ∗ = {(γ, β) : −1 ≤ γ ≤ 1, −1 ≤ β ≤ 1, β = 2− ε− γ} .
The set X ∗ is depicted in Figure B-4. Consider the one-step look-ahead policy, defined by
V onet (u,X , xt−1) = Pu,xt−1(xt)
(1 + V one
t+1 (u,X , xt)),
for t = 1, . . . , T − 1, where
xt ∈ arg maxy∈X
{Pu,xt−1(y)
(1 + max
xt+1∈X{Pu,y(xt+1)}
)},
for t = 1, . . . , T − 1, and where the last recommendation is simply myopic. For each t ∈ {1, . . . , T} we
denote by γt and βt the clickability and the engageability values of xt, the article which is recommended
at step t. We denote the point (1−ε, 1−ε) by yε (see Figure B-4). Since for any u ∈ U , V onet (u,X , xt−1)
is increasing in γt and βt for all t ∈ {1, . . . , T}, any point that is selected by the one-step lookahead
policy belongs to the set X ∗. Moreover,
7

V one1 (u,X , x0) ≥ Pu,x0(yε)
T∏t=2
(1 + Pu,yε(yε)) ,
for any u ∈ U and x0 ∈ X . In words, the one-step look-ahead policy performs at least as well as a policy
that selects yε at each epoch. Next, consider the optimal recommendation schedule, defined by
V ∗t (u,X , xt−1) = maxy∈X
{Pu,xt−1(xt)
(1 + V ∗t+1(u,X , xt)
)},
for t = 1, . . . , T − 1, where the last recommendation is myopic. We denote the point (1, 1) by y (see
Figure B-4). Clearly, y does not belong to X . Moreover, since V ∗1 (u,X , x0) is increasing in γt and βt
for all t ∈ {1, . . . , T}, one has that
V ∗1 (u,X , x0) ≤ Pu,x0(y)T∏t=2
(1 + Pu,y(y)) ,
for any u ∈ U and x0 ∈ X . In words, the optimal recommendation schedule performs at most as well
as a policy that selects y at each epoch. Moreover, one has:
Pu,x0(yε)
Pu,x0(y)=
eα+θu+βx0+1−ε
1 + eα+θu+βx0+1−ε ·1 + eα+θu+βx0+1
eα+θu+βx0+1
= e−ε · 1 + eα+θu+βx0+1
1 + eα+θu+βx0+1−ε ≥ e−ε, (B-3)
for any u ∈ U and x0 ∈ X . In addition, we have:
Pu,yε(yε)Pu,y(y)
=eα+θu+2−2ε
1 + eα+θu+2−2ε· 1 + eα+θu+2
eα+θu+2
= e−2ε · 1 + eα+θu+2
1 + eα+θu+2−2ε≥ e−2ε, (B-4)
for any u ∈ U . Therefore, one has for any u ∈ U , x0 ∈ X , and δ ≥ δε:
V one1 (u,X , x0)
V ∗1 (u,X , x0)≥
Pu,x0(yε)∏Tt=2 (1 + Pu,yε(yε))
Pu,x0(y)∏Tt=2 (1 + Pu,y(y))
(a)
≥ e−2ε ·T∏t=2
(1 + Pu,yε(yε)1 + Pu,y(y)
)(b)
≥ e−2ε ·T∏t=2
(1 + e−2εPu,y(y)
1 + Pu,y(y)
)(c)
≥ e−2ε ·T∏t=2
(1 + e−2εp
1 + p
)= e−2ε ·
(1 + e−2εp
1 + p
)T−1
,
where: (a) holds by (B-3); (b) holds by (B-4); and (c) holds since Pu,y(y) ≤ p for all u ∈ U . This
concludes the proof.
8