optimization of an adapta™ kinase assay for camk1®optimization of the concentration of alexa...
TRANSCRIPT

Optimization of an Adapta™ Kinase Assay for CAMK1
Overview This protocol describes how to perform an Adapta™ assay with the kinase CAMK1. To maximize the ability of the assay to detect ATP-competitive inhibitors, we developed the assay using 100 μM ATP. However, the assay could be re-optimized for other ATP concentrations in an analogous manner. A typical procedure is as follows:
1. Optimization of the concentration of Alexa Fluor® 647 ADP tracer to be used in the assay A tracer titration is performed to determine the optimal concentration of tracer to elicit an approximately 50% change between the minimum and maximum TR-FRET emission ratios (the EC50 value) at the desired ATP concentration. For this particular protocol, the optimal concentration of tracer has already been determined and the tracer optimization step is skipped to save time and reagents. However, if either the assay buffer or ATP concentration are modified, optimization of the Alexa Fluor® 647 ADP Tracer concentration should be repeated. Detailed instructions on how to perform a tracer optimization is available in Appendix A.
2. Optimization of the concentration of kinase to be used in the assay.
Using the optimal tracer concentration determined above, a kinase titration is then performed to determine the concentration of kinase required to elicit an approximately 80% change in the assay signal (i.e. the EC80). This is the concentration of kinase that will be used in an assay to determine an IC50 value for an inhibitor.
3. Inhibitor titrations Using the kinase concentration determined above, the reaction is then performed in the presence of a dilution series of inhibitor, and the amount of inhibitor required to elicit a 50% change in TR-FRET ratio (the IC50) is determined.
The data presented in this document is example data that was generated at Invitrogen. Specific results may vary based upon a variety of factors including the specific activity of the kinase, or the particular plate reader being used. In particular, the Emission Ratio measured can vary greatly between instruments. However, the quality of the data generated should be comparable to the data presented here. If you are reproducing the work presented in this document you should move between the various steps using the values determined in your experiments. If you are having trouble reproducing the data presented here, please do not hesitate to contact Invitrogen Technical Services or your Invitrogen representative.
1
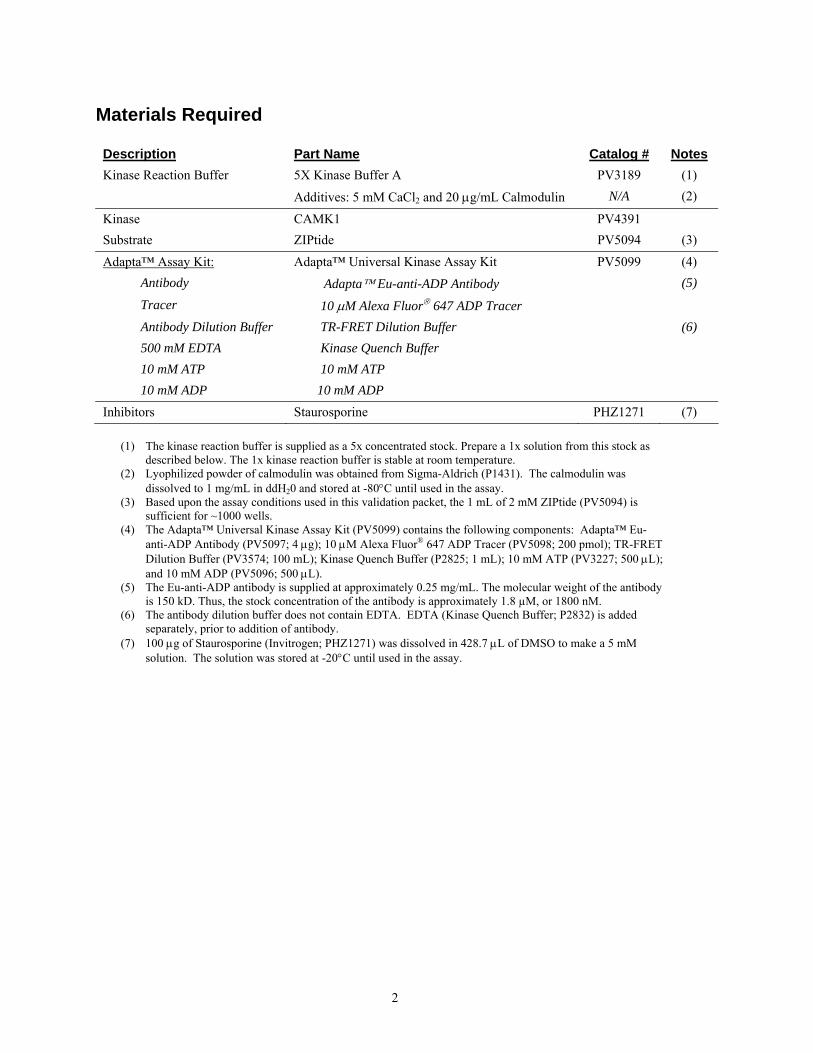
Materials Required Description Part Name Catalog # Notes
Kinase Reaction Buffer 5X Kinase Buffer A PV3189 (1) Additives: 5 mM CaCl2 and 20 μg/mL Calmodulin N/A (2)
Kinase CAMK1 PV4391 Substrate ZIPtide PV5094 (3)
Adapta™ Assay Kit: Adapta™ Universal Kinase Assay Kit PV5099 (4) Antibody Adapta™ Eu-anti-ADP Antibody (5)
Tracer 10 μM Alexa Fluor® 647 ADP Tracer
Antibody Dilution Buffer TR-FRET Dilution Buffer (6) 500 mM EDTA Kinase Quench Buffer 10 mM ATP 10 mM ATP 10 mM ADP 10 mM ADP
Inhibitors Staurosporine PHZ1271 (7)
(1) The kinase reaction buffer is supplied as a 5x concentrated stock. Prepare a 1x solution from this stock as described below. The 1x kinase reaction buffer is stable at room temperature.
(2) Lyophilized powder of calmodulin was obtained from Sigma-Aldrich (P1431). The calmodulin was dissolved to 1 mg/mL in ddH20 and stored at -80°C until used in the assay.
(3) Based upon the assay conditions used in this validation packet, the 1 mL of 2 mM ZIPtide (PV5094) is sufficient for ~1000 wells.
(4) The Adapta™ Universal Kinase Assay Kit (PV5099) contains the following components: Adapta™ Eu-anti-ADP Antibody (PV5097; 4 μg); 10 μM Alexa Fluor® 647 ADP Tracer (PV5098; 200 pmol); TR-FRET Dilution Buffer (PV3574; 100 mL); Kinase Quench Buffer (P2825; 1 mL); 10 mM ATP (PV3227; 500 μL); and 10 mM ADP (PV5096; 500 μL).
(5) The Eu-anti-ADP antibody is supplied at approximately 0.25 mg/mL. The molecular weight of the antibody is 150 kD. Thus, the stock concentration of the antibody is approximately 1.8 µM, or 1800 nM.
(6) The antibody dilution buffer does not contain EDTA. EDTA (Kinase Quench Buffer; P2832) is added separately, prior to addition of antibody.
(7) 100 μg of Staurosporine (Invitrogen; PHZ1271) was dissolved in 428.7 μL of DMSO to make a 5 mM solution. The solution was stored at -20°C until used in the assay.
2

Adapta™ Assay at a Glance
10 L
Incubate for 1 hr
15 L
Equilibrate for 0.5 hr
Read Plate
Stop/Detection StepAdd 5 L of Ab +
Tracer + EDTA solution
Kinase ReactionKinase + Substrate + ATP
Final Assay Conditions: Kinase Reaction (10 μL) Stop/Detection Step (15 μL)
CAMK1 Variable Kinase Quench Buffer (EDTA) 10 mM ZIPtide 200 μM Adapta Eu-anti-ADP Antibody 2 nM ATP 100 μM Alexa Fluor® 647 ADP Tracer 45.9 nM
3
Preparing the Kinase Reaction Buffer Prepare a 1x solution of kinase reaction buffer from the 5x Kinase Buffer A stock (listed above) by adding 2 mL of 5X stock to 8 mL of H2O to make 10 mL of 1X kinase reaction buffer. To this, add 50 μL of 1M CaCl2 and 200 μL of 1 mg/mL of calmodulin.
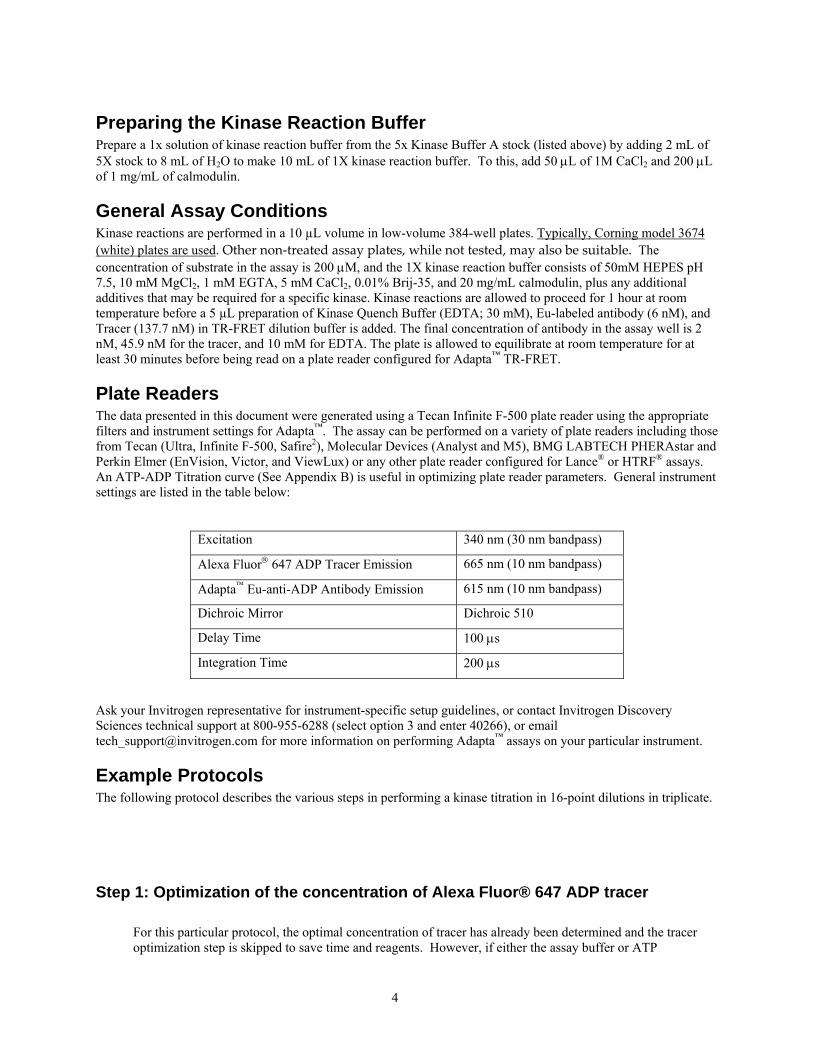
General Assay Conditions Kinase reactions are performed in a 10 µL volume in low-volume 384-well plates. Typically, Corning model 3674 (white) plates are used. Other non‐treated assay plates, while not tested, may also be suitable. The concentration of substrate in the assay is 200 μM, and the 1X kinase reaction buffer consists of 50mM HEPES pH 7.5, 10 mM MgCl2, 1 mM EGTA, 5 mM CaCl2, 0.01% Brij-35, and 20 mg/mL calmodulin, plus any additional additives that may be required for a specific kinase. Kinase reactions are allowed to proceed for 1 hour at room temperature before a 5 µL preparation of Kinase Quench Buffer (EDTA; 30 mM), Eu-labeled antibody (6 nM), and Tracer (137.7 nM) in TR-FRET dilution buffer is added. The final concentration of antibody in the assay well is 2 nM, 45.9 nM for the tracer, and 10 mM for EDTA. The plate is allowed to equilibrate at room temperature for at least 30 minutes before being read on a plate reader configured for Adapta™ TR-FRET.
Plate Readers The data presented in this document were generated using a Tecan Infinite F-500 plate reader using the appropriate filters and instrument settings for Adapta™. The assay can be performed on a variety of plate readers including those from Tecan (Ultra, Infinite F-500, Safire2), Molecular Devices (Analyst and M5), BMG LABTECH PHERAstar and Perkin Elmer (EnVision, Victor, and ViewLux) or any other plate reader configured for Lance® or HTRF® assays. An ATP-ADP Titration curve (See Appendix B) is useful in optimizing plate reader parameters. General instrument settings are listed in the table below:
Excitation 340 nm (30 nm bandpass)
Alexa Fluor® 647 ADP Tracer Emission 665 nm (10 nm bandpass)
Adapta™ Eu-anti-ADP Antibody Emission 615 nm (10 nm bandpass)
Dichroic Mirror Dichroic 510
Delay Time 100 μs
Integration Time 200 μs
Ask your Invitrogen representative for instrument-specific setup guidelines, or contact Invitrogen Discovery Sciences technical support at 800-955-6288 (select option 3 and enter 40266), or email [email protected] for more information on performing Adapta™ assays on your particular instrument.
Example Protocols The following protocol describes the various steps in performing a kinase titration in 16-point dilutions in triplicate.
Step 1: Optimization of the concentration of Alexa Fluor® 647 ADP tracer
For this particular protocol, the optimal concentration of tracer has already been determined and the tracer optimization step is skipped to save time and reagents. However, if either the assay buffer or ATP
4
concentration are modified, optimization of the Alexa Fluor® 647 ADP Tracer concentration should be repeated. Detailed instructions on how to perform a tracer optimization is available in Appendix A.
Step 2: Optimization of the concentration of kinase to be used in the assay
(2.1) In an appropriate tube or vial, prepare 100 µL of kinase in kinase reaction buffer at 2 times the highest concentration of kinase to be tested. In this example, 10 µg/mL (10,000 ng/mL) is the desired highest concentration of kinase to be tested, and the stock concentration of kinase was 360 µg/mL.
Calculation: Kinase: Stock = 360 µg/mL 1x = 10 µg/mL 2x = 20 µg/mL
[Initial] [Final 2x]
Kinase: 5.6 μL * 360 μg/mL = 100 μL * 20 μg/mL
Buffer: 94.4 μL kinase reaction buffer
Procedure: Add 5.6 µL of 360 µg/mL kinase to 94.4 µL kinase reaction buffer.
Keep the diluted kinase on ice until needed.
(2.2) In a low-volume 384-well plate, fill each well in columns 1–3, rows 2 through 16 (B through P) with 5 µL of kinase reaction buffer. Place 10 µL of the kinase solution as prepared above in the top well of each column, and then perform a 2-fold serial dilution down the plate by removing 5 µL of kinase from the top well, adding this to the well below, mixing, and repeating with the next well below. Discard 5 µL of solution from the bottom well such that each well contains 5 µL of kinase solution.
(2.3) In an appropriate container, prepare 1 mL of a solution of substrate and ATP in kinase reaction buffer at 2 times the final concentration of each reagent desired in the assay.
If a 1000 µL solution is prepared in a plastic reagent reservoir (trough), then the next addition step can be performed with a multichannel pipette.
Calculations:
Substrate: Stock = 2 mM 1x = 0.2 mM 2x = 0.4 mM ATP: Stock = 10 mM 1x = 0.1 mM 2x = 0.2 mM
[Initial] [Final 2x]
Substrate: 200 µL * 2 mM = 1000 µL * 0.4 mM
ATP: 20 µL * 10 mM = 1000 µL * 0.2 mM
Buffer: 780 µL kinase reaction buffer
Procedure: Add 200 µL of ZIPtide and 20 µL of 10 mM ATP to 780 µL kinase reaction buffer.
(2.4) Start the kinase reaction by adding 5 µL of the substrate + ATP solution prepared in step 2.3 to each well of the assay plate.
(2.5) Cover the assay plate and allow reaction to proceed for 1 hour at room temperature.
(2.6) *Optional Step* An ATP-ADP titration curve can be used to assure that the assay is being performed under conditions of initial rates (typically, < 20% conversion of substrate to product) as well as to create a standard curve to calculate substrate conversion values from the raw TR-FRET emission ratios (Appendix C). While
5

the kinase reaction is incubating, you can prepare an ATP-ADP titration curve as outlined in Appendix B and add the solution to the appropriate wells of the 384-well plate.
(2.7) Prior to completion of the kinase reaction, prepare 1 mL of a solution of EDTA (Kinase Quench Buffer), Eu-anti-ADP antibody, and ADP Tracer at 3 times the desired final concentrations of each reagent in TR-FRET dilution buffer. The antibody is stable in EDTA for several hours, but because it is sensitive to high concentrations of EDTA, we recommend first adding the concentrated EDTA to the dilution buffer, mixing the solution well, and then adding the antibody before mixing further.
Calculations:
Kinase Quench buffer (EDTA): Stock = 500 mM 1x = 10 mM 3x = 30 mM Antibody: Stock = 1800 nM 1x = 2 nM 3x = 6 nM Tracer: Stock = 10.0 μM 1x = 0.0459 μM 3x = 0.1377 μM
[Initial] [Final 2x]
EDTA: 60 µL * 500 mM = 1000 µL * 30 mM
Antibody: 3.3 µL * 1800 nM = 1000 µL * 6 nM
Tracer: 13.8 µL * 10.0 μM = 1000 µL * 0.1377 μM
Buffer: 922.9 µL TR-FRET Dilution Buffer
Procedure: Kinase Quench Buffer (EDTA), 3.3 µL of 1800 nM antibody and 13.8 µL of 10 μM Tracer to
(2.8) DTA solution prepared in step 2.7 to each well of the assay plate and
(2.9) for at least 30 minutes at room temperature before
(2.10) ainst the concentration of kinase (ng/mL). The amount of
late
F=80 80=logECF-(1/HillSlope)*log(F/(100-F))
HillSlope))
Figure 1: Example of Kin
Add 60 µL of 922.9 µL TR-FRET Dilution Buffer.
Add 5µL of the Tracer + Antibody + Emix briefly, either by pipette or on a plate shaker.
Cover the assay plate and allow the plate to equilibrate reading on an appropriate plate reader.
Plot the resulting TR-FRET emission ratio agkinase necessary to displace 80% of the ADP tracer from the antibody (i.e. observe a ~80% decrease in assay signal, the EC80) is the concentration of kinase that will be used in the inhibitor titration experiments to determine an IC50 values. Fit the data to a sigmoidal dose-response curve with a variable slope and calcuthe EC80 concentration from the curve. The following equation can be used with GraphPad™ Prism® software:
logECY=Bottom+(Top-Bottom)/(1+10^((LogEC50-X)*
ase Titration at 100 μM ATP
6
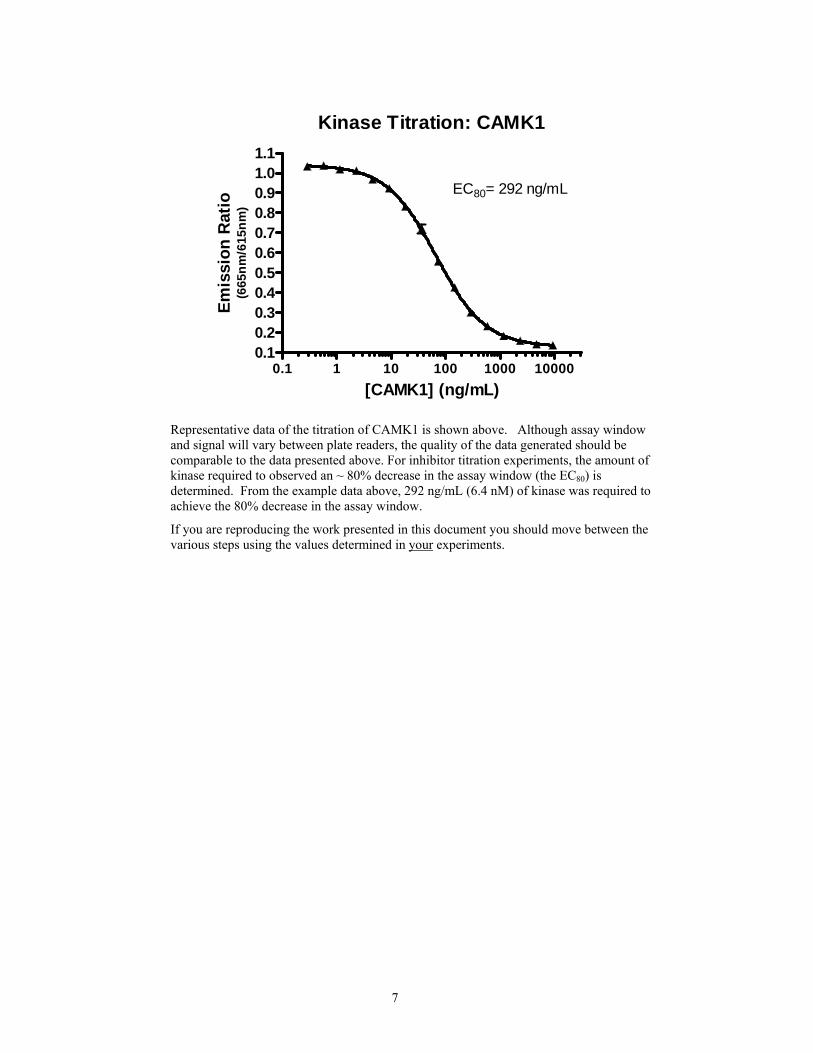
Kinase Titration: CAMK1
0.1 1 10 100 1000 100000.10.20.30.40.50.60.70.80.91.01.1
EC80= 292 ng/mL
[CAMK1] (ng/mL)
Emis
sion
Rat
io(6
65nm
/615
nm)
Representative data of the titration of CAMK1 is shown above. Although assay window and signal will vary between plate readers, the quality of the data generated should be comparable to the data presented above. For inhibitor titration experiments, the amount of kinase required to observed an ~ 80% decrease in the assay window (the EC80) is determined. From the example data above, 292 ng/mL (6.4 nM) of kinase was required to achieve the 80% decrease in the assay window.
If you are reproducing the work presented in this document you should move between the various steps using the values determined in your experiments.
7
Step 3: Inhibitor Titrations The general procedure for determining an inhibitor IC50 value is as follows:
1. Add 2.5 µL of inhibitor in 4% DMSO at 4-fold the final assay concentration to triplicate assay wells.
2. To start the reaction, add 2.5 µL of kinase at 4-fold the final assay concentration, followed by a 5 µL addition of substrate and ATP at 2-fold the final reaction concentrations.
3. The remainder of the protocol is similar to previous steps.
A more detailed protocol follows.
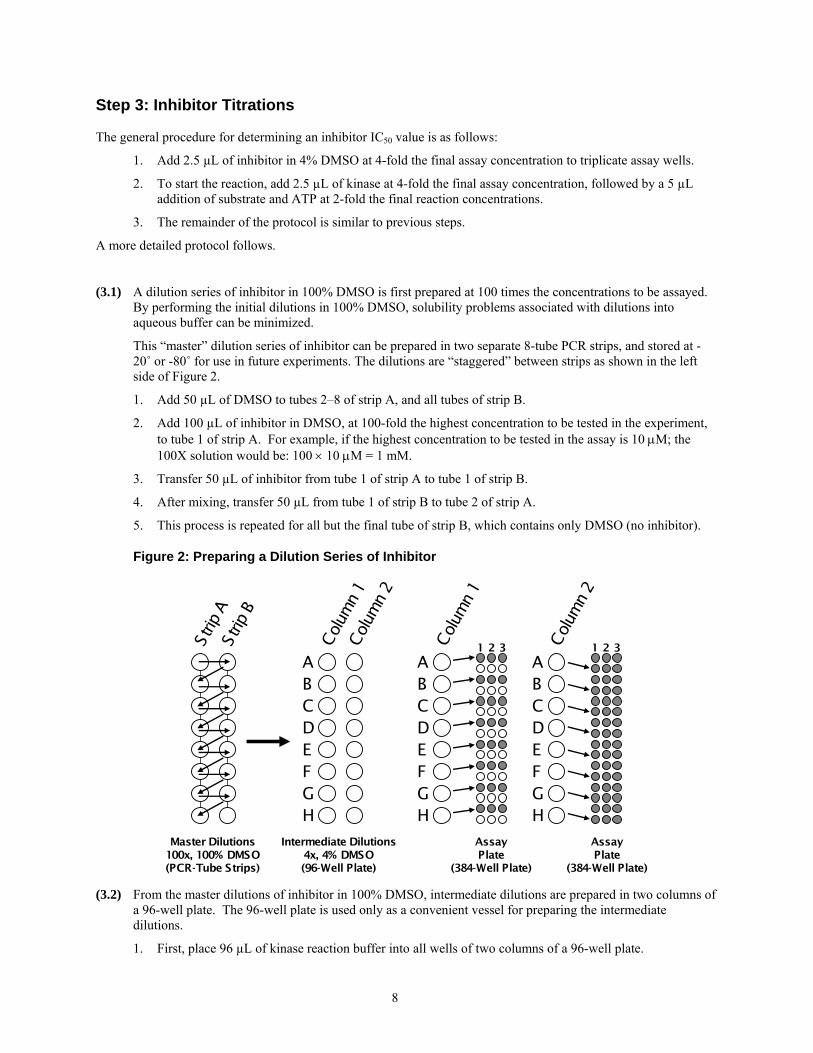
(3.1) A dilution series of inhibitor in 100% DMSO is first prepared at 100 times the concentrations to be assayed. By performing the initial dilutions in 100% DMSO, solubility problems associated with dilutions into aqueous buffer can be minimized.
This “master” dilution series of inhibitor can be prepared in two separate 8-tube PCR strips, and stored at -20˚ or -80˚ for use in future experiments. The dilutions are “staggered” between strips as shown in the left side of Figure 2.
1. Add 50 µL of DMSO to tubes 2–8 of strip A, and all tubes of strip B.
2. Add 100 µL of inhibitor in DMSO, at 100-fold the highest concentration to be tested in the experiment, to tube 1 of strip A. For example, if the highest concentration to be tested in the assay is 10 μM; the 100X solution would be: 100 × 10 μM = 1 mM.
3. Transfer 50 µL of inhibitor from tube 1 of strip A to tube 1 of strip B.
4. After mixing, transfer 50 µL from tube 1 of strip B to tube 2 of strip A.
5. This process is repeated for all but the final tube of strip B, which contains only DMSO (no inhibitor).
Figure 2: Preparing a Dilution Series of Inhibitor
Strip
ASt
rip B
Col
umn
1Col
umn
2
ABCDEFGH
Col
umn
1
ABCDEFGH
ABCDEFGH
Col
umn
2
Master Dilutions100x, 100% DMSO(PCR-Tube Strips)
Intermediate Dilutions4x, 4% DMSO(96-Well Plate)
AssayPlate
(384-Well Plate)
AssayPlate
(384-Well Plate)
1 2 31 2 3
(3.2) From the master dilutions of inhibitor in 100% DMSO, intermediate dilutions are prepared in two columns of
a 96-well plate. The 96-well plate is used only as a convenient vessel for preparing the intermediate dilutions.
1. First, place 96 µL of kinase reaction buffer into all wells of two columns of a 96-well plate.
8

2. Then, transfer 4 µL of the master inhibitor stock from strip A into column 1 of the 96 well plate, and 4 µL of the master inhibitor stock from strip B into column 2 of the 96-well plate.
3. Mix the solutions well, either with a plate shaker or by mixing with a 20 µL multichannel pipette.
4. Using an 8-channel pipette, add 2.5 µL of inhibitor from the intermediate dilution in the 96-well plate to the 384-well assay plate as shown in figure 2. Use column 1 of the intermediate stock to fill rows A, C, E, etc. of the 384-well assay plate, and column 2 to fill the alternating rows B, D, F, etc.
(3.3) Prepare a 1 mL solution of kinase in kinase reaction buffer at 4x the final desired reaction concentration of the kinase. From the kinase titration experiment in Step 2, 292 ng/mL of CAMK1 was determined to be the concentration required for the assay.
Calculation:
Kinase: Stock = 360 μg/mL 1x = 0.292 μg/mL 4x = 1.168 μg/mL [Initial] [Final 4x]
Kinase: 3.2 µL * 360 μg/mL = 1000 μL * 1.168 μg/mL
Buffer: 996.8 μL kinase reaction buffer
Procedure:
Add 3.2 µL of 360 μg/mL kinase to 996.8 µL kinase reaction buffer. (3.4) Add 2.5 µL of the kinase solution prepared in step 3.3 to each well of the assay plate.
(3.5) In an appropriate container, prepare 1 mL of a solution of substrate and ATP in kinase reaction buffer at 2 times the final concentration of each reagent desired in the assay.
If a 1000 µL solution is prepared in a plastic reagent reservoir (trough), then the next addition step can be performed with a multi-channel pipette.
Calculations:
Substrate: Stock = 2 mM 1x = 0.2 mM 2x = 0.4 mM ATP: Stock = 10 mM 1x = 0.1 mM 2x = 0.2 mM
[Initial] [Final 2x]
Substrate: 200 µL * 2 mM = 1000 µL * 0.4 mM
ATP: 20 µL * 10 mM = 1000 µL * 0.2 mM
Buffer: 780 µL kinase reaction buffer
Procedure: Add 200 µL of ZIPtide and 20 µL of 10 mM ATP to 780 µL kinase reaction buffer.
(3.6) Start the kinase reaction by adding 5 µL of the substrate + ATP solution prepared in step 3.5 to each well of the assay plate.
(3.7) Cover the assay plate and allow reaction to proceed for 1 hour at room temperature.
(3.8) *Optional Step* An ATP-ADP titration curve can be used to assure that the assay is being performed under conditions of initial rates (typically, < 20% conversion of substrate to product) as well as to create a standard curve to calculate substrate conversion values from the raw TR-FRET emission ratios (Appendix C). While the kinase reaction is incubating, you can prepare an ATP-ADP titration curve as outlined in Appendix B and add the solution to the appropriate wells of the 384-well plate.
9

(3.9) Prior to completion of the kinase reaction, prepare 1 mL of a solution of Kinase Quench Buffer (EDTA), Eu-anti-ADP antibody, and ADP Tracer at 3 times the desired final concentrations of each reagent in TR-FRET dilution buffer. The antibody is stable in EDTA for several hours, but because it is sensitive to high concentrations of EDTA we recommend first adding the concentrated EDTA to the dilution buffer, mixing the solution well, and then adding the antibody before mixing further.
Calculations:
Kinase Quench buffer (EDTA): Stock = 500 mM 1x = 10 mM 3x = 30 mM Antibody: Stock = 1800 nM 1x = 2 nM 3x = 6 nM Tracer: Stock = 10.0 μM 1x = 0.0459 μM 3x = 0.1377 μM
[Initial] [Final 2x]
EDTA: 60 µL * 500 mM = 1000 µL * 30 mM
Antibody: 3.3 µL * 1800 nM = 1000 µL * 6 nM
Tracer: 13.8 µL * 10.0 μM = 1000 µL * 0.1377 μM
Buffer: 922.9 µL TR-FRET Dilution Buffer
Procedure: Kinase Quench Buffer (EDTA), 3.3 µL of 1800 nM antibody and 13.8 µL of 10 μM Tracer to
(3.10) DTA solution prepared in step 3.9 to each well of the assay plate and
(3.11) rate for 30 minutes at room temperature before reading on
(3.12) n ratio against the concentration of inhibitor, and fit the data to a
tration
ay be advantageous to graph the inhibition
% inhibition = 100 × (Ratio
Add 60 µL of 922.9 µL TR-FRET Dilution Buffer.
Add 5µL of the Tracer + Antibody + Emix briefly, either by pipette or on a plate shaker.
Cover the assay plate and allow the plate to equiliban appropriate plate reader.
Plot the resulting TR-FRET emissiosigmoidal dose-response curve with a variable slope. Alternatively, the data can also be plotted as % conversion versus the concentration of inhibitor as outline in Appendix C. Calculate the EC50 concenfrom the curve. This is equal to the IC50 value for the inhibitor.
For the comparison of inhibitors across multiple experiments, it mtitrations as % inhibition (instead of TR-FRET ratio) versus inhibition concentration. To convert from TR-FRET ratio to % inhibition:
sample – Ratio 0% inhibition) )
The 0% inhibition value comes from a control well lacking inhibitor. The 100% inhibition value comes from
(Ratio100% inhibiton – Ratio 0% inhibition
a control well either containing a saturating amount of a known inhibitor, or lacking kinase. Because of the way the Adapta™ assay is formatted, the 100% inhibition control well cannot be a well simply lacking ATP.
10

Figure 3: Example of IC50 Curves
Inhibitor TitrationEmission Ratio vs [Inhibitor]
0.1 1 10 100 1000 100000.30.40.50.60.70.80.91.01.11.2
[Inhibitor] (nM)
Emis
sion
Rat
io(6
65nm
/615
nm)
Inhibitor Titration% Conversion vs. [Inhibitor]
0.1 1 10 100 1000 100000
1
2
3
4
5
6
[Inhibitor] (nM)
% C
onve
rsio
n
The inhibition of CAMK1 with the inhibitor Staurosporine is displayed above. The inhibition curve is plotted as both Emission ratio versus inhibitor concentration and % conversion versus inhibitor concentration (See Appendix C) for comparison.
The IC50 value for inhibition of CAMK1 with the above inhibitor is shown in the table below.
IC50 (nM) Adapta™ Assay
Kinase Inhibitor Literature From
Emission Ratio From
% Conversion CAMK1 Staurosporine NR 39.3 15.3
NR = No value reported
11

Appendix A Optimization of the concentration of Alexa Fluor® 647 ADP Tracer
(A.1) Prepare 10 mL of 1X kinase reaction buffer with 100 µM ATP.
*NOTE* The concentration of ATP added to the assay buffer should be equal to the desired concentration of ATP in the kinase reaction (in this example 100 μM).
Calculation: ATP: Stock = 10 mM 1x = 0.1 mM
[Initial] [Final]
ATP: 100 μL * 10 mM = 10000 μL 0.1 mM
Buffer: 9900 µL kinase reaction buffer
Procedure: of 10 mM ATP to 9900 µL of 1x kinase reaction buffer.
2) ADP Tracer in reaction buffer
Calculation: Stock = 10.0 µM 1x = 0.2 µM 1.5x = 0.3 µM
Procedure: of 10.0 µM ADP Tracer to 97 µL of reaction buffer with 10 µM ATP from Step A.1.
.3) 10 µL
t
(A.4)
alculations:
Buffer (EDTA): Stock = 500 mM 1x = 10 mM 3x = 30 mM
Add 100 µL
(A. In an appropriate tube or vial, prepare 100 µL of 300 nM Alexa Fluor® 647 from Step A.1 at 1.5 times the highest concentration of tracer to be tested. In this example, 200 nM was thedesired highest concentration of tracer to be tested, and the stock concentration of tracer was 10.0 µM.
ADP Tracer:
[Initial]
Add 3.0 µL
(A In a low-volume 384-well plate, fill each well in columns 1–3, rows 2 through 16 (B through P) withof reaction buffer with 100 µM ATP from Step A.1. Place 20 µL of the 300 nM tracer solution as prepared above in the top well of each column, and then perform a 2-fold serial dilution down the plate by removing 10 µL of tracer solution from the top well, adding this to the well below, mixing, and repeating with the nexwell below. Discard 10 µL of solution from the bottom well such that each well contains 10 µL of solution.
Prepare 1 mL of a solution of Kinase Quench Buffer (EDTA) and Adapta™ Eu-anti-ADP antibody at 3 times the desired final concentrations of each reagent in TR-FRET dilution buffer. The antibody is stable in EDTA for several hours, but because it is sensitive to high concentrations of EDTA we recommend first adding the concentrated EDTA to the dilution buffer, mixing the solution well, and then adding the antibody before mixing further.
C
Kinase Quench Antibody: Stock = 1800 nM 1x = 2 nM 3x = 6 nM
[Final 1.5x] ADP Tracer: 3.0 μ 100 L * 10.0 μM = μL * 0.3 μM
Buffer: 97 μL kinase eacti th P r on buffer wi 10 μM AT
12

Procedure: Kinase Quench Buffer (EDTA) and 3.3 µL of 1800 nM antibody to 936.7 µL TR-FRET
(A.5) ntibody + EDTA solution prepared in step A.4 to each assay well and mix briefly, either by
(A.6) ubate for at least 30 minutes at room temperature before reading on an
(A.7) T emission ratio against the concentration of ADP Tracer. The final concentration
50=logECF-(1/HillSlope)*log(F/(100-F)) HillSlope))
Alternatively, the a T response may be
gnal
[Initial]
Add 60 µL of Dilution Buffer.
Add 5µL of the Apipette or on a plate shaker.
Cover the assay plate and incappropriate plate reader.
Plot the resulting TR-FREof tracer in the first well was 400 nM and a 2-fold serial dilution was performed. Fit the data to a sigmoidal dose-response curve with a variable slope and calculate the EC50 concentration from the curve. The following equation can be used with GraphPad™ Prism® software:
F=50 logECY=Bottom+(Top-Bottom)/(1+10^((LogEC50-X)*
mount of ADP Tracer needed to elicit a 50% change in TR-FREestimated from a visual inspection of the curve. It is important that the EC50 concentration of the Alexa Fluor® 647 ADP Tracer determined from this titration be used in the following steps to obtain optimal siin the kinase assay.
[Final 2x] EDTA 60 µL 1000 L : * 500 mM = µ * 30 mM
Antibody: 3.3 µL * 1800 nM = 1000 µL * 6 nM
Buffer: 936.7 µL TR RE Bu-F T Dilution ffer
13
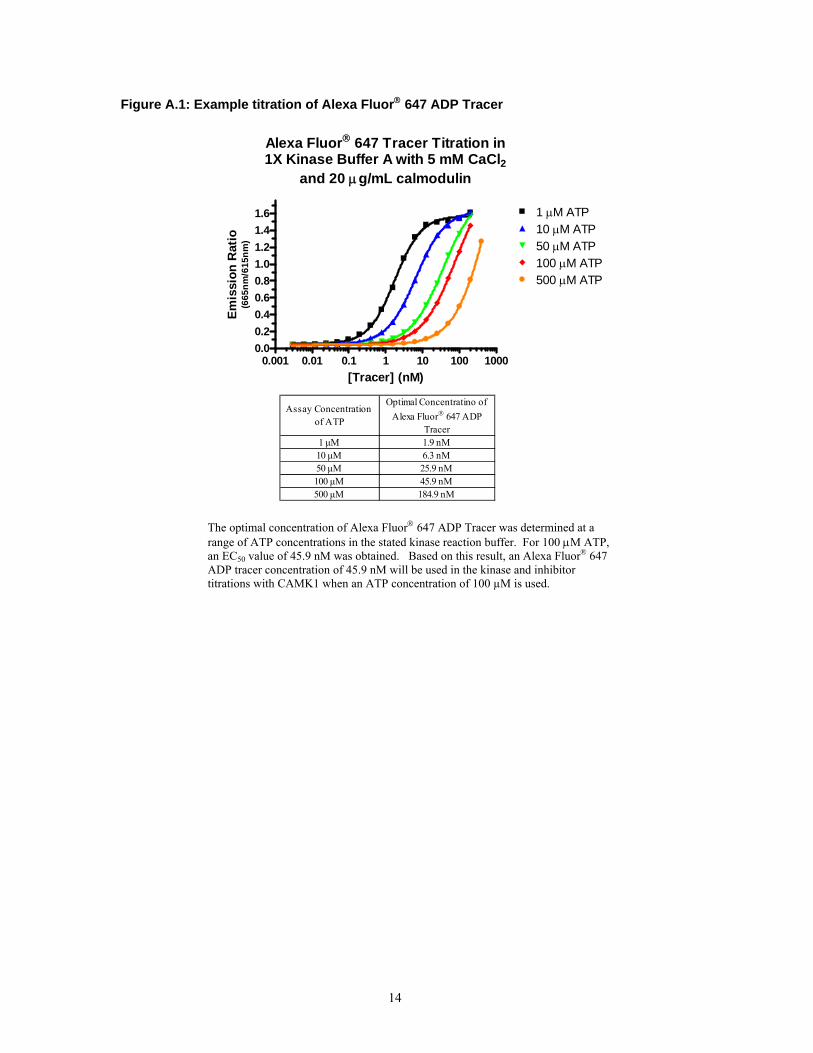
Figure A.1: Example titration of Alexa Fluor® 647 ADP Tracer
Alexa Fluor® 647 Tracer Titration in1X Kinase Buffer A with 5 mM CaCl2
and 20 μg/mL calmodulin
0.001 0.01 0.1 1 10 100 10000.00.20.40.60.81.01.21.41.6 1 μM ATP
10 μM ATP50 μM ATP100 μM ATP500 μM ATP
Assay Concentration of ATP
Optimal Concentratino of Alexa Fluor® 647 ADP
Tracer1 μM 1.9 nM10 μM 6.3 nM50 μM 25.9 nM100 μM 45.9 nM500 μM 184.9 nM
[Tracer] (nM)
Emis
sion
Rat
io(6
65nm
/615
nm)
The optimal concentration of Alexa Fluor® 647 ADP Tracer was determined at a range of ATP concentrations in the stated kinase reaction buffer. For 100 μM ATP, an EC50 value of 45.9 nM was obtained. Based on this result, an Alexa Fluor® 647 ADP tracer concentration of 45.9 nM will be used in the kinase and inhibitor titrations with CAMK1 when an ATP concentration of 100 µM is used.
14
Appendix B ATP-ADP Titration Curve
The ATP-ADP titration curve can be useful to aid in instrument optimization, or to assure that the assay is being performed under conditions of initial rates (typically, < 20% conversion of substrate to product). Since the interaction of the europium labeled antibody and the ADP tracer is dependant on the total amount of ATP and ADP present, it is important to maintain a constant nucleotide concentration in the ATP-ADP titration curve. A 1.5 fold “master” dilution series of ATP-ADP is prepared in a 96-well plate, and can be stored at room temperature until required for the assay. The dilutions are “staggered” between columns of a 96-well plate as shown in Figure B.1. The 96-well plate is used only as a convenient vessel for preparing the ATP-ADP standard curve.
*Note: If you are using the ATP-ADP Titration curve to calculate % conversion (See Appendix C), it is important to include the substrate (at the concentration used in the assay) in your ATP and ADP solutions. (B.1) Prepare a 4 mL solution of ATP and a 1 mL solution ADP such that each is at the desired concentration of
ATP that will be used in the kinase assay (i.e. if [ATP] in assay = 100 μM then prepare a 4 mL solution of 100 μM ATP and a 1 mL solution of 100 μM ADP, each in kinase assay buffer).
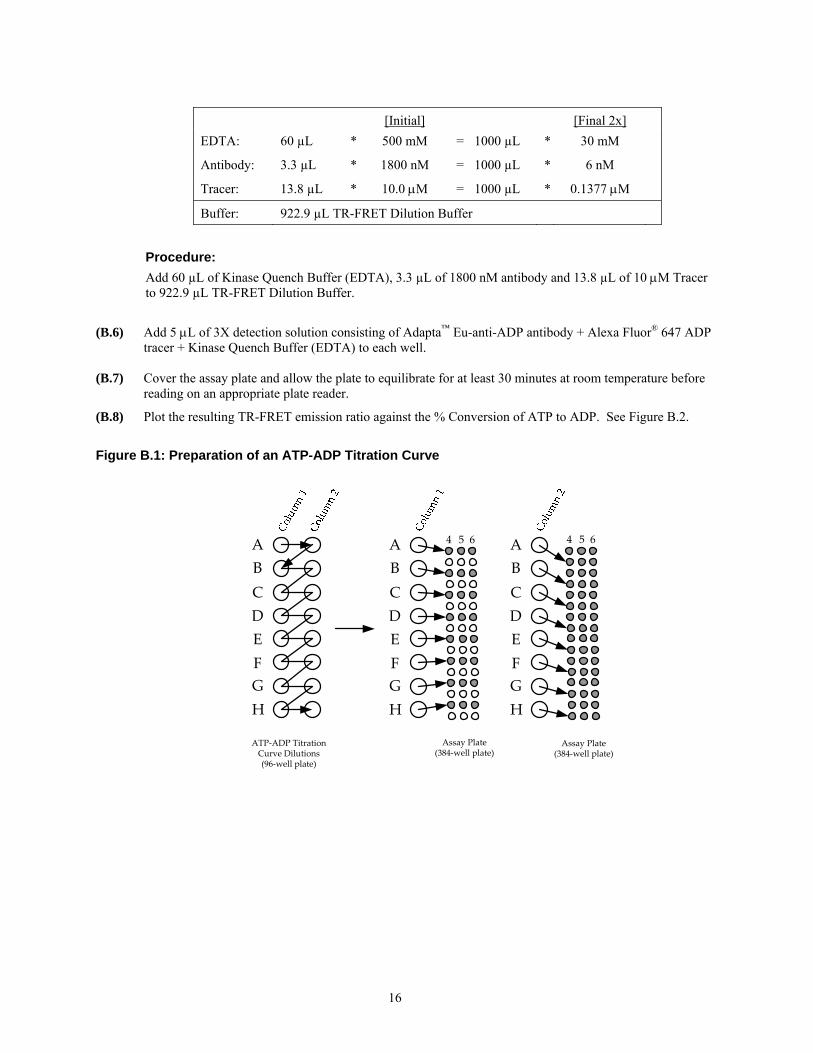
(B.2) Place 100 μL of the ATP solution to every well of Column 1 & 2 of the 96-well plate EXCEPT well A-1.
To well A-1, add 300 μL of the ADP solution. (B.3) Transfer 200 μL of solution from well A-1 to well A-2 and mix thoroughly. Next, transfer 200 μL of
solution from well A-2 to well B-1 and mix thoroughly. Repeat this process for all remaining wells, discarding 200 μL of reagent from the final well (See Figure B.1).
(B.4) Using a multi-channel pipette, transfer 10 μL of the ATP-ADP titration curve in the 96-well plate to the
respective wells of a 384-well plate as shown in Figure 6. Reagent from column 1 of the 96 well plate being placed in the 1st, 3rd, 5th (etc) rows of the 384-well plate, and reagent from column 2 of the 96 well plate being placed in alternate (2nd, 4th, etc) rows of the 384 well plate.
If you are performing the ATP-ADP Titration as a part of the kinase titration or inhibitor titration, return to the respective step within the procedure.
If you are performing the ATP-ADP Titration curve independently of the kinase and inhibitor titration experiments (i.e. as an instrument control):
(B.5) Prepare 1 mL of a solution of Kinase Quench Buffer (EDTA), Eu-anti-ADP antibody, and ADP Tracer at 3
times the desired final concentrations of each reagent in TR-FRET dilution buffer. The antibody is stable in EDTA for several hours, but because it is sensitive to high concentrations of EDTA we recommend first adding the concentrated EDTA to the dilution buffer, mixing the solution well, and then adding the antibody before mixing further.
Calculations:
Kinase Quench buffer (EDTA): Stock = 500 mM 1x = 10 mM 3x = 30 mM Antibody: Stock = 1800 nM 1x = 2 nM 3x = 6 nM Tracer: Stock = 10.0 μM 1x = 0.0459 μM 3x = 0.1377 μM
15
[Initial] [Final 2x]
EDTA: 60 µL * 500 mM = 1000 µL * 30 mM
Antibody: 3.3 µL * 1800 nM = 1000 µL * 6 nM
Tracer: 13.8 µL * 10.0 μM = 1000 µL * 0.1377 μM
Buffer: 922.9 µL TR-FRET Dilution Buffer
Procedure: Add 60 µL of Kinase Quench Buffer (EDTA), 3.3 µL of 1800 nM antibody and 13.8 µL of 10 μM Tracer
to 922.9 µL TR-FRET Dilution Buffer.
(B.6) Add 5 μL of 3X detection solution consisting of Adapta™ Eu-anti-ADP antibody + Alexa Fluor® 647 ADP
tracer + Kinase Quench Buffer (EDTA) to each well. (B.7) Cover the assay plate and allow the plate to equilibrate for at least 30 minutes at room temperature before
reading on an appropriate plate reader.
(B.8) Plot the resulting TR-FRET emission ratio against the % Conversion of ATP to ADP. See Figure B.2.
Figure B.1: Preparation of an ATP-ADP Titration Curve
ABCDEFGH
ABCDEFGH
4 5 6 ABCDEFGH
4 5 6
ATP‐ADP Titration Curve Dilutions(96‐well plate)
Assay Plate(384‐well plate)
Assay Plate(384‐well plate)
16

Figure B.2 Respective % conversion of ATP to ADP in the titration curve with a total nucleotide concentration of 100 μM. The calculations are based upon a 1.5 fold serial dilution within the ATP-ADP titration curve.
Well in 96-well plate
Correspond row in 384- well plate
% Conversion of ATP to ADP
A1 A 100.0% A2 B 66.7% B1 C 44.4% B2 D 29.6% C1 E 19.8% C2 F 13.2% D1 G 8.8% D2 H 5.9% E1 I 3.9% E2 J 2.6% F1 K 1.7% F2 L 1.2% G1 M 0.8% G2 N 0.5% H1 O 0.3% H2 P 0.2%
17

Appendix C Calculating Percent Conversion
If an ATP-ADP titration curve is performed in combination with the inhibitor titration experiments (Section 3), a percent conversion can be determined as follows:
(C.1) Plot the TR-FRET Emission Ratio vs. the % conversion of ATP to ADP for your ATP-ADP titration curve.
ATP‐ADP Titration Curve
0 10 20 30 40 50 60 70 80 90 1000.00.10.20.30.40.50.60.70.80.91.01.11.2
% Conversion (ATP→ ADP)
Emission Ratio
(665nm/615nm)
(C.2) Fit the plot to a 3-parameter hyperbolic model using an appropriate data analysis program. The following
equation can be used with GraphPad™ Prism® software:
Y= C + A*(1-(X/(B+X)))
(C.3) Calculate % conversion based upon the results in Step C.2 and the following equation:
% Conversion = B * (C + A –Ratio) (Ratio –C)
In this equation, ‘Ratio” is the TR-FRET emission value of your sample in the inhibitor experiment.
(C.4) Plot the % Conversion vs. the concentration of inhibitor and fit the data to a sigmoidal dose-response curve
with a variable slope. Calculate the EC50 concentration from the curve. This is equal to the IC50 value for the inhibitor.
18

Appendix D ATPKm, app Determination in Radiometric Assay
To facilitate inhibitor studies, ATPKm,app values were determined for the protein kinases in a radiometric assay. The kinase reaction conditions for the radiometric assays were identical to those for the AdaptaTM assays, including buffer and substrate concentrations, with the exception of variable amounts of ATP, a different enzyme concentration, and inclusion of trace γ-32P ATP. Assay conditions are summarized in Table D.1. Briefly, 30 μL kinase reactions were performed at room temperature for between 10 and 20 minutes and stopped by transferring 20 µl of reaction mix onto a P81 filter. Then the filters were washed with 0.5% phosphoric acid and water and were counted in a liquid scintillation counter. The determined ATP Km,app values are in Table D.1 and the Michaelis-Menten plot for CAMK1 is displayed in Figure D.2.
Table D.1: Reaction conditions
Enzyme Substrate Assay Buffer ATP Km,app (μM) [Enzyme](μg/mL)
CAMK1 200 μM ZIPtide Kinase Buffer A + 2 mM CaCl2 + 20 μg/mL calmodulin
845 +/- 146 μM 0.8
CDK7 200 μM Cdk7/9tide Kinase Buffer A 59 +/- 4 μM 1.67 CDK9 200 μM Cdk7/9tide Kinase Buffer A 17 +/- 1 μM 1.67 DAPK1 200 μM ZIPtide Kinase Buffer A + 2 mM CaCl2 +
20 μg/mL calmodulin 5.8 +/- 0.6 μM 0.83
LRRK2 400 μM ERM (LRRKtide) Kinase Buffer S + 2 mM DTT 57 +/- 4 μM 2.1 LRRK2 G2019S 400 μM ERM (LRRKtide) Kinase Buffer S + 2 mM DTT 134 +/-4 μM 1.0
Figure D.2: Michaelis-Menten plot for CAMK1
0 500 1000 1500 2000 25000
1000
2000
3000
4000
Best-fit values VM KMStd. Error VM KM
4406845.4
348.1146.1
[ATP] (μM)
nmol
/(min
*mg)
19