optimization of electrical power production process for the sibayak
TRANSCRIPT
GEOTHERMAL TRAINING PROGRAMME Reports 2004 Orkustofnun, Grensásvegur 9, Number 16 IS-108 Reykjavík, Iceland
349
OPTIMIZATION OF ELECTRICAL POWER PRODUCTION PROCESS FOR THE
SIBAYAK GEOTHERMAL FIELD, INDONESIA
Parlindungan Hendrick Hasoloan Siregar PERTAMINA Sibayak Geothermal Field
Jl.Teknol, Sempajaya – Berastagi North Sumatra 22156
INDONESIA
ABSTRACT
Geothermal fluid in the Sibayak geothermal field is water-dominated. Seven production wells and 3 injection wells have been drilled. The old 2 MWe turbine has operated for 7 years. Plans to develop a new power plant by using the steam resources from the wells are underway. The main objectives of this paper are to design and to determine the optimum pressure for the technical operation of the system and optimize the electrical power production process. The most important result obtained shows that the optimum wellhead pressure of wells in Sibayak is in the range 9-13 bar-a. The EES program has proven very useful for calculations giving the turbine power output as 22 MWe and the power plant’s electrical power consumption as approximately 10% of the power from the turbine. The output from the turbine increases with lower condensing pressure as does the power consumption of the plant. Consequently, low condensing pressure will reduce the output from the power plant.
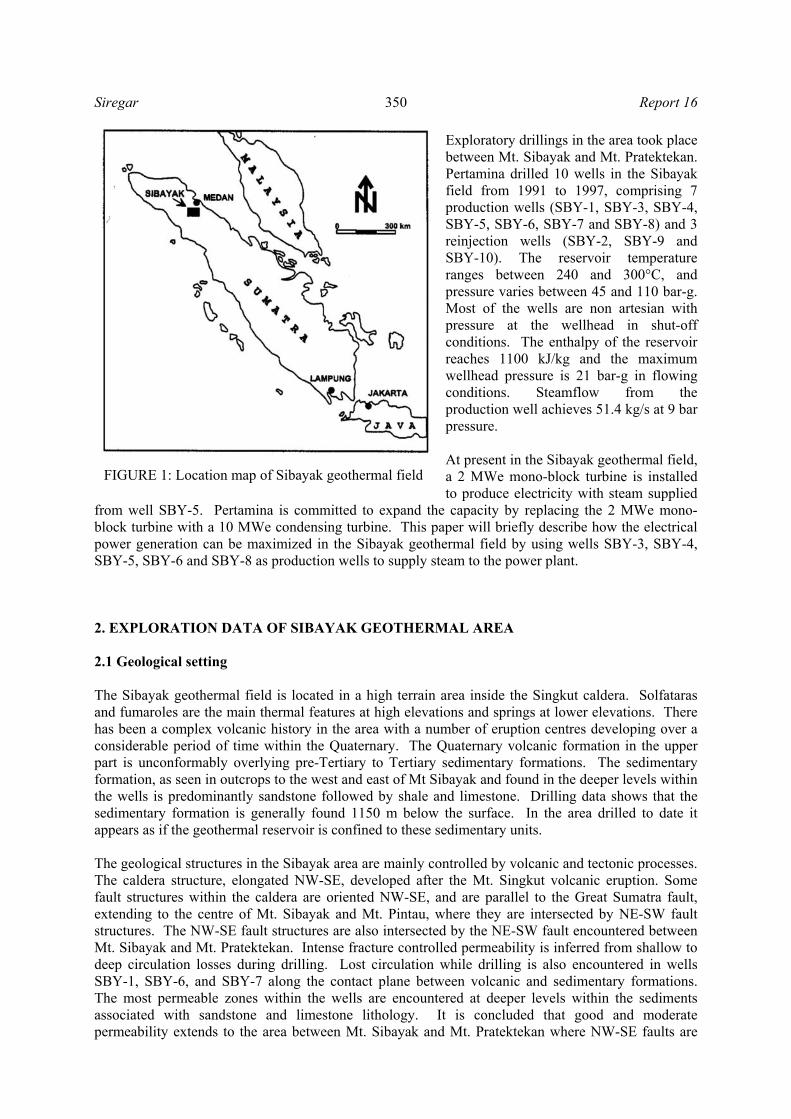
1. INTRODUCTION Sibayak is one of the Pertamina geothermal fields. It is located about 65 km southwest of Medan, the capital city of the North Sumatra Province, Indonesia (Figure 1). The Sibayak field is in high terrain and classified as a volcanic geothermal system with a liquid-dominated reservoir. The field lies inside the Singkut caldera at an elevation between 1400 and 2200 m a.s.l. and is surrounded by three active volcanoes, Mt. Pintau (2212 m), Mt. Sibayak (2090 m) and Mt. Pratektekan (1844 m). Pertamina investigated the Sibayak geothermal field using various geo-scientific methods during 1989-1991. Borehole geophysical data has been analyzed to image the conductivity distribution related to permeability in the vicinity of the production wells. The results were then integrated with production rates, permeability indications from lost circulation zones and temperature data to develop a map of reservoir permeability. It was concluded that good and moderate permeability extends to the area between Mt. Sibayak and Mt. Pratektekan where NE-SW trending faults are intersected by NW-SE trending faults. A low-permeability zone was found in the southern part of the field inside the southern caldera margin (Daud et al., 2001).
Siregar 350 Report 16
Exploratory drillings in the area took place between Mt. Sibayak and Mt. Pratektekan. Pertamina drilled 10 wells in the Sibayak field from 1991 to 1997, comprising 7 production wells (SBY-1, SBY-3, SBY-4, SBY-5, SBY-6, SBY-7 and SBY-8) and 3 reinjection wells (SBY-2, SBY-9 and SBY-10). The reservoir temperature ranges between 240 and 300°C, and pressure varies between 45 and 110 bar-g. Most of the wells are non artesian with pressure at the wellhead in shut-off conditions. The enthalpy of the reservoir reaches 1100 kJ/kg and the maximum wellhead pressure is 21 bar-g in flowing conditions. Steamflow from the production well achieves 51.4 kg/s at 9 bar pressure. At present in the Sibayak geothermal field, a 2 MWe mono-block turbine is installed to produce electricity with steam supplied
from well SBY-5. Pertamina is committed to expand the capacity by replacing the 2 MWe mono-block turbine with a 10 MWe condensing turbine. This paper will briefly describe how the electrical power generation can be maximized in the Sibayak geothermal field by using wells SBY-3, SBY-4, SBY-5, SBY-6 and SBY-8 as production wells to supply steam to the power plant. 2. EXPLORATION DATA OF SIBAYAK GEOTHERMAL AREA 2.1 Geological setting The Sibayak geothermal field is located in a high terrain area inside the Singkut caldera. Solfataras and fumaroles are the main thermal features at high elevations and springs at lower elevations. There has been a complex volcanic history in the area with a number of eruption centres developing over a considerable period of time within the Quaternary. The Quaternary volcanic formation in the upper part is unconformably overlying pre-Tertiary to Tertiary sedimentary formations. The sedimentary formation, as seen in outcrops to the west and east of Mt Sibayak and found in the deeper levels within the wells is predominantly sandstone followed by shale and limestone. Drilling data shows that the sedimentary formation is generally found 1150 m below the surface. In the area drilled to date it appears as if the geothermal reservoir is confined to these sedimentary units. The geological structures in the Sibayak area are mainly controlled by volcanic and tectonic processes. The caldera structure, elongated NW-SE, developed after the Mt. Singkut volcanic eruption. Some fault structures within the caldera are oriented NW-SE, and are parallel to the Great Sumatra fault, extending to the centre of Mt. Sibayak and Mt. Pintau, where they are intersected by NE-SW fault structures. The NW-SE fault structures are also intersected by the NE-SW fault encountered between Mt. Sibayak and Mt. Pratektekan. Intense fracture controlled permeability is inferred from shallow to deep circulation losses during drilling. Lost circulation while drilling is also encountered in wells SBY-1, SBY-6, and SBY-7 along the contact plane between volcanic and sedimentary formations. The most permeable zones within the wells are encountered at deeper levels within the sediments associated with sandstone and limestone lithology. It is concluded that good and moderate permeability extends to the area between Mt. Sibayak and Mt. Pratektekan where NW-SE faults are
FIGURE 1: Location map of Sibayak geothermal field

Report 16 351 Siregar
intersected by NE-SW faults, while a low-permeability zone is found in the southern part of the field just inside the southern caldera margin (Daud et al., 2001). Figure 2 shows a map of the Sibayak geothermal field with the locations of the wells. There are five wells drilled in Cluster A (SBY-1, SBY-2, SBY6, SBY-7, SBY-8), four wells in Cluster B (SBY-3, SBY-4, SBY-5, SBY-10) and well SBY-9 in Cluster C.
2.2 Thermal manifestations Hot springs and steaming grounds are distributed in the southwestern part of the Singkut caldera. High-temperature fumaroles and solfataras exist on the top and also on the southeastern part of Mt. Sibayak. Temperatures of hot spring water range from 30 to 63°C. The springs are slightly acidic (pH 5.5-6) but some are very acidic (pH 2.2-2.5). Chemical analysis indicates that the hot spring waters are of sulphate-chloride type. Temperatures of fumaroles range from 90-116°C and gas content is 2.7% wt. Concentrations of H2S and SO2 in the gas are 19.75 mol % and 164 ppm, respectively. Condensed water of fumarolic gases showed high chloride concentrations. Hot springs are also situated outside the caldera; at Sinabung area about 14 km southwest of Mt. Sibayak, and Negeri Suoh area about 7 km southeast of Mt. Sibayak. Discharge waters at Sinabung are of low to moderate temperature and of bicarbonate-sulphate type. Discharge waters at Negeri Suoh have temperatures in the range 40-60°C, neutral pH and bicarbonate-chloride type. Travertine and mofet deposits are found near these hot springs (Atmojo et al., 2000). 2.3 Temperature and pressure The wells of the Sibayak geothermal field are located in three clusters, A, B and C. In cluster A, SBY-1 is a vertical well, SBY-2 is a directional well to the south, while SBY-6, SBY-7 and SBY-8 are directional wells oriented to the north. In cluster B, four directional wells, SBY-3, SBY-4, SBY-5 and SBY-10, were drilled towards Mt. Sibayak. In cluster C, well SBY-9 was drilled to the northeast.
FIGURE 2: Well location map of the Sibayak geothermal field

Siregar 352 Report 16
Figure 3 (Atmojo et al., 2001) shows the temperature profiles of the wells in cluster A. Except for well SBY-2, temperatures in cluster A increase rapidly from 1200 m elevation down to about 250-400 m a.s.l. and then remain constant or increase slightly with the decreasing depth to the bottom of the wells. The maximum temperatures in wells SBY-1, SBY-6 and SBY-8 were measured to be 225, 278 and 258°C, respectively. Temperatures in well SBY-2 increase rapidly from 44°C at the elevation of 1184 m to the maximum of 165°C at elevation 800 m, then gradually decrease to 82.6°C at the bottom of well. Figure 4 (Atmojo et al., 2001) shows the temperature profiles of the wells in clusters B and C. The temperatures of wells SBY-3, SBY-4 and SBY-5 increase rapidly from 40°C near the surface down to 150-250 m a.s.l., then increase
slightly to the bottom. The maximum temperature in wells SBY-3, SBY-4 and SBY-5 were measured to be 264, 250 and 310°C, respectively. The temperatures of well SBY-10 increase gradually from 40°C at the surface to the maximum 137°C at bottom. In well SBY-9 temperatures increase rapidly from 36°C near the surface to 146°C at 1137 m a.s.l. and then increase slightly up to 205°C at the bottom of the well.
Figure 5 (Atmojo et al., 2001) shows pressure distributions at sea level. This figure indicates that the lower pressure zone extends toward Mt. Sibayak - Mt. Pratetekan and that higher pressures exist near the caldera rim. At the shallower zones, pressures show inverse conditions: higher pressures in the north and lower pressures in the south. These conditions suggest that an upflow zone of hot fluid may be present beneath the area between Mt. Sibayak and Mt. Pratetekan, with a downflow of cool water along the caldera rim.
FIGURE 3: Temperature profiles of wells SBY-1,SBY-2, SBY-6, SBY-7 and SBY-8 in cluster A
FIGURE 4: Temperature profiles of wells SBY-3, SBY-4, SBY-5, SBY-9 and SBY-10
in clusters B and C
FIGURE 5: Distribution of pressure (bar) at sea level

Report 16 353 Siregar
2.4 Chemistry of reservoir fluid Fluids discharged from wells at Sibayak geothermal field are nearly neutral (pH 6.2 - 8.2); chemical analysis from separated water indicates a high content of chloride (up to 1132 ppm) and silica (975 - 1814 ppm). Chemical analysis for non-condensable gases indicates that CO2 is dominant (80-90 mol %) for wells SBY-1, SBY-4, SBY-5 and SBY-6. 2.5 Proven reserves The geological structure of Sibayak controls the areal extent of the geothermal system that is bounded by the caldera rim at the southwestern and southern ends (Figure 6). Drilling data and geophysical data suggest that the reservoir area is approximately 2.6 km², distributed between Mt. Sibayak - Mt. Pratektekan and the caldera rim of the southern end. Power reserves are around 39 MWe. Figure 6 shows the geothermal prospect of Sibayak area. Several faults running SE-NW in this area contributed to forming the reservoir. These fault structures, accompanied by fractures in the sedimentary formation, form permeable zones where hot fluids flow. The distribution of temperature and pressure suggests that there is a recharge of high-temperature fluid at the deep zone (below -500 m) flowing upward into the area beneath Mt. Sibayak - Mt. Pratetekan, and there is a lateral flow to the southeast in the shallow zones (elevation 0-500 m). Pressure distributions at elevations 0 and 500 m a.s.l. imply an existence of no-flow barriers running southeast in the area between well pads A and B, and between well pads B and C. These barriers can be attributed to a series of formation displacements. Linear increases in temperature in the shallow zones imply conductive heat transfer and also the presence of a low-permeability formation. Figure 6 represents a conceptual model of the Sibayak field. This map is drawn in the plane of the top of Mt. Pintau and the well bottoms of SBY-4 and SBY-2. The total length of the map is 5300 m. The caldera rim is seen in the southeast part, and Mt. Sibayak and Mt. Pintau in the northwest. The upper limit of the reservoir is set at the depth of the shallowest feed zones in each well. Vertical temperature distributions show that hot fluids flow upward beneath Mt. Sibayak, then flow laterally southeast and downward near the caldera rim. In the reservoir the highest temperature of 280°C was measured beneath Mt. Sibayak in well SBY-5. Temperatures gradually decrease southward to about 200°C in well SBY-1. Hot springs and steaming ground on the surface are generally formed along the faults. A high concentration of chloride in several hot spring waters implies a direct connection between the reservoir and the hot springs.
FIGURE 6: The geothermal prospect of the Sibayak area

Siregar 354 Report 16
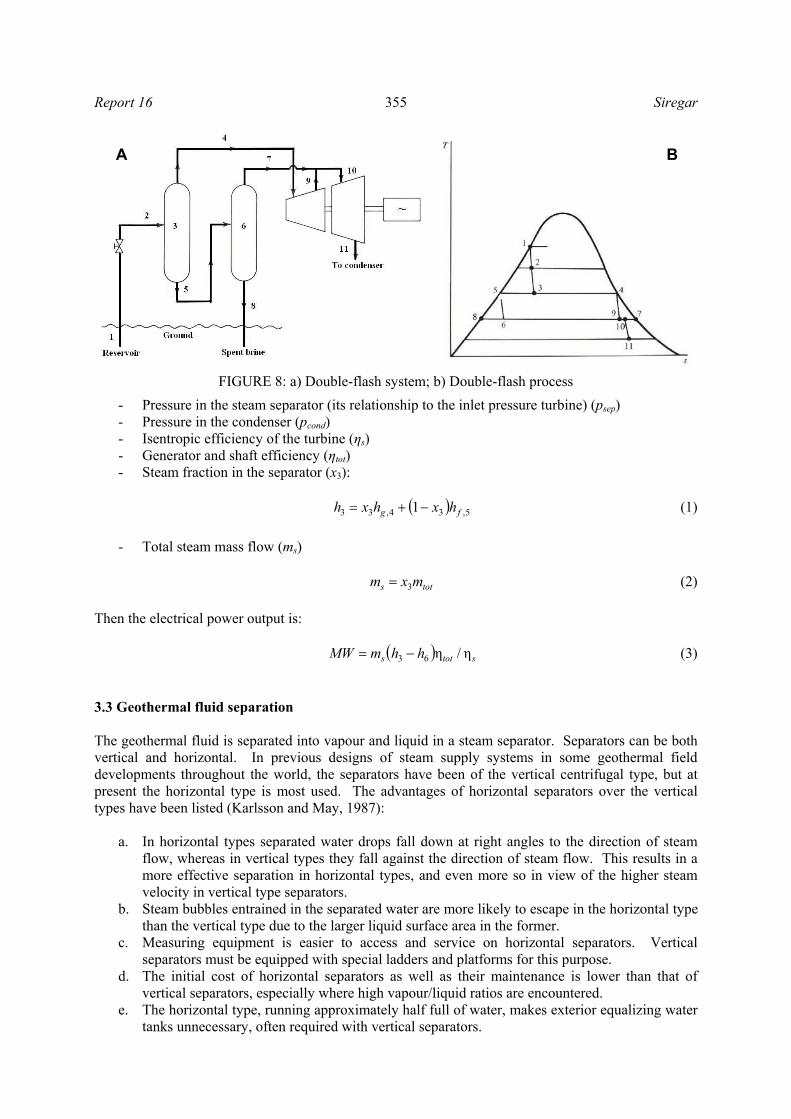
3. THEORY AND METHOD OVERVIEW 3.1 Steam field Exploration data of the Sibayak geothermal field show that this field is a liquid-dominated system. The known resources show that water is available above 200°C, with some up to 300°C. Because the wells are non-artesian they must be stimulated to initiate flow. When discharged, the water can flow naturally under its own pressure. The drop in pressure causes it to partially flash into steam and arrive at the wellhead as a two-phase mixture. The geothermal fluid is flashed into steam as the hydrostatic column is reduced to a sustained wellhead pressure. Steam will be supplied from wells in Pad A and Pad B to the power plant. Two production wells in Pad A and three wells in Pad B are available for the plant. The pressure, temperature, enthalpy, mass flow and characteristics of each well have been identified through testing. One well in Pad B has been prepared to accept injected brine water, and the condensate will be injected to well SBY-9 in Pad C. 3.2 Basic concepts for energy conversion of flash steam systems Wellhead production is throttled to increase the vapour fraction prior to entry into the flash separator which separates the vapour from the remaining liquid fraction. For simplicity, the pressure drop between separator and turbine inlet is neglected here since it is largely dependent on detailed plant design. A substantial fraction of the available energy is discarded with the separated liquid. Overall plant thermal efficiencies are generally around 10% for a single-flash system. Greater utilization of the fluid, however, can be achieved with multiple flashing. Calculations indicate that a two-stage flash system can increase net power output by about 30% for 170°C reservoirs to about 23% for 300°C reservoir (Austin, 1975). Figure 7 describes the single-flash system and Figure 8 the double-flash system. The accompanying temperature-entropy charts illustrate the basic thermodynamic process involved. To calculate the electrical power output of the generator, the following needs to be known:
- Temperature and the enthalpy of the geothermal fluid in the reservoir (h1, t1), if there is more than one well, temperature and the enthalpy of each well are needed.
- Mass flow of the well, (m2), for many wells find the total of mass flow by adding the mass flow from each well (mtot)
BA
FIGURE 7: a) Single-flash system; b) Single-flash process
Report 16 355 Siregar
- Pressure in the steam separator (its relationship to the inlet pressure turbine) (psep) - Pressure in the condenser (pcond) - Isentropic efficiency of the turbine (ηs) - Generator and shaft efficiency (ηtot) - Steam fraction in the separator (x3):
( ) 5,34,33 1 fg hxhxh −+= (1)
- Total steam mass flow (ms)
tots mxm 3= (2) Then the electrical power output is:
( ) stots hhmMW η/η63 −= (3)
3.3 Geothermal fluid separation The geothermal fluid is separated into vapour and liquid in a steam separator. Separators can be both vertical and horizontal. In previous designs of steam supply systems in some geothermal field developments throughout the world, the separators have been of the vertical centrifugal type, but at present the horizontal type is most used. The advantages of horizontal separators over the vertical types have been listed (Karlsson and May, 1987):
a. In horizontal types separated water drops fall down at right angles to the direction of steam flow, whereas in vertical types they fall against the direction of steam flow. This results in a more effective separation in horizontal types, and even more so in view of the higher steam velocity in vertical type separators.
b. Steam bubbles entrained in the separated water are more likely to escape in the horizontal type than the vertical type due to the larger liquid surface area in the former.
c. Measuring equipment is easier to access and service on horizontal separators. Vertical separators must be equipped with special ladders and platforms for this purpose.
d. The initial cost of horizontal separators as well as their maintenance is lower than that of vertical separators, especially where high vapour/liquid ratios are encountered.
e. The horizontal type, running approximately half full of water, makes exterior equalizing water tanks unnecessary, often required with vertical separators.
A B
FIGURE 8: a) Double-flash system; b) Double-flash process

Siregar 356 Report 16
Properly designed and adjusted, separation efficiency can easily be more than 99.9%. The water/liquid is separated from the steam and falls down and flows out the separator to the injection well or, in additional cases, it can be used for a binary cycle plant. The vapour that exits the separator contains very small droplets. Due to condensation and transport time, droplet sizes increase. Part of this will fall to the bottom of the pipe on the way and the water can be drained. The remainder is removed in the moisture separator or demister. Figure 9 shows the mass conservation for a steam separator.
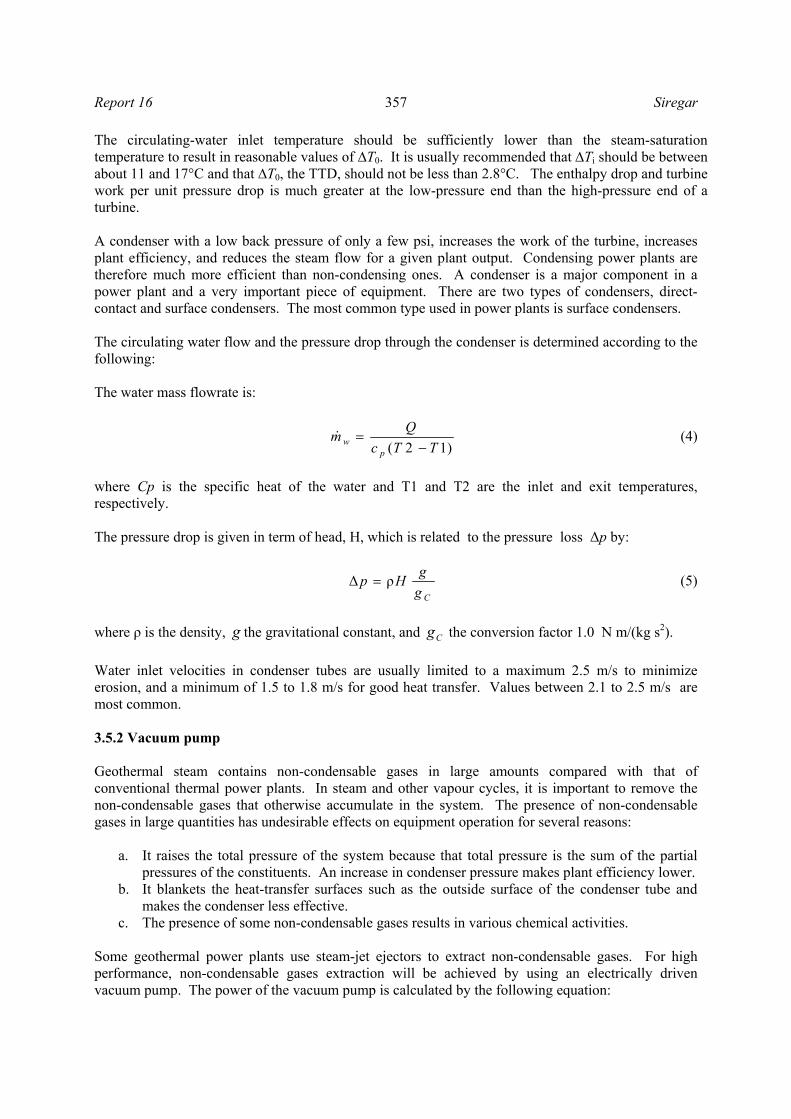
3.4 Steam turbine Steam flowing from the moisture separators enters the steam turbine. The steam is supplied to the turbine rotor via nozzles in a tangential direction forward at higher velocity. The turbine rotor is subjected to an axial thrust as a result of pressure drops across the moving blades and changes in axial momentum of the steam between entrance and exit, and then passed through the rotor shaft as useful power output of the turbine. The capacity of the turbine is a fundamental factor in the design of a geothermal power plant. Some factors that influence the selection are available steam, thermodynamic and chemical characteristics of the steam, type of turbine, effects of natural decline in flowrate and pressure of the wells, decrease or increase of the non-condensable gases, and financial factors at present and in the future. 3.5 Cold end The cooling system absorbs rejected heat from the energy conversion system and dissipates it to the atmosphere. Cooling water from the mechanical draft tower flows in parallel through the tube side of the condenser and returns to the tower where it is cooled by evaporation. To maintain the concentration of dissolved solids in the cooling tower at an acceptably low level, a portion of the circulating water (blowdown) is continuously removed and replaced by makeup water. The blowdown is de-aerated and combined with the cooled brine leaving the heat exchangers for reinjection. 3.5.1 Condenser The primary purpose of the condenser is to condense the exhaust steam from the turbine. The circulating-water system supplies cooling water to the turbine condensers and thus acts as the vehicle by which heat is rejected from the steam cycle to the environment. The circulating system is efficient but one that also conforms to thermal-discharge regulations. Its performance is vital to the efficiency of the power plant itself because a condenser operating at the lowest temperature possible results in maximum turbine work and cycle efficiency and in minimum heat rejection. Figure 10 shows the temperature distribution in the condenser.
FIGURE 9: Mass conservation for a steam separator
FIGURE 10: Condenser temperature distribution
Report 16 357 Siregar
The circulating-water inlet temperature should be sufficiently lower than the steam-saturation temperature to result in reasonable values of ∆T0. It is usually recommended that ∆Ti should be between about 11 and 17°C and that ∆T0, the TTD, should not be less than 2.8°C. The enthalpy drop and turbine work per unit pressure drop is much greater at the low-pressure end than the high-pressure end of a turbine. A condenser with a low back pressure of only a few psi, increases the work of the turbine, increases plant efficiency, and reduces the steam flow for a given plant output. Condensing power plants are therefore much more efficient than non-condensing ones. A condenser is a major component in a power plant and a very important piece of equipment. There are two types of condensers, direct-contact and surface condensers. The most common type used in power plants is surface condensers. The circulating water flow and the pressure drop through the condenser is determined according to the following: The water mass flowrate is:
)12( TTcQm
pw −=& (4)
where Cp is the specific heat of the water and T1 and T2 are the inlet and exit temperatures, respectively. The pressure drop is given in term of head, H, which is related to the pressure loss ∆p by:
CggHp ρ∆ = (5)
where ρ is the density, g the gravitational constant, and Cg the conversion factor 1.0 N m/(kg s2). Water inlet velocities in condenser tubes are usually limited to a maximum 2.5 m/s to minimize erosion, and a minimum of 1.5 to 1.8 m/s for good heat transfer. Values between 2.1 to 2.5 m/s are most common. 3.5.2 Vacuum pump Geothermal steam contains non-condensable gases in large amounts compared with that of conventional thermal power plants. In steam and other vapour cycles, it is important to remove the non-condensable gases that otherwise accumulate in the system. The presence of non-condensable gases in large quantities has undesirable effects on equipment operation for several reasons:
a. It raises the total pressure of the system because that total pressure is the sum of the partial pressures of the constituents. An increase in condenser pressure makes plant efficiency lower.
b. It blankets the heat-transfer surfaces such as the outside surface of the condenser tube and makes the condenser less effective.
c. The presence of some non-condensable gases results in various chemical activities.
Some geothermal power plants use steam-jet ejectors to extract non-condensable gases. For high performance, non-condensable gases extraction will be achieved by using an electrically driven vacuum pump. The power of the vacuum pump is calculated by the following equation:

Siregar 358 Report 16
−
−γγ
=
γ
−
1η1
11
cond
atm
gasVpump
condugVpump p
pMTRmP
& (6)
where PVpump = The power of the pump in kW;
γ = Cp.gas/Cv,gas; gm& = The mass flowrate of the gas in kg/s;
Ru = 8.314 kJ/(kmol K), the universal gas contant; Tcond = The temperature of the condensate in °K; ηVpump = The efficiency of the pump; Mgas = The molar mass of the gas; Patm and Pcond = The atmospheric and condenser pressures in bar-a, respectively.
3.5.3 Wet cooling tower A cooling tower is an evaporative heat transfer device in which atmospheric air cools warm water, with direct contact between the water and the air, by evaporating part of the water. Wet cooling towers have a hot water distribution system that showers or sprays the water evenly over a latticework of closely set horizontal slats or bars called fill or packing. The fill thoroughly mixes the falling water with air moving through the fill as the water splashes down from one fill level to the next by gravity. Outside air enters the tower via louvers in the form of horizontal slats on the side of the tower. The slats usually slope downward to keep the water in. The intimate mix between water and air enhances heat and mass transfer (evaporation) which cools the water. The cold water is then collected in a concrete basin at the bottom of the tower where it is pumped back to the condenser. The now hot, moist air leaves the tower at the top. 3.5.4 Mechanical-draft cooling tower In mechanical-draft cooling towers, the air is moved by one or more mechanically driven fans. The majority of mechanical-draft cooling towers for utility application are, therefore, of the induced-draft type. With this type, air enters the sides of the tower through large openings at low velocity and passes through the fill. The fan is located at the top of the tower, where the hot, humid air exhausts to the atmosphere. The fans are usually multi-bladed and large, ranging from 20 to 33 ft (6-10 m) in diameter. They are driven by electric motors, as large as 250 hp, at relatively low speeds through reduction gearing. The fans used are of the propeller type, which move large volumetric flowrates at relatively low static pressure. They have adjustable-pitch blades for minimum power consumption, depending on system head load and climatic conditions. 3.5.5 Makeup water In the cooling-water system, water will be lost because of evaporation, drift and bleeding or blowdown. Makeup water required by a cooling tower is the sum of that which would compensate for the water loss. This water, in addition to compensating for evaporation and drift, keeps the concentration of salts and other impurities down. Otherwise, these concentrations would continuously build up as the water continues to evaporate. The evaporation loss rate is 1-1.5% of the total circulating water flowrate. Blowdown is normally 20% of evaporation loss but sometimes the value is similar to evaporation loss, depending upon the content of chemicals, content of various minerals, and the size of the plant. Water droplet size will vary with exchanger type, condition of the media, air velocity through the unit, and other factors. The drift loss is perhaps 0.03% of the total circulating water flowrate. A large quantity of drift cannot be tolerated, as it can cause water and ice deposition problems at and near the plant side.
Report 16 359 Siregar
3.6 Wet cooling tower calculations To find and calculate the energy balance, mass balance, and power consumption for the fan at the cooling tower, the following parameters must be known (El-Wakil, 1984): Dry-bulb temperature (Tdb) is the temperature of the air as commonly measured and used. Wet-bulb temperature (Twb) is the temperature of the air as measured by a psychrometric (Perry, 1950);
if the air is saturated, i.e. φ = 100%, the wet-bulb temperature equals the dry-bulb temperature. Approach is the difference between the cold-water temperature and the wet-bulb temperature of the
outside air. Range is the difference between the hot-water temperature and the cold-water temperature. Relative humidity (φ) is the partial pressure of water vapour in the air, (Pv), divided by the partial
pressure of water vapour that would saturate the air at its temperature (Psat) :
sat
v
PP
=φ (7)
Humidity ratio is the air per unit mass of dry air,
v
v
a
v
PPP
PP
−==
622.07.853.53ω (8)
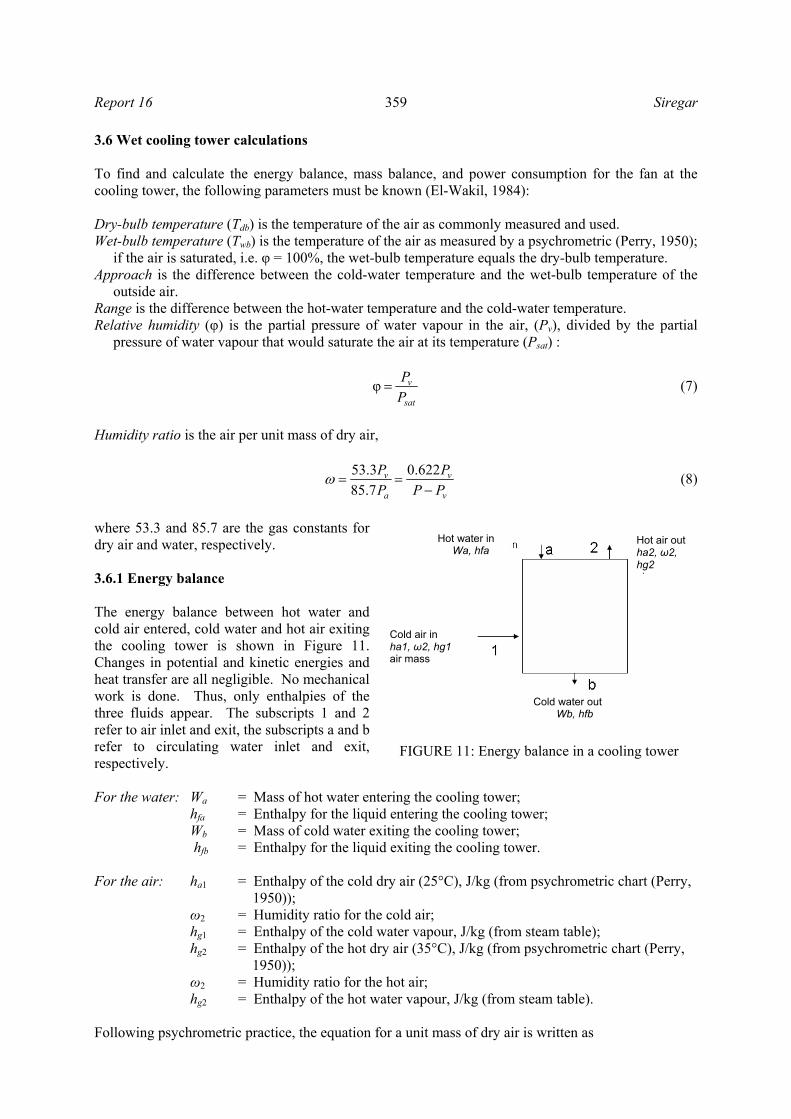
where 53.3 and 85.7 are the gas constants for dry air and water, respectively. 3.6.1 Energy balance The energy balance between hot water and cold air entered, cold water and hot air exiting the cooling tower is shown in Figure 11. Changes in potential and kinetic energies and heat transfer are all negligible. No mechanical work is done. Thus, only enthalpies of the three fluids appear. The subscripts 1 and 2 refer to air inlet and exit, the subscripts a and b refer to circulating water inlet and exit, respectively. For the water: Wa = Mass of hot water entering the cooling tower;
hfa = Enthalpy for the liquid entering the cooling tower; Wb = Mass of cold water exiting the cooling tower; hfb = Enthalpy for the liquid exiting the cooling tower.
For the air: ha1 = Enthalpy of the cold dry air (25°C), J/kg (from psychrometric chart (Perry, 1950));
ω2 = Humidity ratio for the cold air; hg1 = Enthalpy of the cold water vapour, J/kg (from steam table); hg2 = Enthalpy of the hot dry air (35°C), J/kg (from psychrometric chart (Perry, 1950)); ω2 = Humidity ratio for the hot air; hg2 = Enthalpy of the hot water vapour, J/kg (from steam table).
Following psychrometric practice, the equation for a unit mass of dry air is written as
FIGURE 11: Energy balance in a cooling tower
Hot water in Wa, hfa
Hot air out ha2, ω2, hg2
i
Cold air in ha1, ω2, hg1 air mass
Cold water out Wb, hfb
Siregar 360 Report 16
WbbvaWaava hWhhhWhh ++=++ 222111 ωω (9) 3.6.2 Mass balance The dry air goes through the tower unchanged. The circulating water loses mass by evaporation. The water vapour in the air gains mass due to the evaporated water. Thus, based on a unit mass of dry air,
ba WW −=− 12 ωω (10)
( )[ ] fbagpfaag hWhTTchWh 122211 )12( ωωωω −−++−=+ (11) where cp = The specific heat of air; and
T2 – T1 = The temperature difference between inlet and exit air temperature through cooling tower.
3.6.3 Power of fan To calculate the power of the fan Pfan (W) at the cooling tower, the equation is:
fan
airfan
pvPη∆
=&
(12)
and,
outair
airair
mv,ρ
&& = (13)
thus,
fanmotor
fanfanmotor
PP
,, η
= (14)
where ∆p = The drop pressure, in Pa;
airv& = The volume flowrate of air, in m³/s;
airm& = The mass flow or the air, in kg/s; ρair,out = The density of the air out the cooling tower in kg/m³; and ηfan and ηmotor, fan = The efficiency of the fan and the motor of the fan.
3.6.4 Power of pump The following equation is used to calculate the power of the pump Ppump, in W:
pump
waterpump
pvPη
∆=&
(15)
with
water
waterwater
mvρ&
& = (16)
and
pumpmotor
pumppumpmotor
PP
,, η
= (17)
Report 16 361 Siregar
where ∆p = The drop of pressure, in Pa; waterv& = Volume flowrate of water, in m³/s;
waterm& = Flowrate of water, in kg/s; ρwater = Density of water, in kg/m³; and ηfan and ηmotor, pump= Efficiency of the pump and the motor of the pump, respectively.
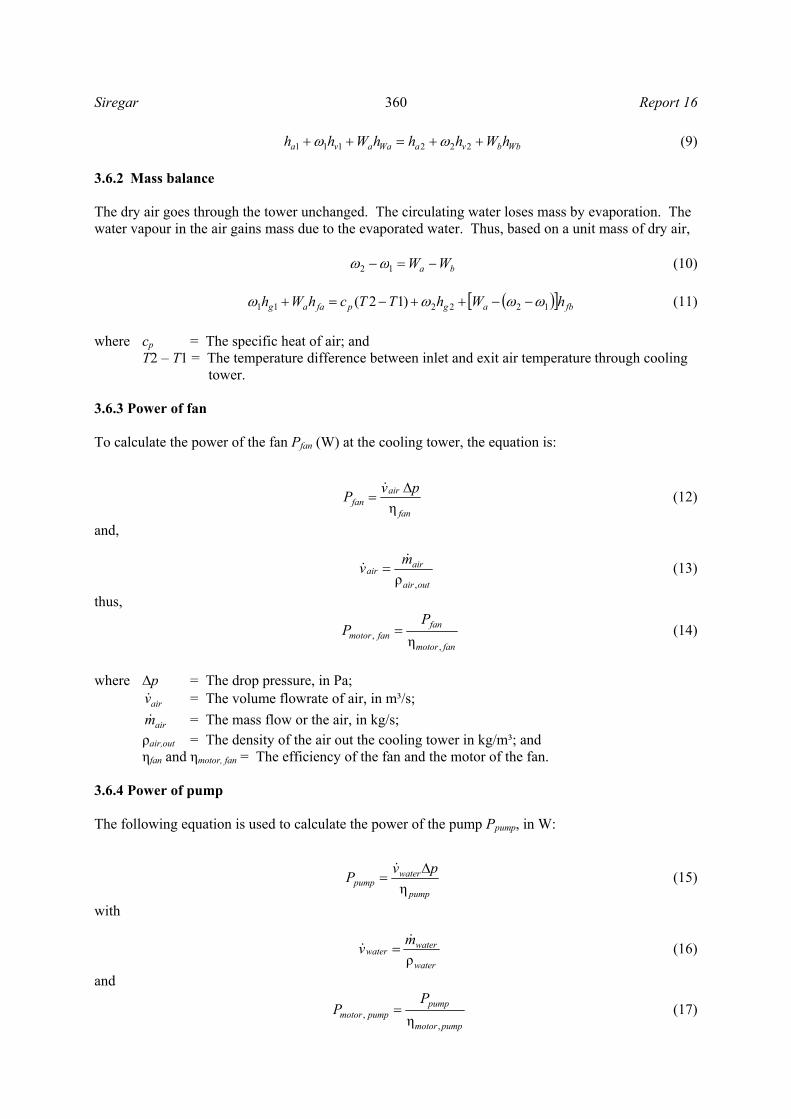
4. DESIGN OF THE POWER PLANT 4.1 Well production data of the Sibayak field Sibayak geothermal field has 7 production wells (SBY-1, SBY-3, SBY-4, SBY-5, SBY-6, SBY-7 and SBY-8). At present, only 5 wells are used for production because SBY-1 and SBY-7 have some problems. Table 1 shows the data of the active production wells, and Figure 12 shows the characteristics of the Sibayak production wells.
TABLE 1: Well production data of Sibayak
Wells Wellhead pressure(bar-a)
Enthalpy (kJ/kg)
Mass flow (kg/s)
SBY-6 11.8 1117 54.7 SBY-3 15 1319 26.4 SBY-4 11.6 1108 33.6 SBY-5 13 1225 56.8 SBY-8 9.1 1049 31.2
The curves in Figure 12 show that there are two types of wells:
- The discharge of wells SBY-4, 5, 6 and 8 decreases with increasing wellhead pressure;
- The discharge of well SBY-3 is nearly constant over a wide range of wellhead pressures.
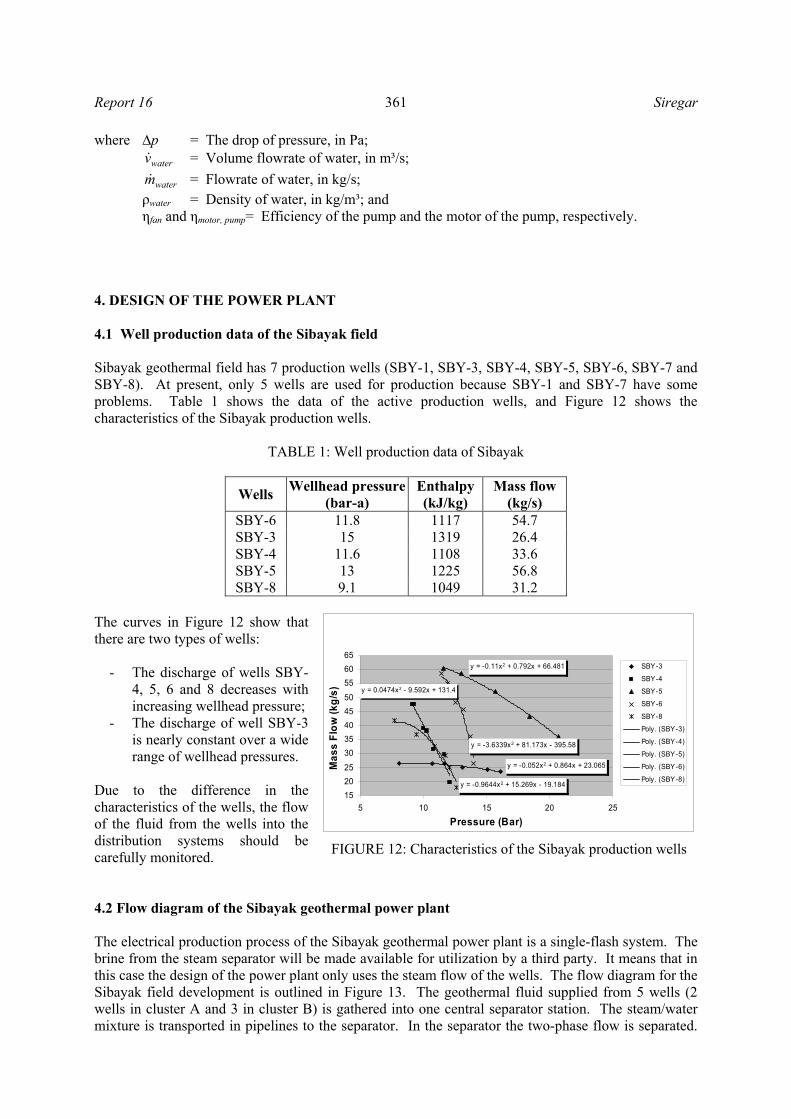
Due to the difference in the characteristics of the wells, the flow of the fluid from the wells into the distribution systems should be carefully monitored. 4.2 Flow diagram of the Sibayak geothermal power plant The electrical production process of the Sibayak geothermal power plant is a single-flash system. The brine from the steam separator will be made available for utilization by a third party. It means that in this case the design of the power plant only uses the steam flow of the wells. The flow diagram for the Sibayak field development is outlined in Figure 13. The geothermal fluid supplied from 5 wells (2 wells in cluster A and 3 in cluster B) is gathered into one central separator station. The steam/water mixture is transported in pipelines to the separator. In the separator the two-phase flow is separated.
FIGURE 12: Characteristics of the Sibayak production wells
y = -0.052x2 + 0.864x + 23.065
y = 0.0474x2 - 9.592x + 131.4
y = -0.11x2 + 0.792x + 66.481
y = -3.6339x2 + 81.173x - 395.58
y = -0.9644x2 + 15.269x - 19.184152025
3035404550
556065
5 10 15 20 25
Pressure (Bar)
Mas
s Fl
ow (k
g/s)
SBY-3
SBY-4
SBY-5
SBY-6
SBY-8
Poly. (SBY-3)
Poly. (SBY-4)
Poly. (SBY-5)
Poly. (SBY-6)
Poly. (SBY-8)
Siregar 362 Report 16
In this diagram, the brine water exits from the separator and flows to the injection well but in the future the brine will be used in a binary plant by a third party. The steam is piped to the power plant where it passes through the demister. The exhaust steam from the turbines is cooled in the condenser, and the condensed water pumped to the injection well. The cooling water circulates in a close-loop system. In this system, water is taken from the condenser, passed through a cooling device, and returned to the condenser. A nearby natural body of water is still necessary to supply makeup water to replace loss by evaporation during the cooling process and to receive blowdown from it. 4.3 Design calculations The Engineering Equations Solver (EES) program was used to run the calculations. 4.3.1 Design pressure The curves in Figure 12 can be used to determine whether the wells can sustain production at the proposed wellhead pressure. Figure 12 shows the wellhead pressure range to be 9-13 bar-a which allows maximum mass flow from the wells. The pressure in the separator is 8 bar-a and it is assumed that the pressure drop from wells in cluster A to the separator is 1-2 bars, and from cluster B is 2-3 bars. The pressure drop includes the drop through the orifice at the wellhead. Consequently, the pressure range for wells in cluster A is 9-10 bar-a, and for wells in cluster B 10-11 bar-a. Pressure drop from the separator to demister is assumed 0.3 bar. For this calculation the turbine outlet pressure was kept constant at 0.1 bar, isentropic efficiency of the turbine 0.80 and the total efficiency of the turbine-generator 0.77. The inlet pressure of the turbine is 7.5-8 bar-a. 4.3.2 Power output of turbine generator A fundamental factor in the design of a geothermal power plant is the capacity of the turbine. The steam flowing from the separator and entering the demister is 44.84 kg/s, and the steam exiting the demister flowing to the turbine is 44.39 kg/s. Steam enters the turbine at approximately 168.6-
FIGURE 13: Flow diagram of Sibayak geothermal power plant
Report 16 363 Siregar
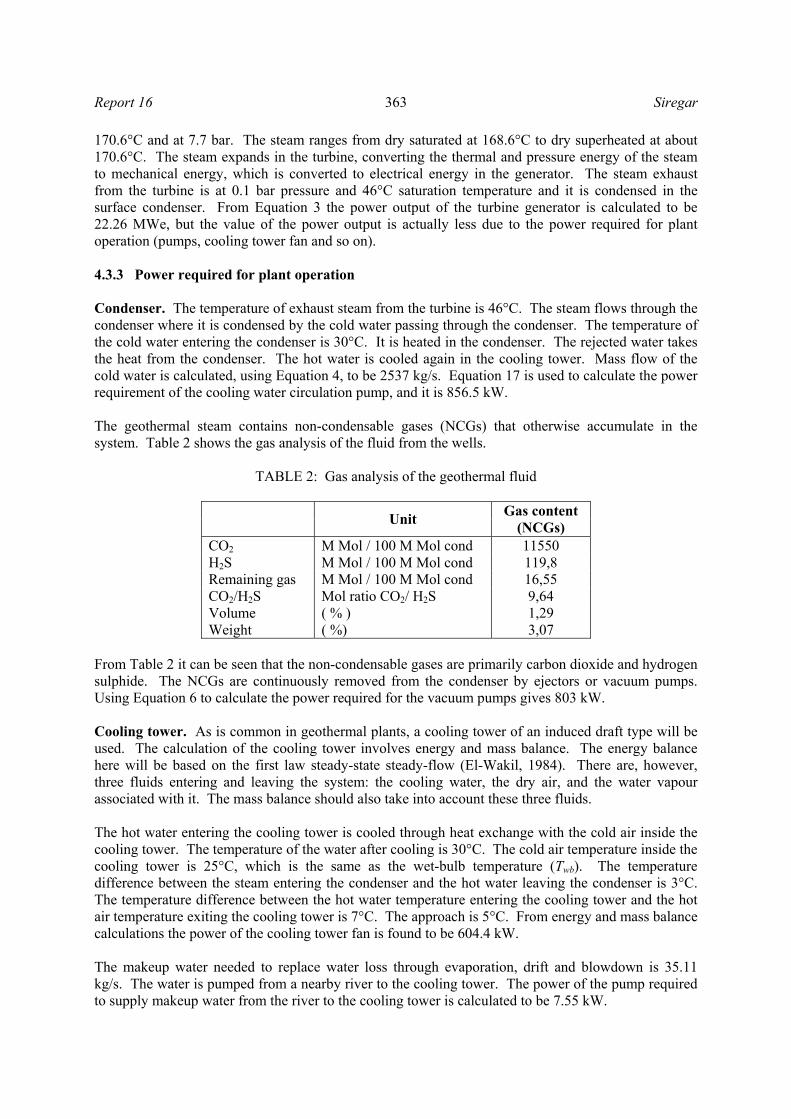
170.6°C and at 7.7 bar. The steam ranges from dry saturated at 168.6°C to dry superheated at about 170.6°C. The steam expands in the turbine, converting the thermal and pressure energy of the steam to mechanical energy, which is converted to electrical energy in the generator. The steam exhaust from the turbine is at 0.1 bar pressure and 46°C saturation temperature and it is condensed in the surface condenser. From Equation 3 the power output of the turbine generator is calculated to be 22.26 MWe, but the value of the power output is actually less due to the power required for plant operation (pumps, cooling tower fan and so on). 4.3.3 Power required for plant operation Condenser. The temperature of exhaust steam from the turbine is 46°C. The steam flows through the condenser where it is condensed by the cold water passing through the condenser. The temperature of the cold water entering the condenser is 30°C. It is heated in the condenser. The rejected water takes the heat from the condenser. The hot water is cooled again in the cooling tower. Mass flow of the cold water is calculated, using Equation 4, to be 2537 kg/s. Equation 17 is used to calculate the power requirement of the cooling water circulation pump, and it is 856.5 kW. The geothermal steam contains non-condensable gases (NCGs) that otherwise accumulate in the system. Table 2 shows the gas analysis of the fluid from the wells.
TABLE 2: Gas analysis of the geothermal fluid
Unit Gas content (NCGs)
CO2 M Mol / 100 M Mol cond 11550 H2S M Mol / 100 M Mol cond 119,8 Remaining gas M Mol / 100 M Mol cond 16,55 CO2/H2S Mol ratio CO2/ H2S 9,64 Volume ( % ) 1,29 Weight ( %) 3,07
From Table 2 it can be seen that the non-condensable gases are primarily carbon dioxide and hydrogen sulphide. The NCGs are continuously removed from the condenser by ejectors or vacuum pumps. Using Equation 6 to calculate the power required for the vacuum pumps gives 803 kW. Cooling tower. As is common in geothermal plants, a cooling tower of an induced draft type will be used. The calculation of the cooling tower involves energy and mass balance. The energy balance here will be based on the first law steady-state steady-flow (El-Wakil, 1984). There are, however, three fluids entering and leaving the system: the cooling water, the dry air, and the water vapour associated with it. The mass balance should also take into account these three fluids. The hot water entering the cooling tower is cooled through heat exchange with the cold air inside the cooling tower. The temperature of the water after cooling is 30°C. The cold air temperature inside the cooling tower is 25°C, which is the same as the wet-bulb temperature (Twb). The temperature difference between the steam entering the condenser and the hot water leaving the condenser is 3°C. The temperature difference between the hot water temperature entering the cooling tower and the hot air temperature exiting the cooling tower is 7°C. The approach is 5°C. From energy and mass balance calculations the power of the cooling tower fan is found to be 604.4 kW. The makeup water needed to replace water loss through evaporation, drift and blowdown is 35.11 kg/s. The water is pumped from a nearby river to the cooling tower. The power of the pump required to supply makeup water from the river to the cooling tower is calculated to be 7.55 kW.

Siregar 364 Report 16
The exhaust steam from the turbine will condense through the cooling process in the condenser. The condensate from the condenser will be pumped to the injection wells. Mass flow of the evaporated water is 43.85 kg/s. The power of the pump needed is 58.86 kW. 4.3.4 Output of the power plant The output of the power plant is found by deducting the power from the generator from the power required for plant operation, or:
)( ,3.2,1,, fanmotorpumpmotorpumpmotorpumpmotorVpumpmotorturbineplantpower PPPPPPP ++++−=− Calculations based on this equation give the power plant output as 20.9 MWe. 5. OPTMIZATION OF THE POWER PLANT OUTPUT The power plant has been modelled by the EES (Engineering Equation Solver) program (see Appendix I). This model can be used to calculate the output of the power plant for various values of wellhead pressure, pressure in the steam separator, pressure in the condenser and different temperatures at the cold end. It will help when choosing the turbine size, the inlet pressure and the exhaust pressure of the turbine and design values for other power plant equipment. 5.1 Optimum pressure of separator The optimum pressure of the steam separator is defined as the pressure at which the output from the power plant is maximized. To find this optimum pressure of the separator, the pressure in the condenser is kept constant and the output of the power plant is calculated for different pressures in the separator, for example at 3 to 12 bar-a. The results of these calculations are shown in Figure 14 where the output of the plant is plotted vs. pressure in the separator for different pressures in the condenser. The result is that the optimum pressure in the steam separator is 8 bar-a, and the highest output of the power plant is 20858 kWe when the pressure in the condenser is 0.08 bar-a.
5.2 Optimum pressure of condenser The optimum pressure of the condenser i.e. the pressure in the condenser at which the output from the power plant is maximized, is calculated in the same way as the optimum pressure in the separator. The output from the power plant is calculated for different pressures in the condenser while the pressure in the steam separator is kept constant. The results of these calculations are shown in Figure 15 where the output of the plant is plotted vs. pressure in the condenser for different pressures in the separator. The results show that the optimum pressure in the condendser is 0.08 bar-a, and the highest output of the power plant is 20,858 kWe when the pressure in the separator is 8 bar.
Figure 14: Output of the power plant vs. separator pressure
0
5000
10000
15000
20000
25000
3 4 5 6 7 8 9 10 11 12
pseparator (bar.a)
Pout
put p
ower
-pla
nt (k
We)
pcon=0.06 (bar.a)pcon=0.08 (bar.a)pcon=0.1 (bar.a)pcon=0.2 (bar.a)pcon=0.3 (bar.a)
psep=8 bar.aPoutput =20858 kWe
Report 16 365 Siregar
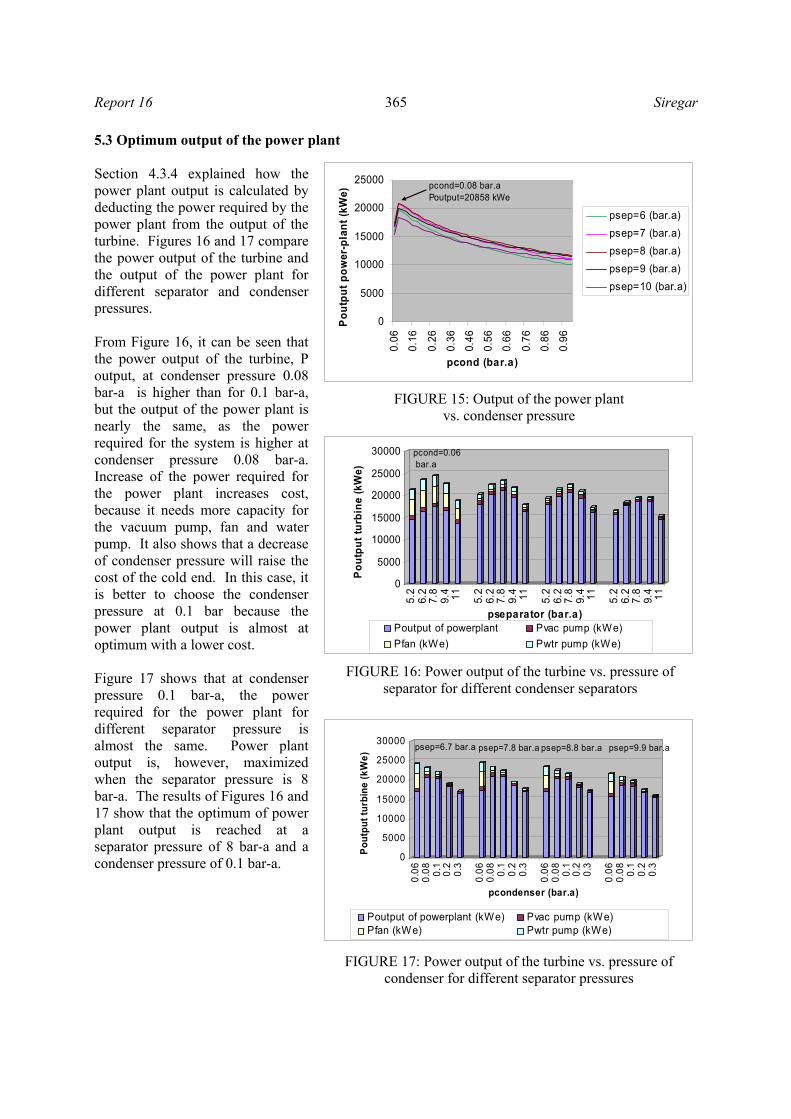
5.3 Optimum output of the power plant Section 4.3.4 explained how the power plant output is calculated by deducting the power required by the power plant from the output of the turbine. Figures 16 and 17 compare the power output of the turbine and the output of the power plant for different separator and condenser pressures. From Figure 16, it can be seen that the power output of the turbine, P output, at condenser pressure 0.08 bar-a is higher than for 0.1 bar-a, but the output of the power plant is nearly the same, as the power required for the system is higher at condenser pressure 0.08 bar-a. Increase of the power required for the power plant increases cost, because it needs more capacity for the vacuum pump, fan and water pump. It also shows that a decrease of condenser pressure will raise the cost of the cold end. In this case, it is better to choose the condenser pressure at 0.1 bar because the power plant output is almost at optimum with a lower cost. Figure 17 shows that at condenser pressure 0.1 bar-a, the power required for the power plant for different separator pressure is almost the same. Power plant output is, however, maximized when the separator pressure is 8 bar-a. The results of Figures 16 and 17 show that the optimum of power plant output is reached at a separator pressure of 8 bar-a and a condenser pressure of 0.1 bar-a.
FIGURE 15: Output of the power plant vs. condenser pressure
0
5000
10000
15000
20000
25000
0.06
0.16
0.26
0.36
0.46
0.56
0.66
0.76
0.86
0.96
pcond (bar.a)
Pout
put p
ower
-pla
nt (k
We)
psep=6 (bar.a)psep=7 (bar.a) psep=8 (bar.a)psep=9 (bar.a)psep=10 (bar.a)
pcond=0.08 bar.aPoutput=20858 kWe
FIGURE 16: Power output of the turbine vs. pressure of separator for different condenser separators
0
5000
10000
15000
20000
25000
30000
Pout
put t
urbi
ne (k
We)
5.2
6.2
7.8
9.4 11 5.2
6.2
7.8
9.4 11 5.2
6.2
7.8
9.4 11 5.2
6.2
7.8
9.4 11
pseparator (bar.a)Poutput of powerplant Pvac pump (kWe)Pfan (kWe) Pwtr pump (kWe)
pcond=0.06 bar.a
FIGURE 17: Power output of the turbine vs. pressure of condenser for different separator pressures
0
5000
10000
15000
20000
25000
30000
Pout
put t
urbi
ne (k
We)
0.06
0.08 0.
10.
20.
3
0.06
0.08 0.
10.
20.
3
0.06
0.08 0.
10.
20.
3
0.06
0.08 0.
10.
20.
3
pcondenser (bar.a)
Poutput of powerplant (kWe) Pvac pump (kWe)Pfan (kWe) Pwtr pump (kWe)
psep=6.7 bar.a psep=7.8 bar.a psep=8.8 bar.a psep=9.9 bar.a
Siregar 366 Report 16
6. CONCLUSIONS
• The output from the turbine increases with lower condensing pressure but so does the power consumption of the plant. Consequently, too low a pressure in the condenser reduces the output from the power plant.
• The output from the power plant in Sibayak is maximized at a separation pressure 8 bar-a and a condensing pressure 0.08 bar-a.
• A 20 MWe turbine running at 7.5-8.0 bar-a inlet pressure and 0.1 bar-a condensing pressure is a good choice for the Sibayak geothermal field based on data from the existing wells.
ACKNOWLEDGEMENTS
I would like to express my deepest acknowledgement to Dr. Ingvar B. Fridleifsson and Mr. Lúdvík S. Georgsson, for giving me a chance to attend the UNU Geothermal Training Programme in 2004. I am happy to convey my gratitude to Mrs. Gudrún Bjarnadóttir for her assistance and support during training in Iceland. My sincere gratitude also to my supervisor Mr. Kristinn Ingason for his guidance, comments and transfer of experience for this report, and also to Dr. Páll Valdimarsson and Mr. Sverrir Thórhallsson for taking the time to give me advice. I would also like to give thanks to the management of PT. Pertamina Persero for permission to attend this programme. Lastly, I am grateful to my family, my wife Ina and my children Immanuel, Yosua and Sifra for praying, and supporting me and being my inspiration in all I do.
REFERENCES
Atmojo, J.P., Itoi, R., Fukuda, M., Tanaka, T., Daud, Y., and Sudarman, S., 2001: Numerical modelling study of Sibayak geothermal reservoir, North Sumatra, Indonesia. Proceedings of the 26th Workshop on Geothermal Reservoir Engineering, Stanford University, Stanford, Ca, 201-207 Atmojo, J.P., Itoi, R., Tanaka, T., Fukuda, M., Sudarman, S., and Widiyarso, A., 2000: Modelling studies of Sibayak geothermal reservoir, Northern Sumatra, Indonesia. Proceedings of the World Geothermal Congress 2000, Kyushu-Tokyo, Japan, 2037-2043. Austin, A.L., 1975: Prospects for advances in energy conversion technologies for geothermal energy development. Proceedings of the 2nd United Nations Symposium on the Development and Use of Geothermal Resources, San Francisco, Ca, USA, 3, 1925-1935. Daud, Y., Sudarman, S., and Ushijima, K., 2001: Imaging reservoir permeability of the Sibayak geothermal field, Indonesia using geophysical measurements. Proceedings 26th Workshop on Geothermal Reservoir Engineering, Stanford University, Stanford, Ca, 127-133. El-Wakil, M.M., 1984: Powerplant technology. McGraw-Hill, Inc, USA, 859 pp. Karlsson, Th., and May, D.A., 1987: Selection of separators for the first phase of the Nesjavellir geothermal project. Report (in Icelandic) prepared for the Reykjavik Municipal District Heating Service by VGK Consulting Engineers, Ltd. Perry, J.H., (editor), 1950: Chemical engineers’ handbook. McGraw-Hill Book Company, Inc., New York, 1942 pp.
Report 16 367 Siregar
APPENDIX I: Model, equations and calculation of Sibayak geothermal power plant (EES - program)
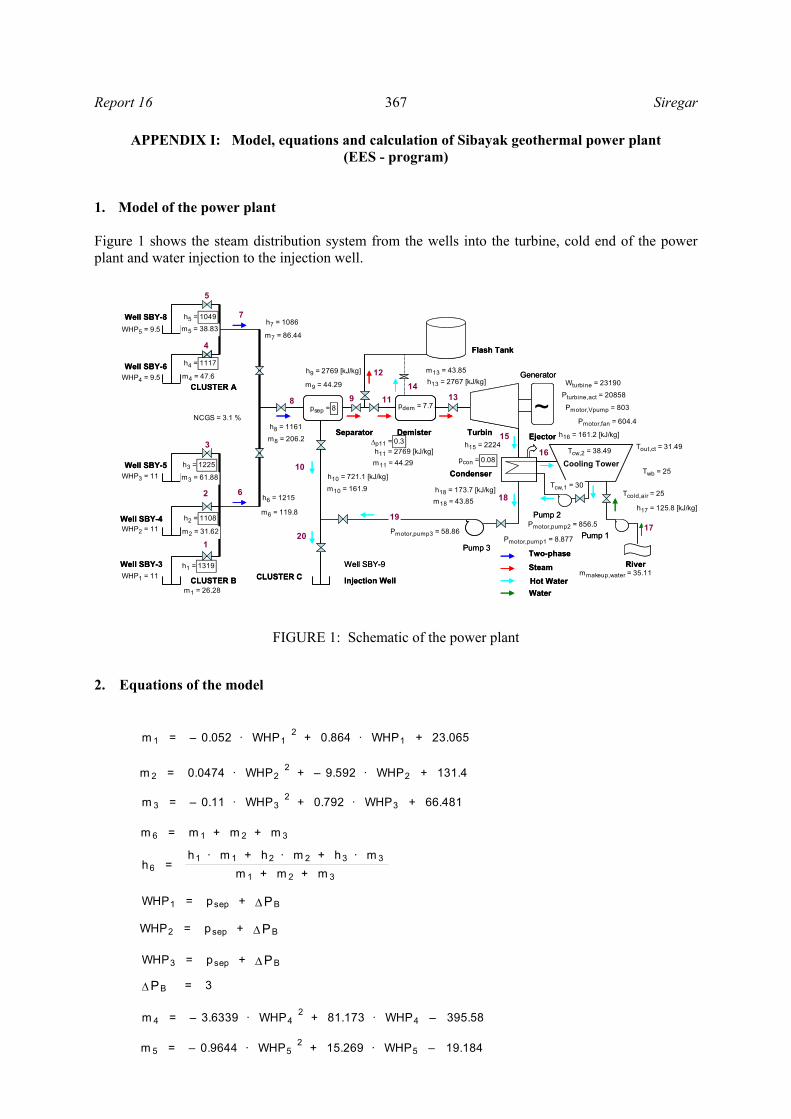
1. Model of the power plant Figure 1 shows the steam distribution system from the wells into the turbine, cold end of the power plant and water injection to the injection well.
FIGURE 1: Schematic of the power plant 2. Equations of the model
Water
Well SBY-3
Well SBY-4
Cooling Tower
Pump 3
Well SBY-5
Well SBY-8
Well SBY-6
Separator Demister Turbin
Condenser
Two-phaseSteamHot WaterInjection Well
Flash Tank
River
Ejector
CLUSTER A
CLUSTER B CLUSTER CWell SBY-9
Pump 1
Pump 2
Generator
~
Water
Well SBY-3
Well SBY-4
Cooling Tower
Pump 3
Well SBY-5
Well SBY-8
Well SBY-6
Separator Demister Turbin
Condenser
Two-phaseSteamHot WaterInjection Well
Flash Tank
River
Ejector
CLUSTER A
CLUSTER B CLUSTER CWell SBY-9
Pump 1
Pump 2
Generator
~
1
2
3
4
5
6
7
8 9
10
11
12
1314
15
16
17
18h6 = 1215
h7 = 1086
h8 = 1161
m7 = 86.44
m6 = 119.8
m8 = 206.2
19
h9 = 2769 [kJ/kg]
h10 = 721.1 [kJ/kg]
m9 = 44.29
m10 = 161.9
h11 = 2769 [kJ/kg]
20
h15 = 2224
NCGS = 3.1 %
pdem = 7.7
h18 = 173.7 [kJ/kg]
m2 = 31.62
m3 = 61.88
m4 = 47.6
m5 = 38.83
m1 = 26.28
h1 = 1319
h2 = 1108
h3 = 1225
h4 = 1117
h5 = 1049
h13 = 2767 [kJ/kg]
h16 = 161.2 [kJ/kg]
h17 = 125.8 [kJ/kg]m18 = 43.85
m11 = 44.29
m13 = 43.85
Pmotor,fan = 604.4
Pmotor,pump1 = 8.877
Pmotor,pump2 = 856.5Pmotor,pump3 = 58.86
Pmotor,Vpump = 803
Pturbine,act = 20858
Tcold,air = 25Tcw,1 = 30
Tcw,2 = 38.49
Wturbine = 23190
Tout,ct = 31.49
Twb = 25
mmakeup,water = 35.11WHP1 = 11
WHP2 = 11
WHP3 = 11
WHP4 = 9.5
WHP5 = 9.5
∆p11 = 0.3
psep = 8
pcon = 0.08
m 1 = – 0.052 · WHP12 + 0.864 · WHP1 + 23.065
m 2 = 0.0474 · WHP22 + – 9.592 · WHP2 + 131.4
m 3 = – 0.11 · WHP32 + 0.792 · WHP3 + 66.481
m 6 = m 1 + m 2 + m 3
h6 = h1 · m 1 + h2 · m 2 + h3 · m 3
m 1 + m 2 + m 3
WHP1 = psep + ∆PB
WHP2 = psep + ∆PB
WHP3 = psep + ∆PB
∆PB = 3
m 4 = – 3.6339 · WHP42 + 81.173 · WHP4 – 395.58
m 5 = – 0.9644 · WHP52 + 15.269 · WHP5 – 19.184

Siregar 368 Report 16
m 7 = m 4 + m 5
h7 = h4 · m 4 + h5 · m 5
m 4 + m 5
∆PA = 1.5
WHP4 = psep + ∆PA
WHP5 = psep + ∆PA
m 8 = m 6 + m 7
h8 = h6 · m 6 + h7 · m 7
m 6 + m 7
p9 = psep
h9 = h ( 'Water' , x = 1 , P = p9 )
p10 = p9
h10 = h ( 'Water' , x = 0 , P = p10 )
x9 = h8 – h10
h9 – h10
m 9 = x9 · m 8
m 10 = ( 1 – x9 ) · m 8
m 12 = 0
m 11 = m 9 – m 12
h12 = h9
h11 = h9
pdem = psep – ∆ p11
p13 = pdem
m 13 = m 11 – m 14
m 14 = 0.01 · m 11
h13 = h ( 'Steam' , x = 1 , P = p13 )
p14 = pdem
h14 = h ( 'Steam' , x = 0 , P = p14 )
x13 = h11 – h14
h13 – h14
p15 = pcon
s 15 = s ( 'Steam' , x = 1 , P = pdem )
h15,s = h ( 'Steam' , s =s 15 , P = p15 )

Report 16 369 Siregar
ηs = 0.8
ηs = h13 – h15
h13 – h15,s
W = x13 · m 11 · ( h13 – h15 )
η total = 0.77
Wturbine = η total
ηs · W
∆ h,s = h13 – h15,s
∆ h = ηs · ∆ h,s
Tcw,1 = 30
Tcw,2 = Tsat ( 'Steam' , P = pcon ) – ∆TTcon,Tcw2
∆TTcw2,Thotair = 7
∆TTcon,Tcw2 = 3
Twb = 25
Thot,air = Tcw,2 – ∆TTcw2,Thotair
Tcold,air = Twb
Tout,ct = Thot,air
h18 = h ( 'Water' , x = 0 , P = pcon )
h17 = h ( 'Water' , T =Tcw,1 , P = 1 )
h16 = h ( 'Water' , x = 0 , T =Tcw,2 )
m g = 3.1100
· m 13
Ru = 8.314 [kJ/(kmol.K)]
Tcon = T ( 'Water' , x = 0 , P = pcon )
ηV,pump = 0.4
MCO2 = 44
Mgas = MCO2
patm = 1
Cp,gas = Cp ( 'CO2' , T =Tcon )
Cv ,gas = Cv ( 'CO2' , T =Tcon )
γ = Cp,gas
Cv ,gas
PVpump = γ
γ – 1 ·
m g · Ru · ( Tcon + 273.1 )
ηV,pump · Mgas ·
patm
pcon
γ – 1
γ – 1

Siregar 370 Report 16
ηmotor,Vpump = 0.85
Pmotor,Vpump = PVpump
ηmotor,Vpump
hcw,1 = h17
hcw,2 = h16
Qcon = ( h15 – h18 ) · m 13
m cw = Qcon
hcw,2 – hcw,1
hhot,air = h ( 'Air' , T =Thot,air )
hcold,air = h ( 'Air' , T =Tcold,air )
Cp,air = Cp ( 'Air' , T =Thot,air )
hg,1 = h ( 'Steam' , T =Tcold,air , x = 1 )
hg,2 = h ( 'Steam' , T =Tout,ct , x = 1 )
humrat1 = ω ( 'AirH2O' , T =Tcold,air , P = 1 , R =1 )
humrat2 = ω ( 'AirH2O' , T =Thot,air , P = 1 , R =1 )
humrat1 · hg,1 + Wa · hcw,2 = Cp,air · ( Thot,air – Tcold,air ) + humrat2 · hg,2 + ( Wa – ( humrat2 – humrat1 ) ) · hcw,1
m dry ,air = m cw
Wa
m makeup,water = m dry ,air · ( humrat2 – humrat1 ) + 0.22 · m dry ,air · ( humrat2 – humrat1 )
m airout = m dry ,air · ( 1 + humrat1 )
volumeair,total = m airout
ρair,o
∆ p,f an = 140
ρair,i = ρ ( 'Air' , T =Tcold,air , P = 1 )
ρair,o = ρ ( 'Air' , T =Thot,air , P = 1 )
g = 1
gc = 1
η f an = 0.7
vair = m dry ,air
ρair,o
Pf an = vair · ∆ p,f an
η f an · 1000
ηmotor,f an = 0.85
Pmotor,f an = Pf an
ηmotor,f an

Report 16 371 Siregar
∆ p,pump1 = 1510
vmakeup = m makeup,water
ρwater
ρwater = ρ ( 'Water' , T =25 , P = 1 )
Ppump,1 = vmakeup · ∆ p,pump1 · 10 5
ηpump · 1000
ηpump = 0.7
ηmotor,pump = 0.85
Pmotor,pump1 = Ppump,1
ηmotor,pump
∆ pump,2 = 2
pcw,2 = P ( 'Water' , T =42 , s =1 )
pcw,1 = P ( 'Water' , T =30 , s =1 )
vcw = m cw
ρ17
ρ17 = ρ ( 'Water' , T =30 , P = 1 )
ρ16 = ρ ( 'Water' , T =42 , P = 1 )
Ppump,2 = vcw · ∆ pump,2 · 10 5
ηpump · 1000
Pmotor,pump2 = Ppump,2
ηmotor,pump
∆ pump,3 = p10 – p18
p18 = pcon
m 18 = m 13
v18 = m 18
ρ18
T18 = T ( 'Water' , h =h18 , P = pcon )
ρ18 = ρ ( 'Water' , T =T18 , P = 1 )
Ppump,3 = v18 · ∆ pump,3 · 10 5
ηpump · 1000
Pmotor,pump3 = Ppump,3
ηmotor,pump
Pwater,pump = Pmotor,pump1 + Pmotor,pump2 + Pmotor,pump3
Pturbine,act = Wturbine – ( Pmotor,Vpump + Pmotor,f an + Pmotor,pump3 + Pmotor,pump2 + Pmotor,pump1 )

Siregar 372 Report 16
3. Calculation of the model {WHP[1]=10.7} m_dot[1]=(-0.052*(WHP[1])^2)+(0.864*WHP[1])+23.065 {h[1]=1319} {WHP[2]=9.1} m_dot[2]=(0.0474*(WHP[2])^2)+(-9.592*WHP[2])+131.4 {h[2]=1108} {WHP[3]=11.6} m_dot[3]=(-0.11*(WHP[3])^2)+(0.792*WHP[3])+66.481 {h[3]=1225} m_dot[6]=m_dot[1]+m_dot[2]+m_dot[3] h[6]=(h[1]*m_dot[1]+h[2]*m_dot[2]+h[3]*m_dot[3])/(m_dot[1]+m_dot[2]+m_dot[3]) WHP[1]=p_sep+DELTAP_B WHP[2]=p_sep+DELTAP_B WHP[3]=p_sep+DELTAP_B DELTAP_B=3 {WHP[4]=11.4} m_dot[4]=(-3.6339*(WHP[4])^2)+(81.173*WHP[4])-395.58 {h[4]=1117} {WHP[5]=7.7} m_dot[5]=(-0.9644*(WHP[5])^2)+(15.269*WHP[5])-19.184 {h[5]=1049} m_dot[7]=m_dot[4]+m_dot[5] h[7]=(h[4]*m_dot[4]+h[5]*m_dot[5])/(m_dot[4]+m_dot[5]) DELTAP_A=1.5 WHP[4]=p_sep+DELTAP_A WHP[5]=p_sep+DELTAP_A m_dot[8]=m_dot[6]+m_dot[7] h[8]=(h[6]*m_dot[6]+h[7]*m_dot[7])/(m_dot[6]+m_dot[7]) {p_sep=9} p[9]=p_sep h[9]=ENTHALPY(Water,x=1,P=p[9]) p[10]=p[9] h[10]=ENTHALPY(Water,x=0,P=p[10]) x_9=(h[8]-h[10])/(h[9]-h[10]) m_dot[9]=x_9*m_dot[8] m_dot[10]=(1-x_9)*m_dot[8] m_dot[12]=0 m_dot[11]=(m_dot[9])-m_dot[12] h[12]=h[9] h[11]=h[9] {DELTA_p11=0.3} p_dem=p_sep-DELTA_p11 p[13]=p_dem m_dot[13]=m_dot[11]-m_dot[14] m_dot[14]=0.01*m_dot[11]

Report 16 373 Siregar
h[13]=ENTHALPY(Steam,x=1,P=p[13]) p[14]=p_dem h[14]=ENTHALPY(Steam,x=0,P=p[14]) x_13=(h[11]-h[14])/(h[13]-h[14]) {p_con=0.1} p[15]=p_con s_15=ENTROPY(Steam,x=1,P=p_dem) h_15_s=ENTHALPY(Steam,s=s_15,P=p[15]) eta_s=0.8 eta_s=(h[13]-h[15])/(h[13]-h_15_s) W_dot=x_13*m_dot[11]*(h[13]-h[15]) eta_total=0.77 W_dot_turbine=eta_total/eta_s*W_dot DELTA_h_s=h[13]-h_15_s DELTA_h=eta_s*DELTA_h_s {h[15]=h[13]-DELTA_h} T_cw_1=30 T_cw_2=T_SAT(Steam,P=P_con)-DELTAT_Tcon_Tcw2 DELTAT_Tcw2_Thotair=7 DELTAT_Tcon_Tcw2=3 T_wb=25 T_hot_air=T_cw_2-DELTAT_Tcw2_Thotair T_cold_air=T_wb T_out_ct=T_hot_air h[18]=ENTHALPY(Water,X=0,P=p_con) h[17]=ENTHALPY(Water,T=T_cw_1,P=1) h[16]=ENTHALPY(Water,x=0,T=T_cw_2) m_dot_g=(3.1/100)*m_dot[13] R_u=8.314[kJ/(kmol.K)] T_con=TEMPERATURE(Water,x=0,P=p_con) eta_V_pump=0.4 M_CO2=44 M_gas=M_CO2 p_atm=1 C_p_gas=CP(CO2,T=T_con) C_v_gas=CV(CO2,T=T_con) gamma=C_p_gas/C_v_gas P_Vpump= (gamma/(gamma-1))*((m_dot_g*R_u*(T_con+273.1))/(eta_V_pump*M_gas))*(((p_atm/p_con)^((gamma-1)/gamma))-1) eta_motor_Vpump=0.85 P_motor_Vpump=P_Vpump/eta_motor_Vpump h_cw_1=h[17] h_cw_2=h[16] Q_con=(h[15]-h[18])*m_dot[13] m_dot_cw=Q_con/(h_cw_2-h_cw_1) h_hot_air=ENTHALPY(Air,T=T_hot_air) h_cold_air=ENTHALPY(Air,T=T_cold_air) C_p_air=CP(Air,T=T_hot_air) h_g_1=ENTHALPY(Steam,T=T_cold_air,x=1) h_g_2=ENTHALPY(Steam,T=T_out_ct,x=1) humrat_1=HUMRAT(AirH2O,T=T_cold_air,P=1,R=1) humrat_2=HUMRAT(AirH2O,T=T_hot_air,P=1,R=1) humrat_1*(h_g_1)+W_a*(h_cw_2)=C_p_air*(T_hot_air-T_cold_air)+humrat_2*(h_g_2)+(W_a-(humrat_2-humrat_1))*(h_cw_1)

Siregar 374 Report 16
m_dry_air=m_dot_cw/W_a m_makeup_water=m_dry_air*(humrat_2-humrat_1)+(0.22*(m_dry_air*(humrat_2-humrat_1))) m_airout=m_dry_air*(1+humrat_1) volume_air_total=m_airout/rho_air_o DELTA_p_fan=140 rho_air_i=DENSITY(Air,T=T_cold_air,P=1) rho_air_o=DENSITY(Air,T=T_hot_air,P=1) g=1 g_c=1 eta_fan=0.7 v_dot_air=m_dry_air/rho_air_o P_fan=((v_dot_air*DELTA_p_fan)/(eta_fan))/1000 eta_motor_fan=0.85 P_motor_fan=P_fan/eta_motor_fan DELTA_p_pump1=15/10 v_dot_makeup=m_makeup_water/rho_water rho_water=DENSITY(Water,T=25,P=1) P_pump_1=((v_dot_makeup*(DELTA_p_pump1*10^5))/eta_pump)/1000 eta_pump=0.7 eta_motor_pump=0.85 P_motor_pump1=P_pump_1/eta_motor_pump DELTA_pump_2=2 p_cw_2=PRESSURE(Water,T=42,s=1) p_cw_1=PRESSURE(Water,T=30,s=1) v_dot_cw=m_dot_cw/rho_17 rho_17=DENSITY(Water,T=30,P=1) rho_16=DENSITY(Water,T=42,P=1) P_pump_2=((v_dot_cw*(DELTA_pump_2*10^5))/eta_pump)/1000 P_motor_pump2=P_pump_2/eta_motor_pump DELTA_pump_3=(p[10]-p_18) p_18=p_con m_18=m_dot[13] v_dot_18=m_18/rho_18 T_18=TEMPERATURE(Water,h=h[18],P=p_con) rho_18=DENSITY(Water,T=T_18,P=1) P_pump_3=((v_dot_18*(DELTA_pump_3*10^5))/eta_pump)/1000 P_motor_pump3=P_pump_3/eta_motor_pump P_water_pump=P_motor_pump1+P_motor_pump2+P_motor_pump3 P_turbine_act=W_dot_turbine-(P_motor_Vpump+P_motor_fan+P_motor_pump3+P_motor_pump2+P_motor_pump1)
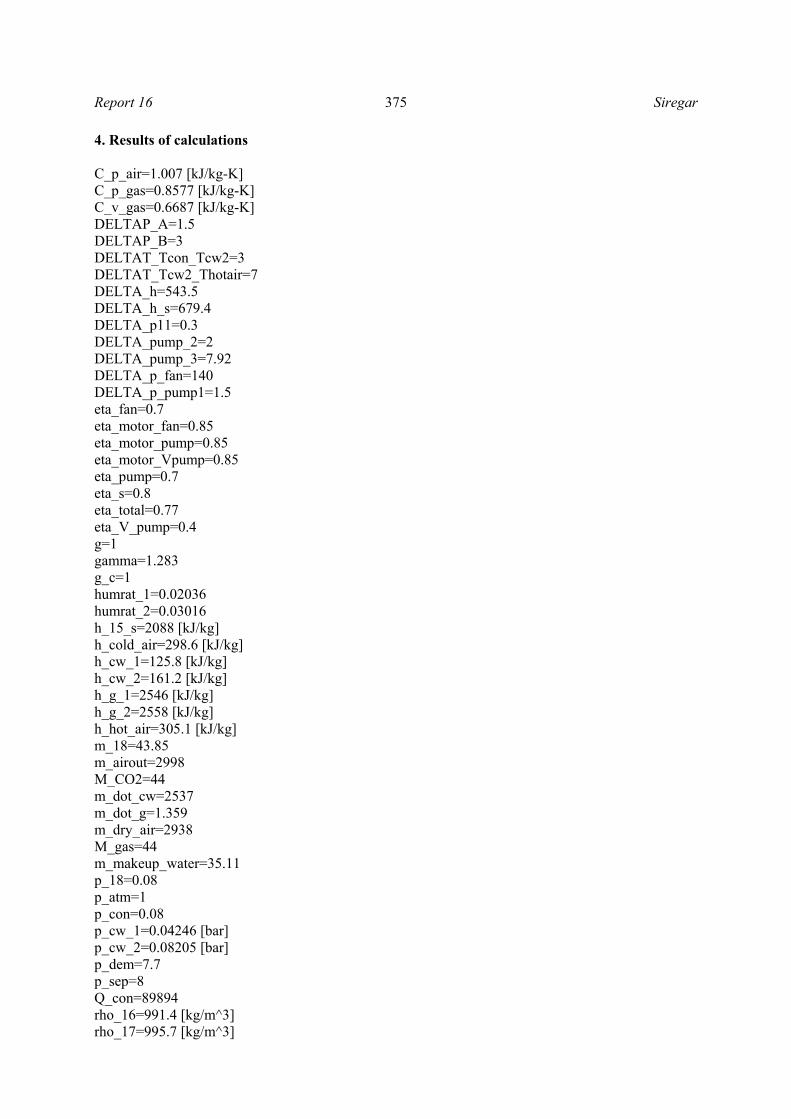
Report 16 375 Siregar
4. Results of calculations C_p_air=1.007 [kJ/kg-K] C_p_gas=0.8577 [kJ/kg-K] C_v_gas=0.6687 [kJ/kg-K] DELTAP_A=1.5 DELTAP_B=3 DELTAT_Tcon_Tcw2=3 DELTAT_Tcw2_Thotair=7 DELTA_h=543.5 DELTA_h_s=679.4 DELTA_p11=0.3 DELTA_pump_2=2 DELTA_pump_3=7.92 DELTA_p_fan=140 DELTA_p_pump1=1.5 eta_fan=0.7 eta_motor_fan=0.85 eta_motor_pump=0.85 eta_motor_Vpump=0.85 eta_pump=0.7 eta_s=0.8 eta_total=0.77 eta_V_pump=0.4 g=1 gamma=1.283 g_c=1 humrat_1=0.02036 humrat_2=0.03016 h_15_s=2088 [kJ/kg] h_cold_air=298.6 [kJ/kg] h_cw_1=125.8 [kJ/kg] h_cw_2=161.2 [kJ/kg] h_g_1=2546 [kJ/kg] h_g_2=2558 [kJ/kg] h_hot_air=305.1 [kJ/kg] m_18=43.85 m_airout=2998 M_CO2=44 m_dot_cw=2537 m_dot_g=1.359 m_dry_air=2938 M_gas=44 m_makeup_water=35.11 p_18=0.08 p_atm=1 p_con=0.08 p_cw_1=0.04246 [bar] p_cw_2=0.08205 [bar] p_dem=7.7 p_sep=8 Q_con=89894 rho_16=991.4 [kg/m^3] rho_17=995.7 [kg/m^3]

Siregar 376 Report 16
rho_18=991.6 [kg/m^3] rho_air_i=1.169 [kg/m^3] rho_air_o=1.144 [kg/m^3] rho_water=997.1 [kg/m^3] R_u=8.314 [kJ/(kmol.K)] s_15=6.676 [kJ/kg-K] T_18=41.49 [C] T_cold_air=25 T_con=41.49 [C] T_cw_1=30 T_cw_2=38.49 T_hot_air=31.49 T_out_ct=31.49 T_wb=25 volume_air_total=2621 v_dot_18=0.04422 v_dot_air=2569 v_dot_cw=2.548 v_dot_makeup=0.03521 W_a=0.8636 x_13=1.001 x_9=0.2148 P_fan=513.8 P_pump_1=7.545 P_pump_2=728 P_pump_3=50.03 P_Vpump=682.6 P_water_pump=924.2 P_motor_fan=604.4 P_motor_pump1=8.877 P_motor_pump2=856.5 P_motor_pump3=58.86 P_motor_Vpump=803 W_dot=24094 W_dot_turbine=23190 P_turbine_act=20858