optimization of mechanical properties of e … · optimization of mechanical properties of e ......
TRANSCRIPT

OPTIMIZATION OF MECHANICAL PROPERTIES OF E-GLASS WOVEN FABRICCOMPOSITE
N. Azhaguvel1, S. Charles2 and M. Senthilkumar31Dhanalakshmi Srinivasan Institute of Research and Technology, Perambalur, India
2Dhanalakshmi Srinivasan College of Engineering, Coimbatore, India3PSG College of Technology, Coimbatore, India
E-mail: [email protected], [email protected], [email protected]
Received October 2016, Accepted May 2017No.16-CSME-120, E.I.C. Accession 4006
ABSTRACTManufacturing of composite material has been an extensive area of research as they have high strength-to-weight ratio that are equivalent or superior to many metallic materials. This paper describes the preparationof E-Glass (woven fabric) Fiber Reinforced Polymer Composite (GFRP) with different fiber mat material,orientation and resin. The purpose of this paper is to investigate the influence of the process parameterson the mechanical properties of GFRP composite using Taguchi experimental design in combination withGrey Relational Analysis (GRA). The conclusion revealed that fiber orientation and resin were the mostinfluential factor on the mechanical properties, respectively. It is observed that the optimum properties wereobtained at 400 fabric mat, polyester resin, 45◦/–45◦ orientation.
Keywords: E-glass composite; Grey–Taguchi method; ANOVA; scanning electron microscopy.
OPTIMISATION DES PROPRIÉTÉS MÉCANIQUES D’UN COMPOSITE DE TISSU DE FIBREDE VERRE-E
RÉSUMÉLa fabrication de matériaux composites est depuis longtemps un vaste domaine de recherche, en ce qu’ils ontun rapport élevé de résistance/poids qui est équivalent ou supérieur à beaucoup de matériaux métalliques. Leprésent article décrit la préparation du tissu de fibre de verre-E (tissu tissé) de polymères renforcés de fibre deverre (PRFV) avec différents matériaux plats fibreux. Le but de cette recherche est l’étude de l’influence desparamètres de procédé sur les propriétés mécaniques du composite PRFV en utilisant la méthode Taguchien combinaison avec l’analyse rationnelle gris (GRA). La conclusion révèle que l’orientation de la fibre etla résine étaient respectivement les facteurs qui avaient le plus d’influence sur les propriétés mécaniques. Ona observé que les propriétés optimales étaient obtenues pour des matériaux plats fibreux de 400, de résinede polyester, et d’une orientation de 45◦/–45◦.
Mots-clés : composite de fibre de verre-E; méthode Grey–Taguchi; ANOVA; microscope optique à ba-layage.
Transactions of the Canadian Society for Mechanical Engineering, Vol. 41, No. 3, 2017 375
1. INTRODUCTION
A composite material can be defined as a combination of two or more materials that results in better prop-erties than those of the individual components used alone. In disparity to metallic alloys, each materialretains its separate chemical, physical, and mechanical properties. The two constituents are reinforcementand a matrix. The main advantages of composite materials are their high strength and stiffness, combinedwith low density, when compared with bulk materials, allowing for a weight reduction in the finished part,Vignesh et al. [1] investigated the optimization condition of the mechanical behaviors on the compositematerial properties namely tensile, compressive, flexural and impact strength using Grey–Taguchi analysis.Mat Kandar and Akil [2], studied the effect of optimizing the hot press forming process parameters usingResponse Surface Methodology (RSM) developed a model to expand the mechanical properties of the wo-ven composites. Mahesh and Senthilkumar [3] investigated the tensile and flexural behavior of glass fiberreinforced aluminum laminates (Glare) with different orientation and concluded that the most significantfactor of flexural strength respectively. In [4] Raif Sakin et al. used samples produced by the RTM (ResinTransfer Molding)method to investigate bending fatigue performances for glass-fiber composite material.The property of the GFRP (Glass Fiber Reinforced Plastic) material is dominant on the fatigue strengthwhich has been evidently observed from the experiments. Gunasegaran et al. [5], studied the four processparameters and their subsequent study on the effects of the mechanical properties of filament wound GlassReinforced Plastic (GRP) pipes was conducted. In [6], mechanical properties for glass fiber compositeswere evaluated by Kumar Tanwer. Composites were prepared with longitudinal and cross Bidirectionalglass fiber reinforced with epoxy based polymer. Unidirectional oriented glass fiber epoxy composites havelarge values of all the properties, such as ultimate force, yield force, compressive strength, tensile strength,elongation, etc., in tensile as well as in compression tests. It means that unidirectional oriented glass fibercomposites are stronger than bidirectional glass fiber composites. Yadav Eagala et al. [7] studied the phys-ical and abrasive wear behaviour of the compositesusing Taguchi’s experimental design. Bhanu Kiran etal. [8] improved the mechanical properties of green composites by optimizing the hot press forming pro-cess parameters using Taguchi’s analysis. Process parameters such as temperature, pressure, heating time,cooling system and recrystallization soak time were chosen for evaluation by Taguchi’s method. It is ev-ident that the establishment of optimal combination of hot press forming parameters is very beneficial tothe manufacturing of green composites with better tensile, flexural and impact strength [9]. In this study,fabrication parameters, namely red mud percentage, fiber treatment, length of fiber, and weight fractionof fiber, are optimized with consideration of multi response such as impact strength, flexural strength, andtensile strength. A grey relational grade is obtained from the grey analysis. Optimum level of parametershas been identified and significant parameters are determined by analysis of variance (ANOVA). In [10], themulti characteristics optimization and identification are carried out. To find the influence of parameter usingdesign of experiment techniques, Vignesh et al. [11] investigated the optimization of the process parametersto enhance the mechanical properties of bone powder impregnated coir fiber reinforced polyester compos-ites using Taguchi’s method in combination with Grey relational analysis. The recommended parameterlevels are 0.5 mm coir fiber diameter, 80 mm coir fiber length, 20% weight of BP content and 120 m BPsize which is taken from the response table and graph. It gives the maximum the tensile strength, flexuralstrength, compressive strength and impact energy. Kumar Vankanti and Ganta [12] optimized the processparameters, namely cutting speed, feed, point angle and chisel edge width in drilling of glass fiber reinforcedpolymer (GFRP) composites. The results indicate that at a speed of 500 rpm, a feed rate of 0.06 mm/rev, apoint angle at 950 and a chisel edge width of 1.6 mm are found to be optimal [13].
This article presents a method for optimizing the deep cryogenic treatment (DCT) process parameters for100Cr6 bearing steel using Taguchi’s method with Grey’s relational analysis. The DCT parameters con-sidered for the optimization included the cooling rate, soaking temperature, soaking time, and tempering
376 Transactions of the Canadian Society for Mechanical Engineering, Vol. 41, No. 3, 2017

Table 1. Parameter and their levels.Parameter Symbols Units Levels
1 2 3Mat M GSM 200 400 600Resin R – E P IOrientation O Degree 0◦/90◦ 30◦/60◦ 45◦/–45◦
temperature. The concluded that the Grey–Taguchi method showed a 13.77% improvement in dimensionalstability, a 49.02% improvement in wear resistance, and a 19.35% improvement in the hardness compared to100Cr6 bearing steel samples without cryogenic treatment [14]. E-glass fiber reinforced epoxy compositeswere fabricated by hand lay-up method and investigating the tribology behaviors. The Taguchi method wasemployed. It can be concluded that the applied load (82.60%) had the highest influence on the wear rateof E-glass fiber reinforced epoxy composites. According to the analysis of variance for coefficient of fric-tion, the sliding speed (50.45%) is the most significant factor [15]. A series of vinyl ester and polyurethaneinterpenetrating polymer networks were prepared by changing the component ratios of VER (Vinyl Es-ter) and PU (Polyurethane) and the polymerization process was confirmed with Fourier Transform infraredspectroscopy. The mechanical properties of the E-glass and carbon fiber specimens were compared fromtests including tensile, compressive, flexural, ILSS (Inter Laminar Shear Strength), impact and Head De-flection Test (HDT). El-Kady et al. [16] investigated several AA7075 wrought aluminum alloy feedstock,produced using the Cooling Slope (CS) casting technique at different fabrication conditions. The optimumvalues of pouring temperature, cooling length and tilt angle were found to be 650◦C, 350 mm and 45◦C,respectively.
2. EXPERIMENTAL DESIGN TECHNIQUE
The design of experiments is a great tool for modeling and analyzing the direction of control factors onperformance output. The most important stage in the design of experiments is the selection of the controlfactors. An, exhaustive literature review on mechanical performance of polymer composites exposes thatparameters such as, tensile, compressive, flexural and impact largely influence the mechanical propertiesof polymer composites. The effect of these four parameters is studied using L9 orthogonal design. Here,only the main effects of the factors are of interest, and their relations are excepted from data analysis. Theprocessing conditions under which E-Glass composites are fabricated are given in Table 2. All the threeparameters have three levels. In a full factorial experiment design, it would require combination of runsto study three parameters each at three levels, whereas Taguchi’s factorial experiment approach reducesit to only 9 runs, offering a great advantage in terms of experimental cost and time. The experimentalobservations are further transformed into a signal-to-noise (S/N) ratios. Based on the type of performancecharacteristics, one has to select the suitable S/N ratio. In this study, “higher is better” is considered tomaximize tensile, compressive, flexural and impact strength of the E-Glass woven fabric composites. Forthis case, S/N ratio is calculated as a logarithmic transformation of loss function as shown below.
The designed experiments are shown in Table 1. Each column represents a process parameter, whereas arow stands for processing condition, which is nothing but a combination of parameter levels. The mechanicaltests were carried out on these experiments and simulated three times. The levels of the factors are assignedto the L9 orthogonal array and there are obtained in Table 2.
Transactions of the Canadian Society for Mechanical Engineering, Vol. 41, No. 3, 2017 377

Table 2. L9 orthogonal array.Runs Levels of Levels of Levels of
parameter – A parameter – B parameter – C1 1 1 12 1 2 23 1 3 34 2 1 25 2 2 36 2 3 17 3 1 38 3 2 19 3 3 2
3. GREY RELATIONAL ANALYSIS
The Grey relational analysis (GRA) based on Grey’s system idea can be used to solve complicated inter-relationships among the multiple responses. GRA is actually a measurement of the absolute value of thedata difference between sequences, and it can be used to measure the near correlation between sequences.The multiresponse process based on GRA is combined with the Taguchi method to determine the optimalcombination of the factor levels and optimize the mechanical properties of the E-glass fiber with the ob-jective of maximizing the tensile, compressive, flexural and impact. The overall approximation of the S/Nratio is necessary for optimization of the multiple performance characteristics. In GRA, the experimen-tal data of the quality characteristics are first normalized to a range from zero to one, known as the Greyrelation generation. The next step is determination of the Grey relation coefficient, which is based on thenormalized experimental data to represent the relationship between the desired and actual experimental data.The Grey relation grade is calculated by averaging the Grey relational coefficient corresponding to the se-lected responses. The overall performance characteristic of the multiple response process also depends onthe calculated Grey relational grade. The optimization problem results in changing the multiple responseprocess into the optimization of a single response by utilizing the function of the Grey relation grade. Theoptimal levelof the process parameter is the level at which the maximum overall Grey relational grade canbe achieved. In addition, analysis of variance (ANOVA) was used to identify the effect of the individualmechanical properties. The final step is to verify the improvement and the optimal level of the mechanicalproperties by conducting a confirmation experiment using the results obtained from the analysis.
4. EXPERIMENTATION
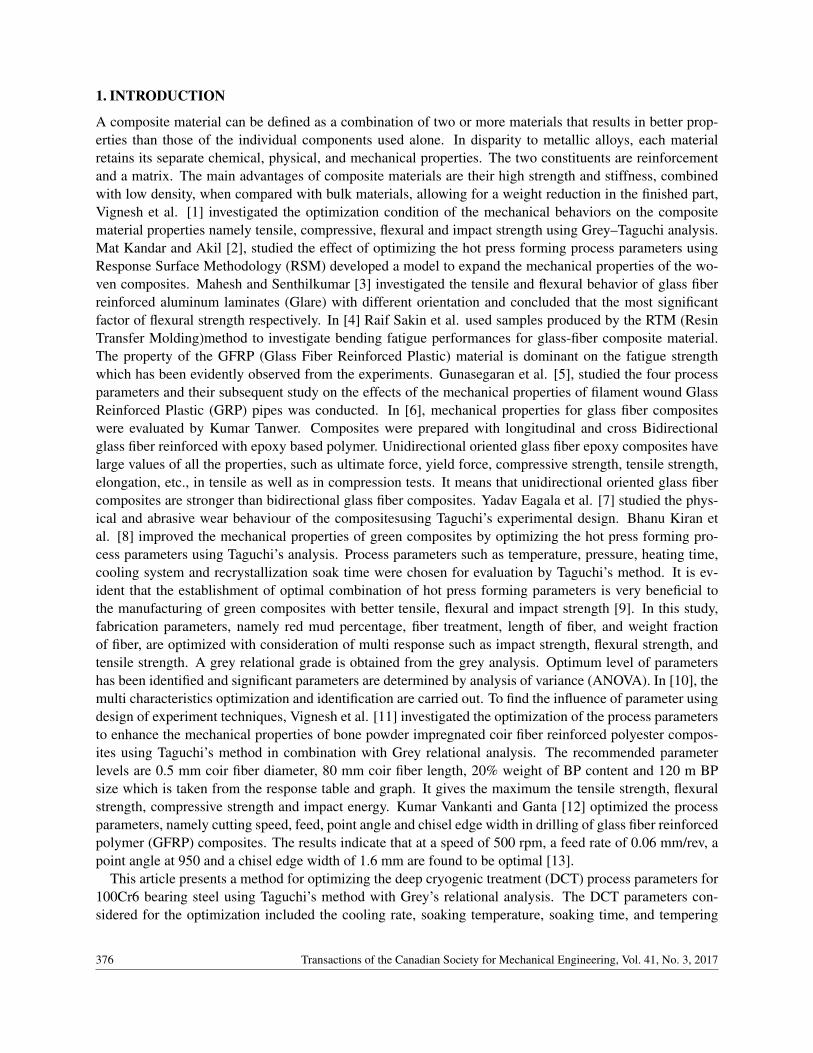
4.1. Tensile TestThe tensile testis one of the most widely used of the mechanical test. The commonly used specimen fortensile test as per ASTM (D638) is the dog-bone type. During the test a uniaxial load is applied both theends of the specimen. Typical points of interest when testing a material include: ultimate tensile strength(UTS) or peak stress; counterweigh yield strength (CYS) which represents a point just beyond the beginningof permanent deformation; and the rupture (R) or fracture point. The tensile test is usually carried out withhelp of a universal testing machine (UTM), three different types of specimens are prepared based on theorientation, and the schematic diagram of tensile test specimen is shown in Fig. 1.
378 Transactions of the Canadian Society for Mechanical Engineering, Vol. 41, No. 3, 2017
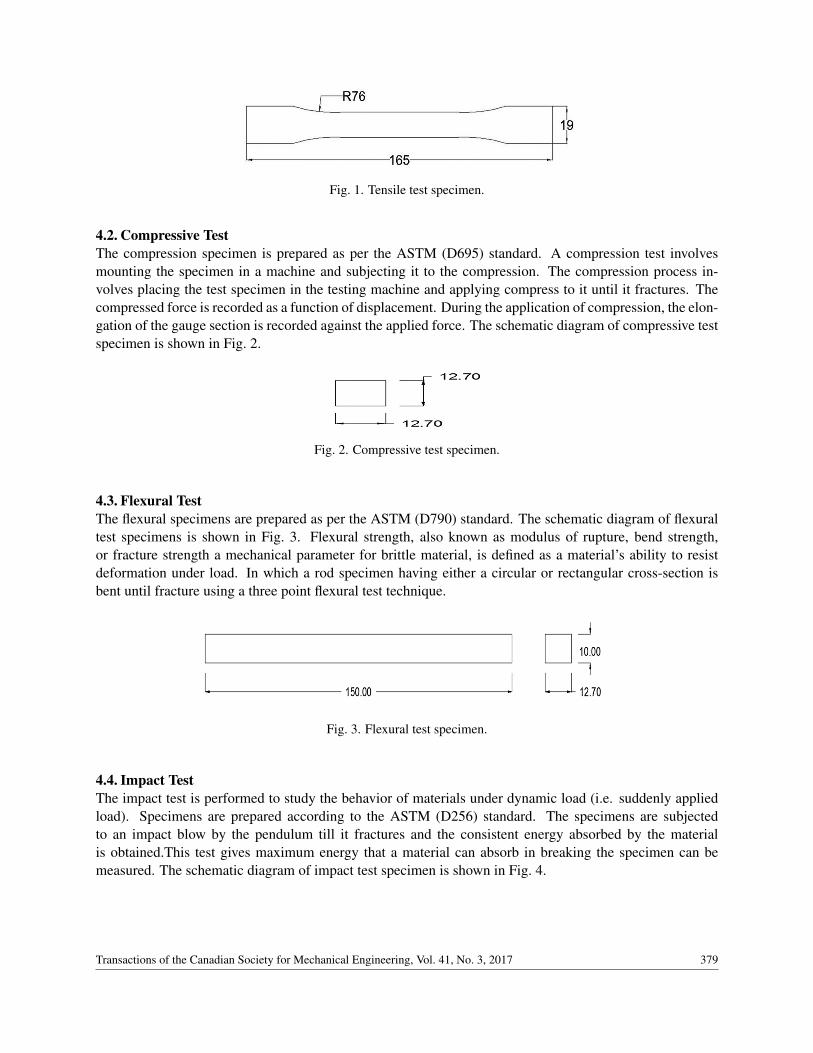
Fig. 1. Tensile test specimen.
4.2. Compressive TestThe compression specimen is prepared as per the ASTM (D695) standard. A compression test involvesmounting the specimen in a machine and subjecting it to the compression. The compression process in-volves placing the test specimen in the testing machine and applying compress to it until it fractures. Thecompressed force is recorded as a function of displacement. During the application of compression, the elon-gation of the gauge section is recorded against the applied force. The schematic diagram of compressive testspecimen is shown in Fig. 2.
Fig. 2. Compressive test specimen.
4.3. Flexural TestThe flexural specimens are prepared as per the ASTM (D790) standard. The schematic diagram of flexuraltest specimens is shown in Fig. 3. Flexural strength, also known as modulus of rupture, bend strength,or fracture strength a mechanical parameter for brittle material, is defined as a material’s ability to resistdeformation under load. In which a rod specimen having either a circular or rectangular cross-section isbent until fracture using a three point flexural test technique.
Fig. 3. Flexural test specimen.
4.4. Impact TestThe impact test is performed to study the behavior of materials under dynamic load (i.e. suddenly appliedload). Specimens are prepared according to the ASTM (D256) standard. The specimens are subjectedto an impact blow by the pendulum till it fractures and the consistent energy absorbed by the materialis obtained.This test gives maximum energy that a material can absorb in breaking the specimen can bemeasured. The schematic diagram of impact test specimen is shown in Fig. 4.
Transactions of the Canadian Society for Mechanical Engineering, Vol. 41, No. 3, 2017 379

Fig. 4. Impact test specimen.
Table 3. List of ingredients to prepare a composite laminate.Description ParameterType of resin Epoxy, polyester, iso-phthalicType of fiber E-Glass (200, 400, 600 woven fabric)Hardener used HY 951No. plies per laminate 10Nature of laminate Symmetric typeMethod of preparation Compression moulding method
5. GREY RELATIONAL ANALYSIS FOR THE EXPERIMENTAL RESULTS
The ingredients of composite laminate for E-glass fiber and its standard specification are shown in Table 3.The results obtained from the E-Glass fiber samples with respect to Orthogonal array for tensile, compres-sive, flexural and impact test are shown in table 4.three replications were performed for all the factor levelsettings per the Taguchi orthogonal array. Y1, Y2, and Y3 refer to the replications.
5.1. Signal-to-Noise RatioThe response values from the three replicates were transformed into an S/N ratio. The equation for cal-culating the S/N ratio is based on “the lower the better”, “the higher the better” or “the more nominal thebetter”.
1. The lower the better: this characteristic is a non-negative measurable characteristic that has an idealstate value of zero.
S/N ratio =−10log10
(1n
n
∑i=1
y2i j
)(1)
This should be applied to the problem when the minimization of the quality characteristics is intended.
2. The higher the better: the characteristic is a nonnegative measurable that has an ideal state value ofinfinity:
S/N ratio =−10log10
(1n
n
∑i=1
1y2
i j
)(2)
This should be applied to the problem when the maximization of the quality characteristic is intended.
3. The more nominal the better: this is a measurable characteristic with a specific user-defined targetvalue. The value may be positive or negative:
S/N ratio =−1− log10
(µ2
σ2
)(3)
380 Transactions of the Canadian Society for Mechanical Engineering, Vol. 41, No. 3, 2017
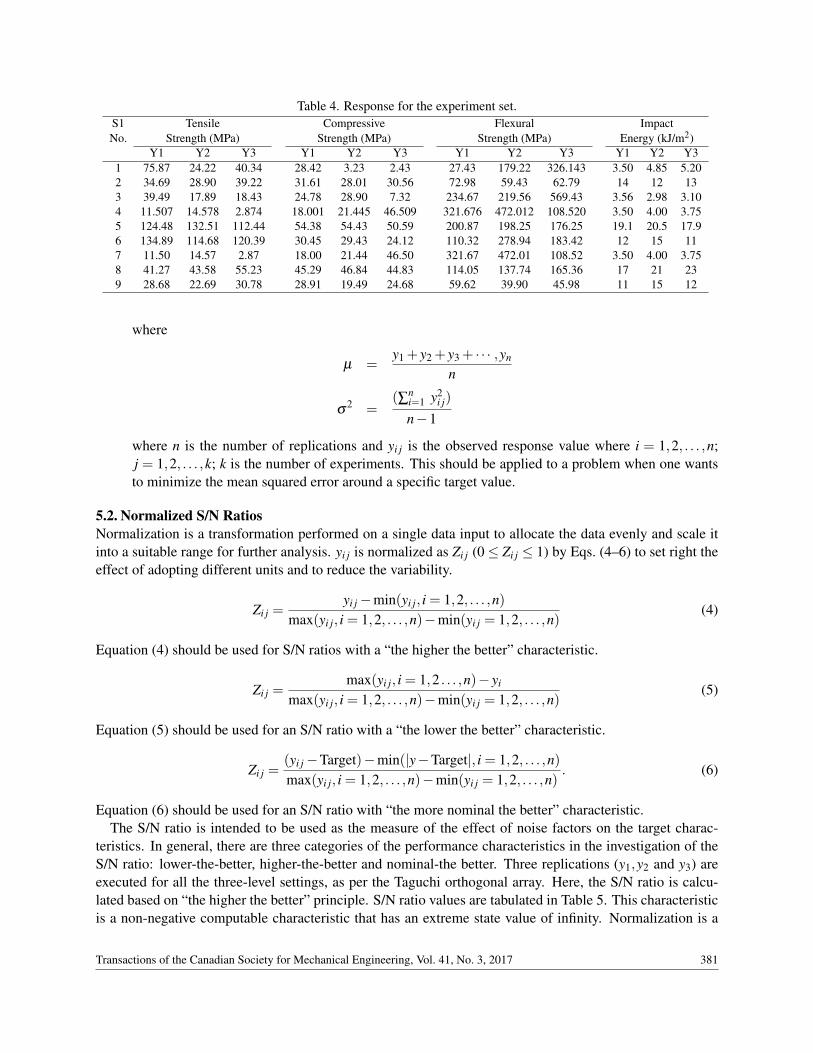
Table 4. Response for the experiment set.S1 Tensile Compressive Flexural ImpactNo. Strength (MPa) Strength (MPa) Strength (MPa) Energy (kJ/m2)
Y1 Y2 Y3 Y1 Y2 Y3 Y1 Y2 Y3 Y1 Y2 Y31 75.87 24.22 40.34 28.42 3.23 2.43 27.43 179.22 326.143 3.50 4.85 5.202 34.69 28.90 39.22 31.61 28.01 30.56 72.98 59.43 62.79 14 12 133 39.49 17.89 18.43 24.78 28.90 7.32 234.67 219.56 569.43 3.56 2.98 3.104 11.507 14.578 2.874 18.001 21.445 46.509 321.676 472.012 108.520 3.50 4.00 3.755 124.48 132.51 112.44 54.38 54.43 50.59 200.87 198.25 176.25 19.1 20.5 17.96 134.89 114.68 120.39 30.45 29.43 24.12 110.32 278.94 183.42 12 15 117 11.50 14.57 2.87 18.00 21.44 46.50 321.67 472.01 108.52 3.50 4.00 3.758 41.27 43.58 55.23 45.29 46.84 44.83 114.05 137.74 165.36 17 21 239 28.68 22.69 30.78 28.91 19.49 24.68 59.62 39.90 45.98 11 15 12
where
µ =y1 + y2 + y3 + · · · ,yn
n
σ2 =
(∑ni=1 y2
i j)
n−1
where n is the number of replications and yi j is the observed response value where i = 1,2, . . . ,n;j = 1,2, . . . ,k; k is the number of experiments. This should be applied to a problem when one wantsto minimize the mean squared error around a specific target value.
5.2. Normalized S/N RatiosNormalization is a transformation performed on a single data input to allocate the data evenly and scale itinto a suitable range for further analysis. yi j is normalized as Zi j (0≤ Zi j ≤ 1) by Eqs. (4–6) to set right theeffect of adopting different units and to reduce the variability.
Zi j =yi j−min(yi j, i = 1,2, . . . ,n)
max(yi j, i = 1,2, . . . ,n)−min(yi j = 1,2, . . . ,n)(4)
Equation (4) should be used for S/N ratios with a “the higher the better” characteristic.
Zi j =max(yi j, i = 1,2 . . . ,n)− yi
max(yi j, i = 1,2, . . . ,n)−min(yi j = 1,2, . . . ,n)(5)
Equation (5) should be used for an S/N ratio with a “the lower the better” characteristic.
Zi j =(yi j−Target)−min(|y−Target|, i = 1,2, . . . ,n)max(yi j, i = 1,2, . . . ,n)−min(yi j = 1,2, . . . ,n)
. (6)
Equation (6) should be used for an S/N ratio with “the more nominal the better” characteristic.The S/N ratio is intended to be used as the measure of the effect of noise factors on the target charac-
teristics. In general, there are three categories of the performance characteristics in the investigation of theS/N ratio: lower-the-better, higher-the-better and nominal-the better. Three replications (y1,y2 and y3) areexecuted for all the three-level settings, as per the Taguchi orthogonal array. Here, the S/N ratio is calcu-lated based on “the higher the better” principle. S/N ratio values are tabulated in Table 5. This characteristicis a non-negative computable characteristic that has an extreme state value of infinity. Normalization is a
Transactions of the Canadian Society for Mechanical Engineering, Vol. 41, No. 3, 2017 381
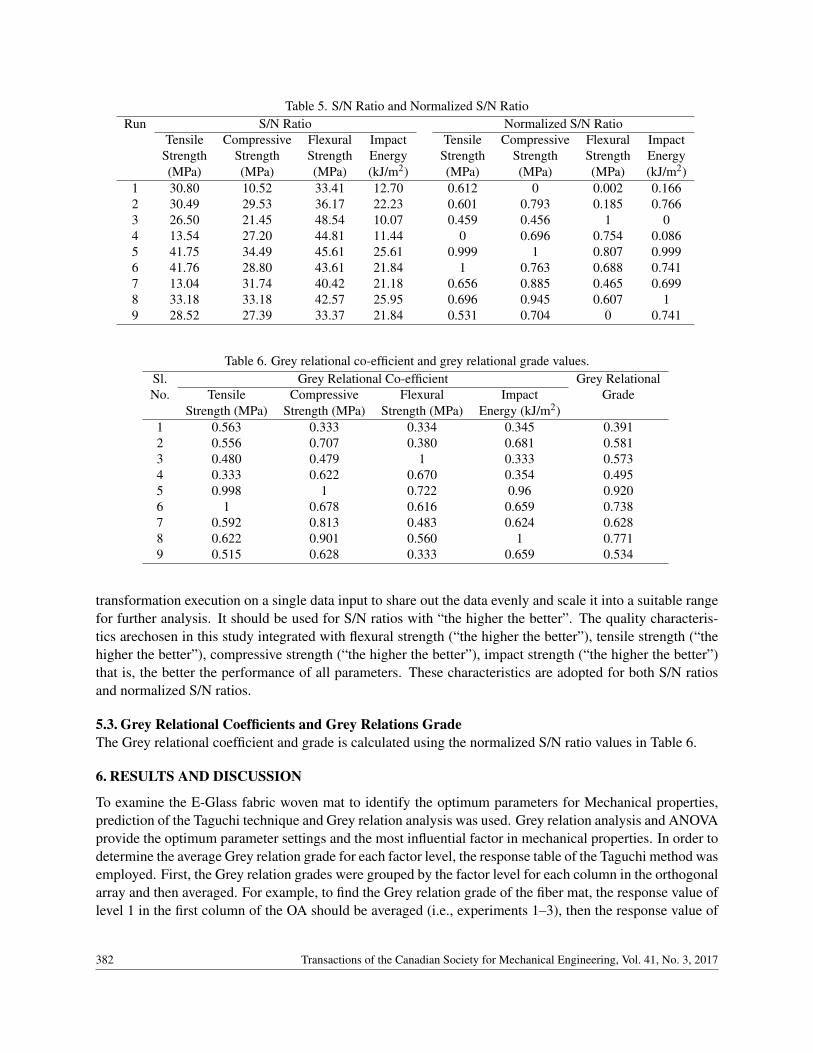
Table 5. S/N Ratio and Normalized S/N RatioRun S/N Ratio Normalized S/N Ratio
Tensile Compressive Flexural Impact Tensile Compressive Flexural ImpactStrength Strength Strength Energy Strength Strength Strength Energy(MPa) (MPa) (MPa) (kJ/m2) (MPa) (MPa) (MPa) (kJ/m2)
1 30.80 10.52 33.41 12.70 0.612 0 0.002 0.1662 30.49 29.53 36.17 22.23 0.601 0.793 0.185 0.7663 26.50 21.45 48.54 10.07 0.459 0.456 1 04 13.54 27.20 44.81 11.44 0 0.696 0.754 0.0865 41.75 34.49 45.61 25.61 0.999 1 0.807 0.9996 41.76 28.80 43.61 21.84 1 0.763 0.688 0.7417 13.04 31.74 40.42 21.18 0.656 0.885 0.465 0.6998 33.18 33.18 42.57 25.95 0.696 0.945 0.607 19 28.52 27.39 33.37 21.84 0.531 0.704 0 0.741
Table 6. Grey relational co-efficient and grey relational grade values.Sl. Grey Relational Co-efficient Grey RelationalNo. Tensile Compressive Flexural Impact Grade
Strength (MPa) Strength (MPa) Strength (MPa) Energy (kJ/m2)1 0.563 0.333 0.334 0.345 0.3912 0.556 0.707 0.380 0.681 0.5813 0.480 0.479 1 0.333 0.5734 0.333 0.622 0.670 0.354 0.4955 0.998 1 0.722 0.96 0.9206 1 0.678 0.616 0.659 0.7387 0.592 0.813 0.483 0.624 0.6288 0.622 0.901 0.560 1 0.7719 0.515 0.628 0.333 0.659 0.534
transformation execution on a single data input to share out the data evenly and scale it into a suitable rangefor further analysis. It should be used for S/N ratios with “the higher the better”. The quality characteris-tics arechosen in this study integrated with flexural strength (“the higher the better”), tensile strength (“thehigher the better”), compressive strength (“the higher the better”), impact strength (“the higher the better”)that is, the better the performance of all parameters. These characteristics are adopted for both S/N ratiosand normalized S/N ratios.
5.3. Grey Relational Coefficients and Grey Relations GradeThe Grey relational coefficient and grade is calculated using the normalized S/N ratio values in Table 6.
6. RESULTS AND DISCUSSION
To examine the E-Glass fabric woven mat to identify the optimum parameters for Mechanical properties,prediction of the Taguchi technique and Grey relation analysis was used. Grey relation analysis and ANOVAprovide the optimum parameter settings and the most influential factor in mechanical properties. In order todetermine the average Grey relation grade for each factor level, the response table of the Taguchi method wasemployed. First, the Grey relation grades were grouped by the factor level for each column in the orthogonalarray and then averaged. For example, to find the Grey relation grade of the fiber mat, the response value oflevel 1 in the first column of the OA should be averaged (i.e., experiments 1–3), then the response value of
382 Transactions of the Canadian Society for Mechanical Engineering, Vol. 41, No. 3, 2017

Table 7. Response table for the Grey relational grade.Levels Mat (A) Resin (B) Orientation (C)L1 0.515 0.505 0.633L2 0.718 0.757 0.537L3 0.644 0.615 0.707
Fig. 5. Response graph of overall grey relational grade.
level 2 in the first column of the OA should be averaged (i.e., experiments 4–6), and the response value oflevel 3 in the first column of the OA should be averaged (i.e., experiments 6–9). Similarly, it is calculatedfor the particular levels for the resin, and orientation. This is shown in Table 7.
From the Grey relation analysis it is clear that the optimal parameter combination for mechanical param-eter of the E-glass fabric woven mat is the highest average response combination in Table 7. Therefore,levels A2, B2, and C3 have the highest Grey relational grade value for the factors fiber mat, resin and ori-entation correspondingly. Based on the above study, the optimal values of the E-glass fabric woven fiberwere a 400 mat, polyester resin, and 45◦ orientations. It is noted that the improvement was high for theother types of mat, resin and orientation. The response data of the Grey relation grade at various levels ofthe E-glassparameters are plotted in Fig. 5. The figure shows the optimal process parameter level yielded bythe highest Grey relation grade.
6.1. Analysis of VarianceANOVA was formulated from the average Grey relational grade value in Table 6. The idea of the ANOVA isto investigate which E-glass fiber parameters significantly affect the performance characteristics, among thefactors fiber mat, resin, and orientation for the multiresponse values of tensile strength, compressive strength,flexural strength and impact strength. This is accomplished by separating the total variability of the Greyrelational grades, which is measured by the sum of the squared deviations from the total mean of the Greyrelational grade, into the contributions by each E-glass fiber parameter and the error. Using ANOVA, theinfluence of the E-glass fiber parameters on the quality targets can be examined. The percentage contributionby each E-glass fiber parameter to the total sum of the squared deviations can be used to evaluate theimportance of the E-glass fiber parameter change on the performance characteristics. The contribution ofeach process parameter is given in the ANOVA table, exposed in Table 8.
From the ANOVA table, it can be seen that the fiber mat has a 31.27% contribution, resin 47.20%, andorientation 21.53%, on the multiple performance characteristics. It was found that among the three factors,resin made the major contribution and had a significant effect on the multiple performance characteristics.This suggests that the resin is more important than the manufacturing of composite laminate.
Transactions of the Canadian Society for Mechanical Engineering, Vol. 41, No. 3, 2017 383

Table 8. Results of the ANOVA for the grey relational grade.Factors Parameter Degree of freedom Sum of squares Variance % Contribution
A Mat 2 0.0211 0.0105 31.27B Resin 2 0.0319 0.016 47.20C Orientation 2 0.0145 0.0073 21.53
Error – 0 0 0 0Total – 6 0.0675 0.0339 100
Fig. 6. SEM Image (a) unevenness fiber; (b) arrangement of fiber; (c) fiber pull out.
6.2. Morphological AnalysisScanning Electron Microscopy examination was carried out to identify the possible improvement the me-chanical properties of E-Glass fiber, fractured composite samples were investigated using SEM,the sampleswere coated with a thin layer of gold to reduce charging during analysis. From the microscopy of the frac-tured surface of the E-glass fiber specimen (Fig 6a), it is observed that the surface is flexible in nature. Thereis smoothness in the fractured surface with very little unevenness.
Figure 6b shows the arrangement of glass fibers in the woven fiber mat. The fibers are fractured due to thesudden impact and no trace of fatigue failure is observed. Moreover, due to the woven nature of the glass
384 Transactions of the Canadian Society for Mechanical Engineering, Vol. 41, No. 3, 2017
fiber, it is clear that there is an unchanging distribution in the matrix and interfacial adhesion is also presentto a decent level.
Figure 6c shows that the glass fiber surface is smooth. Bundles of glass fiber pullout and deboning can beobserved. This is due to the lacking of interfacial adhesion between the glass fiber and epoxy matrix.
7. CONCLUSION
In the current study, the detailed approach of Taguchi optimization technique coupled with Grey relationalanalysis has been adopted and applied for evaluating optimal parametric combination.
The recommended parameter levels are E-glass 400 Fabric mat, polyester resin, 45◦/–45◦ orientationwhich is taken from the response table and graph. It gives the maximum the tensile strength, flexuralstrength, compressive and impact strength. The most significant factor for the performance improvement isidentified by the ANOVA as the Polyester resin content as 47.20%. It is concluded that the composite makesthe main contribution and has a significant effect on the multiple performance characteristics.
The microstructural analysis exposed that the uniform precipitation of resin bonding and fiber orientationof the E-glass fiber enhanced the hardness and dimensional stability of E-glass woven fabric mat fiber.
REFERENCES
1. Vignesh, K., Natarajan, U., Srinivasan, C. and Ramasivam, G., “Optimization on mechanical behavior of filleradded fiber reinforced polyester composites using Grey–Taguchi method”, Journal of Applied sciences Research,Vol. 11, No. 14, pp. 127–132, 2015.
2. Mat Kandara, M.I. and Akil, H.M., “Application of design of experiment (DoE) for parameter optimization incompression molding for flax reinforced bio composites”, Procedia Chemistry, Vol. 19, pp. 433–440, 2016.
3. Mahesh, M. and Senthilkumar, A., “Comparison of mechanical properties for aluminum metal laminates(GLARE) of three different orientations such as CSM, woven roving and 450 stitched mat”, IOSR Journalof Mechanical and civil Engineering, pp. 09–13.
4. Sakin, R., Irfan, A.Y. and Ramazan Yaman, “An investigation of bending fatigue behavior for glass-fiber rein-forced polyester composite materials”, Materials and Design, Vol. 29, pp. 212–217, 2008.
5. Gunasegaran, V., Prashanth, R. and Nararyanan, M., “Experimental investigation and finite element analysis offilament wound GRP pipes for underground applications”, Procedia Engineering, Vol. 64, pp. 1293–1301, 2013.
6. Kumar Tanwer, A., “Mechanical properties testing of uni-directional and bi-directional glass fibre reinforcedepoxy based composites”, International Journal of Research in Advent Technology, Vol. 2, No. 11, 2014.
7. Yadav Eagala, R., Gopichand, A., Raghavendra, G. and Ali, S., “Abrasive wear behavior of bamboo-glass fiberreinforced epoxy composites using taguchi approach”, International Journal of Advances in Engineering andTechnology, Vol. 5, No. 1, pp. 339–405, 2012.
8. Bhanu Kiran, K.N.S., Suman, N., Mohan Rao, R. and Maheswara Rao, U., “A study on the influence of hot pressforming process parameters on mechanical properties of green composites using Taguchi experimental design”,International Journal of Engineering, Science and Technology, Vol. 3, No. 4, pp. 253–263, 2011.
9. Arumuga Prabu, V., Uthayakumar, M. and Manikandan, V., “Investigation of the mechanical properties on redmud filled polyester banana composites using Grey relational technique”, Material Physics and Mechanics,Vol. 14, pp. 57–63, 2012.
10. Hansda, S. and Banerjee, S., “Optimizing multi characteristics in drilling of GFRP composite using utility con-cept with Taguchi’s approach”, Procedia Materials Science, Vol. 6, pp. 1476–1488, 2014.
11. Vignesh, K., Ramasivam, G., Natarajan, U. and Srinivasan, C., “Optimization of process parameters to enhancethe mechanical properties of bone powder and coir fiber reinforced polyester composites by Taguchi method”,APRN Journal of Engineering and Applied Sciences, Vol. 11, No. 2, 2016.
12. Kumar Vankanti, V. and Ganta, V., “Optimization of process parameters in drilling of GFRP composite usingTaguchi method”, Journal of Material Research and Technology, Vol. 3, No. 1, pp. 35–41, 2014.
13. Sri Siva, R., Mohan Lal D. and Arockia Jaswin, M., “Optimization of deep cryogenic treatment process for100Cr6 bearing steel using the Grey–Taguchi method”, Tribology Transactions, Vol. 55, pp. 854–862, 2012.
Transactions of the Canadian Society for Mechanical Engineering, Vol. 41, No. 3, 2017 385

14. Ozsoy, N., Ozsoy, M. and Mimaroglu, A., “Influence of parameters on tribological behaviour of E-glass fiberreinforced epoxy composites”, Acta Physica Polonica A, Vol. 128, 2015.
15. Suresh, G. and Jayakumari, L.S., “Evaluating the mechanical properties of E-Glass fiber/carbon fiber reinforcedinterpenetrating polymer networks”, Polímeros, Vol. 25, No. 1, pp. 49–57, 2015.
16. El-Kady, E.Y., El-Mahallawi, I.S., Mahmoud, T.S., Attial, A., Mohammed, S.S. and Monir, A., “Optimizationof the cooling slope casting parameters for producing AA7075 wrought aluminum alloy thixotropic feedstock”,MSAIJ, Vol. 14, No. 8, pp. 279–287, 2016.
386 Transactions of the Canadian Society for Mechanical Engineering, Vol. 41, No. 3, 2017