optimization of natural ventilation design in hot and humid climates using building energy...
DESCRIPTION
This research aims to propose and explore natural ventilation schemes for the design of high-performance, non-residential buildings in hot and humid climates. Three such schemes were applied toward retrofitting the existing Hawai‘i Institute of Geophysics buildings on University of Hawai‘i at Mānoa (UHM) campus in Honolulu. The results were investigated by using parametric study and Airflow Network (AN) model, coupled with thermal model in EnergyPlus. Meanwhile, the number of discomfort hours, during the time the buildings are occupied and based on the adaptive thermal comfort, was used as a quantitative index for the performance of the natural ventilation design schemes.The results revealed that pure cross-ventilation is not a feasible mode to deliver adequate thermal comfort to the occupants, per an acceptable number of discomfort hours. However, with the supplementation of vertical ventilation ducts (shafts), the performance of natural ventilation design schemes significantly improved. In these cases, it was found that either ventilation ducts or ventilation windows can be completely closed, thus eliminating the need of one or the other in natural ventilation designs and therefore mitigating the potential for outdoor noise traveling into spaces through ventilation ducts and/or ventilation windows’ openings.This research presents my preliminary investigation toward finding the optimal scheme for natural ventilation design. After the scheme is chosen, the actual geometry of the ventilation ducts and ventilation windows, appropriate louvers and duct fittings, as well as their optimal aspect ratios, should be taken into consideration. For future research to be able to extend to incorporate a wider range of climate conditions, a hybrid ventilation approach integrating both mechanical and natural ventilation should be carried out. Moreover, further study of ventilation effectiveness, as per Computational Fluid Dynamics (CFD), is also recommended.TRANSCRIPT

Optimization of Natural Ventilation Design in Hot and Humid Climates
Using Building Energy Simulation
Tuan Tran May 2013 Submitted towards the fulfillment of the requirements for the Doctor of Architecture Degree School of Architecture University of Hawai‘i
Doctorate Project Committee Stephen Meder, Chairperson Manfred Zapka Eileen Peppard

Optimization of Natural Ventilation Design in Hot and Humid Climates
Using Building Energy Simulation
Tuan Tran May 2013
We certify that we have read this Doctorate Project and that, in our opinion, it is satisfactory in scope and quality in fulfillment as a Doctorate Project for the degree of Doctor of Architecture in the School of Architecture, University of Hawai‘i at Mānoa.
Doctorate Project Committee

i
ACKNOWLEDGEMENTS
I would like to express my deep appreciation to my advisory committee. My sincerest gratitude goes to Dr. Stephen Meder, who guided me with his dedicated attention, expertise, and knowledge beginning when I took his Sustainable Architecture course at the University of Hawai‘i at Mānoa, continuing through the completion of my degree. My interest in this topic developed thanks to the opportunity I had worked with him at the Environmental Research and Design Laboratory, where he serves as director.
I thank my committee members, Dr. Manfred Zapka and Ms. Eileen Peppard. Dr. Zapka motivated me with many thought-provoking suggestions from his expertise in sustainable architecture and engineering knowledge. His guidance, which helped me immensely during the process of producing this dissertation, will go along with me in my future professional roles. Ms. Eileen Peppard, meanwhile, helped and supported me by sharing not only her expertise in building energy auditing, but also in the data collection and measurement for this study.
My special appreciation also goes to Ms. Susan Ubbelohde (Professor in the Department of Architecture at University of California Berkeley) and Mr. George Loisos, the co-founders and principals at Loisos + Ubbelohde, a sustainable architecture and consulting firm. It was there that I was first trained for the wind tunnel tests at the University of California at Berkeley. I later worked with them for my internship and, under their mentorship, I obtained insightful and comprehensive instruction in the use of energy building simulations.
I feel greatly indebted to the Vietnamese Ministry of Education and Training, as well as to the East-West Center, for providing financial support for my studies in the United States.
Finally, I’d be remiss if I did not acknowledge the innumerable sacrifices made by my wife, Quynh, in having shouldered far more than her fair share of the parenting and household burdens while I pursued this degree.

ii
ABSTRACT This research aims to propose and explore natural ventilation schemes for the design of high-performance, non-residential buildings in hot and humid climates. Three such schemes were applied toward retrofitting the existing Hawai‘i Institute of Geophysics buildings on University of Hawai‘i at Mānoa (UHM) campus in Honolulu. The results were investigated by using parametric study and Airflow Network (AN) model, coupled with thermal model in EnergyPlus. Meanwhile, the number of discomfort hours, during the time the buildings are occupied and based on the adaptive thermal comfort, was used as a quantitative index for the performance of the natural ventilation design schemes.
The results revealed that pure cross-ventilation is not a feasible mode to deliver adequate thermal comfort to the occupants, per an acceptable number of discomfort hours. However, with the supplementation of vertical ventilation ducts (shafts), the performance of natural ventilation design schemes significantly improved. In these cases, it was found that either ventilation ducts or ventilation windows can be completely closed, thus eliminating the need of one or the other in natural ventilation designs and therefore mitigating the potential for outdoor noise traveling into spaces through ventilation ducts and/or ventilation windows’ openings.
This research presents my preliminary investigation toward finding the optimal scheme for natural ventilation design. After the scheme is chosen, the actual geometry of the ventilation ducts and ventilation windows, appropriate louvers and duct fittings, as well as their optimal aspect ratios, should be taken into consideration. For future research to be able to extend to incorporate a wider range of climate conditions, a hybrid ventilation approach integrating both mechanical and natural ventilation should be carried out. Moreover, further study of ventilation effectiveness, as per Computational Fluid Dynamics (CFD), is also recommended.
Keywords: Natural ventilation, building energy simulation, Airflow Network model, computational fluid dynamics, thermal comfort, adaptive thermal comfort.

iii
TABLE OF CONTENTS ACKNOWLEDGEMENTS .............................................................................................................. i ABSTRACT .............................................................................................................................. ii TABLE OF CONTENTS ............................................................................................................. iii TABLE OF TABLES .................................................................................................................. xii CHAPTER 1 .............................................................................................................................. 1 INTRODUCTION ........................................................................................................................ 1
1.1 Background ...................................................................................................................... 1 1.2 Problem statement ............................................................................................................. 2
1.3 Objectives ........................................................................................................................ 2
1.4 Significance and limitations of the study ................................................................................. 3
1.6 Organization of the thesis .................................................................................................. 4
CHAPTER 2 ............................................................................................................................. 6
FUNDAMENTALS OF NATURAL VENTILATION ............................................................................... 6
2.1 Definition of natural ventilation.............................................................................................. 6
2.2 Natural ventilation systems ................................................................................................. 8
2.2.1 Driving forces ........................................................................................................... 10
2.2.2 Principles of natural ventilation ..................................................................................... 13
2.3 Architectural design for natural ventilation in hot and humid climates .......................................... 15
2.3.1 Site selection ............................................................................................................ 15
2.3.2 Site planning and landscaping ...................................................................................... 16
2.3.3 Building forms ........................................................................................................... 17
2.3.4 Building envelopes and structures ................................................................................. 19
2.3.5 Openings ................................................................................................................ 24
2.3.6 Internal layouts ........................................................................................................ 28
2.3.7 Supplemental ventilation designs .................................................................................. 30
2.3.7 Auxiliary systems ...................................................................................................... 33
2.4 Advantages of and barriers to natural ventilation application .................................................... 35
2.4.1 Advantages ............................................................................................................. 35
2.4.2 Barriers .................................................................................................................. 36
CHAPTER 3 ........................................................................................................................... 37
PREDICTION METHODS .......................................................................................................... 37
3.1 Prediction methods for the study of airflow in natural ventilation ................................................ 37
3.1.1 Empirical models ....................................................................................................... 38
3.1.2 Airflow Network models .............................................................................................. 39

iv
3.1.3 CFD models ............................................................................................................ 41 3.2 Building energy simulation with EnergyPlus .......................................................................... 41
3.2.1 EnergyPlus .............................................................................................................. 42
3.2.2 EnergyPlus’ built-in Airflow Network model for natural ventilation ....................................... 44
3.5 Moisture development and mold growth prediction ................................................................. 45
CHAPTER 4 ........................................................................................................................... 48
THERMAL COMFORT, INDOOR AIR QUALITY ............................................................................. 48
AND HIGH PERFORMANCE BUILDINGS ..................................................................................... 48
4.1 Human comfort model ...................................................................................................... 48
4.2 Adaptive thermal comfort model for naturally ventilated buildings ............................................... 51 4.3 Indoor air quality and ventilation rates ................................................................................. 54
4.4 Humidity and mold development ........................................................................................ 56
4.5 Dehumidification ............................................................................................................. 58
4.6 Outdoor noise reduction in naturally ventilated buildings .......................................................... 61 4.7 High performance buildings ............................................................................................... 65
4.7.1 ASHRAE 90.1-2010 vs. ASHRAE 189.1-2011 ................................................................. 65
4.7.2 ASHRAE 62.1-2010 .................................................................................................. 67
CHAPTER 5 ........................................................................................................................... 70
CASE STUDY OF THE NATURAL VENTILATION DESIGN OF KUYKENDALL HALL, ON THE UNIVERSITY OF HAWAI‘I AT MĀNOA CAMPUS IN HONOLULU ......................................................................... 70
5.1 Overview ....................................................................................................................... 70
5.2 Site and context ............................................................................................................. 70
5.3 Climatic condition ............................................................................................................. 71 5.4 Building description ......................................................................................................... 73
5.5 Design strategies ............................................................................................................ 74
CHAPTER 6 ........................................................................................................................... 80
OPTIMIZATION OF NATURAL VENTILATION DESIGNS .................................................................. 80
FOR RETROFITTING EXISTING BUILDINGS ................................................................................ 80
ON THE UNIVERSITY OF HAWAI‘I AT MĀNOA CAMPUS IN HONOLULU .......................................... 80
6.1 Optimization of natural ventilation design for the Hawai‘i Institute of Geophysics (HIG) building on the UH Mānoa campus in Honolulu ............................................................................................... 80
6.1.1 Introduction .............................................................................................................. 80
6.1.2 Objectives ................................................................................................................ 81 6.1.3 Location and weather data ........................................................................................... 81
6.2 Building case description .................................................................................................. 85

v
6.3 Methods ....................................................................................................................... 87
6.3.1 Pre-simulation .......................................................................................................... 88
6.4 Natural ventilation design optimization ................................................................................ 102
6.4.1 Natural Ventilation Design Scheme 1 ............................................................................104
6.4.2 Natural Ventilation Design Scheme 2 .......................................................................... 105
6.4.3 Natural Ventilation Design Scheme 3 .......................................................................... 106
6.5 Results ........................................................................................................................ 107
6.5.1 Natural Ventilation Design Scheme 1 ............................................................................ 107
6.5.2 Natural Ventilation Design Scheme 2 ............................................................................ 115
6.5.3 Natural Ventilation Design Scheme 3 ........................................................................... 122
6.6 Discussions .................................................................................................................. 129
6.7 Limitations .................................................................................................................... 130
6.8 Conclusion .................................................................................................................... 131 CHAPTER 7 .......................................................................................................................... 133
EVALUATION OF THE NATURAL VENTILATION POTENTIALS ....................................................... 133
IN THE RETROFITTING OF EXISTING BUILDINGS ...................................................................... 133
ON THE UNIVERSITY OF HAWAI‘I AT MĀNOA CAMPUS IN HONOLULU ......................................... 133
7.1 Introduction ................................................................................................................... 133
7.2 Criteria ........................................................................................................................ 133
7.3 Results ........................................................................................................................ 135
CHAPTER 8 ......................................................................................................................... 144
SUMMARY AND FURTURE RECOMMENDATIONS ...................................................................... 144
8.1 Summary of study objectives ........................................................................................... 144
8.2 Summary of methodology ............................................................................................... 144
8.3 Summary of results ........................................................................................................ 145
8.4 Recommendations for future research ................................................................................ 145
8.5 Conclusion ................................................................................................................... 147
APPENDIX A ......................................................................................................................... 149
Humidity Control ..................................................................................................................... 149
APPENDIX B ......................................................................................................................... 152
Thermal Comfort Enhancement by Using Ceiling Fans .................................................................... 152
APPENDIX C ......................................................................................................................... 157
HIG Building Pressure Coefficients ............................................................................................. 157
APPENDIX D ......................................................................................................................... 158
Default Dimensions for Ventilation Ducts and Ventilation Windows ..................................................... 158

vi
APPENDIX F ......................................................................................................................... 159
Natural Ventilation Design Scheme 1 ........................................................................................... 159
APPENDIX G ......................................................................................................................... 160
Natural Ventilation Design Scheme 2 .......................................................................................... 160
APPENDIX F .......................................................................................................................... 161 Natural Ventilation Design Scheme 3 ........................................................................................... 161 APPENDIX H ......................................................................................................................... 162
Natural Ventilation Strategies ..................................................................................................... 162
BIBLIOGRAPHY ..................................................................................................................... 166

vii
TABLE OF FIGURES Figure 1: Cooling ventilation ......................................................................................................... 6
Figure 2: Nocturnal convective cooling ........................................................................................... 7
Figure 3: Radiative cooling .......................................................................................................... 7
Figure 4: Evaporative cooling ....................................................................................................... 8
Figure 5: Earth cooling ............................................................................................................... 8
Figure 6: Natural ventilation system diagram ................................................................................... 9
Figure 7: Wind-driven force ........................................................................................................ 11 Figure 8: Buoyancy-driven force – alone and in combination with wind-driven force ............................... 13
Figure 9: Cross and stack ventilation ........................................................................................... 14
Figure 10: Single-sided ventilation ............................................................................................... 14
Figure 11: Site selection recommended for hot and humid climates. ..................................................... 15
Figure 12: Street layout and adjacent buildings and/or trees .............................................................. 16
Figure 13: Recommended landscaping for naturally ventilated building in hot and humid climates. .............. 16
Figure 14: Low and dense trees used to block breezes and trap humidity. ............................................ 17
Figure 15: Grass lawn significantly lowers air temperature.................................................................. 17
Figure 16: Proper building forms and orientations used in the design of naturally ventilated buildings .......... 18
Figure 17: Building form design strategies for solar mitigation ............................................................. 18
Figure 18 Coventry University features a deep layout, incorporating wind towers. ................................... 19
Figure 19: An example of building shading from the roof .................................................................. 20
Figure 20: Examples of different window shading devices. ................................................................ 21 Figure 21: Solar shading masks for horizontal overhangs, vertical fins and combined egg-crates ............... 21 Figure 22: The use of shading devices in design strategies .............................................................. 22
Figure 23: Mashrabiya-style screens, utilized as façade-shading devices. ........................................... 23
Figure 24: Horizontal overhangs and vertical fins ........................................................................... 23
Figure 25: Selection of the openings based on pressure difference study ............................................ 24
Figure 26: The effectiveness of a window, according to its aspect ratio and orientation to wind incidence. . 25
Figure 27: Window types that contribute to overall interior air movement. ............................................ 27
Figure 28: Window control system ............................................................................................... 28
Figure 29: Airflow patterns that result from different types of subdivisions within internal space. ............... 29
Figure 30: Typical building layouts .............................................................................................. 29
Figure 31: Generic forms of atrium buildings .................................................................................. 30
Figure 32: Double-skin façade .................................................................................................... 31 Figure 33: Different wind towers: ................................................................................................ 32
Figure 34: Examples of chimney usage in design ........................................................................... 33

viii
Figure 35: 10 ft diameter slow-speed ceiling fans ........................................................................... 33
Figure 36: Examples of components for the automatic control system of natural ventilation. .................... 34
Figure 37: Example of an Airflow Network diagram ........................................................................ 39
Figure 38: The main structure of EnergyPlus ................................................................................. 42
Figure 39: The internal structure of EnergyPlus .............................................................................. 43
Figure 40: The relationship between AirflowNetwork and EnergyPlus objects: ...................................... 45
Figure 41: MOIST - Moisture prediction application output graphic interface. ........................................ 46
Figure 42: BMOIST - Moisture prediction application output graphic interface....................................... 46
Figure 43: WUFI - Moisture prediction application output graphic interface .......................................... 47
Figure 44: Thermal equilibrium illustration ..................................................................................... 48
Figure 45: Conversion between PDD and PMV.72F ........................................................................... 50
Figure 46: Acceptable range for operative temperature and humidity, by ASHRAE 55-201074F .................. 50
Figure 47: De Dear’s adaptive thermal comfort model (2002) ........................................................... 53
Figure 48: The ASHRAE 55-2010 adaptive thermal comfort. ............................................................ 54
Figure 49: Indoor air quality and ventilation rates ........................................................................... 54
Figure 50: Isopleths of mold germination and growth rates. .............................................................. 57
Figure 51: Effect of ventilation systems on indoor spore levels ........................................................... 58
Figure 52: Hourly relative outdoor humidity for the typical year in Honolulu, Hawai‘i ............................... 59
Figure 53: Types of dehumidifiers: Mechanical dehumidifier and Active desiccant dehumidifier 97F .............. 59
Figure 54: Acoustical Vent Bar. .................................................................................................. 62
Figure 55: Typical acoustic louvers and specifications. ..................................................................... 62
Figure 56: Acoustic screens incorporated into operable windows. ....................................................... 63
Figure 57: Attenuation boxes. ..................................................................................................... 64
Figure 58: Existing and proposed design for Kuykendall Hall. ........................................................... 70
Figure 59: Historical temperature in Honolulu. ................................................................................. 71 Figure 60: Maximum and Minimum Temperature of a typical year in Honolulu, Hawai‘i .......................... 72
Figure 61: Maximum and Minimum Relative Humidity of a typical year in Honolulu, Hawai‘i ..................... 72
Figure 62: Temperature comparison between site and PHNL ............................................................ 73
Figure 63: Relative humidity (RH) level comparison between site and PHNL ........................................ 73
Figure 64: Cross ventilation design strategy for the classroom structure. ............................................. 75
Figure 65: Cross-ventilation design strategy for the office tower ........................................................ 76
Figure 66: 2-3 feet deep overhangs act as solar shading devices. .....................................................77
Figure 67: Typical layouts of the classroom structure and office tower. ............................................... 78
Figure 68: Diagram of the dehumidification duct system. .................................................................. 78
Figure 69: Outdoor noise mitigation integrated into natural ventilation design ........................................ 79

ix
Figure 70: Climate Zone Map. ..................................................................................................... 81 Figure 71: Environmental drybulb temperatures and relative humidity levels, ......................................... 82
Figure 72: Environmental relative humidity levels obtained from TMY3 weather data at PHNL .................. 82
Figure 73: Temperature difference between KUY and PHNL ............................................................. 83
Figure 74: Wind speeds and directions obtained from TMY3 weather data at PHNL .............................. 83
Figure 75: Wind speeds and directions measured at KUY. ............................................................... 84
Figure 76: The mean wind speeds at 50 meters height, for PHNL and KUY, ....................................... 84
Figure 77: 3D views of the HIG and adjacent buildings .................................................................... 85
Figure 78: Laboratory Building of the HIG ..................................................................................... 86
Figure 79: Simulation process diagram ......................................................................................... 87
Figure 80: Structured grid construction of the HIG and adjacent buildings in Flow Designer .................... 89
Figure 81: CFD simulation of airflow around the HIG and adjacent buildings ......................................... 90
Figure 82: Static pressure differentiates, at building surfaces of the HIG and adjacent buildings. ............... 91 Figure 83: Sub-divisional Lab building façades for average-pressure coefficients calculation .................... 91 Figure 84: The predicted pressure coefficients of the Lab building’s North facing surfaces ...................... 92
Figure 85: The predicted pressure coefficients of the Lab building’s South facing surfaces ...................... 92
Figure 86: The predicted pressure coefficients of the Lab building’s West facing surfaces ....................... 93
Figure 87: The predicted pressure coefficients of the Lab building’s East facing surfaces ........................ 93
Figure 88: Program layout of the HIG’s 2nd floor ............................................................................. 94
Figure 89: 3D geometry of the energy model, modeled with OpenStudio Sketchup for EnergyPlus ........... 95
Figure 90: The relationship between the baseline, 90.1, 189.1 and the proposed design models ............. 101 Figure 91: Predicted monthly energy consumption comparison between the baseline vs. the 90.1 and 189.1 models ................................................................................................................................. 101 Figure 92: Predicted monthly break-down energy consumption comparison between the baseline vs. the 90.1 and 189.1 models .................................................................................................................... 102
Figure 93: The focus area for the AN model ................................................................................ 103
Figure 94: Natural Ventilation Design Scheme 1 ............................................................................104
Figure 95: Natural Ventilation Design Scheme 2 ........................................................................... 105
Figure 96: Natural Ventilation Scheme 3 ..................................................................................... 106
Figure 97: AN diagram of Natural Ventilation Design Scheme 1 ........................................................ 109
Figure 98: Three-dimensional geometry (Sketchup model) of the energy model for the Natural Ventilation Scheme 1 .............................................................................................................................. 110
Figure 99: Discomfort hours (during annual occupied office hours) ..................................................... 111 Figure 100: Close-up chart of discomfort hours (during annual occupied office hours) ............................ 112
Figure 101: Discomfort hours (during annual occupied lab hours) ....................................................... 113

x
Figure 102: Discomfort hours (during annual occupied lab hours) ...................................................... 114
Figure 103: AN diagram of Natural Ventilation Design Scheme 2 ....................................................... 116
Figure 104: Three-dimensional geometry (Sketchup model) of the energy model for the Natural Ventilation Scheme 2 .............................................................................................................................. 117
Figure 105: Discomfort hours (during annual occupied office hours) .................................................... 118
Figure 106: Close-up chart of discomfort hours (during annual occupied office hours) ............................ 119
Figure 107: Discomfort hours (during annual occupied lab hours) ...................................................... 120
Figure 108: Discomfort hours (during annual occupied lab hours) ....................................................... 121 Figure 109: AN diagram of Natural Ventilation Design Scheme 3 ...................................................... 123
Figure 110: Three-dimensional geometry (Sketchup model) of energy model for Natural Ventilation Design Scheme 3 ............................................................................................................................. 124
Figure 111: Discomfort hours (during annual occupied office hours) .................................................... 125
Figure 112: Close-up chart of discomfort hours (during annual occupied office hours) ............................ 126
Figure 113: Discomfort hours (during annual occupied lab hours) ....................................................... 127
Figure 114: Discomfort hours (during annual occupied lab hours) ...................................................... 128
Figure 115: UHM campus map ................................................................................................... 135
Figure 116: Keller Hall .............................................................................................................. 136
Figure 117: Natural ventilation design strategy for Keller Hall ............................................................ 137
Figure 118: Physical Science Building .......................................................................................... 138
Figure 119: Natural ventilation design strategy for Physical Science Building ........................................ 139
Figure 120: Moore Hall ............................................................................................................140
Figure 121: Natural ventilation design strategy for Moore Hall ........................................................... 141 Figure 122: Hawai‘i Hall. .......................................................................................................... 142
Figure 123: Natural ventilation design strategy for Gilmore Hall ......................................................... 143
Figure 124: Hourly predicted mold growth occurrence inside exterior walls .......................................... 150
Figure 125: Hourly predicted mold growth occurrence inside exterior walls .......................................... 150
Figure 126: Elevated air speed resulting in an increase in temperature range of thermal comfort. ............ 152
Figure 127: Hourly thermal discomfort during annual lab hours of Lab #105 ........................................ 153
Figure 128: Thermal comfort enhancement by ceiling fans (Lab #105) ................................................ 154
Figure 129: Hourly thermal discomfort during annual office hours of Office #205 .................................. 155
Figure 130: Thermal comfort enhancement by ceiling fans (Office #205) ............................................ 156
Figure 131: Natural Ventilation Design Strategy 1 ............................................................................ 162
Figure 132: Natural Ventilation Design Strategy 2 .......................................................................... 163
Figure 133: Natural Ventilation Design Strategy 3 .......................................................................... 163
Figure 134: Natural Ventilation Design Strategy 4 .......................................................................... 164

xi
Figure 135: Natural Ventilation Design Strategy 5 .......................................................................... 164
Figure 136: Mixed Natural Ventilation Design Strategy .................................................................... 165

xii
TABLE OF TABLES Table 1: Terrain-dependent coefficients15F ........................................................................................ 11 Table 2: The effectiveness and performance level of different window types ......................................... 26
Table 3: Feature of airflow prediction models54F 55F ............................................................................ 37
Table 4: ASHRAE scale of thermal sensation ................................................................................ 49
Table 5: Air change rates of typical buildings and rooms84F ................................................................ 55
‘Table 6: Optimum relative humidity range for minimizing adverse health effects. .................................. 56
Table 7: Comparison between ASHRAE 90.1-2010 and 189.1-2011 on thermal resistance ....................... 66
Table 8: Comparison between ASHRAE 90.1-2010 and 189.1-2010 on Lighting Power Density and ......... 66
Table 9: Illuminance levels for daylighting requirements ................................................................... 67
Table 10: Minimum ventilation rates in the breathing zone for some activities from ASHRAE 62.1-2010111F ... 67
Table 11: Minimum air change rates for typical buildings, .................................................................. 68
Table 12: Required design for natural ventilation from ASHRAE 62.1-2010112F ........................................ 69
Table 13: Kuykendall Hall retrofit project summary .......................................................................... 70
Table 14: Construction of the existing building ............................................................................... 95
Table 15: Class/office occupancy, lighting and equipment schedules .................................................. 96
Table 16: Occupant density, lighting power density, equipment power density, cooling setpoints ............... 98
Table 17: Monthly energy consumption comparison, ........................................................................ 99
Table 18: Building requirements, per space activity, .......................................................................100
Table 19: Typical exterior wall for hot and humid climates ............................................................... 149
Table 20: Number of hours over the threshold for mold growth in a typical exterior wall for the Honolulu climate. ................................................................................................................................ 149

1
CHAPTER 1
INTRODUCTION
1.1 Background
Buildings consume a lot of energy, which comes mostly from the burning of non-renewable resources, while producing carbon dioxide and other pollutant emissions into the environment. Those in Europe count for 30% of total energy consumption.3F
1 In the United States, this percentage can be as high as 40.4%.4F
2 Warnings about the depletion of non-renewable resources, as well as the effects of global warming due to greenhouse gas emissions, have inspired the move toward developing more energy efficient, high performance buildings.
Buildings are commonly planned, designed, built and operated in such ways that tend to rely on power-driven systems to deliver indoor comfort for their occupants, regardless of any exterior climatic conditions. These systems consume a lot of energy, as well as incur a notable cost for their operation and maintenance. Significantly, a large proportion of energy consumption goes toward mechanical systems of a building. Statistical data from the US Department of Energy in 2010 showed that a typical building used up to 52.7% (residential) and 38.4% (commercial) of its total energy consumption for heating and cooling.5F
3
Natural ventilation, as an environmentally friendly strategy to reduce energy consumption, is not a new concept. It has been used in many historical buildings, for example enabling them to solely rely on both wind-induced and temperature-induced pressure difference as natural driving forces to provide fresh air through operable windows or infiltration.6F
4 Contemporarily, in order to maintain human comfort and to achieve high indoor air quality, naturally ventilated modern buildings may not only rely on natural driving forces, but also use a low-energy consuming mechanical system (e.g. fan assisted ventilation, wind tower, atrium, double-skin façade, etc) in case of insufficient air movement; control systems (manual and/or self-regulating operable windows, vents and ventilation ducts) to modulate the indoor airflow; and acoustical louvers, for indoor and outdoor noise mitigation.
There are many ways to study natural ventilation, from empirical methods to state-of-the-art technologies, such as full-scale measurement, scaled-model testing in wind tunnels, building energy simulation and computational fluid dynamics (CFD). These methods and tools allow designers and researchers to confidently predict and then incorporate natural ventilation principles creatively into the designs of modern buildings.
1 Ibid. 2 U.S. Department of Energy, “2010 Buildings Energy Data Book.” Table 1.1 3 Ibid.Table 2.1 and Table 3.1 4 Walker, “Natural Ventilation.”

2
1.2 Problem statement
Empirical methods may give quick answers, but they can be limited in their applicability. The wind tunnel is a very important qualitative and quantitative tool for studying natural ventilation, and is used to inform essential wind-driven data (e.g. pressure coefficients) for computational models. Its disadvantages, however, include high cost of operation, maintenance, and making physical models, The work is time-consuming as well, and the required a certain level of knowledge involved in this type of experiment.7F
5 CFD is also a powerful tool used to study airflow movement and characteristics in naturally ventilated buildings, but as a time–intensive and sophisticated modeling technique, it is not practical for use in studying the performance of entire buildings over, say, the course of a year.8F
6
Natural ventilation mainly relies on natural driving forces inherently varying from time to time. Predicting the performance of naturally ventilated buildings, then, must take into consideration how buildings perform across time-varying climatic conditions. However, such studies are often limited to best scenarios from assumed static climatic conditions. As a result, current design guidelines for natural ventilation are not able to conform to a whole range of dynamic climatic condition, and thus might not be able to provide reliable solutions in actual cases, limiting their applicability in practice.
Building energy simulation (BES), meanwhile, is a state-of-the-art tool for studying sub-hourly building performance. Moreover, the integration of multi-zone thermal transfer of BES and multi-zone Airflow Network models (AN) can provide the energy performance, thermal comfort, indoor airflows and internal pressure needed for the study of natural ventilation performance. An example of this integration would be the incorporation of the AN module into the well-known EnergyPlus building energy simulation application by the U.S. Department of Energy (US DoE).
1.3 Objectives
The main objective of this research is to utilize the functionalities of building energy simulation for designing high-performance, naturally ventilated non-residential buildings in hot and humid climates. More precisely, parametric studies and building energy simulation will be used to explore optimal natural ventilation design schemes with optimal sizing of ventilation openings to insure minimal airflow resistance and outdoor noise intrusion. Also, adaptive thermal comfort, fan assisted ventilation and dehumidification to avoid mold development in buildings will be considered.
5 Costola, Blocken, and Hensen J. L. M., “Overview of Pressure Coefficient Data in Building Energy Simulation and Airflow Network Programs.” 6 Emmerich, Dols, and Axley, “Plan for Design and Analysis Tools Natural Ventilation Review and Plan for Design and Analysis Tools.” p.18

3
These considerations will enable both designers and architects to confidently apply natural ventilation into retrofitted or new, non-residential buildings in hot and humid climates, reducing their energy consumption and associated environmental impacts. To achieve these goals, the following tasks are defined:
- To review the fundamentals of natural ventilation techniques in architectural design; to focus on overcoming barriers associated with natural ventilation in hot and humid climates, such as dehumidification and outdoor noise control.
- To investigate a case study on the use of natural ventilation to retrofit Kuykendall Hall on the University of Hawai‘i at Mānoa (UHM) campus in Honolulu.
- To propose and optimize the natural ventilation design schemes for designing naturally ventilated, high-performance non-residential buildings in the warm and humid climate of Hawai‘i.
- To evaluate the application of natural ventilation design schemes for retrofitting UHM campus buildings.
1.4 Significance and limitations of the study
Expected contributions
This research is intended to contribute to a new, comprehensive study approach to predict the performance of naturally ventilated, non-residential buildings in hot and humid climates using building energy simulation. The accumulative thermal discomfort hours from the study approach shall serve as a reliable and helpful factor to inform on the possible applicability of purely natural ventilation designs and other appropriate systems, such as hybrid ventilation or mechanical air-conditioning systems. These also are helpful for scheduling low-energy consuming, assisted-fan ventilation system in order to enhance indoor air movement while significantly reducing energy consumption otherwise required by air-conditioning systems.
Besides thermal comfort and energy saving achievement, humidity control is one of the most challenging factors among natural ventilation design approaches. For this reason, the combination of humidity transfer simulation in building materials, and also building energy simulation for the study of time-varying moisture development, allows for setting up an appropriate operating schedule of the dehumidification system to mitigate mold growth in buildings.
Lastly, this study approach also helps designers to tackle the issue of outdoor noise in designing naturally ventilated buildings. By comparing and optimizing different designs in order to achieve adequate thermal comfort levels, while minimizing the size of ventilation windows and ducts, this study approach not only helps to overcome design constraints associated with building facades but also allows for acoustical design in order to mitigate outdoor noise in natural ventilation.

4
Scope and Limitations
To replace air-conditioning systems for cooling, there are several energy-efficient alternative approaches, such as mixed-mode ventilation. This thesis, however, will focus only on the purely-natural ventilation approach at the analysis stage of schematic design. This will help to maximize the possible applications for natural ventilation in a building’s design, before those of mechanical ventilation components in mixed-mode or hybrid ventilation.
Since the number of purely naturally ventilated non-residential buildings in hot and humid climates is limited, this thesis concentrated on the Kuykendall Hall renovation project as its sole case study because of its design approach, which closely relates to the research focus herein.
The study is also limited in its use of AN model coupling with EnergyPlus application from the U.S. Department of Energy as the building energy simulation, MOIST application from Ray W. Herrick Laboratories of Purdue University as moisture transfer simulation, and Microsoft Office Excel application as numerical and graphical post-processing. This includes for both computing and generating useful quantitative and qualitative information, such as accumulative adaptive thermal comfort hours, accumulative moisture growth hours, etc.
1.6 Organization of the thesis
This chapter discusses the background and objectives of the proposed research, the introduction of the methodology for this thesis, the scope and also limitations of the research.
Chapter II reviews the fundamentals of natural ventilation and natural ventilation designs for hot and humid climates.
Chapter III includes discussions about thermal comfort and indoor air quality. High performance building codes from the American Society of Heating and Air-Conditioning Engineers (ASHRAE): ASHARAE 55-2010, ASHRAE 61.2-2007, ASHRAE 90.1-2010 and ASHRAE 189.1-2011 are also discussed in this chapter
Chapter IV discusses building energy simulation, Airflow Network models and moisture models, as well as the software applications used for this study.
Chapter V investigates the specific case in natural ventilation design from the renovation project at Kuykendall Hall on the UHM campus in Honolulu.
Chapter VI optimizes three proposed natural ventilation design schemes for retrofitting the Hawai‘i Institutes of Geophysics (HIG) building as a pilot study. Limitations of the proposed natural ventilation design schemes also are discussed in this chapter.

5
Chapter VII evaluates the natural ventilation potentials of four other buildings on the UHM campus, and applies the proposed natural ventilation design schemes toward retrofitting those buildings.
Chapter VIII then summarizes the main sections of the thesis. It also discusses future work for the study.

6
CHAPTER 2
FUNDAMENTALS OF NATURAL VENTILATION
2.1 Definition of natural ventilation
All enclosed spaces occupied by people gradually become polluted by that which is accumulated from volatile organic compounds (VOCs) from synthetic materials’ furnishings and also is derived from occupant metabolism and other activities. Due to this, ventilation is required for “achieving acceptable indoor air quality based on the supply of fresh air to a space and the dilution of the indoor pollution concentration.”9F
7 There are two relevant approaches: mechanical and natural ventilation. In terms of principle operation, natural ventilation relies on natural forces rather than “mechanically powered equipment such as motor-driven fans and blowers.” 10F
8 Moreover, natural ventilation not only provides fresher air to a space, as a passive cooling strategy it also provides occupant thermal comfort by facilitating thermal convection and perspiration.
In sustainable architectural design, natural ventilation does not simply mean a supply of cooler and fresher air. It is an integrated solution in a broader concept of “passive cooling.” This approach requires three strategies11F
9: (1) Prevention of excessive heat gains through landscaping and site design, building forms, solar shading of openings, façade design, the use of proper insulation as well as other surface properties such as solar reflectance and thermal zoning, according to occupation densities and types of activities, (2) Modulation of heat gains, using high heat-capacity building structures (concrete wall, brick, floors, ceiling) or specialized thermal storage (rock-bed, water store mass) to attenuate peak indoor air temperature, and (3) Rejection of heat gains from the interior of the building to natural heat sinks by using the following techniques:
Cooling ventilation (or direct ventilation): direct cooler air-flow through occupied zones (Fig. 1).
Figure 1: Cooling ventilation
Convection caused by natural forces to increase evaporation from skin for thermal comfort. Source: Lechner, Heating, Cooling, Lighting: Design Methods for Architects.
7 Allard and Santamouris, Natural Ventilation in Buildings: A Design Handbook. 8 Emmerich, Dols, and Axley, “Plan for Design and Analysis Tools Natural Ventilation Review and Plan for Design and Analysis Tools.”, p.3 9 Santamouris and Asimakopoulos, Passive Cooling of Buildings. p.38-52

7
Nocturnal convective cooling (or night ventilation,): use thermal mass to absorb the heat from a building’s envelope to avoid indoor temperature peak (Fig. 2).
Figure 2: Nocturnal convective cooling
Cold night air cools down the high thermal mass structure so that it can absorb heat gains in the daytime to reduce the temperature peak. Source: Lechner, Heating, Cooling, Lighting: Design Methods for Architects.
Radiative cooling: release heat from building surfaces to the cooler environment by radiating their long-wave infrared radiation outward from the source (Fig. 3).
Figure 3: Radiative cooling
Water, working with the movable insulation panel, emits its heat during nighttime and acts as heat sink for the occupied space during daytime. Source: Lechner, Heating, Cooling, Lighting: Design Methods for Architects.
Evaporative cooling: release latent heat through evaporation in order to cool any air which is in contact with wet surfaces. This can be divided into either/both direct and indirect evaporative cooling (Fig. 4).

8
Figure 4: Evaporative cooling
In direct evaporative cooing, water is sprayed into hot and dry air to reduce the air temperature but increasing humidity. While in indirect evaporative cooling, water is evaporated to cool down the high thermal mass ceiling acting as heat sink for the interior without increasing its humidity. Source: Lechner, Heating, Cooling, Lighting: Design Methods for
Architects.
Earth cooling: use the earth itself as a high thermal mass to pre-cool the air and circulate it through the building via tubes positioned underground called earth tubes (Fig. 5).
Figure 5: Earth cooling
Air entering into earth tubes exchanges its heat with the earth to reduce its temperature before circulating through occupied spaces. The slope and sump is for catching condensation. Source: Lechner, Heating, Cooling, Lighting:
Design Methods for Architects.
2.2 Natural ventilation systems
As previously mentioned, natural ventilation is not simply a technique to supply cleaner air into spaces but is also an integrated design approach for ensuring occupant thermal comfort. For example, in the design of building forms, the strategic use of openings and wind walls can direct cool outdoor air to blow through a building so that it exchanges heat with hot indoor air, and thus can lower the indoor air temperature.

9
Placement and orientation of openings and overhangs also helps to avoid the high level of heat gain which might cause overheating. In case of excessive internal gains, meanwhile, raising the air movement by using assisted fans (e.g. ceiling fans) might accelerate the perspiration of occupants to maintain the biological temperature and thus increases the thermal comfort range. Alternatively, using a building structure’s thermal mass to absorb this heat gain can also help to maintain occupant thermal comfort.
Architectural design incorporating natural ventilation comprises a “natural ventilation system,” 12
10 since all architectural elements are manipulated and articulated to adhere to natural ventilation principle. In order to clearly describe the sequence of such a design process, this thesis adopted Kleiven’s (2003) concept of a natural ventilation system. The example, illustrated in Figure 6, consists of three aspects: driving forces, ventilation principles and characteristic elements. 13F
11
Figure 6: Natural ventilation system diagram
10 Kleiven, “Natural Ventilation in Buildings: Architectural Concepts, Consequences and Possibilities.” p.28 11 Ibid.

10
- Driving forces are natural forces derived from wind-induced pressure difference, buoyancy-driven forces, wind turbulence or a combination thereof.
- Ventilation principles utilize driving forces to ventilate spaces. These principles consist of single-side ventilation, cross ventilation, stack ventilation or mixed manners.
- Characteristic elements include the implementation of ventilation principles for achieving thermal comfort and indoor air quality. They represent a variety of architectural design components, such as building forms, building envelopes, openings, solar shading, internal layouts, atria, wind towers, chimneys and solar chimneys, and so on.14F
12
2.2.1 Driving forces
The natural driving forces in natural ventilation consist of wind-driven forces, buoyancy-driven forces and wind turbulence. This section reviewed the theoretical fundamentals of natural driving forces, and was based on the EnergyPlus Engineering Reference Document and Santamouris et la. (1996)
- Wind-driven forces
Wind-driven forces occur when airflow around buildings changes velocities according to the differences in buildings’ envelopes, resulting in pressure difference over those surfaces. These pressure differences drive fresh air into intake openings at the windward side, while indoor air is exhausted through outlets at the leeward side. The effect of wind velocities on the wind-driven pressure is given by:
where Cp is the static pressure coefficient; vz is wind speed measured at a given height; and is air density (Fig. 7). Cp determined by building geometry, wind speed and wind angle incidences, neighboring buildings, surrounding topography and terrain roughness can be obtained from pressure measurements of reduced-scale models in wind tunnels and those of actual buildings, or computer models, using computational fluid dynamics (CFD).
12 Ibid.

11
Figure 7: Wind-driven force
Wind speeds are height-varied and rely on the boundary layers and the roughness of terrain types. They are often obtained from weather data at meteorological stations located in an open area at a height of 32.8 feet (10m). To use these for a given location at a given height, the wind speed can be corrected by the equation:
where Vz is the wind speed at the height of z, Vmet is the wind speed at meteorological station, zmet is 32.8 feet (10m), and , terrain-dependent coefficients and boundary layer thickness for a given terrain type respectively, can be referred from the Table 1:
Table 1: Terrain-dependent coefficients 15F
13 Terrain Description Exponent Boundary layer thickness
1 Flat, open country 0.14 270 2 Rough, wooded country 0.22 370 3 Town and cities 0.33 460 4 Ocean 0.10 210 5 Urban, industrial, forest 0.22 370
For a room with just one small opening, the wind-driven pressure difference over that opening is given by:
where Pi is the internal pressure.
13 Ernest Orlando Lawrence Berkeley National Laboratory, “EnergyPlus Engineering Reference.”

12
- Buoyancy-driven force
Buoyancy-driven force results from the air density difference between the temperature differences inside and outside of the building. Expanded hot air is less dense, and thus will be replaced by cooler air with a higher density. For example, when the outside air temperature is cooler than that inside, this cooler outdoor air flows into the building through the low openings and exhausts at the higher openings. This process is reversible, too, when the outdoor air temperature is higher than that inside. Due to buoyancy-driven force only, the pressure at a height z of the zone is given by:
4)
where Po represents static pressure at the reference level (the bottom of the zone); g is the gravitational acceleration; for ideal gas, is air density and can be assumed:
where T is the temperature; o and To represent the reference air density and temperature. The buoyancy-driven pressure difference over an opening at any height H of the zone is given by:
where Pu,o and Pi,o represent static pressure outdoors and indoors at the reference level (the bottom of the zone); u and I are outdoor and indoor air density. At the neutral plane:
or –
Applying equation (5) into (7), we have:
–
Assuming that the temperature does not change with height, the pressure difference over the lower opening p1, the pressure difference over the higher opening p2 and the pressure difference between two vertical openings p21 are given by:
Where Tu, Ti are outdoor and indoor temperatures, respectively; h1, h2 are the elevations of the higher and lower openings, respectively; ho is the elevation of the neutral plan, where the indoor pressure equals the outdoor pressure (Fig. 8).

13
Figure 8: Buoyancy-driven force – alone and in combination with wind-driven force
- Turbulence
Wind turbulence, which is caused by friction from obstruction on the ground, can induce small pressure differences in building envelopes to force airflow in and out of any openings. Unlike wind-driven force and buoyancy-driven force, wind turbulence has not yet been fully studied or understood.16F
14
- Combining effect
Wind-driven force and buoyancy-driven force might act at the same time. In such case, the total driving force will equal the sum of driving forces induced by wind and buoyancy. The combined pressure difference over the higher and lower openings, illustrated in Fig. 8, can be obtained from the following equation:
where Puo, Pio refers to the outdoor and indoor static pressure reference at the floor elevation; Cp is the pressure coefficient; Vuz and Viz are the outdoor and indoor wind speeds across the opening, at the height z.
2.2.2 Principles of natural ventilation
Ventilation principle, when utilizing driving forces to ventilate spaces, can be classified per the following mechanisms: cross ventilation, stack ventilation and single-sided ventilation. These have been deployed in natural ventilation strategies in separate or mixed manners according to a variety of ventilation needs, as well as architectural requirement.
14 Axley, “Application of Natural Ventilation for U . S . Commercial Buildings Climate Suitability Design Strategies & Methods Modeling Studies Application of Natural Ventilation for U . S . Commercial Buildings Climate Suitability Design Strategies & Methods Modeli.” p.45

14
Figure 9: Cross and stack ventilation
- Cross ventilation: based on wind-driven forces caused by wind-induced pressure difference at ventilation openings, on opposite sides of an enclosed space. Ventilation flow strongly depends on the difference in wind pressure between the inlet and outlet openings (Fig. 9).
- Stack ventilation: based on buoyancy-driven forces caused by pressure difference induced by the temperature gradient between inlet and outlet openings, at different elevation, drawing cool outdoor air in at low inlet openings while exhausting warm indoor air out, at higher outlet openings (Fig. 9).
- Single-sided ventilation: applied when openings are limited to only one side of a space, with ventilation flow in this case driven by “room-scale buoyancy effects,” small wind-induced pressure difference and/or turbulence of outdoor wind (Fig. 10).
- Mixed natural ventilation strategies: These three can be combined in a mixed manner for a single building, to optimize ventilation flows within a particular space and circumstance (Fig. 10).
Figure 10: Single-sided ventilation
induced by local wind turbulence, buoyancy-driven forces and mixed-strategy ventilation

15
2.3 Architectural design for natural ventilation in hot and humid climates
2.3.1 Site selection
Site selection related to the slope, elevation, orientation, vegetation and local wind pattern is very important in natural ventilation design. Sites should be able to capture the local prevailing wind, yet avoid the east or west slopes which may otherwise present excessive solar radiation and make it difficult to block low angle direct sun beams. An elevated location on the windward slope or at the hill top is desirable, while one at the valley bottom should be avoided because of its typically slow air movement, especially at night (Fig. 11). Site selection also should consider locations near large bodies of water to help direct cool breezes into the buildings. While evaporation from water helps to reduce the outdoor air temperature, it might also increase indoor humidity, especially in hot and humid climates. 17F
15
Figure 11: Site selection recommended for hot and humid climates. Elevated location on the windward side, especially on the hilltop.
Source: Lechner, Heating, Cooling, Lighting: Design Methods for Architects.
15 Lechner, Heating, Cooling, Lighting: Design Methods for Architects.

16
2.3.2 Site planning and landscaping
Street layouts with a pattern of staggered buildings can promote natural ventilation. Adjacent buildings and trees can be utilized to channel wind into buildings, as well (Fig. 12). High tree canopies should be located on the east and west sides of the structure, in order to block direct sunlight and permit air movement (Fig. 13). Meanwhile, dense, low canopy trees should be avoided as they can block breezes and trap humidity (Fig. 14). Unshaded pavement should be avoided, whereas grass can actually reduce the outdoor temperature from 20-40 F (Fig.15).
Figure 12: Street layout and adjacent buildings and/or trees can be utilized to direct air around and/or into buildings.
Source: Lechner, Heating, Cooling, Lighting: Design Methods for Architects.
Figure 13: Recommended landscaping for naturally ventilated building in hot and humid climates.
Source: Lechner, Heating, Cooling, Lighting: Design Methods for Architects.

17
Figure 14: Low and dense trees used to block breezes and trap humidity.
Source: Lechner, Heating, Cooling, Lighting: Design Methods for Architects.
Figure 15: Grass lawn significantly lowers air temperature. Unshaded paving radiates its heat into the environment and increases its air temperature and surface temperature by
20F and 40F, respectively. Source: Lechner, Heating, Cooling, Lighting: Design Methods for Architects.
2.3.3 Building forms The particular building form selected determines what ventilation principles can be used. For example, the climatic responsive type minimizes solar heat gains and enhances natural ventilation to improve thermal comfort. For a hot and humid climate, a building form with a narrow plan and maximum exposed surface area is preferable for facilitating the cross ventilation principle 18F
16 (Fig. 16). These buildings often have linear forms, with building footprints relevant to an I, L, T, C, E and/or H shape, or feature a deep plan with a central courtyard. The detrimental factors in a compacted building form with a depth plan, however, can be overcome by designing wind towers or chimneys to utilize the stack ventilation principle19F
17 (Fig. 18).
16 Santamouris and Asimakopoulos, Passive Cooling of Buildings.p.119. 17 Krausse, Cook, and Lomas, “Environmental Performance of a Naturally Ventilated City Centre Library.”
90F Air temperatures 110F 100F Surface temperatures 140F
Grass Asphalt

18
Figure 16: Proper building forms and orientations used in the design of naturally ventilated buildings
Source: Research Support Facility (RSF) with narrow layouts and an H-shaped footprint at the National Renewable Energy Laboratory (NREL). Source: the US. Department of Energy.
In hot and humid climates, it is crucial to minimize solar-exposed surface areas, to avoid related heat gains through the maximization of exposed surface area, thus increasing air movement around the buildings and in their internal spaces. A minimum ratio between the solar exposed surface area and the total exposed surface areas is optimal for building forms in hot and humid climates. Replacement of the single big box style with the type of building forms having many swings, such as E, H shape or finger-style form (Fig. 17) will not only help to avoid solar heat gains, but also effectively increase wind-induced pressure difference on building envelopes.
Figure 17: Building form design strategies for solar mitigation
(to maximize surface-volume ratio while minimizing solar-exposed surface areas) in the design of King Abdullah University of Science and Technology, Saudi Arabia. Source: HOK ©

19
Buildings should be oriented so as to minimize the area of their surfaces exposed to solar radiation. This is achieved by maximizing north and south facing walls while also keeping west facing walls at minimum. Shade produced from a building itself also helps to deflect solar beams to shine on other parts of the building’s surfaces. This can be achieved by creating convexo-concave effects with swings, on building surfaces or forms such as E and/or H. Building forms also can be oriented to catch prevailing wind in order to drive this air into desired spaces. They can be manipulated to accelerate the velocity of air flow as well, to increase pressure differences between any exterior building surfaces where openings are intentionally placed.
Figure 18 Coventry University features a deep layout, incorporating wind towers.
Source: the United Kingdom Education Advisory Service.
2.3.4 Building envelopes and structures - Insulation
Insulation helps to prevent heat transition between building envelopes. In hot and humid climates, it is mostly used to avoid heat absorption by the exterior building layers and radiate this heat into the indoor spaces. The roof and walls exposed to the sun must therefore be well-insulated, in order to keep solar gains low. The minimum thermal resistance values (R-value) of envelope assemblies of non-residential buildings in hot and humid climate Zone 1A, as required by the Energy Standard for Building Except Low-Rise Residential buildings by American Society of Heating, Refrigerating and Air-conditioning Engineering ASHRAE 90.1-2010 and the Standard for the Design of High-Performance Green Buildings ASHRAE 189.1-2011, are discussed in Chapter 4.
- Light Color
An effective way to reduce solar gains is to reject solar heat by utilizing light-colored, reflective exterior surfaces with high solar reflectance index (SRI), indicating the percentage of incoming solar radiation that is being reflected and emitting it off of a building’s surface. A building surface color strongly affects its solar reflectance index. For example, choosing a building material with a light-colored and reflective finished surface often results in achieving a higher reflectance index. In hot and humid climates, both thermal resistance and solar reflectance help a building to mitigate solar heat gains. The Leadership in Energy and

20
Environmental Design (LEED) rated certificate system credit requires an SRI of 78% for low-slope roofs and one of 29% for steep roofs.20F
18
- Light weight construction
For hot and humid climates, night cooling using thermal mass might not be feasible for small diurnal temperature. Therefore, light-weight envelopes should be used to enable heat to radiate outward and cool the envelope as soon as possible.
- Solar shading
The issue of solar heat gains becomes critical in determining the cooling load or ventilation rate in a building, to offset the total internal heat gains in order to achieve thermal comfort for occupants. Solar heat gains comprise direct solar beams, diffuse sky solar radiation and reflected radiation. Solar shading devices can be used to block solar beam and solar radiation before they hit on building envelopes, and should be applied to the entirety of a building (Fig. 19) Shading for windows is especially crucial, too. Such devices not only serve in heat gain mitigation but also increase the visual comfort, day-lighting and airflow through windows in buildings, and therefore also have to be taken into account. 21F
19
Figure 19: An example of building shading from the roof
of a house in Kuala Lumpur, Malaysia, designed by architect Ken Yeang Source: Ken Yeang Architect, “Roof-roof House in Kuala Lumper, Malaysia.” 2So
Solar shading devices can be divided into fixed and moveable types, based on their manner of operation. Moveable shading devices, for example, allow for higher flexibility and increased efficiency in operation, and can be manually or automatically operated. Automatic operation enables real-timely response to dynamic changes in direct solar beams, diffuse and reflected sky radiation.
Solar shading devices can be further classified as overhangs (horizontal) or fins (vertical), and by the various screen styles (brise-soleil, egg-crate…) shown in Figure 20, based on their configurations. Overhangs used on south-facing windows are effective with buildings located in the northern hemisphere, and vice-versa.
18 “Solar Reflectance Index and Cool Roofs.” 19 Lechner, Heating, Cooling, Lighting: Design Methods for Architects. p.139

21
Fins, on the other hand, are more effectively placed on east-facing and west-facing windows, where overhangs would otherwise have difficulty in blocking low attitude angle solar beams in the early morning or late afternoon. Screen-style solar shading devices combines the qualities of both overhangs and fins, to effectively control direct solar beams at a wider range of latitude and azimuth angle of the sun (Fig. 21).24F
20
Horizontal overhangs Vertical fins combination of overhangs and fins
(fixed and movable) (fixed and movable) (fixed and movable)
Figure 20: Examples of different window shading devices. Source: CIBSE, “Energy Efficiency in Buildings: CIBSE Guide F.”
Figure 21: Solar shading masks for horizontal overhangs, vertical fins and combined egg-crates
Source: Natural Ventilative Cooling of Buildings: Design Manual 11.02.
20 Ibid. p.157.

22
Shading device design strategies should be based not only on the specific orientation of a building’s facades, but also on the activities of its occupants. For example, solar shading for an entire building, using a louver roof, effectively protects large proportion of the building envelopes from solar beams without blocking desirable views. Moreover, this technique also provides shade for occupied outdoor spaces (courtyards and atriums), making it a preferable design solution for outdoor activities (Fig. 22).
Figure 22: The use of shading devices in design strategies
applied according to the specific orientation of a building’s façade. (James, et al.. 2008). Source: Paul Crosby.
Effects of solar shading devices on daylighting and view-comfort should be taken into account; for example, regulating the density of shading elements to meet the shading requirement for each building façade, in regard to its orientation. Adjusting the angle and depth of shading elements allows for the optimization of natural daylighting diffusion into spaces (Fig. 23).
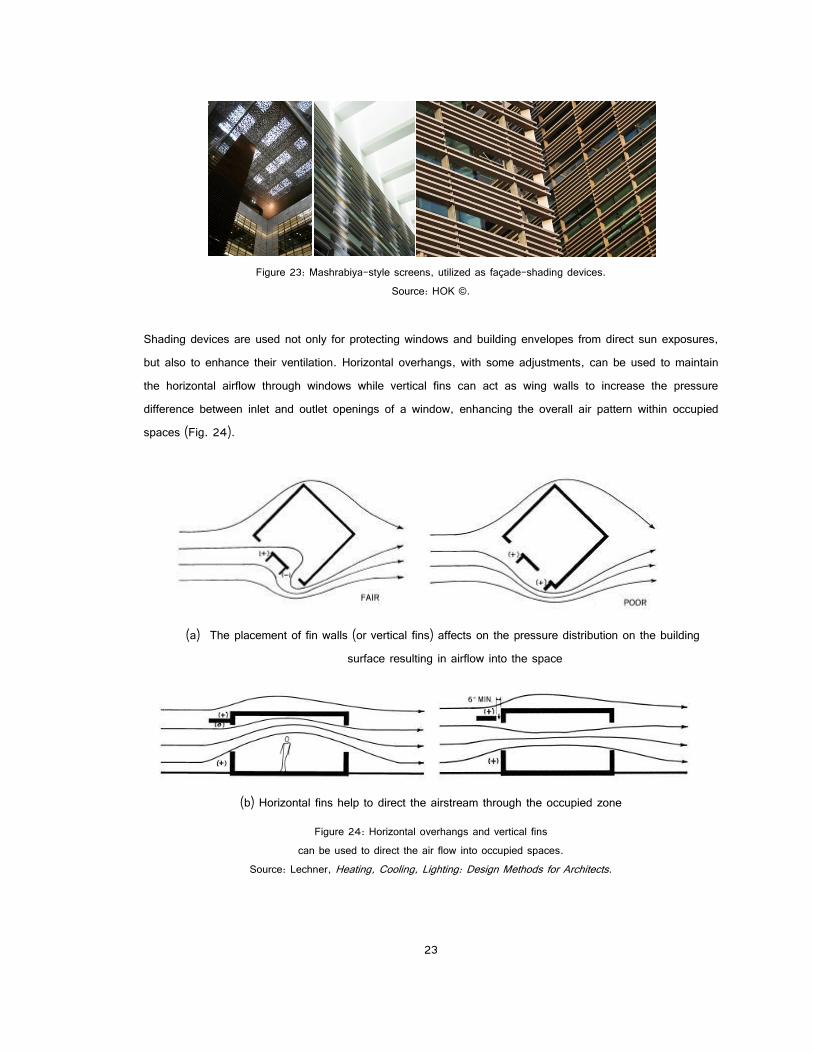
23
Figure 23: Mashrabiya-style screens, utilized as façade-shading devices.
Source: HOK ©.
Shading devices are used not only for protecting windows and building envelopes from direct sun exposures, but also to enhance their ventilation. Horizontal overhangs, with some adjustments, can be used to maintain the horizontal airflow through windows while vertical fins can act as wing walls to increase the pressure difference between inlet and outlet openings of a window, enhancing the overall air pattern within occupied spaces (Fig. 24).
(a) The placement of fin walls (or vertical fins) affects on the pressure distribution on the building
surface resulting in airflow into the space
(b) Horizontal fins help to direct the airstream through the occupied zone
Figure 24: Horizontal overhangs and vertical fins can be used to direct the air flow into occupied spaces.
Source: Lechner, Heating, Cooling, Lighting: Design Methods for Architects.

24
2.3.5 Openings
- Location
“Air movement within a building is affected by the orientation, size, placement, ratio and types of openings, which alter the inertia, pressure differentials and buoyancy characteristics of airflow.”7F
21 The placement and orientation of openings should be considered so as to increase airflow into and out of them, and they should be located in high pressure-difference zones to maximize driving forces. Inlet and outlet openings should be located in the positive and negative pressure regions, respectively. For comfort ventilation, windows should be at the level of the occupants. Also, the inlet openings should be placed closer to the floor while the outlet openings should be located high (near the ceiling) in the leeward side in order to direct the airflow to circulate throughout the occupied areas (Fig. 25).
Figure 25: Selection of the openings based on pressure difference study Openings should be located at the high pressure-difference zones depending on the wind direction. Openings also should be located at the occupant level for optimal comfort ventilation. Source: Lechner, Heating, Cooling, Lighting:
Design Methods for Architects.
21 Boutet, Controlling Air Movement: A Manual for Architects and Builders. p.85

25
- Orientation
Placement and orientation of openings also affect the distribution of airflow within buildings. For example, the orientation of openings should be considered in order to catch the dominant prevailing wind and thus drive it into spaces to enhance overall indoor air movement and ventilation quality. Placing windows on east and west facing facades should be avoided unless efficient solar shading devices are fully taken into account. Openings located and oriented at an oblique angle to the wind incidences increase turbulence to enhance overall air movement. A horizontal window, for example, is especially efficient to capture winds with a 45 degree incidence angle (Fig. 26).
Figure 26: The effectiveness of a window, according to its aspect ratio and orientation to wind incidence. Source: Boutet, Controlling Air Movement: A Manual for Architects and Builders.
- Size and aspect ratio
The size and aspect ratio of openings can play a significant role in determining the movement pattern as well as velocity of air blowing throughout a space. Horizontal, rectangular openings (with a height-to-width ratio smaller than 1.0) facilitate the capturing of more angles of wind incidence (Fig. 26). Also, the size of an opening can be selected to allow for installing additional components such as acoustical louvers and insect screens. In cross ventilation, airflow is mainly determined by the area of the smallest openings, with the optimal outlet-area-to-inlet-area ratio equal to 1.25. 28F
22
22 Ibid. p.87-91

26
- Type
The type of opening determines its maximum air flow effectiveness, as well as its capability to regulate the airflow rate through it. There are three main window types: sliding, vertical-vane and horizontal vane, and their configurations differently affect the airflow pattern and velocities. Table 2 shows the effectiveness and performance of these window types. While windows are typically installed on walls, with special modification, some types can also be used on the roof as, for example, an operable skylight. Doors also contribute to airflow into spaces. However, in commercial buildings, they often are closed for privacy reasons. In any case, the type of an opening governs the pattern of air movement (Fig. 27).
Table 2: The effectiveness and performance level of different window types
Window types Sliding window Vertical-vane window Horizontal-vane window
Single-hung
Side-hinged casement
Awning
Double-hung
Folding casement
Hopper
Horizontal sliding
Vertical pivot
Horizontal pivot
Jalousie
Maximum airflow effectiveness (%) 50 100 100
Performance Allows for adjustment of openings, small overall thickness
Allows complete openings, but offers poor rain protection
Allows for complete turning, thus facilitating the cleaning.
For rain protection, awnings open indoor, while hoppers open outdoor. The latter offers especially good ventilation (the opening is higher, close to the ceiling).

27
Figure 27: Window types that contribute to overall interior air movement. Source: Lechner, Heating, Cooling, Lighting: Design Methods for Architects.
- Glazing
Another consideration for openings is regarding their glazed panels’ modulation of heat radiation, solar heat gain and natural light transmission. These performances indicate, in terms of U-factor (U-value), the solar heat gain coefficient (SHGC) and visible transmittance (VT). U-value refers to non-solar heat loss as the reversed value of thermal resistance, as associated to a number of glazed panels, gap thickness and filled gas.
U-value is often less important for hot climates than other factors. A glazed panel with low-emittance coating, for example, allows visible light to be transmitted into indoor space for better daylighting while also suppressing solar heat flow. Different low-e glazed panels have different SHGC and VT values. Low-e glazed systems with low SHGC and high VT, avoiding excessive solar heat gain through an opening while maximizing natural daylight, are more applicable in hot climates.29F
23
For non-residential buildings in hot and humid climates (Zone 1A), the building energy code ASHRAE 90.1-2010 requires a vertical fenestration area ranging from 0%-40% of the total wall area, with maximum U-value of 1.20Btu/ft2-F and minimum SHGC of 0.25%.
The review of this section is applicable for the glazed systems of both atria and double-skin façades.
- Window control
Windows should have manual override controls and be connected to the building management system for controlling them, to ensure the high performance of the entire building in terms of optimal occupant thermal
23 “Window Technologies: Low-e Coatings.”

28
comfort, energy efficiency, safety, noise level and so on. These systems should allow occupants to adjust windows to suit their preferences and expectations per thermal comfort and noise tolerance (Fig. 28).
Figure 28: Window control system
Mechanical linkages for operating high windows and motor-driven pivot windows, in a greenhouse at Callaway Gardens, Georgia. Source: Lechner, Heating, Cooling, Lighting: Design Methods for Architects.
2.3.6 Internal layouts
Internal layouts usually focus on the functionalities, day-lighting and egress of spaces. Typical modern office layouts tend to fall into three categories: closed plan, open plan and modified open plan.31F
24 In terms of natural ventilation, the layouts should minimize airflow resistance while insuring the even distribution of airflow through desired areas. For example, partitions should be located and oriented at oblique angles to the airflow paths, so as to channel the air through occupied spaces. Partitions perpendicular to airflow paths should be placed close the outlet (Fig. 29).
Single-row closed-plan offices, with corridors located on one side and having shallow plan, are suitable for natural ventilation and day-lighting. Double-row or triple-row closed plan offices, with one or more central corridors, are more challenging for natural ventilation (Fig. 30). One solution for this type of internal layout is to combine indirect cross ventilation and stack ventilation through corridor vents, ventilation ducts or shafts. Open-plan offices offer a high potential for introducing airflow throughout spaces. Modified open-plan offices often have very deep plan, meanwhile, and therefore usually rely on air-conditioning and/or mechanical
24 Neufert and Neufert, Neufert: Architect’s Data. p.342

29
ventilation systems. However, this type still can be applicable to natural ventilation by utilizing the buoyancy-ventilation principle with atrium, wind towers or special ventilation shafts called light-wells.32F
25
Figure 29: Airflow patterns that result from different types of subdivisions within internal space.
Source: Boutet, Controlling Air Movement: A Manual for Architects and Builders.
Figure 30: Typical building layouts
Single corridor and double-central corridor layout of Kuykendall Hall and the open-office type of Coventry University
25 Krausse, Cook, and Lomas, “Environmental Performance of a Naturally Ventilated City Centre Library.”

30
2.3.7 Supplemental ventilation designs
- Atria
Atria are spaces covered with glazed envelopes and considered as semi-outdoor environments. Commonly found in commercial buildings, atria - including extended entrance lobbies, gardens, canteens, etc. - are intentionally used as main internal circulation areas. They can be grouped into five main categories: single-sided (or conservatory) atrium, two-sided atrium, three-sided atrium, linear atrium, and four-sided atrium, which are showed in Figure 31. 33
26 Stack ventilation, or the combination of stack and cross ventilation, in atria draws cool air into building spaces from lower parts, and extracts warm air out via glazed rooftop outlets.
Single-sided Two-sided Three-sided Linear Four-sided
Figure 31: Generic forms of atrium buildings Source: Atrium Buildings by Richard Saxon, cited from CIBSE F 2004
Besides facilitating natural ventilation principles, atria also help to block outdoor noise, and therefore allow windows to be freely opened in rooms attached to atria spaces. Internal noise can become a problem, however, when noise transfers between adjacent rooms through reflection. Warm air, accumulating at rooftops to increase the temperature difference for stack ventilation, can create overheating for occupants on upper floors. Therefore, an increase in atrium height, using clearstories instead of glazed roofs, as well as applying appropriate shading devices should be considered for the upper floors.34F
27
In hot and humid climates, outdoor air speed is relatively low. Also, the temperature difference is usually small in low-rise atrium buildings.35F
28 Therefore, either an increase of atrium height or the usage of passive radiant cooling should be considered so as to avoid the adverse effects of an atrium which can lead to overheating at the upper levels of occupied spaces. In addition, application of atria to these buildings is most feasible by utilizing stack and cross ventilation through attaching wind towers, chimneys, or assisted fans attached on atria’s rooftop, which increase ventilation rates.
26 CIBSE, “Energy Efficiency in Buildings: CIBSE Guide F.” 27 Abdullah and Wang, “Design and Low Energy Ventilation Solutions for Atria in the Tropics.” 28 Liu, Lin, and Chou, “Evaluation of Buoyancy-driven Ventilation in Atrium Buildings Using Computational Fluid Dynamics and Reduced-scale Air Model.”

31
- Double-skin façades
Double-skin façade is a system consisting of two skins providing a cavity for airflow, utilizing all ventilation principle (single-sized, cross, and stack ventilation). They function similarly to atria except that they contain no occupied space. Double-skin façades offer many benefits, such as the fullest opening for operable windows, the maximum usage of daylight, mitigation of outdoor noise and pollution, as well as security (Fig. 32.a). However, there are some concerns relating to these façades such as their propensity to overheat the upper levels, increase noise transference between adjacent rooms by reflection in glazed cavity surfaces, and increasing the level of difficulty in the required cleaning of the cavity.36F
29
(a) (b)
Figure 32: Double-skin façade (a) Hybrid mechanical and natural ventilation with double skin façades, for the Minerva Tower, London, UK.30
(b) A typical double-skin façade with shading devices in the cavity, for 1 Bligh Street building in Sydney.31
Solar shading devices that are properly placed inside cavities help to regulate heat flow between them and the overall building space (Fig. 32b). A study of double-skin façades showed a significant influence from both the color and position of shading devices inside a double-skin façade, on the building’s cooling load as well as on the occupants’ thermal comfort.37F
32 Utilizing solar shading devices to serve as service corridors, for the cleaning of cavities, should be considered in the design of double-skin façades. To improve the airflow inside cavities, they can be coupled with solar chimneys38F
33 or assisted fans.39F
34
29 Kleiven, “Natural Ventilation in Buildings: Architectural Concepts, Consequences and Possibilities.” p.60. 30 Arnold, “Building Envelope Design Guide - Introduction.” 31 “Sydney’s First Major ‘double-skin’ High-rise.” 32 Gratia and De Herde, “The Most Efficient Position of Shading Devices in a Double-skin Façade.” 33 Gratia and De Herde, “Guidelines for Improving Natural Daytime Ventilation in an Office Building with a Double-skin Façade.” 34 “Double-skin Façade.”

32
- Wind towers
Wind towers (or windcatchers) are traditional Persian architectural elements that provide natural ventilation for both arid and humid hot climates.40F
35 Their operation is based on two driving forces: wind-driven and buoyancy-driven temperature difference, utilizing a combination of both stack ventilation and cross-ventilation. The latter is more effective than the former alone, because of the dominant driving force from wind-driven pressure difference, in comparison to that from buoyancy-driven temperature difference, especially in hot and humid climates.41F
36
Figure 33: Different wind towers:
A-uni-directional; B-bi-directional; C,D,E: omni-directional. Sources: Encyclopedia Iranica
Wind towers can be classified into different types based on the number of openings as shown in Figure 33: uni-directional (one-sided), bi-directional (two-sided) and omni-directional (four-sided, hexahedral, octahedral, circular…). Unlike the uni-directional wind tower, which will not function if it is situated away from the prevailing wind direction, bi-directional or omi-directional wind towers can ensure that there is at least one opening acting as inlet, with another as outlet, regardless of incident wind direction.
- Chimneys and solar chimneys
Chimneys, which are simpler than wind towers and often located on building roofs, use cross ventilation effects to exhaust hot air out, regardless of wind direction. A chimney usually will include a cover for its otherwise-open top to avoid rain intrusion. It can increase airflow through the gap between the cover and the top, create negative pressure on it, and eventually create suction in all wind directions due to the Bernoulli effect (Fig. 34).
35 A’zami, “Badgir in Traditional Iranian Architecture.” 36 Hughes and Cheuk-Ming, “A Study of Wind and Buoyancy Driven Flows Through Commercial Wind Towers.”

33
Figure 34: Examples of chimney usage in design
Chimneys on the ventilation shafts of the BRE building in Watford, UK (Gilbert and Callaghan, 1997). Chimneys on the roof of the IVEG building in Hoboken, Belgium (N. Hijmans, BBRI)
Solar chimneys are a special type that utilizes solar heat gain to enhance the stack ventilation effect. To maximize temperature differences between the inside and outside of a building, these increase solar heat gain by using a glazed solar collector and ventilation shaft (an absorber wall with high heat capacity and high solar absorptance such as a black-painted wall). The combination of radiation and convection inside solar chimneys causes air movement that enhances natural ventilation effectively, even when temperature and pressure difference is insufficient on hot, windless days.42F
37
2.3.7 Auxiliary systems - Ceiling fans
Ceiling fans are often used in naturally ventilated buildings to elevate human thermal comfort through air movement, removing excessive heat by increasing convection and evaporation rates. 43F
38 Speed, noise level,
power requirements and minimum floor-to-ceiling height requirements should be considered on a room-by-room basis, when selecting the best ceiling fan for a space. Minimum fan-assisted indoor air movement should be above 98 fpm (0.5m/s). Large, low-speed ceiling fans are preferable for both their low noise level and more even air distribution (Fig. 35).
Figure 35: 10 ft diameter slow-speed ceiling fans
at the Lavin-Bernick Center – Tulane University in New Orleans, LA. (James, et. al.. 2008)
37 Khanal and Lei, “Solar chimney—A Passive Strategy for Natural Ventilation.” 38 Boutet, Controlling Air Movement: A Manual for Architects and Builders. p.13

34
- Ventilation control
Sensors Actuators Controller Operable windows with actuators
CO2 sensor
Rain detector
Wind sensor
Chain actuator
Double chain actuator
Linear actuator
Operable window with linear actuators
Operable window with
chain actuators
Figure 36: Examples of components for the automatic control system of natural ventilation. Source: PassiVent © 45 F
39 and Teal Products © 46F
40
In naturally ventilated buildings, ventilation controls are very important to their performance. They have to be monitored, in order to prevent overcooling or overheating when outdoor temperatures are not desirable. The controls are used to operate the building’s ventilation components such as the fan-assisted ventilation of wind towers or ceiling fans whenever wind-driven or temperature-driven pressures are insufficient. The control of natural ventilation also includes opening and closing operable windows and specific vents, adjusting shading devices, in response to any changes of climatic conditions such as temperature, wind velocity, solar radiation, rain, pollution level, noise level, etc.
There are two types of natural ventilation control: manual and automatic. Manual control allows occupants to control operable windows, movable louver systems and local fans to their best thermal preferences and expectations. Automatic control, meanwhile, addresses a critical aspect of natural ventilation to ensure that all components are working properly and automatically respond to outdoor and indoor climatic conditions which are monitored in real-time.
39 “Intelligent Controls.” 40 Teal Products, “Electric Window Controls.”

35
An automatic control consists of (1) sensors (for temperature, carbon dioxide, wind speed and wind direction, rain detecting, solar gain, humidity, noise, and so forth), which are used for measuring indoor and outdoor climatic conditions, (2) actuators, with special mechanisms to close or open windows, vents, louvers, etc., and (3) controllers, which act as microcomputers to implement control strategies by processing acquired data from sensors, then sending responsive commands to the actuators (Fig. 36).
Natural ventilation control strategies are a part of a defined program, describing subsequent actions that follow a condition or set of conditions such as indoor pollution and/or indoor and outdoor temperature. Some examples of natural ventilation control include controlling the closing and opening of windows for single side ventilation, monitoring air temperature, wind velocity and direction to maximize stack ventilation in an atrium, with or without assisted fans, monitoring the full range of indoor and outdoor parameters (i.e. air temperature, wind velocity and direction, wind pressure, occupant presence, pollution level, etc.) to provide optimal ventilation rate and thermal comfort.44F
41
2.4 Advantages of and barriers to natural ventilation application
2.4.1 Advantages Natural ventilation has become an attractive design tool, especially in Europe.47F
42 It is known to have many advantages over both heating ventilation and air-conditioning (HVAC) and mechanical ventilation. The greatest advantage to natural ventilation is its cost-efficiency, including for both initial and ongoing operating costs. HVAC systems often count for 35% to 45% of construction costs, especially in large office buildings, and its fans, vertical and horizontal distribution systems consume about 20% to 40% the total volume thereof. Additional costs associated with HVAC include duct cleaning, filtration and other required maintenance.
Natural ventilation, however, can utilize spaces or volumes required for airflow pathways (e.g. ventilation shafts) toward “facilitating natural light distribution, occupiable spaces (e.g. atrium), and other formal architectural objectives.”48F
43 Moreover, natural ventilation, if applicable, has the potential to offset both the cost and level of energy consumption. A study of this from office buildings in UK confirmed that the application of natural ventilation could offset 10% of the energy consumed by an air-condition system. In addition, replacing the mechanical ventilation system altogether, with natural ventilation, can reduce energy consumption by up to 15%.49F
44
41 Allard and Santamouris, Natural Ventilation in Buildings: A Design Handbook.. P.210-221 42 Axley, “Application of Natural Ventilation for U . S . Commercial Buildings Climate Suitability Design Strategies & Methods Modeling Studies Application of Natural Ventilation for U . S . Commercial Buildings Climate Suitability Design Strategies & Methods Modeli.” 43 Ibid., p.11 44 Ibid., p.7

36
Compared to air-conditioned buildings, naturally ventilated ones often provide a higher air change rate to offset indoor heat gains for thermal comfort. They can bring fresher air into spaces, as well as expel indoor pollutants emitted from interior materials or generated from essential occupant activities. A survey of both occupants in air-conditioned buildings and those in naturally ventilated buildings, by Seppanen and Fisk, indicated a higher number of air-conditioning related symptoms.50F
45 In an area where the outdoor pollutant level is acceptable, natural ventilation therefore is a reliable system to provide quality indoor air to building occupants.
Moreover, as it is inherently associated with open-window environments, natural ventilation can offer opportunities for designers or architects, to attract clients by bringing pleasant environment into their designs in more creative ways. 51F
46
2.4.2 Barriers
Natural ventilation’s applicability depends on the outdoor conditions where a building is located, as well as the level of internal heat gains (e.g. through essential activities, solar radiation…) to maintain thermal comfort and acceptable indoor air quality. Climatic conditions with high temperatures, relative humidity, a certain outdoor noise level and/or severe outdoor pollutants can limit the applicability of natural ventilation. Moreover, weather conditions, which are inherently unstable, present big challenges for natural ventilation to minimize undesired indoor thermal comfort conditions, within such short terms as can be tolerated by occupants. 52F
47
Barriers to the actual implementation of natural ventilation, such as safety and security issues (e.g. unauthorized intruders, animals, and insects…), and draft from high wind velocity causing annoyance to the occupants in tall buildings has also been investigated. These can be overcome by applying appropriate design solutions, such as using screened or other protective window frames and self-regulating, operable windows with occupant override. Other barriers to natural ventilation include smoke control and fire safety preventive measures, per the risks of both fire and smoke spreading through the airflow pathway. To solve this problem, the IVEG building in Belgium, as an example, applied zone separation to isolate a fire in one zone long enough for the successful emergency evacuation of the rest. Moreover, increased risk in reliability and design fees that are otherwise irrelevant to the increased workload limit the application of natural ventilation in practice. 53F
48
45 Seppanen and Fisk, “Relationship of SBS-Symptoms and Ventilation System Type in Office Buildings.” 46 Allard and Santamouris, Natural Ventilation in Buildings: A Design Handbook., p.6 47 Ibid., p.6 48 Ibid., p.186

37
CHAPTER 3
PREDICTION METHODS
3.1 Prediction methods for the study of airflow in natural ventilation
In natural ventilation studies, the air velocities, airflow rates and temperature of a zone are very important factors in studying thermal comfort. There are many airflow prediction methods, ranging from simplified empirical models to sophisticated, computational fluid dynamics (CFD), summarizing in Table 3.
Table 3: Feature of airflow prediction models 54F
49 55F
50 Models Applicability Available models Outputs
Empirical models (airflow rate)
Single-sided ventilation and no obstruction
British Standards (1980) Warren (1985) Phaff & De Gids (1982) Larsen (2006) Aynsley (1977)
Airflow rates
Cross ventilation and no obstruction
CIBSE (1986) Phaff & De Gids (1982)
Stack ventilation Phaff & De Gids (1982)
Infiltration ASHRAE (1985)
Empirical models (air velocity)
Cross ventilation and no obstruction
Givonni (1978) Melargno (1982) Graca(2003) CSTB (1982)
Air velocities
Mono-zone airflow model Cross ventilation and no obstruction
AIDA (Liddament, 1996) European standard EN
15242:2006 NatVent, NiteCool (Svensson &
Aggerholm, 1998)
Airflow rates Internal pressure
Multi-zone Airflow Network models
Single-sized ventilation LoopDA (Dols and Emmerich, 2003)
Airflow rates Internal pressure
Cross ventilation and obstruction
COMIS (Feustel,2001) CONTAM (Walton & Dols,
2005)
49 Caciolo, Marchio, and Stabat, “Survey of The Existing Approaches to Assess and Design Natural Ventilation and Need for Further Developments.” 50 Allard and Santamouris, Natural Ventilation in Buildings: A Design Handbook.,p.63

38
Multi-zone Airflow Network models (continued)
Stack ventilation CONTAM (Walton & Dols, 2011)
Multi-zone Airflow Network models + multi-zone heat thermal models
Any kind of configuration
EnergyPlus (2011) + Airflow Network model
Airflow rates Internal pressure Temperature
CFD models Any kind of configuration
Fluent CFX AirPak MicroFlo (IES Virtual
Environment) Autodesk Simulation CFD Flow Designer (Advanced
Knowledge Laboratory) STAR-CCM+ (CD-Adapco)
Air velocities Temperature Pressure
coefficients, Indoor and outdoor air motion
3.1.1 Empirical models
Empirical models, based on theory or specific experimental measurements, are applicable in the earliest design phrase to obtain rough mean airflow rates or indoor air velocities of single-zone buildings. These may work with single-sized, cross or stack ventilation systems, but do not take into account any obstructions and/or internal partitioning.
For airflow prediction, the British Standards method can be applied to single-sided and cross ventilation, whereas the ASHRAE method considers infiltration of low story buildings. The Aynsley method is also applicable to cross ventilation, but takes into account the wind directions and pressure coefficients. A more complicated empirical method, developed by De Gidds and Phaff, considers wind-driven, buoyancy-driven and turbulence-induce ventilation into the calculation.
For indoor air velocity prediction, there are several empirical models using Givonni’s formula and the tabulated data methods by Melargno, for predicting mean indoor air velocities based on opening-to-wall ratios with outdoor reference velocities. The most complicated and advanced ones, developed by Center Scientifique et Technique du Batiment are known as CSTB models and are based on data from wind tunnel measurement, taking into account site topographies, building and wind orientations, building forms and the internal layout of buildings.

39
3.1.2 Airflow Network models
Mathematical background
Airflow Network (AN) models are based on the concept of representing buildings as a grid of nodes (Fig. 37). These nodes represent individual thermal zones and exterior environments, which are interconnected by airflow paths representing infiltration routes or other intended openings. Thermal zones are assumed, as well-mixed and uniform temperature spaces.
Figure 37: Example of an Airflow Network diagram 51
(a) Floor plan of a multistory office building with a section of the air flow network, consisting of nodes (zones) which are connected by air flow path; (b) the location of the zones shown in (a) within the building.
Assuming an AN model of a building with N thermal zones will have N nodes connecting to each other and to the exterior nodes, the mass airflow between these nodes will establish their relationship as represented by the following equation:
10)
Where Qi is the mass airflow rate through an opening i; is the air density; n is flow exponent to describe the turbulence level of the airflow and varying between 0.4 for fully turbulent flow to 1.0 for completely laminar flow; Pi is the pressure difference across the opening, which can be used from equation 3 from Chapter 2.
51 Haas et al., “COMIS V3.1 Simulation Environment for Multizone Air Flow and Pollutant Transport Modelling.”

40
C is the flow coefficient, related to the size and type of the opening, can be defined by:
where Cd is discharge coefficient and depends on opening geometry; Discharge coefficient is defaulted to 0.65 and can be estimated by using the following formula:
is area of opening and is air density; Todb is the outdoor drybulb temperature. Applying the Law of Mass Conservation, the total airflow rate of an entire network is equal to zero, or:
To solve the mass balance equation 5, the common way is to use an iterative computation (normally used in computer applications to utilize the computing power) in which initial values are first applied and the solution is then repeated, until the convergence criteria are achieved.
Application
AN models are used to calculate the rates between individual thermal zones. By calculating absolute airflow rates and signs of this through openings, the models help to predict answers to the following questions:
- Zone air change rates - Rates and directions of airflow through openings - Zone pressures
There are several AN model computer applications, such as COMIS (Conjunction Of Multizone Infiltration Specialists, CONTAM (Multizone Airflow and Contaminant Transport Analysis Software). The most advanced building energy simulation, Energy Plus, includes multi-zone heat transfer coupled with AN models to extend the application of AN models to calculate zone temperatures, humidity levels as well as both sensible and latent heat loads.
Limitations
AN models considerably simplify the complexity of a building and its airflow. For example, thermal zones are considered as well-mixed and uniform temperature spaces; flow coefficients and flow exponents, as well as discharge coefficients and wind pressure coefficients are difficult to accurately describe and quantify, per the driving forces and openings in the structure of the building. Moreover, AN models also are not capable of predicting an internal airflow pattern.

41
3.1.3 CFD models
CFD models are the most sophisticated model due to their incorporation of numerical methods and algorithms to solve Navier-Stokes, mass, momentum and energy conservation equations. These equations apply to a geometrical domain, which is divided into small volumes called grids, or meshes. CFD models represent costly computation mechanisms to solve turbulent flows. Depending on how to simplify them, they can be divided into three methods: direct numerical simulation (DNS), large eddy simulation (LES) and Reynolds-averaged Navier-Stokes equations with turbulence models (RANS).
With the rapid improvement of computing power and capacity, as well as turbulence modeling, CFD has become an indispensable tool for studying natural ventilation with the following applications: 52
- Airflow distribution - Temperature distribution - Detailed air velocities - Contamination, fire, smoke flow - Static wind pressure - Wind-induced building surface pressures which can be used to calculate wind pressure coefficients
Despite its powerful capabilities, CFD requires a high level of knowledge of and experience with fluid dynamics, heat transfer and numerical methods, for more accurate predictions. Besides, there are some other difficulties of using CFD, as follows:57F
53
- Selection of suitable turbulence model - Setting of boundary conditions for the air-supply diffuser - Selection of grid resolution - Estimation of convective heat sources, from occupants, computers, lighting - Proper use of numeric techniques (relaxation factors, iteration numbers, etc.)
Since this thesis is focused on optimization, and therefore is involved in a lot of iterative computation, CFD was chosen as the supplemental tool to calculate the wind pressure coefficients used in the AN models.
3.2 Building energy simulation with EnergyPlus
Building simulation covers a wide range of technologies used to study performance related to energy, mass flow, structural durability, aging, egress, and construction sites. Since the 1960s, building simulation studies have mainly focused on energy consumption, lighting, air-conditioning, and air movement. With recent
52 Caciolo, Marchio, and Stabat, “Survey of The Existing Approaches to Assess and Design Natural Ventilation and Need for Further Developments.” 53 Malkawai and Augenbroe, Advanced Building Simulation. p. 125
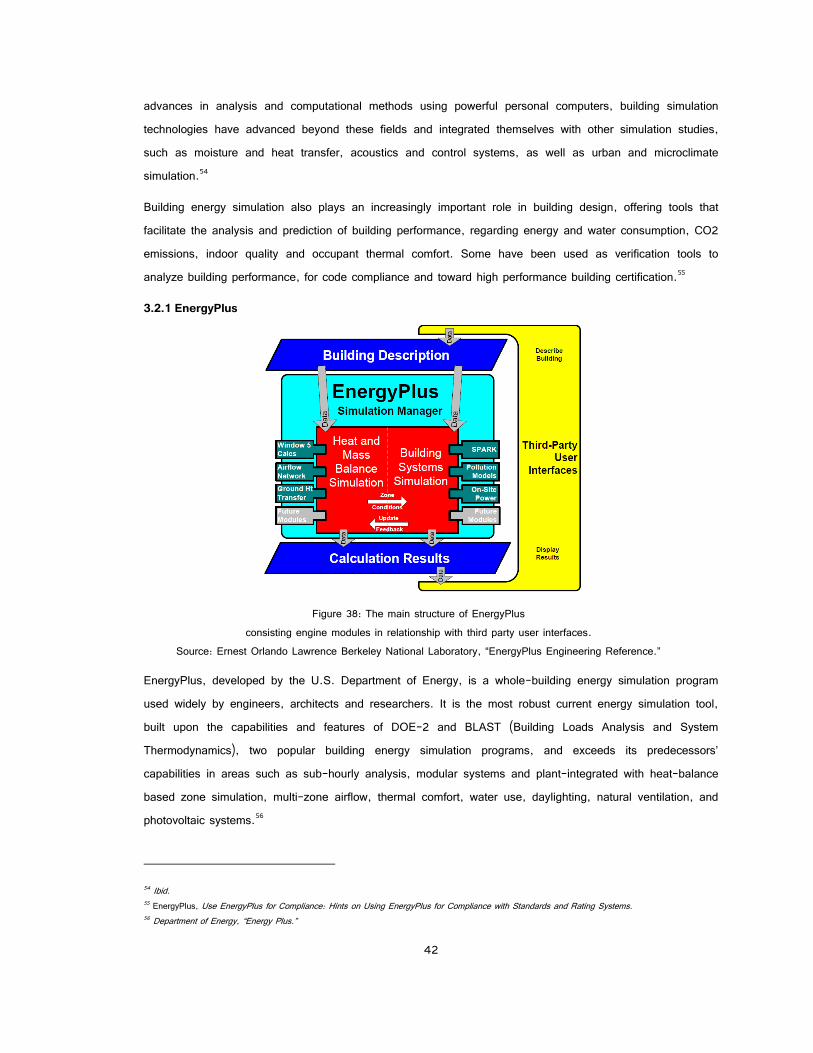
42
advances in analysis and computational methods using powerful personal computers, building simulation technologies have advanced beyond these fields and integrated themselves with other simulation studies, such as moisture and heat transfer, acoustics and control systems, as well as urban and microclimate simulation.58F
54
Building energy simulation also plays an increasingly important role in building design, offering tools that facilitate the analysis and prediction of building performance, regarding energy and water consumption, CO2 emissions, indoor quality and occupant thermal comfort. Some have been used as verification tools to analyze building performance, for code compliance and toward high performance building certification.59F
55
3.2.1 EnergyPlus
Figure 38: The main structure of EnergyPlus
consisting engine modules in relationship with third party user interfaces. Source: Ernest Orlando Lawrence Berkeley National Laboratory, “EnergyPlus Engineering Reference.”
EnergyPlus, developed by the U.S. Department of Energy, is a whole-building energy simulation program used widely by engineers, architects and researchers. It is the most robust current energy simulation tool, built upon the capabilities and features of DOE-2 and BLAST (Building Loads Analysis and System Thermodynamics), two popular building energy simulation programs, and exceeds its predecessors’ capabilities in areas such as sub-hourly analysis, modular systems and plant-integrated with heat-balance based zone simulation, multi-zone airflow, thermal comfort, water use, daylighting, natural ventilation, and photovoltaic systems.60F
56
54 Ibid. 55 EnergyPlus, Use EnergyPlus for Compliance: Hints on Using EnergyPlus for Compliance with Standards and Rating Systems. 56 Department of Energy, “Energy Plus.”
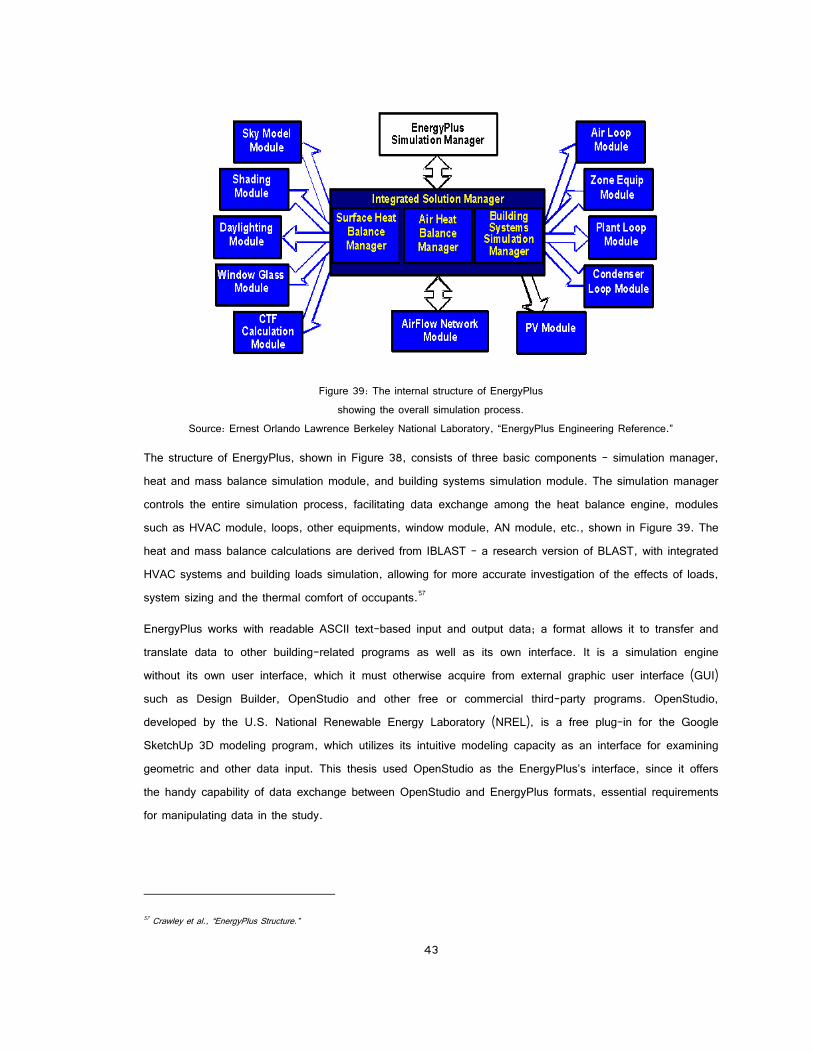
43
Figure 39: The internal structure of EnergyPlus
showing the overall simulation process. Source: Ernest Orlando Lawrence Berkeley National Laboratory, “EnergyPlus Engineering Reference.”
The structure of EnergyPlus, shown in Figure 38, consists of three basic components – simulation manager, heat and mass balance simulation module, and building systems simulation module. The simulation manager controls the entire simulation process, facilitating data exchange among the heat balance engine, modules such as HVAC module, loops, other equipments, window module, AN module, etc., shown in Figure 39. The heat and mass balance calculations are derived from IBLAST - a research version of BLAST, with integrated HVAC systems and building loads simulation, allowing for more accurate investigation of the effects of loads, system sizing and the thermal comfort of occupants.61F
57
EnergyPlus works with readable ASCII text-based input and output data; a format allows it to transfer and translate data to other building-related programs as well as its own interface. It is a simulation engine without its own user interface, which it must otherwise acquire from external graphic user interface (GUI) such as Design Builder, OpenStudio and other free or commercial third-party programs. OpenStudio, developed by the U.S. National Renewable Energy Laboratory (NREL), is a free plug-in for the Google SketchUp 3D modeling program, which utilizes its intuitive modeling capacity as an interface for examining geometric and other data input. This thesis used OpenStudio as the EnergyPlus’s interface, since it offers the handy capability of data exchange between OpenStudio and EnergyPlus formats, essential requirements for manipulating data in the study.
57 Crawley et al., “EnergyPlus Structure.”

44
3.2.2 EnergyPlus’ built-in Airflow Network model
Airflow Network (AN) model is integrated into the building energy simulation of EnergyPlus to utilize both the coupled thermal and AN model approaches, thus providing the ability to simulate the performance of air distribution, thermal conduction and air leakage losses. This allows for modeling not only natural ventilation but also hybrid ventilation systems. The relationship between AN objects and their associated EnergyPlus objects is shown in the Figure 40.
The process of AN model calculation is described in the following sequential steps:
- Pressure and airflow calculations - Node temperature and humidity calculations - Sensible and latent load calculations
Pressure and airflow calculations determine the pressure at each node and the airflow through each linkage. Based on what is calculated for each, the AN model determines node temperatures and humidity ratios per a given zone’s air temperatures and humidity ratios. Using these, the sensible and latent loads can be calculated and summed up with all possible leakage for each zone’s total, which can then be used to predict the final zone’s air temperatures and humidity ratios. 62F
58
The EnergyPlus’ AN model for natural ventilation requires information related to wind-driven air pressure surrounding the buildings. This information is called wind pressure coefficients which can be obtained from wind tunnel studies, CFD simulation, or algorithms based on the parametric approach and the measurement of certain defined building configurations and environmental conditions. 63F
59
Due to time and financial constraints, the pressure coefficient data required to plug AN models into this thesis will be obtained by CFD simulation, using the Flow Designer application from Advanced Knowledge Laboratories. The formulas for translating surface pressures to pressure coefficients are discussed in Chapter VI.
58 Gu, “Airflow Network Modeling in EnergyPlus.” 59 Allard and Santamouris, Natural Ventilation in Buildings: A Design Handbook..p.29
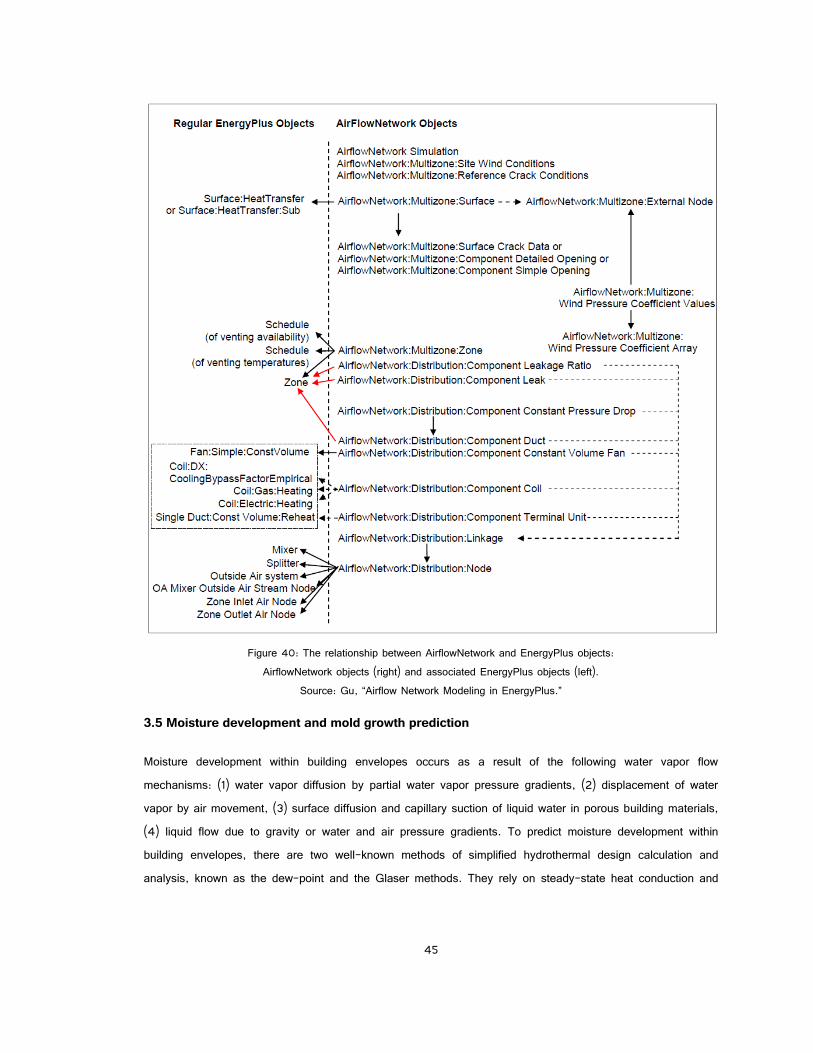
45
Figure 40: The relationship between AirflowNetwork and EnergyPlus objects:
AirflowNetwork objects (right) and associated EnergyPlus objects (left). Source: Gu, “Airflow Network Modeling in EnergyPlus.”
3.5 Moisture development and mold growth prediction
Moisture development within building envelopes occurs as a result of the following water vapor flow mechanisms: (1) water vapor diffusion by partial water vapor pressure gradients, (2) displacement of water vapor by air movement, (3) surface diffusion and capillary suction of liquid water in porous building materials, (4) liquid flow due to gravity or water and air pressure gradients. To predict moisture development within building envelopes, there are two well-known methods of simplified hydrothermal design calculation and analysis, known as the dew-point and the Glaser methods. They rely on steady-state heat conduction and
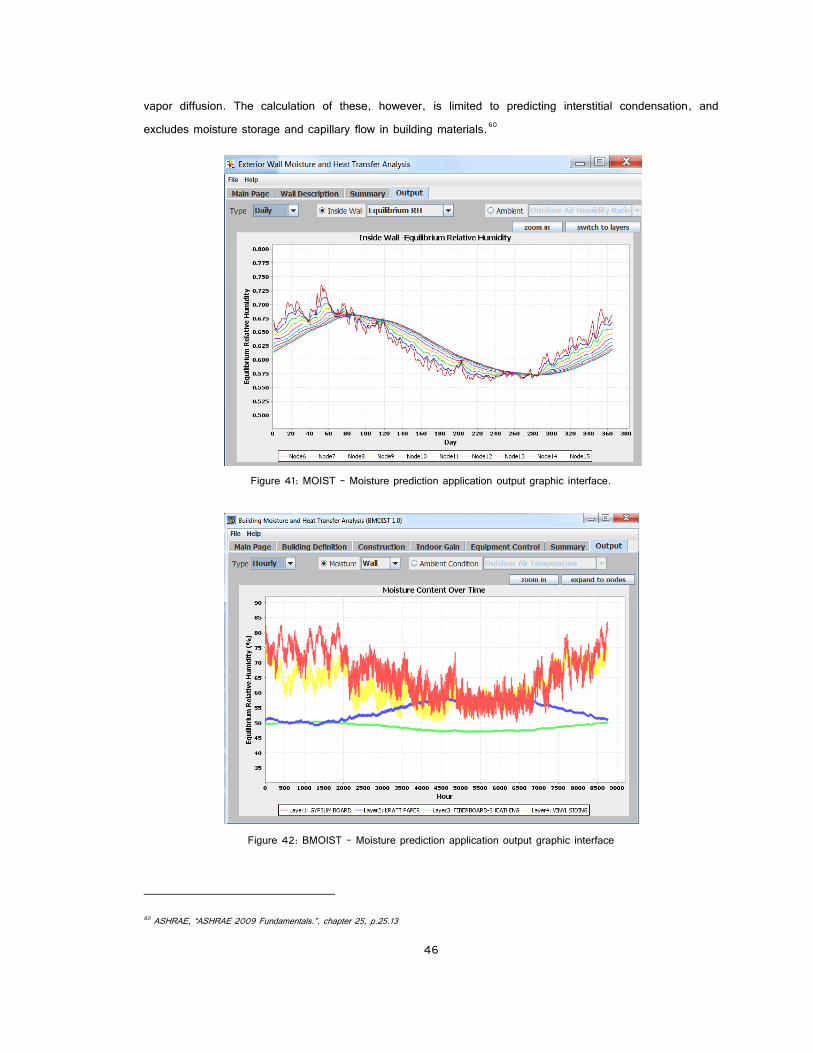
46
vapor diffusion. The calculation of these, however, is limited to predicting interstitial condensation, and excludes moisture storage and capillary flow in building materials. 65F
60
Figure 41: MOIST - Moisture prediction application output graphic interface.
Figure 42: BMOIST - Moisture prediction application output graphic interface
60 ASHRAE, “ASHRAE 2009 Fundamentals.”, chapter 25, p.25.13

47
There are several ‘transient computational analysis’ models that can analyze and predict time-varying heat, air and moisture profiles of building components, in order to give more realistic results than those derived from steady-state heat conduction and vapor diffusion models. MOIST (Fig. 41) and BMOIST (Fig. 42), developed by Zhong et al. (2008) from Ray W.Herrick Laboratories, Purdue University, is a sub-hourly simulation software limited to one-dimensional transfer of heat and moisture using overall balances.
MOIST is limited to predicting heat and moisture performance for a single, exterior wall of any construction. BMOIST, meanwhile, is applicable to whole-building performance, but limited to residential buildings with simple given forms, limited to three stories and one attic. Results are given per the number of hours wherein a level of moisture condition is present that can lead to either mold growth (when equilibrium relative humidity is above 80% at any layer inside building envelopes) or structure damage (when the moisture content of any layer reaches the saturation state).66F
61
WUFI (Fig. 43), developed jointly by Oak Ridge National Laboratory and the Fraunhofer Institute for Building Physics (IBP) and validated using data derived from outdoor and laboratory testing, enables realistic calculation of the transient hygrothermal behavior of multi-layer building components exposed to natural climate conditions. Moreover, WUFI can display any calculation in-progress, in the form of an animation showing the thermal and hygric processes in the building components.67F
62
Figure 43: WUFI - Moisture prediction application output graphic interface
61 Zhong, Ma, and Braun, “MOIST 4.02 and BMOIST 1.0.” 62 Oak Ridge National Laboratory and the Fraunhofer Institute for Building Physics, “WUFI.”
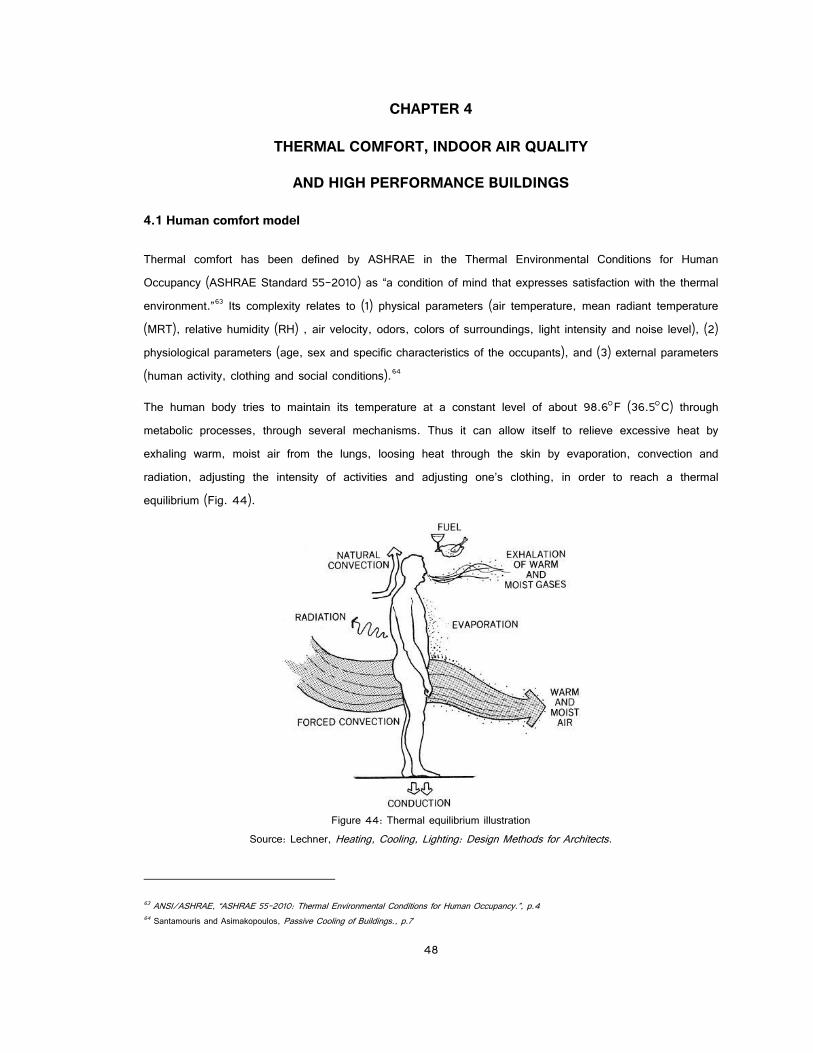
48
CHAPTER 4
THERMAL COMFORT, INDOOR AIR QUALITY
AND HIGH PERFORMANCE BUILDINGS
4.1 Human comfort model
Thermal comfort has been defined by ASHRAE in the Thermal Environmental Conditions for Human Occupancy (ASHRAE Standard 55-2010) as “a condition of mind that expresses satisfaction with the thermal environment.”68F
63 Its complexity relates to (1) physical parameters (air temperature, mean radiant temperature (MRT), relative humidity (RH) , air velocity, odors, colors of surroundings, light intensity and noise level), (2) physiological parameters (age, sex and specific characteristics of the occupants), and (3) external parameters (human activity, clothing and social conditions).69F
64
The human body tries to maintain its temperature at a constant level of about 98.6F (36.5C) through metabolic processes, through several mechanisms. Thus it can allow itself to relieve excessive heat by exhaling warm, moist air from the lungs, loosing heat through the skin by evaporation, convection and radiation, adjusting the intensity of activities and adjusting one’s clothing, in order to reach a thermal equilibrium (Fig. 44).
Figure 44: Thermal equilibrium illustration
Source: Lechner, Heating, Cooling, Lighting: Design Methods for Architects.
63 ANSI/ASHRAE, “ASHRAE 55-2010: Thermal Environmental Conditions for Human Occupancy.”, p.4 64 Santamouris and Asimakopoulos, Passive Cooling of Buildings., p.7

49
Based on the theory called Fanger’s Thermal Equilibrium Equation, the so-called Fanger model is widely known as the first quantitative estimation of thermal comfort, using Predicted Mean Vote (PMV) and Predicted Percent of Dissatisfied (PDD). The PMV index is calculated through a mathematical function relating to “the imbalance between the actual heat flow from the human body in a given environment and the heat flow required for optimum comfort at the specific activity.” 70F
65 PPD is calculated as a function associated to PMV to define dissatisfaction.
The PMV index is a complex mathematic function of the metabolic rate, clothing insulation, air temperature, radiant temperature, air speed and humidity, to indicate the predicted mean value of the votes of a large group of people, according to their thermal sensation. This index adopts a seven point psycho-physical ASHRAE scale, varying from -3 to +3 (Table 4). The negative and positive ranges indicate an uncomfortably cool and an uncomfortably hot sensation, respectively. A zero range represents a comfortably neutral sensation.71F
66
Table 4: ASHRAE scale of thermal sensation
-3 -2 -1 0 +1 +2 +3
cold cool slightly cool neutral slightly warm warm hot
PPD is an index related to a quantitative prediction of the percentage of thermally dissatisfied people. PPD is
converted from PMV by the following formula and chart:
The aim of the PMV and PPD theory is to serve in the quantitative prediction of complex phenomena related
to thermal comfort. However, it may not be possible to achieve acceptable thermal comfort for all people
within a given space, since clothing, level of activities, metabolic rates and thermal comfort expectations vary
from person to person. According to Santamouris, a thermal comfort condition is acceptable if PMV is less
than ±0.5 (or PPD < 10%), which is relevant to 90% of the predicted satisfied occupancy (Fig. 45).73F
67
65 Ibid., p.146 66 Fange, Thermal Comfort. 67 Santamouris and Asimakopoulos, Passive Cooling of Buildings., p.148

50
Figure 45: Conversion between PDD and PMV.72F
68
Figure 46: Acceptable range for operative temperature and humidity, by ASHRAE 55-2010 74F
69
68 ANSI/ASHRAE, “ASHRAE 55-2010: Thermal Environmental Conditions for Human Occupancy.”

51
Based on Fanger’s thermal comfort theory, ASHRAE 55-2010 defines acceptable thermal condition as that
which satisfies general thermal comfort (whole body) for 90% of occupancy (PPD = 10%, -0.5 < PMV <
+0.5). Figure 46 defines the range of operative temperature and relative humidity for the “acceptable thermal
environment for general comfort,” applied to people with sedentary activities equivalent to metabolic rates
between 1.0 met and 1.3 met, with clothing insulation of 0.5 clo (summer condition) and 1.0 clo (winter
condition).
4.2 Adaptive thermal comfort model for naturally ventilated buildings
The aforementioned thermal comfort level was derived from older versions of ASHRAE 55 (e.g.
ANSI/ASHRAE 55-1992,) based on Fanger’s model. This is defined for air-conditioned spaces, where all
environmental conditions are mechanically or electrically maintained throughout occupied periods. For
naturally ventilated buildings, occupants do often need some degree of indoor climatic control to adjust
according to their own thermal preferences. Thus, adaptive thermal comfort models that allow “a wider band
of indoor temperature”75F
70 are necessary for naturally ventilated buildings.
There are several proposed thermal comfort models, of which this paper will discuss the common adaptive
model by Humphrey, the adaptive model by De Dear & Brager (1998) and their revised adaptive model
(2002,) which has been accepted as a new comfort standard for naturally ventilated buildings into the
ASHRAE standard known as Thermal Environmental Conditions for Human Occupancy since 2004
(ANSI/ASHRAE Standard 55-2004).
- Humphrey’s adaptive model
Unlike Fanger’s thermal comfort model, which relied on mathematical equations, Humphrey’s adaptive
thermal comfort model uses data from field research which is described as “best for assessing the potential
impacts of behavioral or psychological adaptations as they occur, in a realistic setting.” 71 According to
69 Ibid., p.6 70 De Dear and Brager, “Developing an Adaptive Model of Thermal Comfort and Preference.” 71 Ibid.

52
Humphrey, the comfortable indoor temperature (Tco) can be predicted through monitoring the monthly mean
outdoor temperature (Tm). Humphrey’s model considers naturally ventilated buildings to be“free-running.”
For an air-conditioned building, the comfort temperature is defined as:
with 1.4C for standard error and applicable when -24C < Tm < 23C and 18C < Tm < 30C.
For a free-running building, the comfort temperature is defined as:
with 1C for standard error, applicable when 10C < Tm < 34C.77F
72
- De Dear and Brager’s adaptive model (1998) and (2002)
According to De Dear (2002), the adaptive model is an “alternative and complementary theory of thermal
perception” to the conventional heat balance model, based on four main environmental factors (temperature,
MRT, RH, and air velocity) and two personal factors (activity and clothing).78F
73 This model is also a result of
behavioral adjustment and adaptation from occupants, based on their “past thermal experiences and current
thermal expectations,”7
74 as well as the relative matching of levels between indoor and outdoor climates.
The study was based on survey data of nearly 21,000, for the ASHARAE RP-884 project (1998) and came
from four continents, covering a broad spectrum of climatic zones, seasons (summer/winter) and 160
buildings of different building type (air-conditioned, natural ventilation, and mixed-mode). It resulted in the
proposed adaptive model for naturally ventilated buildings, as the ranges show in Figure 47. The acceptable
range is driven by the operative (To) and the mean outdoor effective temperatures (ETout). The optimal
comfort temperature is represented by the statistical regression line and based on RP-884 data from
naturally ventilated buildings.
Optimal operative temperature
72 Santamouris and Asimakopoulos, Passive Cooling of Buildings., p.151 73 Dear and Brager, “Thermal Comfort in Naturally Ventilated Buildings: Revisions to ASHRAE Standard 55.” 74 Ibid.

53
This equation has a standard deviation of 2.79C and 3.27C per 90% and 80% comfort criteria,
respectively. Where a mean outdoor effective temperature (ETout) is the result of an arithmetic average of
minimum and maximum outdoor temperatures, for a calendar month or a particular day, an operative
temperature (To) is an arithmetic average of air temperature and radiant temperature.
Figure 47: De Dear’s adaptive thermal comfort model (2002)
Optimal thermal comfort range, based on mean temperature surveys of NV buildings (left); Adaptive thermal comfort range, as 80% and 90% general comfort criteria (right)
This adaptive model was revised (2002) and accepted as a new comfort indicator for ASHRAE Standard 55, per naturally ventilated buildings. In comparison to the previous adaptive model (1998), this one substitutes the effective temperature (ETout) by the mean outdoor dry bulb temperature (Ta,out ) for convenient and practical reason. The optimal comfort temperature line formula is then as follows:
Optimal comfort temperature
with ±.5C and ±3.5C for 90% and 80% comfort criteria, respectively. Where, Ta,out is mean outdoor dry
bulb temperature and Tcomf is optimal comfort temperature.
- Acceptable thermal conditions in naturally ventilated buildings (ASHRAE 55-2010) adopt the adaptive thermal model, based on the ASHARAE RP-884 project (1998) by De Dear and Brager and is shown in Figure 48. This model applies to sedentary occupancy, with metabolic rates ranging from 1.0 to 1.3 met and mean outdoor air temperatures limited to between 10C (50F) and 33.5C (92.3F).
Buildings with natural ventilation Buildings with natural ventilation
-5 0 5 10 15 20 25 30 35
Mean outdoor effective temperature (C)
Ne
utra
l indo
or op
erati
ve
tempe
ratu
re (
C)
Indoo
r ope
rativ
e tem
pera
ture
(C)
5 10 15 20 25 30 35 Mean outdoor effective temperature (C)
29
27
25
23
21
19
17
15
32 30 28 26 24 22 20 18 16 14

54
Figure 48: The ASHRAE 55-2010 adaptive thermal comfort.
4.3 Indoor air quality and ventilation rates
Figure 49: Indoor air quality and ventilation rates Source: Hazim B. Awbi, Ventilation of Buildings.
Variation of indoor pollution concentration with outdoor ventilation rates (left); outdoor air flow rates for different pollutants (right)
Ventilation plays an essential role in maintaining good indoor air quality. By replacing stale indoor air with ‘clean’ air (normally from outdoors), it provides new and fresher air with a higher oxygen percentage for
5 10 15 20 25 30 35 Mean monthly outdoor air temperature (C)
50 59 68 77 86 95F
Ind
oor o
pera
tive t
empe
ratu
re (
C)
32
30
28
26
24
22
20
18
16
14
86.0F
82.4F
78.8F
75.2F
71.6F
68.0F
64.4F
60.8F

55
metabolism and to dilute metabolic pollutants (carbon dioxide CO2 and odors) as well as others derived from indoor and outdoor sources.80F
75 High ventilation rates result in low pollution concentration levels. Minimum ventilation rates need to be set, to make sure that the concentration levels of all indoor pollutants are reduced at the threshold limit values (TLVs) shown in Figure 49. 81F
76
Study from Burge showed a significant relationship between ventilation rates and illness associated to work places or houses called sick building syndrome (SBS) especially when the air change rate falls below 10 liters/second per occupant.82F
77 Another criterion for ventilation is the air change rate ACH (1/h); that is, the number of times the air changes over with outside air, hourly. The rates for typical rooms and buildings are shown in Table 5. However, regarding their effects on thermal comfort, a study on night convective cooling showed that though they are effective at 10ach, there is no significant improvement if ventilation rates are increased beyond this.83F
78
Table 5: Air change rates of typical buildings and rooms 84F
79 Building/Room Air Change Rates (1/hr) Offices, public 3 Offices, private 4
School classrooms 4-12 Library, public 4 Auditoriums 8-15
Compared to air conditioned buildings, naturally ventilated ones often provide a higher air change rate to offset indoor heat gains for thermal comfort. Thus, they have greater potential to bring fresher air into spaces than other types, and can likewise expel indoor pollutants emitted from interior materials or generated from occupants’ essential activities. A comparative survey of occupants in both air conditioned and naturally ventilated buildings by Seppanen and Fisk indicated a higher number of SBS cases relating to air conditioning.85F
80 Where outdoor pollutant levels are acceptable, natural ventilation is therefore a reliable technique to provide quality indoor air to occupants.
75 Liddament, A Guide to Energy Efficient Ventilation. 76 Hazim B. Awbi, Ventilation of Buildings. p.70-72 77 Burge, “Sick Building Syndrome.” 78 Finn, Connolly, and Kenny, “Sensitivity Analysis of a Maritime Located Night Ventilated Library Building.” 79 www.EngineeringToolBox.com, “Air Change Rates for Typical Rooms and Buildings.” 80 Seppanen and Fisk, “Relationship of SBS-Symptoms and Ventilation System Type in Office Buildings.”

56
4.4 Humidity and mold development
Humidity is a big concern for occupants, per their thermal comfort and health, as well as to the durability of the building itself. A high level of humidity reduces the human body’s capacity to release excessive metabolic heat through evaporation.86F
81 Indoor relative humidity is believed to correlate to bacterial activity, mold development and other organisms, causing occupant health problems. In a study of the indirect health effects of relative humidity in indoor environments, Arundel et al. recommended the optimal range of relative humidity of between 40% to 60%, to minimize adverse health effects. 87F
82 However, ASHRAE adopted this recommendation with a lower range, from 30% to 60%, 8F
83 shown in Table 6.
Table 6: Optimum relative humidity range for minimizing adverse health effects. Source: Arundel et al. (1986)
Decrease in Bar Width Indicates Decrease in Effect
Optimal Zone
Bacteria Viruses Fungi Mites Respiratory Infections Allergic Rhinitis and Asthma Chemical Interactions Ozone Production
Percent Relative Humidity 10 20 30 40 50 60 70 80 90
Optimal zone recommended by Arundel et al. ASHRAE recommendation (2008 HVAC Systems and Equipment, Chapter 21, p.1)
High indoor relative humidity, while temperatures reach the dew point, will cause condensation that can result in changes to a building material’s properties and durability. For example, a high relative humidity resulting in excessive moisture content in insulation materials reduces their insulative capacity by up to 50%.89F
84
81 Boutet, Controlling Air Movement: A Manual for Architects and Builders., p.13 82 Arundel et al., “Indirect Health Effects of Relative Humidity in Indoor Environments.” 83 ASHRAE, ASHRAE 2008 Handbook HVAC Systems and Equipment. Chapter 25., p.1 84 Prowler, “Mold and Moisture Dynamics.”

57
High relative humidity and temperature are among the many factors related to indoor mold development, which causes 15-30% of SBS cases.90F
85 Figure 50 shows mold’s typical germination (day) and growth rate (mm/day) as a function of relative humidity and temperature (isopleth). It clearly indicates that these processes begin at indoor relative humidity levels higher than 65-70%, and at an air temperature of 70F (21C).91F
86
Figure 50: Isopleths of mold germination and growth rates. Source: Morse, “Indoor Air Quality and Mold Prevention of Building Envelope.”
One big concern about natural ventilation is regarding the humidity associated mold development, causing occupant health problems or other building-related illness. Mold growth results from the germination of mold spores. These exist in the outdoor environment, enter buildings through infiltration (building openings and cracks) as well as ventilation. Naturally ventilated buildings experience a higher level of windborne mold spores than that of mechanically ventilated or air-conditioned buildings (Fig. 51). This results from “maintaining air movement in mechanical ventilation to slow down mold germination or mold germinates in coils will be washed out by condensation.” 93F
87
85 Kowalski and Bumett, “Mold and Buildings.” 86 Morse, “Indoor Air Quality and Mold Prevention of Building Envelope.” 87 Kowalski and Bumett, “Mold and Buildings.”
0 10 20 30 40 50 0 10 20 30 40 50 (C) 32 50 68 86 104 122 32 50 68 86 104 122 (F)
Temperature
Rela
tive h
umidi
ty (%
)
100
95
90
85
80
75
70
65

58
Figure 51: Effect of ventilation systems on indoor spore levels
Source: California Healthy Buildings Study 1998, cited by Kowalski and Bumett
Mold growth rates depends on the magnitude and duration of surface relative humidity (SRH), a complex function of “the material’s moisture content, local surface’s temperature, and humidity conditions in the space.”94F
88 According to ASHRAE, keeping SRH below 80%, or possibly limiting the time period it is above 80%, can avoid mold growth. Particularly, according to Hens (1990) cited from ASHRAE 2009, SRH should not exceed 80% on a monthly mean basis.95F
89
4.5 Dehumidification
In hot and humid climates, dehumidification plays an essential part in achieving occupant thermal comfort, securing indoor air quality and preventing building material degradation from excessive moisture intrusion. For naturally ventilated buildings, indoor humidity closely fluctuates with outdoor humidity. Figure 52 shows the hourly outdoor relative humidity for a typical year in Honolulu, noting that the relative humidity (RH) levels very often exceed the indoor RH limitation for air-conditioned buildings as defined by ASHRAE 62.1-2007 (the dark blue with RH > 65%).
88 ASHRAE, “ASHRAE 2009 Fundamentals.”, chapter 25, p.25.14 89 Ibid., chapter 25, p.25.16
Spo
re le
vel (
cfu/m
3 )
100
80
60
40
20
0
Outdoor air
Air conditionin
g
Natural ventilation
Forced air distribution

59
Figure 52: Hourly relative outdoor humidity for the typical year in Honolulu, Hawai‘i
(based on typical meteorological year TMY3 weather data at Honolulu International Airport)
Figure 53: Types of dehumidifiers: Mechanical dehumidifier and Active desiccant dehumidifier 97F
90
90 Harriman, Brundrett, and Kittler, Humidity Control: Design Guide For Commercial and Institutional Buildings.p.197
Mechanical Dehumidifier Moisture is condensed from the air by a cooling coil. The unit’s condenser adds heat back to the air to reduce its relative humidity.
Active Desiccant Dehumidifier Air is dried by desiccant material in the rotating wheel. The heat from sorption is removed by the post-cooling heat exchanger.

60
There are two methods of dehumidification (Fig. 53): (1) refrigeration-based (using mechanical dehumidifiers) is the most popular method, using conventional air-conditioning principles to cool air to below its dew point and remove moisture by condensation. The resulting dry and cool air is then heated to the desired temperature by heat exchangers; (2) desiccant-based (using desiccant dehumidifiers) uses drying agents, in either solid or liquid forms, to remove excessive moisture from the air. This hot and dry air then can then be cooled to the desired comfort conditions by heat exchangers. Saturated desiccants will be reactivated, or may regenerate, to remove accumulated moisture by using thermal energy (electricity, waste heat, natural gas, or solar).96F
91
Desiccant-based dehumidification is applicable at and economical for use in lower temperature and humidity settings (RH<45%)98F
92. Desiccant dehumidifiers are used widely in commercial buildings and in industrial applications requiring lower-than-usual temperatures and humidity such as supermarkets, ice rinks and refrigerated loading docks.99F
93
Refrigeration-based dehumidification, meanwhile, is used to lower the air temperature to the dew-point and remove latent heat from air vapor for condensation. In climates with naturally low temperature and humidity, this would result in a lower dew-point and may cause the formation of ice on the coil and a reduction in moisture removal capacity. For example, when the indoor temperature is below 65F (18C), most dehumidifiers need to switch on and off, or to defrost themselves, for from 30-40 minutes out of every hour.100F
94 Mechanical dehumidifiers, widely-used in residential and commercial buildings, are therefore recommended for hot and humid climates.
In naturally ventilated buildings, dehumidifiers should be used periodically to reduce the risk of moisture developing inside construction cavities that could cause a mold problem. As an example, in the Kuykendall Hall renovation project the dehumidification system was proposed to keep the RH below 60% in order to dry out the indoor air when the building envelopes are completely sealed. To mitigate mold growth while increasing energy efficiency, this system was designed to run for about 4 hours of continuous operation at nighttime, every 72 hours.101F
95
91 Pesaran, “A Review of Desiccant Dehumidification Technology.” 92 Bry-Air Inc., “Desiccant Dehumidification Vs. Mechanical Refrigeration.” 93 Harriman, Brundrett, and Kittler, Humidity Control: Design Guide For Commercial and Institutional Buildings. 94 Energy Star, “Dehumidifier Basics.” 95 University of Hawai‘i Kuykendall Hall Renovation: Mechanical Basis of Design.

61
4.6 Outdoor noise reduction in naturally ventilated buildings
Noise is defined as “unwanted sound which may have varying affects from distraction and annoyance to hearing damage.”” ” 2F
96 For naturally ventilated buildings, the placement of large windows as a means to increase a large amount of airflow through indoor spaces also allows for the penetration of outdoor noise. Thus, it is a significant barrier to applying natural ventilation to buildings located in high noise-concentrated areas, such as urban sites. The overall benefits of natural ventilation, however, have encouraged new studies and the development of new techniques to further reduce noise ingress into naturally ventilated buildings, while still maintaining the required airflow.103F
97
When compared with those in air conditioned ones, occupants in naturally ventilated buildings are more tolerant of higher indoor noise levels, due to their lower expectations thereof as well as their greater awareness and tolerance of noise generated in open working spaces.104F
98 Field (2010) believed that the main cause of acoustic dissatisfaction in office environments is office activity (e.g. noise from people talking on phones or in other office areas), rather than the noise generated from the building ventilation system.105F
99
Unlike with sealed and air-conditioned buildings, there are no internationally-recognized standards for assessing interior background noise levels in naturally ventilated buildings.106F
100 From the study of speech intelligibility within them, Field (2010) suggests that this level should be set 10dB higher than the current standards for sealed and air conditioned buildings, currently set at 40-45dB.107F
101 A study of noise levels found among naturally ventilated offices in Athens, Greece , edited by Ghiaus and Allard (2004,) indicated that 60dB is an acceptable benchmark.108F
102
There are many techniques and design solutions used to eliminate noise penetration through exterior windows:
- Window vents can be incorporated into window frames for very high noise reduction (NR) level up 30dB, while still allowing for significant outdoor air flow through (Fig. 54).
96 Parkin, Humphrey, and Cowell, Acoustics, Noise and Buildings. P.156 97 De Salis, Oldham, and Sharples, “Noise Control Strategies for Naturally Ventilated Buildings.” 98 Field and Digerness, “Acoustic Design Criteria for Naturally Ventilated Buildings.” 99 Field, “Satisfactory Background Noise Levels in Naturally Ventilated Buildings - Challenging Acoustic Criteria Used in the Past.” 100 De Salis, Oldham, and Sharples, “Noise Control Strategies for Naturally Ventilated Buildings.” 101 Field, “Satisfactory Background Noise Levels in Naturally Ventilated Buildings - Challenging Acoustic Criteria Used in the Past.” 102 Ghiaus and Allard, Natural Ventilation in the Urban Environment: Assessment and Design.

62
Figure 54: Acoustical Vent Bar.
Source: PassiveVent ©
Flat Blade Acoustic Louvers
Airfoil Blade Acoustic Louvers
V-Blade Acoustic Louvers
Figure 55: Typical acoustic louvers and specifications.
The Noise Reduction (NR) of acoustical louvers is low for low frequency noise. The free area is between 20-30%. Source: Vibro-Acoustics ©

63
- Acoustic louvers, commonly used in natural ventilation, provide attenuation by screening the direct sound path using angled blades so as to absorb indirect, reflected noise through absorptive material on the underside of the blades. Acoustic louvers are very effective for high frequency noise, but less effective for that which is at a lower frequency (Fig. 55).
- Operable windows with acoustic screens are the easiest way to eliminate outdoor noise while also increasing airflow resistance (Fig. 56).
Overlapping façades to eliminate outdoor noise
Acoustic screens
Figure 56: Acoustic screens incorporated into operable windows. Source: Mach Acoustics ©
- Attenuation box consists of attenuator, weather louvers, and thermal dampers to restrict the passage of noise whilst allowing for airflow.
Acoustical louvers and attenuation boxes usually occupy considerable space within building façades after installation. Some are successfully integrated into the architectural design, such as in benches, shelves, etc. (Fig. 57). Notice that typical acoustical louvers often provide free area sizes within 20-30% of their overall areas. This study tackled the noise issue by determining the optimal free area sizes for openings which benefit both acoustical and architectural design, and shall be discussed in Chapter VI.

64
Attenuation boxes incorporated into window systems and curtain walls
Attenuation boxes incorporated into bench seats
Attenuation boxes incorporated into windows
Figure 57: Attenuation boxes. Source: Mach Acoustics ©
A
B
C
D
E
F
G C
A MACH acoustic attenuator B Ventilation louvers C Marine grade plywood D 12mm neo-sponge matting to seat E Plywood facing F Thermal-break operable louvers G Damp-proof course

65
4.7 High performance buildings
The designation of green, sustainable and high performance to a building can be used interchangeably, to describe an enhanced built environment through building design and construction. 109F
103 Organizations, agencies, building industries and researchers use different terms to address their specific interests. For example, the Energy Policy Act of 2005 (public law 109-058), which was passed by the U.S. Congress, considers high performance buildings as a key solution for combating excess energy consumption. The U.S Green Building Council (USGBC) has promoted green and sustainable buildings in professional practices, construction and building industry through a program called Leadership in Energy and Environmental Design (LEED). Smart, or intelligent, building can also be a more specific term relating to the utilization of advanced technology to enhance building performance.
A high performance building requires the integration and optimization of the following attributes: (1) energy efficiency (2) environmental friendliness, (3) durability, (4) life-cycle cost of operation and maintenance, and (5) occupant comfort.110F
104 Although these are high performance attributes for generic buildings, the dominant number of air-conditioned ones, compared with that of naturally ventilated ones, results in many studies of and available criteria for looking at high performance air-conditioned buildings and the lack thereof for those with natural ventilation.
Since there is no available high performance criterion for naturally ventilated buildings, this thesis reviewed Ventilation for Acceptable Indoor Air Quality ASHRAE 62.1-2010 (ASHRAE 62.1-2010), the Energy Standard for Buildings Except Low-Rise Residential Buildings ASHRAE 90.1-2010 (ASHRAE 90.1-2010) and the High Performance Non-residential Buildings ASHRAE 189.1-2011 (ASHRAE 189.1-2011) in an attempt to get some essential requirements for energy efficiency which is indispensible for naturally ventilated buildings.
4.7.1 ASHRAE 90.1-2010 vs. ASHRAE 189.1-2011
The Energy Standard for Buildings Except Low-Rise Residential Buildings (ASHRAE 90.1), distinguished with ASHRAE 90.2 for residential buildings, was first published in 1975 and periodically revised in 1980, 1989, 1999, 2001, 2004, 2007, 2010 and 2011.
- Building envelope
ASHRAE 90.1-2010 states that air-conditioned spaces may not exceed a 40% window-to-wall ratio in their façades. In addition, skylights may not exceed 5% of the total roof area. In terms of insulation, ASHRAE 90.1-2010 and ASHRAE 189.1-2011 require minimum thermal resistance values (R-value) for different
103 The U.S Environmental Protection Agency, “Green Building.” 104 National Institute of Building Sciences, “High Performance Building Council.”

66
climate zones. The comparison between ASHRAE 189.2010 and ASHRAE 189.1-2011 with regard to R-values and maximum thermal conductive values (U-value) for hot and humid climate Zone 1A, is shown in Table 7.
Table 7: Comparison between ASHRAE 90.1-2010 and 189.1-2011 on thermal resistance ASHRAE 90.1-2010 ASHRAE 189.1-2011 Maximum U
{Btu/hr.ft2.F} Minimum R Maximum U
{Btu/hr.ft2.F} Minimum R
Exterior wall (steel framed) Roof Slab on grade (mass) Window Opaque door
0.124 0.063 0.322
1.20 (SHGC 0.25) 0.700
R-13 R-15 ci
NR -- --
0.077 0.048 0.730
1.20 (SHGC 0.25) 0.600
R-13 + R-6.5 ci R-20 ci
NR -- --
- Equipment loads
The energy consumption of interior lighting systems is defined by its lighting power density (LPD). There are two methods to calculate this allowance: the Building Area method, applied to the entire building, and the Space-to-Space method applied to specific spaces. The LPD values used in the Building Area method are shown in Table 8. Notice that the LPD values required by ASHRAE 189.1-2011 are 0.9 - 0.95 times as low as those of ASHRAE 90.1-2010, for the same building type.
Table 8: Comparison between ASHRAE 90.1-2010 and 189.1-2010 on Lighting Power Density and Equipment Power Density, using the Building Area Method
Lighting power density {watt/ft2} 90.1-2010 189.1-2011
Office School/University
Library Dormitory
Health-care clinic Hospital
1.0 1.2 1.3 1.0 1.0 1.2
0.95 1.08 1.24 0.95 0.95 1.14
ASHRAE 90.1-2010 does not state the plug loads, but the assumptions per equipment power density of 0.75 and 0.25 watt/ft2 for non-residential air-conditioned and semi-heated spaces, respectively, can be

67
used for energy modeling. These plug load values, however, are considered as general equipment loads for receptacle plug-in devices, such as appliances, office equipment (excluding elevators,) kitchen and laundry appliances
- Lighting
Spaces are assumed to be equipped with continuous daylight dimming. ASHRAE 90.1-2010 requires an illuminance threshold of 50 fc (500 lux,) measured at the working plane of 2.5 feet high. Meanwhile, a 75% coverage of the daylight area is required to meet an illuminance level of 30 fc (300lux) by ASHRAE 189.1-2011 (Table 9). These values should be obtained through measurement from either accurate physical models or daylighting simulations.
Table 9: Illuminance levels for daylighting requirements 90.1-2010 189.1-2011
50 fc (500 lux) for all spaces
30 fc (300 lux) for 75% coverage of the space
4.7.2 ASHRAE 62.1-2010
ASHRAE 62.1-2010 includes a section designating the minimum and recommended ventilation rates. The outdoor airflow Vbz, which is required for the breathing zone of occupiable spaces, is determined by the following formula:
where:
Az is zone floor area is the net occupiable floor area of the ventilation zone (ft2) Pp is zone population, or the number of people in the ventilation zone (person/ft2) Rp is the outdoor airflow rate required per person (cfm/person) Ra is outdoor airflow rate required per unit area (cfm/ft2)
The minimum airflow Rp and Ra are determined in Table 10, while Az and Pp can be used for the default occupant density.
Table 10: Minimum ventilation rates in the breathing zone for some activities from ASHRAE 62.1-2010111F
105
105 ANSI/ASHRAE, “ASHRAE Standard 62.1-2010: Ventilation for Acceptable Indoor Air Quality.”
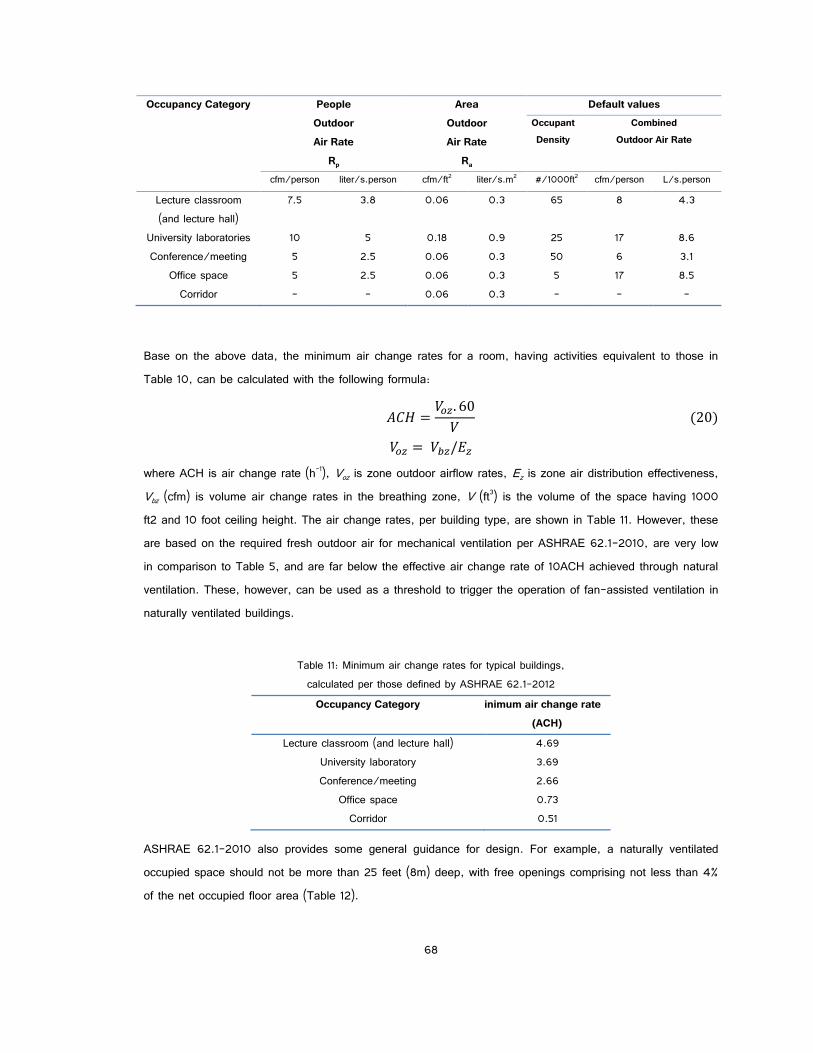
68
Occupancy Category People Outdoor Air Rate
Rp
Area Outdoor Air Rate
Ra
Default values Occupant Density
Combined Outdoor Air Rate
cfm/person liter/s.person cfm/ft2 liter/s.m2 #/1000ft2 cfm/person L/s.person Lecture classroom (and lecture hall)
7.5 3.8 0.06 0.3 65 8 4.3
University laboratories 10 5 0.18 0.9 25 17 8.6 Conference/meeting 5 2.5 0.06 0.3 50 6 3.1
Office space 5 2.5 0.06 0.3 5 17 8.5 Corridor - - 0.06 0.3 - - -
Base on the above data, the minimum air change rates for a room, having activities equivalent to those in Table 10, can be calculated with the following formula:
where ACH is air change rate (h-1), Voz is zone outdoor airflow rates, Ez is zone air distribution effectiveness, Vbz (cfm) is volume air change rates in the breathing zone, V (ft3) is the volume of the space having 1000 ft2 and 10 foot ceiling height. The air change rates, per building type, are shown in Table 11. However, these are based on the required fresh outdoor air for mechanical ventilation per ASHRAE 62.1-2010, are very low in comparison to Table 5, and are far below the effective air change rate of 10ACH achieved through natural ventilation. These, however, can be used as a threshold to trigger the operation of fan-assisted ventilation in naturally ventilated buildings.
Table 11: Minimum air change rates for typical buildings,
calculated per those defined by ASHRAE 62.1-2012 Occupancy Category Minimum air change rate
(ACH) Lecture classroom (and lecture hall) 4.69
University laboratory 3.69 Conference/meeting 2.66
Office space 0.73 Corridor 0.51
ASHRAE 62.1-2010 also provides some general guidance for design. For example, a naturally ventilated occupied space should not be more than 25 feet (8m) deep, with free openings comprising not less than 4% of the net occupied floor area (Table 12).

69
Table 12: Required design for natural ventilation from ASHRAE 62.1-2010112F
106
Single side opening L < 2H and L < 25ft (8m)
Location and opening size
- Direct ventilation:
Aw1 / A1 > 4%
- Indirect ventilation:
Aw2 / A2 > 8% or 25ft2 (2.3m2)
106 Ibid.

70
CHAPTER 5
CASE STUDY OF THE NATURAL VENTILATION DESIGN OF KUYKENDALL HALL, ON THE UNIVERSITY OF HAWAI‘I AT MĀNOA CAMPUS IN HONOLULU
5.1 Overview
This section investigates the natural ventilation research and design applied to the Kuykendall Hall renovation project (Fig. 58). It will be the first net-zero energy and purely-naturally ventilated campus building at University of Hawai‘i at Mānoa in Honolulu, as well as the first such institutional building in the entire state107. This case study allows for the investigation of actual design solutions, with special consideration applied to real-life contexts, especially in dealing with hot and humid climates. Specifically, it will further the research on ventilation design strategies and explore their application to other buildings of particular conditions.
Table 13: Kuykendall Hall retrofit project summary108 Location Building type(s) Construction Floor area Project scope Setting Climate Zone Expected energy savings Expected carbon dioxide emissions avoided Design completion date Construction completion date
Honolulu, Hawai‘i Higher Education, Classrooms and Offices Retrofit 86,492 ft2 (8,035 m2) Multiple buildings Urban ASHRAE Zone 1C, warm and humid -49% -380 m3/year Design stage completed in 2011 Not implemented
Figure 58: Existing and proposed design for Kuykendall Hall.
Sources: Ben Woo Architects
5.2 Site and context
Founded in 1907, the University of Hawai‘i at Mānoa (UHM) is the main campus of the state university system of Hawai‘i, one of the most culturally diverse places in the world. It hosts students, faculty and staff
107 The renovation of Kuykendall Hall was one of three the US. Department of Energy’s Commercial Building Partnership (CBP) projects to retrofit existing buildings to reduce energy consumption. Kuykendall Hall, located on University of Hawai‘i at Mānoa (UHM) cammpus in Honolulu, was the focus of a CBP ananlysis and design collaboration among the UHM, their consultants, and Lawrence Berkeley National Laboratory (LBNL). This analysis and design stage was completed in 2011 but the design have been implemented yet for some reasons. 108 U.S. Department of Energy, Achieving a Net Zero Energy Retrofit in a Humid, Temperate Climate - Lessons from the University of Hawai‘i at Mānoa.

71
from 108 countries. Approximately one mile from downtown Honolulu, the UHM campus spreads across 320-acres in Mānoa Valley.
5.3 Climatic condition
Hawai‘i is generally considered to have a tropical climate, with relatively high air temperature, humidity and precipitation levels. These conditions vary, however, relative to the diverse topographical conditions through the islands (Fig. 59). For example, UHM is located in Mānoa Valley, leeward of the Ko‘olau Mountain Range, where it receives above-average amounts of precipitation, thus resulting in higher humidity levels and lower temperature when compared to many other areas surrounding Honolulu.109
Figure 59: Historical temperature in Honolulu.
The mean maximum temperatures in the windward side (north east) of the Honolulu island are lower those that the leeward side consisting of Honolulu downtown area. Specifically, temperature at Mānoa Valley where UHM is located is
lower than that at the Honolulu International Airport.
109 “Weather and Climate.”

72
Figure 60: Maximum and Minimum Temperature of a typical year in Honolulu, Hawai‘i
based on TMY3 weather data measured at PHNL
Figure 61: Maximum and Minimum Relative Humidity of a typical year in Honolulu, Hawai‘i
based on TMY3 weather data measured at PHNL
The Typical Meteorological Year (TMY3) weather data at Honolulu International Airport (abbreviated as PHNL by the International Civil Aviation Organization) confirms a conservative temperature range throughout the year, with average maximums of 80-90F (27-32C) and average minimums of 65-75F (19-24C) shown in Figure 60, while relative humidity is rather high between 60-80% (Fig. 61). Temperatures vary slightly during a typical day, with an average diurnal range of about 10F. Moreover, detailed microclimatic analysis, based on data obtained from the weather station from 7/16/2011 - 8/3/2011 at the site, showed that the site drybulb temperature data at mid-day is about 7F lower than both PHNL’s actual data and PHNL’s

73
TMY3 weather data for the same time period (Fig. 62). As the result of cooler temperatures at mid-day, the relative humidity levels (RH) at the site are higher than those at the airport (Fig. 63).114F
110
Figure 62: Temperature comparison between site and PHNL
from 7/16/2011 – 8/3/2011.111
Figure 63: Relative humidity (RH) level comparison between site and PHNL
from 7/16/2011 – 8/3/2011.112
5.4 Building description
Kuykendall Hall (KUY) is an 86,492 square foot building consisting of two integrated structures: a four-story classroom building and a seven-story faculty office tower. Built in 1964, it was originally designed to utilize natural ventilation. Over time however, similar to the case of many other buildings on the campus, it was retrofitted and converted to mechanical cooling.
UHM has now stepped up its effort to become the institutional leader in environmental sustainability, by promoting sustainable practices throughout its campus115F
113 Recently, the university has adopted goals for overall reduction in campus energy levels of 50% by 2015, 25% renewable energy by 2020, and to become energy, water and waste independent by 2050.
110 Loisos + Ubbelohde, Site Collected Data Compared to Airport Data and TMY Data. 111 Ibid. 112 Ibid. 113 Group 70 International, Long Range Development Plan: University of Hawai‘i, Mānoa Campus 2007 Update.
Temp
eratu
re (
F)
Humi
dity (
%)

74
As part of its mission to achieve this goal, KUY was selected for the President’s Better Buildings Challenge program for renovation to be the first high-performance, energy independent institutional building in Hawai‘i. The design has been led by Ben Woo Architects of Honolulu, and the internationally-recognized sustainable architecture consulting firm of Loisos and Ubbelohde (L+U) of Alameda, California. It has also received technical inputs from experts at the Lawrence Berkeley National Laboratory (LBNL) and Center for the Built Environment at UC Berkeley.114
Based on a comprehensive study which used computer modeling and wind tunnel testing on building performance and human thermal comfort analysis, the design team decided to retrofit Kuykendall as a naturally ventilated building, to cut its energy usage by up to 80%, maximizing thermal comfort level as well as providing opportunities to produce renewable energy to achieve a net-zero energy objective. 116F
115
5.5 Design strategies
- Ventilation principles
Based on microclimate data from the local weather station, located on the Kuykendall rooftop, wind velocities at the building level do make cross ventilation feasible. With Its double row and the central single corridor layout, the cross ventilation for the classroom structure is based on having openings on two opposite façades, connected through lined ventilated ducts above the corridor. This strategy prevents indoor noise from transferring from one classroom to another via air pathways (Fig. 64).
(a) Three-dimensional natural ventilation strategy of the classroom building.
114 “UH Mānoa Partners with White House on Energy Savings for Hawai’i.” 115 The Office of the Assistant Vice Chancellor for Planning, “Kuykendall Hall: Renovation Project Update.”

75
(b) Cross section showing the natural ventilation strategy in which airflow travels through classrooms in the other side of
the building via ventilation ducts, avoiding noise from transferring from one classroom to others.
(c) Air movement from a wind tunnel study of the classroom structure. Figure 64: Cross ventilation design strategy for the classroom structure.
Source: Loisos+Ubbelohde ©
The office tower, however, features the much more complicated central double-corridor layout. To avoid internal noise traveling between adjacent offices, a three-inch ventilation gap between bookcases and partitions in each office unit serve toward noise attenuation (Fig. 65). Louver systems at the two ends of the corridors will be automatically regulated in order to provide sufficient wind-driven pressure and to induce air movement across office units.

76
(a) Cross-ventilation design strategy for the office tower
(b) Air movement from a wind tunnel study of airflow through three-inch ventilation gap in an office of the office tower.
Figure 65: Cross-ventilation design strategy for the office tower
Source: Loisos+Ubbelohde ©
The ventilation rate for this building has been projected to comprise 10 air changes per hour (ACH,) to minimize thermally uncomfortable hours. Any uncomfortable time will be offset by using ceiling fans to supplement air movement, in order to raise the thermal comfortable range for occupants in such naturally ventilated buildings.

77
- Solar shading
Solar shading was designed as an integral part of the building elements, with the following functions: heat gain mitigation, natural daylighting improvement, creation of firm structure and sufficient surface area to house photovoltaic panels for producing renewable energy, as well as for aesthetic reasons. The roofs of the two structures have been studied to determine the best placement for rooftop photovoltaic panels which, will also help to shade the top floors of the building.
Since the entire building runs in an east-west direction, the majority of its windows are located along the south and north facing façades. By using horizontal overhangs that are 2-3 feet in depth (Fig. 66), those windows can avoid low-angle direct sun beams while helping to diffuse indirect light deeper into the interior spaces.
Figure 66: 2-3 feet deep overhangs act as solar shading devices.
Source: Loisos+Ubbelohde ©
- Internal layout
Since the entire building runs along Correa Road in the east-west direction, thus avoiding solar heat gain, most classrooms and offices face the north or south direction, catching prevailing northeast wind for good cross ventilation. In addition, inherited from the existing structures, the classroom layout features a double-row and central single corridor with staircases at both ends, while the office tower has a central facility core enclosed by double corridors. These are not typical supporting layouts for naturally ventilated buildings (Fig. 67).

78
Figure 67: Typical layouts of the classroom structure and office tower.
- Dehumidification
To avoid microbial growth in naturally ventilated buildings, which can result from high humidity levels, a dehumidification system has been studied to lower the relative humidity level in spaces to below 60%, illustrated in Figure 68. The process shall operate four hours during night time when the building is sealed, to maintain an air temperature of 82F and 50% RH, to extract moisture content in the air and thus avoid mold development in building materials and other components.
Figure 68: Diagram of the dehumidification duct system. Source: Loisos+Ubbelohde ©
7-story Office Tower
4-story Classroom

79
Cost concerns and a feasibility study have led to the selection of an air-cooled dehumidification system, among other options such as desiccant dehumidification and water-cooled systems. Air cooled dehumidification systems such as those using compressor/air handlers and condensers will be located on the structures’ roofs and connected to buildings spaces through lined ventilated ducts and vertical shafts.
- Outdoor noise mitigation
Outdoor noise surrounding Kuykendall originates from traffic on Correa Road, air-conditioning equipment, exhaust stacks from adjacent buildings, periodic noise from construction work on the campus, and student activities at the Campus Center. An exterior ambient noise level of 67dbA, which was used in the acoustic study of the building, was based on measurements taken 50 feet from Kuykendall Hall.117F
116
The consultants of D.L. Adams and Associates, leading Kuykendall’s acoustical design, recommend that the interior noise criteria of classrooms and offices be between 50-55dbA. Integration between the wind tunnel study of air flow through window openings and the noise attenuation box (comprising attached acoustical chambers,) as well as a full acoustical simulation, helped to determine the optimal size for all openings and the configuration of noise attenuation boxes, in order to compromise between acoustical transmission loss and airflow resistance of the acoustical chambers (Fig. 69).
Figure 69: Outdoor noise mitigation integrated into natural ventilation design Acoustical fiberglass liners incorporated into the window systems as noise attenuation chambers.
Source: Loisos+Ubbelohde ©
116 D. L. Adams Associations, Acoustical Modeling for Naturally Ventilated Core Learning Spaces.
ACOUSTICAL CHAMBER WITH ACOUSTICAL LOUVER
ACOUSTICAL CHAMBER WITH FULL COVERAGE ACOUSTICAL FIBERGLASS LINER
3 IN. THICK 3.O LB/FT3 FIBERGLASS

80
CHAPTER 6
OPTIMIZATION OF NATURAL VENTILATION DESIGNS FOR RETROFITTING EXISTING BUILDINGS
ON THE UNIVERSITY OF HAWAI‘I AT MĀNOA CAMPUS IN HONOLULU
6.1 Optimization of natural ventilation design for the Hawai‘i Institute of Geophysics (HIG)
building on the UH Mānoa campus in Honolulu
6.1.1 Introduction
With the “cross ventilation” natural ventilation strategy proposed for the Kuykendall Hall (KUY) project, it is very important to consider the actual free area of the ventilation ducts and ventilation windows, when acoustical louvers and insect screens are in place. Depending on the required noise reduction (NR) level of the louvers and configuration of the screens to be used, these components could significantly decrease airflow through the ventilation openings. For example, a 16 mesh 30 gauge wire screen reduces the total from about 60% to 50% when wind speeds are respectively 1.5 and 2 mph, and even further, to only 25% when the wind speed is 10 mph.118F
117
Moreover, in architectural design, the ventilation ducts and the lower ventilation windows (in terms of shapes and sizes) play a big role on the design of building façades. Especially in the existing building retrofit, the size and location of ventilation ducts and lower window openings are very constrained. They also affect the design of daylighting performance.
Optimizing the size of both the ventilation ducts and the lower ventilation windows will then not only aim to achieve thermal comfort, at the level of the reasonable numbers of discomfort hours, but also to compromise the architectural restriction of leaving room for installing acoustical louvers to mitigate outdoor noise traveling into occupied spaces.
In addition to determining the optimal size for ventilation ducts and lower ventilation windows, knowing the numbers of discomfort hours, predicting mold growth and identifying when these conditions happen over the course of a year, will help in setting up the backup mechanical ventilation (e.g. fan-assisted) and dehumidification systems, in terms of configuration, capacity, and operation schedule.
117 Givoni, Man, Climate and Architecture. p.304.

81
6.1.2 Objectives The HIG building was chosen for this pilot study so as to optimize the performance of three natural ventilation design schemes: the cross ventilation approach which was adopted from the original approach which had applied for the KUY project and discussed in the Chapter 5, and two combined ventilation approaches (the original approach with the supplement of ventilation shafts).
The study aims to:
(1) Optimize the sizes of ventilation ducts and ventilation windows for low number of discomfort hours. (2) Compute the corresponding number of discomfort hours as well as specific times during the course
of a year, resulting in the backup operation of the ceiling fans and/or mechanical ventilation. (3) Compute the corresponding number of hours as well as specific times during the course of a year,
regarding to the indoor conditions, at which mold is predicted, to develop inside the building materials.
(4) Understand how a complex natural ventilation approach can be enhanced to the overall natural ventilation performance of the building.
6.1.3 Location and weather data
Honolulu is classified as Climatic Zone 1A, a hot and humid climate by the standard ASHRAE 90.1. The closest national weather station to the site is located at PHNL, which is 5 miles away from UHM campus (Fig.70).
Figure 70: Climate Zone Map.
Source: U.S. Department of Energy

82
The analysis of TMY3 weather data from PHNL, using adaptive thermal criteria ASHRAE 55-2010, confirms that it is hot in the summer (when the maximum temperatures are around 80-85F and rarely reach up to 90F) and cool in the winter (when the minimum temperatures can be as low as 65F). Temperatures are very favorable for most of the year, however, and therefore meet the 80% adaptive thermal acceptance criteria (Fig. 71). The relative humidity levels are quite stable, meanwhile; within 50-60% during daytime and 70-90% during nighttime, when temperatures are lower (Fig. 72).
Figure 71: Environmental drybulb temperatures and relative humidity levels, in comparison with adaptive thermal comfort ranges, obtained from TMY3 weather data at PHNL
(This chart type is adopted from works of Loisos+Ubbelohde ©)
Figure 72: Environmental relative humidity levels obtained from TMY3 weather data at PHNL
RH 80% 70% 60% 50%

83
Located within the Mānoa Valley region, the UHM campus encounters cool and humid air from the windward side of the island. A comparison of weather data collected from KUY weather station and TMY3 data from PHNL indicates that KUY temperature readings are more conservative than those found in PHNL weather data. In other words, temperatures at the building site, especially in the summer, are 3-6F lower in the daytime, yet higher than that during nighttime at PHNL (Fig. 73).
Figure 73: Temperature difference between KUY and PHNL
Figure 74: Wind speeds and directions obtained from TMY3 weather data at PHNL
(This chart type is adopted from works of Loisos+Ubbelohde ©)
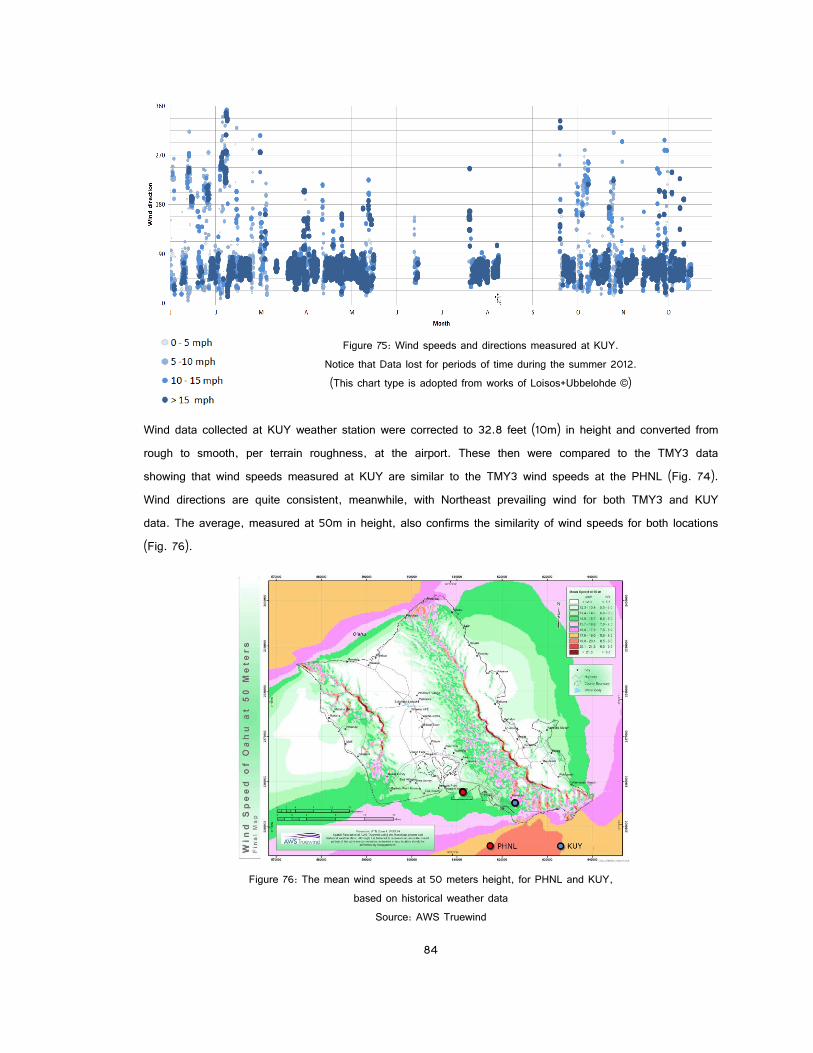
84
Figure 75: Wind speeds and directions measured at KUY.
Notice that Data lost for periods of time during the summer 2012. (This chart type is adopted from works of Loisos+Ubbelohde ©)
Wind data collected at KUY weather station were corrected to 32.8 feet (10m) in height and converted from rough to smooth, per terrain roughness, at the airport. These then were compared to the TMY3 data showing that wind speeds measured at KUY are similar to the TMY3 wind speeds at the PHNL (Fig. 74). Wind directions are quite consistent, meanwhile, with Northeast prevailing wind for both TMY3 and KUY data. The average, measured at 50m in height, also confirms the similarity of wind speeds for both locations (Fig. 76).
Figure 76: The mean wind speeds at 50 meters height, for PHNL and KUY,
based on historical weather data Source: AWS Truewind

85
It has been noted that data collected at KUY’s weather station was lost for periods of time during the summer 2012 (Fig. 75). Therefore, this study used data combined from the TMY3 and the updated temperatures and relative humidity, as measured at KUY and applied for HIG where these two buildings are located close to each other and share a similar terrain roughness. The terrain roughness conditions of the UHM campus and PHNL are different, however, and shall be corrected when applying TMY3 data’s wind speeds for the simulation.
6.2 Building case description
Figure 77: 3D views of the HIG and adjacent buildings
The Hawai‘i Institute Geophysics (HIG) building was built in 1963. It has three parts: the main Laboratory Building, the Office Wing and the Shop Wing; the wings connected to the Lab through hallways (Fig. 77). With approximate 126,708 square feet of floor area, the building contains offices, laboratories, classrooms and a lecture hall – spaces which have been occupied by the School of Ocean and Earth Science and
Laboratory Office
Shop
HIG building KUY weather station

86
Technologies (SOEST), the National Oceanic and Atmospheric Administration (NOAA), the National Weather Service (NWS), the Weather Forecast Office (WFO), and the Honolulu and Central Pacific Hurricane Center (CPHC).119F
118
The Laboratory Building is a four-story elongated structure, running along north-south direction, with a penthouse consisting of offices, classrooms, laboratories, mechanical corridors, utility rooms, as well as a lecture hall on the first floor. A single, central service shaft runs along the main building, is covered with perforated metal sheets for use as a service platform (Fig. 78a). The Shop Wing is a three story building consisting of a machine shop and offices in the first floor. The NWS offices on the second floor, excluded from this study, comprise offices and laboratories on the third floor. The Office Wing consists only of conference rooms and administrative offices.120F
119
The building is equipped with a central air-conditioning system, serving most parts of the Shop Wing and some parts of the Laboratory Building. The majority of offices, classrooms and laboratories there currently use air-conditioner window units. The Office Wing is air-conditioned by window-unit only.121
120 Most such units are inserted into glass louver clerestories, which were intended for natural ventilation and are now either sealed or replaced entirely with glazing panel windows (Fig. 78b). These single pane windows and glass louvers have low thermal resistance and are also not fully sealed; conditions that have contributed to cooling-leakage and thus increased the energy consumption of the building.
(a) (b)
Figure 78: Laboratory Building of the HIG (a) Service shaft in the Laboratory building. (b) Window units placed into the louver windows.
118 Chong, Benchmarking Study. 119 Ibid. 120 Ibid.

87
6.3 Methods
This study used EnergyPlus, the most advanced and validated building energy simulation application to simulate the performance of three proposed natural ventilation designs, which are compliant with the energy standard ASHRAE 90.1-2010 and high performance non-residential building ASHRAE 189.1-2011. The sequence of pre-simulation, from validating the baseline to modeling the proposed energy models, as well as post-simulation results, is illustrated as the following diagram (Fig. 79):
Figure 79: Simulation process diagram
Proposed energy models
Parametric Energy Models Airflow Network
EnergyPlus
Pressure coefficients CFD Local weather data
Energy consumption
Mold development MOIST
Fan-assisted ventilation schedule
Dehumidification schedule
189.1 model
90.1 model
Natural ventilation design schemes
Baseline Existing building
Optimal thermal comfort,
ventilation duct sizes, ventilation window sizes
Note: These final calculations have not been included in the study yet

88
6.3.1 Pre-simulation
6.3.1.1 Pressure coefficient
Pressure coefficients, representing the distribution of wind pressure on the building’s surfaces, were influenced by many parameters, such as building geometry, site condition, obstacles, wind speeds and wind directions. They are required to feed into AN building energy models, to study natural ventilation. Pressure coefficients are mostly obtained by undertaking wind tunnel tests for higher accuracy or can be predicted by using computational fluid dynamic (CFD) techniques.
Pressure coefficient is a dimensionless number which describes the relative pressure distribution over a fluid field in aerodynamics and hydrodynamics. In the study of the flow of compressible fluids such as water, the pressure coefficient is defined by the following formula:
where P is the local pressure at the point at the point of interest; Po is the reference pressure; Pd is the dynamic pressure; and V is the freestream fluid density and velocity.
This formula is also applicable in the study of low-speed incompressible fluids such as air having its velocity lower than 0.3 Mach number (Mach). However, when using this formula for air exceeding 0.3 Mach or high-speed flow of compressible fluids, the high compressibility of the fluids increases the magnitude of the pressure coefficients resulting in dynamic pressure Pd no longer correctly represents the relationship between dynamic pressure, static pressure and stagnation pressure. In this case, the pressure coefficient of high-speed air and compressible flow can be found from incompressible flow formula and corrected by the using Prandl-Glauert rule:
where Cp is the compressible pressure coefficient; Cpo is the incompressible pressure coefficient and M is the Mach number between 0.3 to 0.7 Mach.
6.3.1.2 Pressure coefficient calculation with Flow Designer CFD
The CFD application called Flow Designer by Advanced Knowledge Laboratory (AKL) is used in this study for its low required-learning curve as well as its flexible modeling capacity to reduce the modeling time. For example, Flow Designer allows for importing variety of CAD format files such as Industry Foundation Classes (IFC), Standard Tessellation Language (STL) and SketchUp files. However, Flow Designer is limited in the availability of different discretization schemes, turbulence models and shortage of available supporting documents.

89
Unlike other CFD softwares allows for different discretization scheme such as structured grids and unstructured grids, Flow Designer is capable to simply structured grid construction which is limited in using orthogonal system control volume method. All grid lines must be parallel with the Cartesian grids. In order to construct airflow domain around HIG building and adjacent buildings, all grid lines’ spaces are used as non-uniformity with their increments of cells’ aspect ratio less than 20% resulting in 5,365,072 (x=244; y=239; z=92) cells (Fig. 80).
Figure 80: Structured grid construction of the HIG and adjacent buildings in Flow Designer
The standard K-Ɛ turbulence model was used. The site roughness condition was assumed as urban city. The pressure coefficients were predicted by calculating the static pressure at given points on the HIG building facades at given wind directions. The convergence criterion was set with the convergence requirement of -3 and the maximum iterations of 50. The calculated static pressures then were applied into the equation 21 by substituting with the appropriate terms:
where Px is the static pressure at a given point on the building façade (Pa), Po is the static reference pressure (Pa) and Pd is the dynamic pressure (Pa), is the air density (0.074lb/ft3 or 1.183kg/m3) and vh is the wind speed, which is often taken at building height h in the upstream undisturbed flow (m/s).122F
121 Px values were obtained from CFD simulation (Fig. 81 and 82). Po is the mean value of all static pressures at all patches. The air density is assumed as 0.074lb/ft3 (1.183kg/m3).
121 Liddament, A Guide to Energy Efficient Ventilation.

90
The reference wind speed is the average wind speed, based on the weather data collected at the airport’s meteorological station. Uh was corrected at the height as high as the building height by using the EnergyPlus Engineering Document’s formula:
where vref is 11.2mph (5m/s), href is 32.8 feet (10m), hz is 82 feet (25m), is 0.33 (terrain exponent for city category).
All façades of the Lab building of the HIG were divided into smaller patches, which are illustrated as the Figure 83. The distribution of pressure coefficients on those patches, which were calculated at every 22.4 degree wind direction, is shown in Appendix C. Figures 84, 85, 86 and 87 present the predicted pressure coefficients of the Lab building’s surfaces located at four cardinal orientations.
Figure 81: CFD simulation of airflow around the HIG and adjacent buildings
at the prevailing wind directions (North East)

91
Figure 82: Static pressure differentiates, at building surfaces of the HIG and adjacent buildings.
The simulation was done with the prevailing wind direction (Northeast)
Figure 83: Sub-divisional Lab building façades for average-pressure coefficients calculation

92
Figure 84: The predicted pressure coefficients of the Lab building’s North facing surfaces according to every 22.5 degree wind directions
Figure 85: The predicted pressure coefficients of the Lab building’s South facing surfaces
according to every 22.5 degree wind directions

93
Figure 86: The predicted pressure coefficients of the Lab building’s West facing surfaces
according to every 22.5 degree wind directions
Figure 87: The predicted pressure coefficients of the Lab building’s East facing surfaces
according to every 22.5 degree wind directions

94
6.3.1.3 Baseline
Baseline model was derived from building information from the 3D Revit files obtained from the Environmental Research and Design Lab (ERDL) at the School of Architecture, UHM. The information regarding existing building envelopes, internal layouts and occupancy was verified and updated by the Environmental Research and Design Laboratory (ERDL) of the School of Architecture, UHM.
Figure 88: Program layout of the HIG’s 2nd floor
- Thermal zones
The thermal zones of the baseline were classified according to their occupancy types, and were consolidated into five different, simplified groups: office (offices and office services), lab (laboratories, lab services, shops and shop services), classroom, utility (restrooms, mechanical rooms) and circulation (closured hallways in the penthouse) (Fig. 88). Adjacent rooms which share similar occupancy types were consolidated into a single, combined thermal zone. Since excluded from this study, the NWS offices on the second floor of the Shop wing were not modeled herein as thermal zones. Their exterior walls, however, were modeled as surfaces of shading devices (Fig. 89).

95
Figure 89: 3D geometry of the energy model, modeled with OpenStudio Sketchup for EnergyPlus
- Construction:
Table 14: Construction of the existing building
The HIG building is a prefabricated, reinforced concrete structure comprising slabs, columns, and non load-bearing CMU walls. All window systems feature single-glazed panes with aluminum frames. Construction material specifications are described in Table 14.

96
- Schedules:
The class and lab schedule here was adopted from a typical one from the school template’s EnergyPlus. During summer sections, the occupancy was presumed to be reduced up to 50% from that during the fall and spring semesters. The office schedule comes from the office template’s EnergyPlus. Utilities and mechanical spaces have the same schedule as the offices (Table 15).
Table 15: Class/office occupancy, lighting and equipment schedules

97
Class/office occupancy, lighting and equipment schedules (continued)

98
- Infiltration
Zone infiltration is the amount of unintended outdoor air flowing into thermal zones through cracks around doors and windows as well as, when they are closed or opened. It is also caused by the indoor and outdoor temperature difference and the wind speed. 123F
122 Zone infiltration is an important factor that affects the cooling loads of the baseline. Its levels were set, based on commercial reference buildings featuring as pre-1980 existing construction for medium offices in the Climate Zone 1A. 124F
123
- Internal loads
Internal loads consist of occupant density, lighting power density and equipment power density (plug load). The occupant density was obtained from the default values in the ASHRAE 62.1-2010, while lighting power density and plug load are referred to commercial reference buildings featuring as pre-1980 construction for medium offices in the Climate Zone 1A.125F
124 (Table 16)
Table 16: Occupant density, lighting power density, equipment power density, cooling setpoints
- Heating, Ventilation and Air-Conditioning (HVAC) System
The current HVAC system of the building is quite complicated, comprising a central air-conditioning system and window units. Since the focus of this study is natural ventilation, rather than air-conditioning, HVAC was modeled in the EnergyPlus as HVACTemplate:Zone:IdealLoadsAirSystem instead of a detailed HVAC system. HVACTemplate:Zone:IdealLoadsAirSystem is often used for the early stage of the analysis since it only presents an ideal HVAC system.
An ideal HVAC system consumes no energy, and yet can deliver conditioned air to zones that meet required cooling and heating loads.126F
125 However, a typical HVAC, depending on types, could use up from 25-45% its
122 “The Encyclopedic Reference to EnergyPlus Input and Output.” 123 These commercial reference buildings, which were developed by U.S. Department of Energy, present for approximately 70% of the commercial buildings in the U.S, categorized into new construction, post-1980 existing construction and pre-1980 existing construction. 124 Ibid. 125 Ibid.

99
total load for running all kinds of fans and pumps. These may include: supply and return fans of air-handling units, exhaust fans, condenser fans, cooling tower fans, heating water pumps, condenser water and chilled water pumps.127F
126 Therefore, a component called HVAC factor, which is proportional to the summed cooling
load, was used to account for energy consumed by the system.
6.3.1.4 Validating the baseline
Table 17: Monthly energy consumption comparison, between the meter data from the actual HIG building and predicted energy consumption from the baseline model. The
baseline model was also simulated using both KUY and PHNL weather data for comparison.
The baseline model validation was based on monthly total-building energy consumption from meter data obtained from UHM Facilities Department, which was collected for an 18 month period between July 2011 and December 2012. This data was used to compare with the predicted monthly energy consumption from the energy model. The comparison resulted in the adjustment on the following parameters: UHM’s academic calendar, infiltration levels and ventilation rates from reference pre-1980 commercial buildings and the HVAC factor.
The baseline was simulated using both TMY3 weather data from PHNL and weather data collected at KUY weather station. The monthly building energy consumption comparison was indicated in Table 17. It clearly shows that the meter data is higher than was predicted in April, and reversibly lower from August to October,
126 Westphalen and Koszalinski, Energy Consumption Characteristics of Commercial Building HVAC Systems Volume II : Thermal Distribution , Auxiliary Equipment , and Ventilation.

100
meanwhile the monthly predicted data and meter data are quite close for other months. In addition, building energy consumption is slightly higher, especially in summer, when using PHNL weather data, since the UHM campus is likely cooler than that at the airport.
6.3.1.5 The 90.1 and 189.1 models
The 90.1 and 189.1 models, which are compliant with the standard ASHRAE 90.1-2010 and ASHRAE 189.1-2011 respectively, were adopted from the baseline in terms of the original envelope, increasing the window-to-wall ratio to 40% and adding shading devices on the west façade to block low-angle sun in the late afternoon. Both models were constructed with the infiltration rates based on the reference commercial building compliant to ASHRAE 90.1-2010, and the ventilation rates (outdoor air ventilation provided by mechanical ventilation) based on the minimums from ASHRAE 62.1-2010 (Table 18). Plug loads were not defined in the ASHRAE 90.1-2010, however, were recommended as 0.75w/ft2 for energy modeling.
Table 18: Building requirements, per space activity, used in the 90.1 and 189.1 models according to the relevant ASHRAE Standards for The climate zone 1A.
The difference between the 90.1 and 189.1 models is revealed by the lighting power densities, in which those of the 189.1 model were slightly smaller than those of the 90.1 (Table 18). Both 90.1 and 189.1 models have lighting controls in most of the spaces. The 189.1 model sets the illuminance setpoint at the 2’-6” (0.8m) at 35fc (350lux,) covering for 75% of the spaces, while the 90.1 model sets the illuminance setpoint up to 50fc (500lux). The relationship among the baseline, 90.1, 189.1 and proposed models is shown in the Figure 90.

101
Figure 90: The relationship between the baseline, 90.1, 189.1 and the proposed design models
6.3.1.6 Monthly energy consumption comparison between the baseline, 90.1 and 189.1 models
Figure 91: Predicted monthly energy consumption comparison between the baseline vs. the 90.1 and 189.1 models

102
To be convenient for energy comparison, the baseline, 90.1 and 189.1 models were simulated using TMY3 weather data from PHNL. The predicted monthly energy consumption (Fig. 91) shows that the 90.1 model consumes only 60% of that consumed by the baseline. It demonstrates that by improving the building construction so that it is compliant to ASHRAE 90.1-2010 and considering the building’s airtightness, we can reduce from 30-40% energy consumption. The break-down energy consumption into building system categories in Figure 92 confirms a large amount of energy consumed by the building for cooling. By using the energy-efficient HVAC system, the building can reduce a significant amount of energy use.
Figure 92: Predicted monthly break-down energy consumption comparison between the baseline vs. the 90.1 and 189.1
models
6.4 Natural ventilation design optimization
To secure thermal comfort for the HIG building, natural ventilation was introduced. The study proposed three natural ventilation design schemes for the HIG building, particularly focusing on the Laboratory block, and both predicted and optimized the performance of the proposed natural ventilation design schemes, using Airflow Network (AN), coupled with the building energy simulation application called EnergyPlus.
The study focused on two groups: the lab and the office. The lab group, comprising room 105 and 107, is located at the southeast and southwest corners of the first floor. These locations are seen as disadvantageous for being at the end of the local prevailing wind. The office group, comprising rooms 205, 206-207 (a single space previously consolidated from two rooms, i.e., 206 and 207) and 211-212-213 (a single space consolidated from what were formerly three rooms, 211, 212 and 213) is located in the second

103
floor, and faces east and west respectively. Room 205 and 206-207 also happen to be in a so-called ‘dead spot’, where the prevailing wind is blocked by the Shop wing and Office wing (Fig. 93).
Figure 93: The focus area for the AN model

104
6.4.1 Natural Ventilation Design Scheme 1
Figure 94: Natural Ventilation Design Scheme 1
Natural Ventilation Scheme 1 is adopted from the “cross-ventilation” approach for the Kuykendall Hall renovation project. Flowing through the ventilation window into the occupied spaces, outdoor air then moves through the ventilation ducts set above the single central corridor and occupied spaces located at the other side of the building. Similarly, in ventilating the occupied spaces on the other side of the building, outdoor air also flows through the opposite ventilation ducts, then circulates inside the occupied spaces before being exhausted out of the ventilation windows at the other side of the building façade (Fig. 94). This reversible configuration accommodates any time the wind direction may change, throughout the course of a year.

105
6.4.2 Natural Ventilation Design Scheme 2
Figure 95: Natural Ventilation Design Scheme 2
Natural Ventilation Design Scheme 2 is a combined ventilation approach, which attempts to utilize the wind tower effect to assist the cross ventilation (Fig. 95). Similar to Scheme 1, outdoor air flows into occupied spaces through the ventilation windows, ventilation ducts and additional openings connected to the mechanical corridor, where airflow is driven by the combined wind pressure and stack effect. Wind pressure is caused by wind-driven pressure difference at the intake and outtake openings, which are located atop each of the two ventilation shafts. The stack effect, meanwhile, is driven by the air density difference that results from a temperature difference between the hotter air in the thermal zone and cooler air at the ventilation shaft openings. The performance of Scheme 2 is quite complex and makes it possible to have

106
reversible airflow inside the ventilation shaft due to the combination of wind-driven pressure and buoyancy-driven force.
6.4.3 Natural Ventilation Design Scheme 3
Figure 96: Natural Ventilation Scheme 3
Natural Ventilation Design Scheme 3 is similar to Scheme 2, except that it replaces two ventilation shafts (those located at opposite ends of the mechanical corridor) with individually vertical ventilation shafts located inside the central mechanical corridor opened up to the roof (Fig. 96). This scheme incorporates the existing

107
condition of the Laboratory building, which is unique in comparison to other parts of HIG and other UHM campus buildings, whereby the central mechanical corridors are open all the way up to the roof, thereby allowing ventilation ducts to draw stale air from occupied spaces and exhaust it out of the outlet openings at the roof.
6.5 Results
The energy models herein were modeled with an assumption that there was not yet any restriction imposed by the architectural features of the existing building façades. To avoid having too-low ceilings, caused by ventilation ducts set over the occupied spaces, the ducts were modeled with the cross section to be set at a 2 foot height, with the maximum widths as wide as a half-width of the space. The ventilation windows, meanwhile, were also set at a 2 foot height, with the maximum width as wide as the space’s entire width (Appendix D).
The widths of both ventilation ducts and ventilation windows were considered as two variables, which were set at 0%, 12.5%, 25%, 50%, 75% and 100% of the original sizes. These generated 36 different variations, which resulted in modeling 36 different energy models for each natural ventilation design scheme. The models then were simulated with corrected TMY3 weather data that comprised weather data from PHNL, but with the temperature measured at KUY weather station on the UHM campus.
The adaptive thermal comfort from the standard ASHRAE 55-2010, which has been applied for natural ventilation, was used as the main objective for the optimization. Discomfort hours were counted whenever the thermal condition went outside of the 80% thermal “acceptability” range12
127 per adaptive thermal comfort, over the total annual occupied hours (which count 4881 hours/year for offices and 3210 hours/year for labs). The results from the simulation of energy models for each natural ventilation design scheme are presented in the following sections.
6.5.1 Natural Ventilation Design Scheme 1
The AN model diagram and three-dimensional geometry of the energy model of Natural Ventilation Design Scheme 1 is illustrated in Figures 97 and 98. The result of the simulation, shown as chart form in Figure 99, 100, 101 and 102 while the data in table form can be found at Appendix E, can be highlighted as follows:
- When ventilation windows are completely closed (with the lower ventilation windows’ free areas at 0%), regardless of the ventilation ducts’ sizes, the number of discomfort hours is very high for any offices and labs, resulting from the inadequacy of single-sized ventilation to deliver enough cooler outdoor air into the occupied spaces. However, when both the ventilation windows and ventilation ducts are opened (with the
127 Dear and Brager, “Thermal Comfort in Naturally Ventilated Buildings: Revisions to ASHRAE Standard 55.”

108
ventilation windows’ and ventilation ducts’ free areas increased from 12.5% - 100%) to allow for cross-ventilation inside occupied spaces, discomfort hours starts to drop, especially when the ventilation ducts’ free area is as high as 25% (0.25).
- To achieve the minimum number of discomfort hours per annual occupied hours (as low as 50), ventilation windows and ventilation ducts should increase their free areas to as high as 50% (0.50). For lab 107 though, this target would not be achieved unless the free areas of the ventilation windows are set at the minimum of 75% (0.75) with the ventilation ducts set at 100% (1.00).
(a) AN diagram of room #105 and #107

109
(b) AN diagram of room #205, #206-206 and #211-212-213
Figure 97: AN diagram of Natural Ventilation Design Scheme 1

110
Natural Ventilation Design Scheme 1 Three-dimensional geometry (Sketchup model) of the energy model
Figure 98: Three-dimensional geometry (Sketchup model) of the energy model for the Natural Ventilation Scheme 1

111
Natural Ventilation Design Scheme 1 Discomfort hours (during annual occupied office hours) of the office group
(#205, #206-207 and #211-212-213) per variations in the free areas of ventilation windows and ventilation ducts
Figure 99: Discomfort hours (during annual occupied office hours)
Discomfort hours (during annual occupied office hours) per variations among the free areas of ventilation ducts and ventilation windows (Fig. 99), given as a ’percentage of ventilation ducts’ and ventilation windows openings to full free areas’ per the office group (#1205, #206-207, #211-212-213). For better readability, the close-up chart (Fig.100) removes the data of the ventilation windows having their percentage to full free areas of 0, 0.75 and 1.0.

112
Natural Ventilation Design Scheme 1 Close-up chart of discomfort hours (during annual occupied office hours) of the office group
(#205, #206-207 and #211-212-213) per variations in the free areas of ventilation windows and ventilation ducts
Figure 100: Close-up chart of discomfort hours (during annual occupied office hours)
For better readability, this close-up chart only shows the data of the ventilation windows having their
percentage to full free areas of 0.125, 0.25 and 0.5.
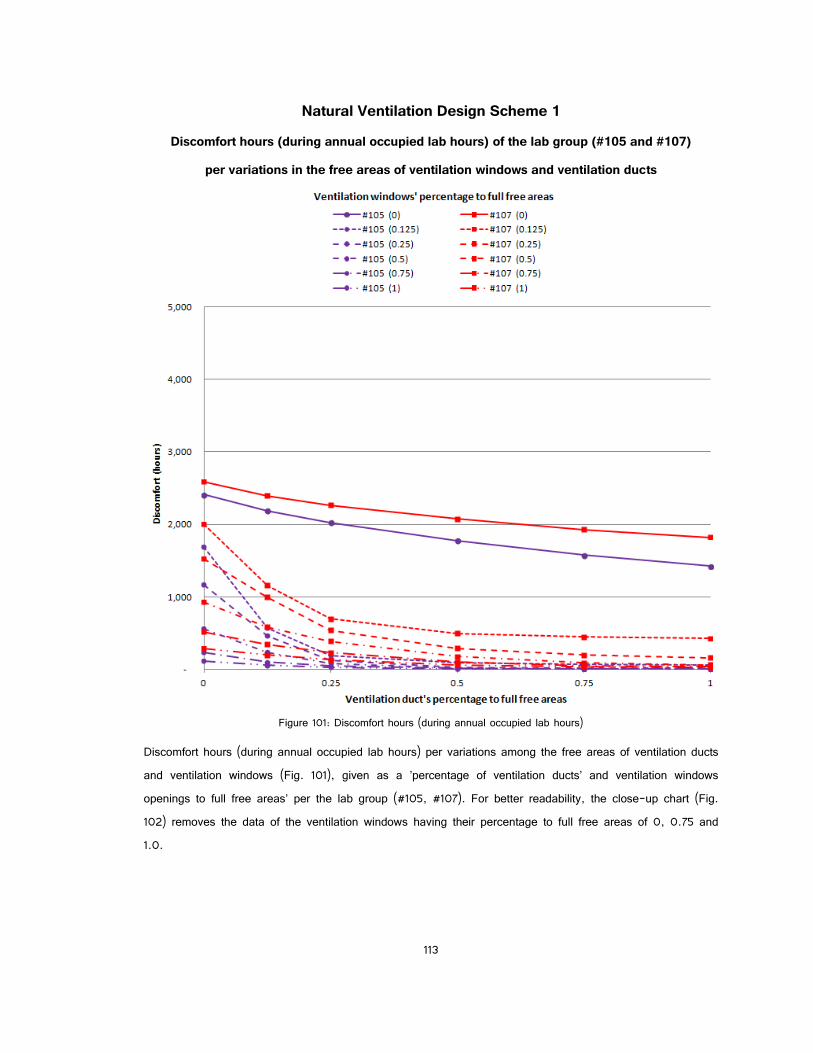
113
Natural Ventilation Design Scheme 1 Discomfort hours (during annual occupied lab hours) of the lab group (#105 and #107)
per variations in the free areas of ventilation windows and ventilation ducts
Figure 101: Discomfort hours (during annual occupied lab hours)
Discomfort hours (during annual occupied lab hours) per variations among the free areas of ventilation ducts and ventilation windows (Fig. 101), given as a ’percentage of ventilation ducts’ and ventilation windows openings to full free areas’ per the lab group (#105, #107). For better readability, the close-up chart (Fig. 102) removes the data of the ventilation windows having their percentage to full free areas of 0, 0.75 and 1.0.

114
Natural Ventilation Design Scheme 1 Close-up chart of discomfort hours (during annual occupied lab hours) of the lab group
(#105 and #107) per variations in the free areas of ventilation windows and ventilation ducts
Figure 102: Discomfort hours (during annual occupied lab hours)
For better readability, this close-up chart only shows the data of the ventilation windows having their
percentage to full free areas of 0.125, 0.25 and 0.5.

115
6.5.2 Natural Ventilation Design Scheme 2
The AN model diagram and three-dimensional geometry of the energy model of Natural Ventilation Design Scheme 2 is illustrated in Figures 103 and 104. The result of the simulation, shown as chart form in Figures 105, 106, 107 and 108 while the data in table form can be found at Appendix F, can be highlighted as follows:
- The two ventilation shafts significantly contribute to the overall thermal performance of this natural ventilation scheme. The free areas of both the ventilation windows and ventilation ducts should be sized at 12.5% (0.125) to minimize the discomfort hour target to 50 hours (about 1% of annual occupied office hours).
- With some contribution to the airflow coming from two additional ventilation shafts, an increase of higher than 12.5% in free areas of ventilation ducts and ventilation windows does not enhance the thermal comfort of the occupied spaces. Discomfort hours do not decline when free areas are increased from 25% to 100%. In fact, similar to Scheme 1, office discomfort hours slightly increase if the free areas of ventilation ducts and ventilation windows are equal to or greater than 25%.
(a) AN diagram of room #105 and #107
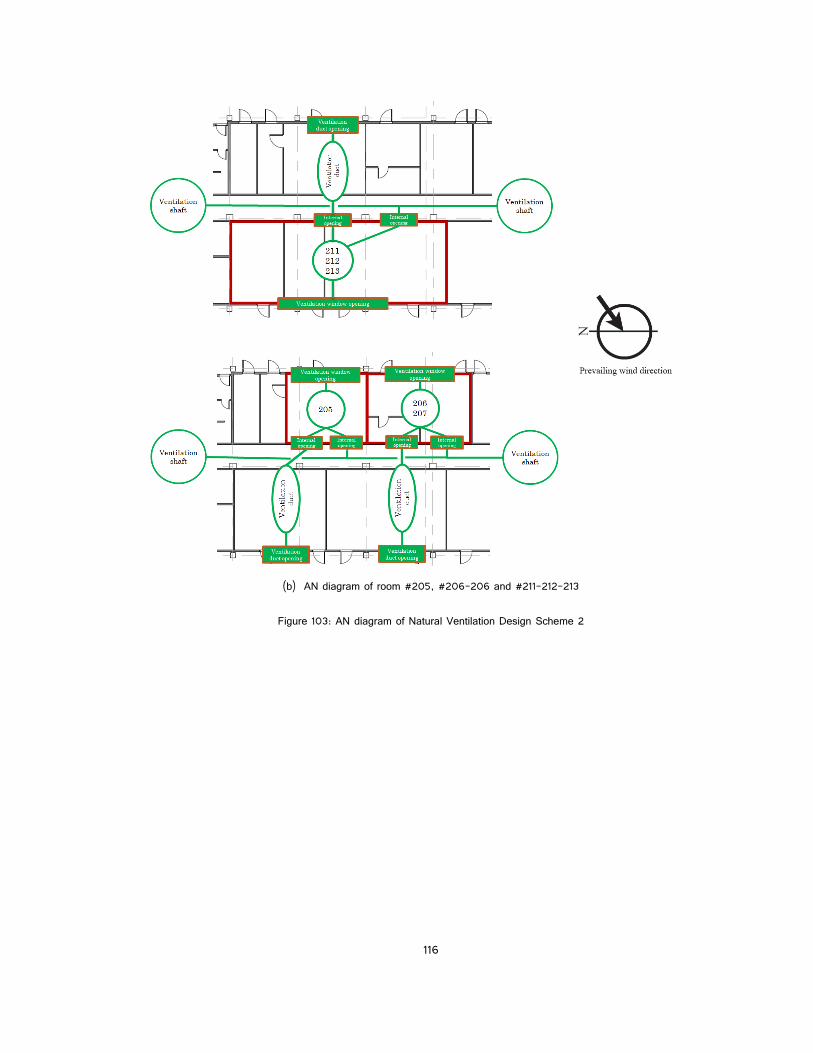
116
(b) AN diagram of room #205, #206-206 and #211-212-213
Figure 103: AN diagram of Natural Ventilation Design Scheme 2

117
Natural Ventilation Design Scheme 2 Three-dimensional geometry (Sketchup model) of the energy model
Figure 104: Three-dimensional geometry (Sketchup model) of the energy model for the Natural Ventilation Scheme 2

118
Natural Ventilation Design Scheme 2 Discomfort hours (during annual occupied office hours) of the office group
(#205, #206-207 and #211-212-213) per variations in the free areas of ventilation windows and ventilation ducts
Figure 105: Discomfort hours (during annual occupied office hours)
Discomfort hours (during annual occupied office hours) per variations among the free areas of ventilation ducts and ventilation windows (Fig. 105), given as a ’percentage of ventilation ducts’ and ventilation windows openings to full free areas’ per the office group (#1205, #206-207, #211-212-213). For better readability, the close-up chart (Fig.106) removes the data of the ventilation windows having their percentage to full free areas of 0, 0.75 and 1.0.

119
Natural Ventilation Design Scheme 2 Close-up chart of discomfort hours (during annual occupied office hours) of the office group
(#205, #206-207 and #211-212-213) per variations in the free areas of ventilation windows and ventilation ducts
Figure 106: Close-up chart of discomfort hours (during annual occupied office hours)
For better readability, this close-up chart only shows the data of the ventilation windows having their
percentage to full free areas of 0.125, 0.25 and 0.5.

120
Natural Ventilation Design Scheme 2
Discomfort hours (during annual occupied lab hours) of the lab group (#105 and #107) per variations in the free areas of ventilation windows and ventilation ducts
Figure 107: Discomfort hours (during annual occupied lab hours)
Discomfort hours (during annual occupied lab hours) per variations among the free areas of ventilation ducts and ventilation windows (Fig. 107), given as a ’percentage of ventilation ducts’ and ventilation windows openings to full free areas’ per the lab group (#105, #107). For better readability, the close-up chart (Fig. 108) removes the data of the ventilation windows having their percentage to full free areas of 0, 0.75 and 1.0.

121
Natural Ventilation Design Scheme 2
Close-up chart of discomfort hours (during annual occupied lab hours) of the lab group (#105 and #107)
per variations in the free areas of ventilation windows and ventilation ducts
Figure 108: Discomfort hours (during annual occupied lab hours)
For better readability, this close-up chart only shows the data of the ventilation windows having their percentage to full free areas of 0.125, 0.25 and 0.5.

122
6.5.3 Natural Ventilation Design Scheme 3
The AN model diagram and three-dimensional geometry of the energy model of Natural Ventilation Design Scheme 3 is illustrated in Figures 109 and 110. The result of the simulation, shown as chart form in Figures 111, 112,113 and 114 while the data in table form can be found at Appendix G, can be highlighted as follows:
- The central ventilation shaft also significantly contributes to the overall performance of the building, in terms of thermal comfort. This ventilation shaft becomes the main airflow path to draw the air from occupied spaces and exhaust it out of shaft openings located at a height beyond the top of the roof. This clearly demonstrates that all occupied spaces can achieve the minimum target of 50 discomfort hours with ventilation window free areas of 12.5% (0.125) and closed ventilation ducts.
- Similar to both Scheme 1 and Scheme 2, the lines showing discomfort hours of the offices also are slightly raised, as free areas of the ventilation ducts and ventilation windows are increased.
(a) AN diagram of room #105 and #107

123
(b) AN diagram of room #205, #206-206 and #211-212-213
Figure 109: AN diagram of Natural Ventilation Design Scheme 3

124
Natural Ventilation Design Scheme 3 Three-dimensional geometry (Sketchup model) of the energy model
Figure 110: Three-dimensional geometry (Sketchup model) of energy model for Natural Ventilation Design Scheme 3

125
Natural Ventilation Design Scheme 3 Discomfort hours (during annual occupied office hours) of the office group
(#205, #206-207 and #211-212-213) per variations in the free areas of ventilation windows and ventilation ducts
Figure 111: Discomfort hours (during annual occupied office hours)
Discomfort hours (during annual occupied office hours) per variations among the free areas of ventilation ducts and ventilation windows (Fig. 111), given as a ’percentage of ventilation ducts’ and ventilation windows openings to full free areas’ per the office group (#1205, #206-207, #211-212-213). For better readability, the close-up chart (Fig.112) removes the data of the ventilation windows having their percentage to full free areas of 0, 0.75 and 1.0.

126
Natural Ventilation Design Scheme 3 Close-up chart of discomfort hours (during annual occupied office hours) of the office group
(#205, #206-207 and #211-212-213) per variations in the free areas of ventilation windows and ventilation ducts
Figure 112: Close-up chart of discomfort hours (during annual occupied office hours)
For better readability, this close-up chart only shows the data of the ventilation windows having their
percentage to full free areas of 0.125, 0.25 and 0.5.

127
Natural Ventilation Design Scheme 3
Discomfort hours (during annual occupied lab hours) of the lab group (#105 and #107) per variations in the free areas of ventilation windows and ventilation ducts
Figure 113: Discomfort hours (during annual occupied lab hours)
Discomfort hours (during annual occupied lab hours) per variations among the free areas of ventilation ducts and ventilation windows (Fig. 113), given as a ’percentage of ventilation ducts’ and ventilation windows openings to full free areas’ per the lab group (#105, #107). For better readability, the close-up chart (Fig. 114) removes the data of the ventilation windows having their percentage to full free areas of 0, 0.75 and 1.0.

128
Natural Ventilation Design Scheme 3
Close-up chart of discomfort hours (during annual occupied lab hours) of the lab group (#105 and #107)
per variations in the free areas of ventilation windows and ventilation ducts
Figure 114: Discomfort hours (during annual occupied lab hours)
For better readability, this close-up chart only shows the data of the ventilation windows having their percentage to full free areas of 0.125, 0.25 and 0.5.

129
6.6 Discussions
Due to friction and pressure loss, free areas of ventilation ducts and ventilation windows, which were calculated from the simulation, assumingly count for only 50% of their actual overall areas when acoustical louvers and insect screens are in place. This means that these should not exceed the limit of 50% (0.50) unless their heights would be increased.
Cross ventilation depends on wind-driven pressure difference between inlet and outlet openings. Therefore, the location and sizes of these openings are very important to delivering adequate outdoor air across occupied spaces. The location and sizes may however, be limited by constraints from acoustical design as well as related tasks such as architectural façade design and daylighting.
In Scheme 1, the width of the space façade constraints are very critical to determining the free areas of the ventilation ducts and ventilation windows. For example, the result from this simulation showed that all the three offices (room 205, 206-207, 211-212-213) and the lab 105 can achieve the thermal comfort target of 50 discomfort hours (about 1% of annual occupied office hours) with their ventilation ducts and windows’ free areas set at 50%. Lab 107, however, needs to increase the height of its ventilation ducts and ventilation windows, since their free areas are required to be as high as 75% (thus, exceeding 50%).
Scheme 2 occupies less of the building façade area for the placement of ventilation ducts and ventilation windows, with the optimal free areas at 12.5%. This then makes more space available for placing those ducts and windows when acoustical louvers and insect screens are in place. For retrofitting the HIG building, especially, the relatively small required size makes it possible to place exterior doors for additional fenestration and to maximize the daylighting.
Scheme 3, meanwhile, can even achieve the thermal comfort target with the ventilation window free areas set at 12.5%, with ventilation ducts closed. This scheme reduces not only the required areas on the building façade for ventilation windows, but also eliminates the need for ventilation ducts running through the occupied spaces.
In terms of noise mitigation, ventilation ducts and windows with smaller free areas allow less outdoor noise to travel into occupied spaces, and therefore have higher noise reduction capabilities in comparison to those with larger free areas. In this case, Schemes 2 and 3 enable better outdoor noise mitigation. In Scheme 2, indoor noise might migrate between adjacent zones through the ventilation shafts. However this issue can be overcome by using acoustical louvers at the openings that connect occupied spaces with the ventilation shafts.

130
6.7 Limitations
(1) The baseline was validated solely by using the monthly whole building energy consumption, as metered for 18 months from July 2011 to December 2012. This data, recorded for a short period of time only, may not represent typical energy performance when compared to the predicted monthly energy performance during a typical weather condition (from TMY3 weather data).
(2) A Computational Fluid Dynamics (CFD) simulation was used to study pressure distribution over the building surfaces, under driven wind forces from different wind directions and to obtain the pressure coefficients for Airflow Network (AN) modeling. The CFD Flow Designer Professional application (version 10) from Advanced Knowledge Laboratory was used in this study for its low required-learning curve, flexibility in data exportation, and modeling. However, some limitations of this application were found in this study such as grid construction, turbulence models and surface roughness coefficients related to friction and pressure loss. No further study has yet been done to validate the pressure coefficients obtained from CFD simulation with the Flow Designer application.
(3) Since this study aimed to predict the ventilation performance of the natural ventilation schemes and also tried to examine a wide range of different sizes of ventilation components (e.g. the free area sizes of ventilation ducts and ventilation windows), these ventilation components therefore were simplified and modeled with a subtle complexity in geometry with the following assumptions:
- Interior louver is not in place. - There is no pressure loss due to leakage at ventilation ducts, ventilation shafts and ventilation
corridors.
These assumptions may overestimate the ventilation rates of the natural ventilation schemes and therefore a more detailed modeling of ventilation system should be taken for a further investigation.
(4) Since the AN model disregards the geometry of spaces and ducts, its airflow prediction abilities are limited. Airflow prediction in AN is simplified as to the overall volume of the airflow rate through space, and offers no guarantee that stale air in spaces will be completely replaced by an equivalent amount of fresh, outdoor air. Therefore, the distribution of the opening locations, aspect ratios, louvers, interior partitions and so on, is very important in order to drive and guide the airflow into occupied zones of spaces.
(5) Free areas of ventilation ducts and lower ventilation windows, calculated from the simulations, have not considered friction or vibration noise associated with the aspect ratios (width/height). The recommended aspect ratio is 1 to 4, with the optimal one having the lowest possible ratio that fits within construction space

131
conditions.129F
128 Since ventilation ducts and lower ventilation windows are set to 2 feet high, their widths should
not exceed 8 feet wide.
(6) In Scheme 2, not only could indoor noise migrate from one space to an adjacent one, exhausted air could flow from ventilation shafts into the occupied spaces. To avoid this, placing dampers at the openings connecting occupied spaces to the ventilation shafts is requires. However, due to the limitations of the AN model in EnergyPlus, there is no way to create a one-way path through these openings, thereby possibly resulting in the overestimation of discomfort hours of Scheme 2.
6.8 Conclusion
This chapter proposed three natural ventilation design schemes for the HIG building and investigated their optimal configurations to insure their feasibility of those schemes for building retrofitting. To do this, AN model, coupling with thermal model integrated in EnergyPlus building energy simulation application, was used to predict the thermal performance of the designs, particularly calculating the level of thermal discomfort during the annual occupied hours of the given labs and offices. The CFD Flow Designer application was used in this study to predict the wind pressure coefficients for the AN models. All ventilation ducts and ventilation shafts which may be more complex with the placement of fittings and interior louvers in the reality, however, were simplified to represent their actual geometry. Pressure loss at the ventilation windows was considered by limiting the percentage of openings’ actual free-areas to their full free-areas, when their acoustical louvers are in place. And this percentage is assumed not to exceed 0.5 (50%) in the calculation.
The study showed that Natural Ventilation Design Scheme 3, utilizing the central service corridor to place the vertical ventilation shafts, offers the best thermal performance in comparison to other schemes. The study also confirmed that Natural Ventilation Design Schemes 2 and 3, upgraded versions of Natural Ventilation Design Scheme 1 after supplementing vertical ventilation shafts, significantly increase their thermal comfort performance, eliminating the use of ventilation ducts which might affect both the function as well as the aesthetics of a building’s interior spaces.
This analysis approach allows for a better understanding of the feasibility of natural ventilation design schemes in building retrofitting, as well as within the new design of naturally ventilated buildings. The design of these cases requires consideration for many parameters such as outdoor and indoor noise issues, thermal comfort, daylighting, floor-to-ceiling height, building layout, etc. Although this approach is based on the most current and advanced building energy simulation technology, the limitation of the AN models and the CFD Flow Designer application, as well as the simplification of the energy models used in the study, etc., the resultant data therefore could be seen as preliminary quantitative factors used for the decision-making
128 Stein, Building Technology: Mechanical and Electrical Systems.

132
process in the schematic architectural design phrase. A further study discerning with a higher accuracy can be achieved from this analysis approach using a more powerful CFD code (CFD application) and detailed energy modeling based on more specific natural ventilation design.

133
CHAPTER 7
EVALUATION OF THE NATURAL VENTILATION POTENTIALS IN THE RETROFITTING OF EXISTING BUILDINGS
ON THE UNIVERSITY OF HAWAI‘I AT MĀNOA CAMPUS IN HONOLULU
This chapter discusses the evaluation of natural ventilation potentials of existing buildings on UHM campus. The evaluation will assist with future design decision-making on retrofitting those buildings towards more sustainable ways, gradually helping to reduce the use of fossil fuels for electric generation and other associated impacts. This evaluation is based on the fundamentals of natural ventilation design principles for hot and humid climates, which were discussed in Chapter 2, and also the resultant study on ventilation design schemes in Chapter 6. Recommendations for natural ventilation design will be discussed in this chapter.
7.1 Introduction
The University of Hawai‘i at Mānoa (UHM) in Honolulu, has set a goal of 50% energy reduction by 2015 and energy self sufficiency by 2050.13
129 A study of energy consumption in UH buildings found that 52% of electrical usage is for air-conditioning.130 Natural ventilation is an efficient strategy to significantly reduce this energy use. This evaluation of natural ventilation potentials focused on four buildings typical among those on the UHM campus (Fig. 115): (1) Keller Hall, (2) Physical Science Building, (3) Moore Hall, and (4) Hawai‘i Hall.
7.2 Criteria
These buildings were initially chosen based on their forms, layouts and main building functions, then were evaluated with more insight using the following criteria:
- Location
This criterion relates to the impact of the surroundings on a building, in terms of its exposure to the prevailing wind. An analysis using aerial maps to locate neighboring buildings and topographical conditions
129 NAM (Newcomb Anderson McCormick), Strategic Energy Plan University of Hawai‘i at Mānoa. p.2 130 Chong, Benchmarking Study.

134
was used to evaluate this criterion. However, wind tunnel study or CFD analysis should also be used for the further analysis.
- Landscape
This study investigates the existing landscape conditions around the building, resulting in local air temperature and micro air movement, to see how they might impact on the surrounding microclimate. This can inform future recommendations for landscaping that might improve the indoor air quality and thermal comfort of the building.
- Outdoor noise level
This not only challenges the application of natural ventilation, it also informs the integrated acoustical design and natural ventilation design strategy. Outdoor noise level at site was assessed by investigating noise sources such as parking lots/structures, busy streets, on-site mechanical equipments, etc. However, noise measurement should be conducted in further study.
- Building form and orientation
The optimal building form and building orientation is an elongated one, with a longitudinal axis running along a north-south direction to minimize solar exposure on the building façades. A building without an optimal form and/or orientation might need to incorporate a careful introduction of solar devices to protect windows from direct sun beams as well as solar radiation.
- Building envelope
This criterion is related to the availability of openings, opening types, sizes and locations. Solar shading devices also were considered for this.
- Building layout
This is an important criterion used to determine the potential of natural ventilation application to the building, as well as the appropriate natural ventilation strategy to be applied. It also includes different layout types and corridor configurations.
- Program
Program criterion includes occupant activities, required ventilation rates, required illuminance levels and equipment power densities or plug loads.
- Special requirements
Some requirements might demand special consideration within the building design, such as architectural conservation of historical buildings, mechanical ventilation and air-conditioning for certain labs or computer rooms.
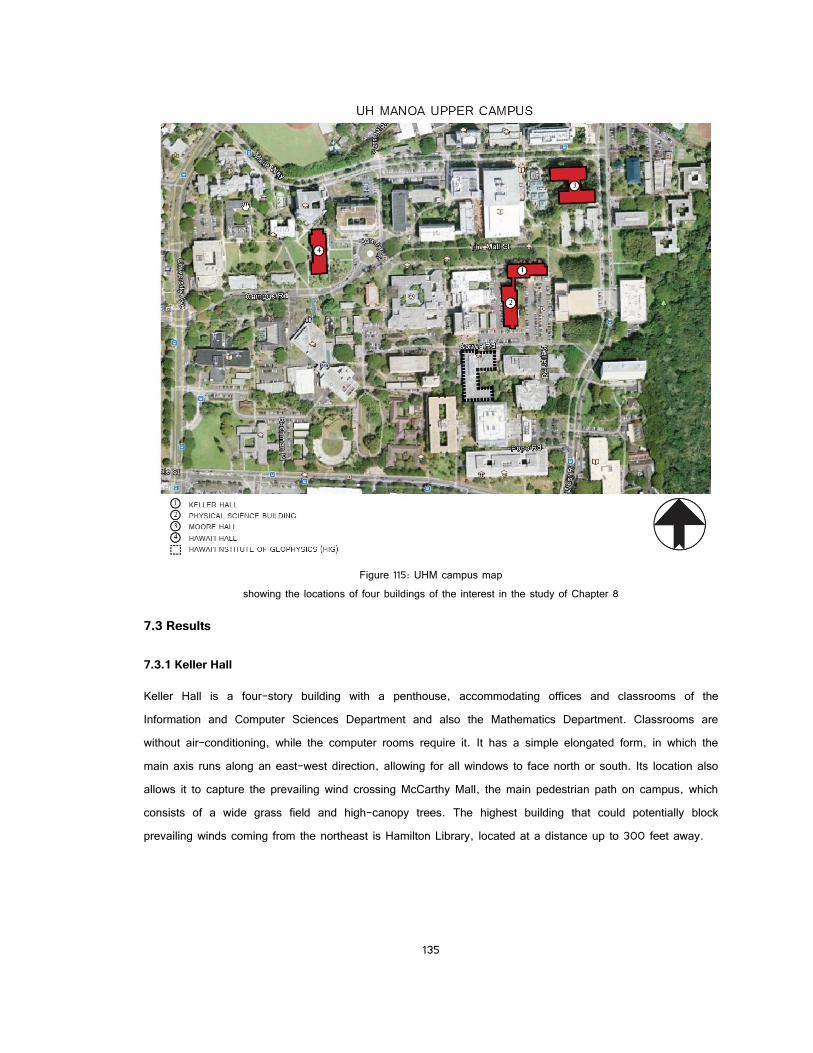
135
Figure 115: UHM campus map
showing the locations of four buildings of the interest in the study of Chapter 8
7.3 Results
7.3.1 Keller Hall
Keller Hall is a four-story building with a penthouse, accommodating offices and classrooms of the Information and Computer Sciences Department and also the Mathematics Department. Classrooms are without air-conditioning, while the computer rooms require it. It has a simple elongated form, in which the main axis runs along an east-west direction, allowing for all windows to face north or south. Its location also allows it to capture the prevailing wind crossing McCarthy Mall, the main pedestrian path on campus, which consists of a wide grass field and high-canopy trees. The highest building that could potentially block prevailing winds coming from the northeast is Hamilton Library, located at a distance up to 300 feet away.

136
Figure 116: Keller Hall
(a) Northern landscaping allows for capturing prevailing wind (left) (b) The existing HVAC system in the south side, next to the parking lot (right)
Keller is surrounded by cool, green areas at the north side. However, the unshaded parking lot on the south not only increases air temperature and heat gains through direct and indirect radiation effects, it also causes outdoor noise issues (Fig. 116). The proposed six-story parking structure intended to replace the current parking lot may integrate green walls into its design, to better mitigate heat gain and outdoor noise impacts from the structure.
The building features continuous-strip style windows along its north and south façades, protected from direct sun by a system of louvers and fins.
Natural ventilation design recommendations:
- The first floor should be converted to open space (then possibly adding another floor on the top) to create inviting pedestrian space, allowing for air movement through the building (Fig.1 17).
- Curved berm allows for accelerated wind speed, resulting in increased negative pressure for cross ventilation of the building.
- A new overhang system should be designed to replace the old one, allowing for better solar shading as well as offering a pleasant view to the outside.
- Green walls effectively mitigate the negative impacts of direct and indirect solar radiation, as well as noise from the parking lot/parking structure.
- Building envelope construction should be replaced and made compliant with ASHARAE 90.1 or ASHRAE 189.1. In case the existing building envelopes need to otherwise be retained, the replacement of single-pane glazing systems with double low-e glazing ones, having low SHGC and high VT value, should be a high priority.
- Air-conditioned computer labs might need to be consolidated to facilitate the installation of mechanical ventilation and new air-conditioning systems.

137
- Wind-driven ventilation, assisted by ventilation ducts, is proposed for the design scheme of the building. Vertical ducts can be used to increase the ventilation rates to the rooms located at the leeward side of the building. Acoustical louvers and insect screens can be used to mitigate the intrusion of outdoor noise and insects.
Figure 117: Natural ventilation design strategy for Keller Hall
(a) Adding green wall to mitigate noise from parking structure as well as solar radiation (b) Converting first floor into open space
(c) Adding curved berm to accelerate wind to increase pressure difference (d) Recommending cross ventilation

138
7.3.2 Physical Science Building
Figure 118: Physical Science Building
(a) All windows are facing to east and west, with shading devices (left) (a) Existing HVAC system located to the east, next to the parking lot.(right)
Physical Science Building is a three-story structure with a penthouse, having a similar form and layout to Keller Hall, located next door (from the south) to it, right by the parking lot to the east. Physical Science Building and Keller Hall connect to each other by way of a three-story-high bridge. Physical Science Building, however, is oriented an angle of 90 degrees to Keller Hall, resulting in its windows facing either to the east or west.
The landscape surround it lacks green grass and canopy trees, resulting in high solar insolation and solar radiation from the unpaved parking lot. While current shading devices help to protect windows from direct sun and glare, they also block the view.
This building is occupied by the Physics Department, accommodating offices, computer labs, one auditorium and classrooms. Similar to Keller Hall, it requires air-conditioning for its computer labs, although natural ventilation might be appropriate for classrooms and the auditorium. (Fig. 118)
Natural ventilation design recommendations
- An overall solar shading system is more effective to protect the east and west-facing building façades from direct sun and intensive solar insolation (Fig. 119).
- Building construction should be compliant to ASHRAE 90.1 or ASHARE 189.1. All windows facing east and west should have a low SHGC value, to mitigate solar heat gains. VT, however, is not critical in this case.
- Thermal zone consolidation of air-conditioned spaces is best for computer labs. - The building is blocked from the prevailing wind by Keller Hall, therefore wind-driven force might be
insufficient for regular cross-ventilation. Vertical ventilation ducts should be used, to increase wind-
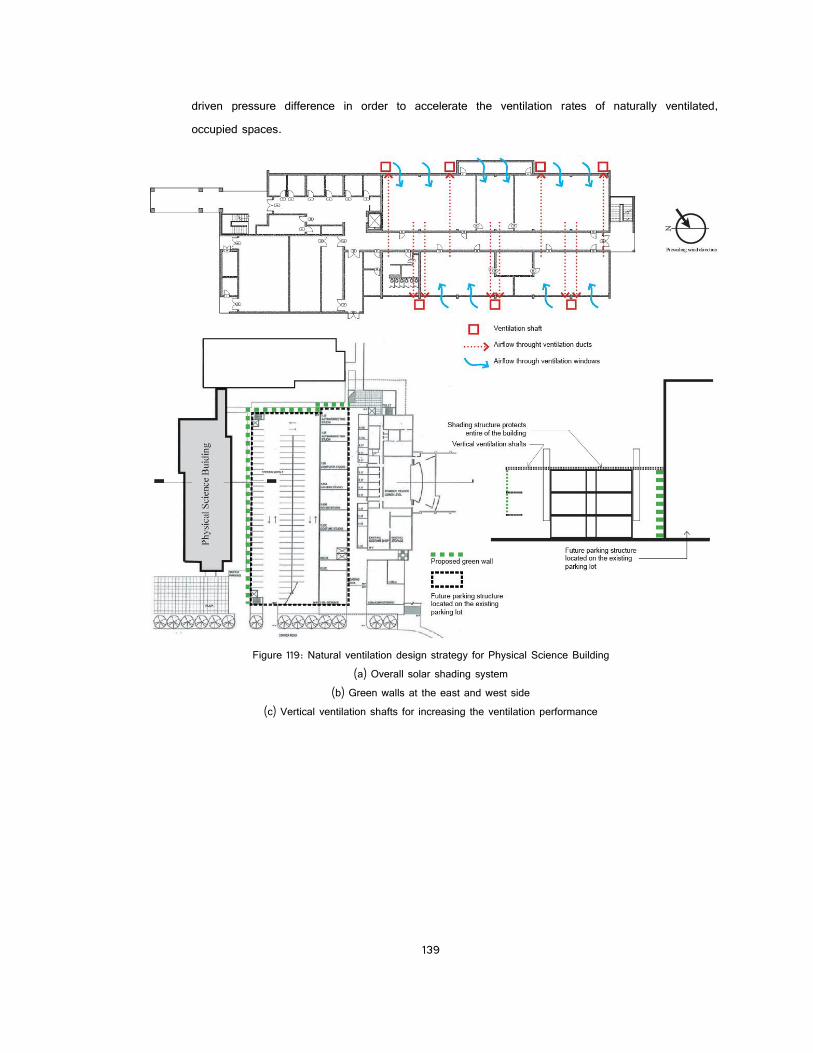
139
driven pressure difference in order to accelerate the ventilation rates of naturally ventilated, occupied spaces.
Figure 119: Natural ventilation design strategy for Physical Science Building
(a) Overall solar shading system (b) Green walls at the east and west side
(c) Vertical ventilation shafts for increasing the ventilation performance
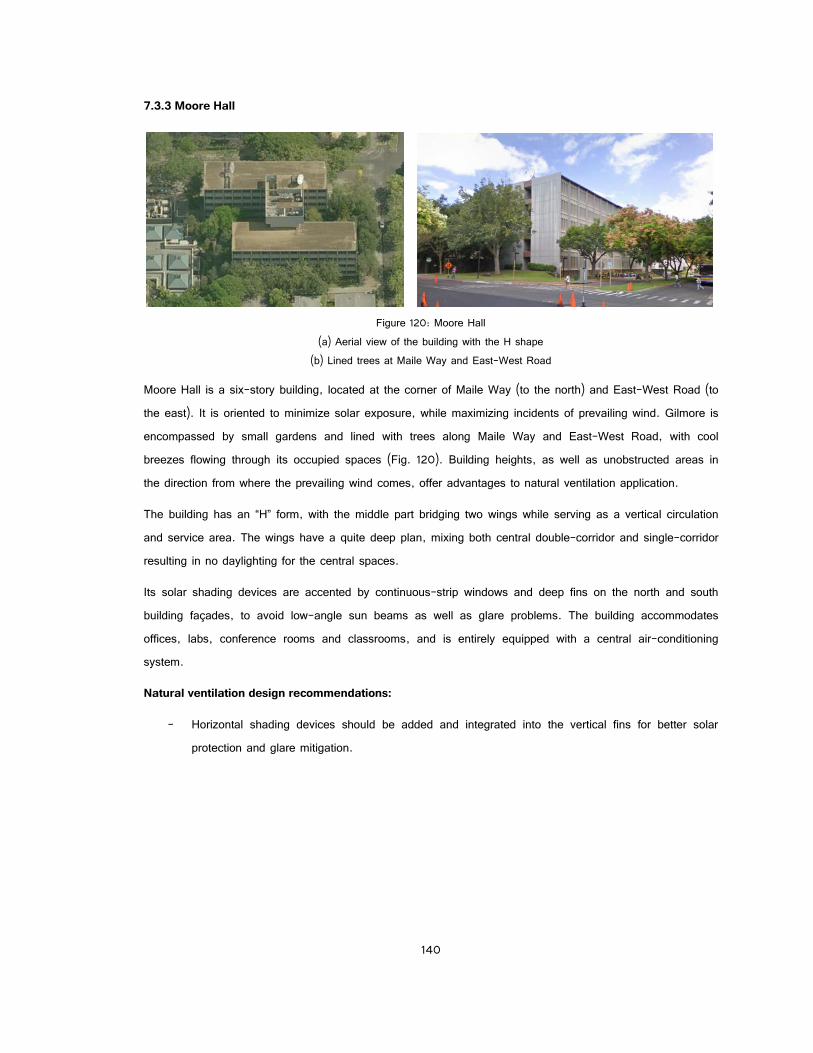
140
7.3.3 Moore Hall
Figure 120: Moore Hall
(a) Aerial view of the building with the H shape (b) Lined trees at Maile Way and East-West Road
Moore Hall is a six-story building, located at the corner of Maile Way (to the north) and East-West Road (to the east). It is oriented to minimize solar exposure, while maximizing incidents of prevailing wind. Gilmore is encompassed by small gardens and lined with trees along Maile Way and East-West Road, with cool breezes flowing through its occupied spaces (Fig. 120). Building heights, as well as unobstructed areas in the direction from where the prevailing wind comes, offer advantages to natural ventilation application.
The building has an “H” form, with the middle part bridging two wings while serving as a vertical circulation and service area. The wings have a quite deep plan, mixing both central double-corridor and single-corridor resulting in no daylighting for the central spaces.
Its solar shading devices are accented by continuous-strip windows and deep fins on the north and south building façades, to avoid low-angle sun beams as well as glare problems. The building accommodates offices, labs, conference rooms and classrooms, and is entirely equipped with a central air-conditioning system.
Natural ventilation design recommendations:
- Horizontal shading devices should be added and integrated into the vertical fins for better solar protection and glare mitigation.
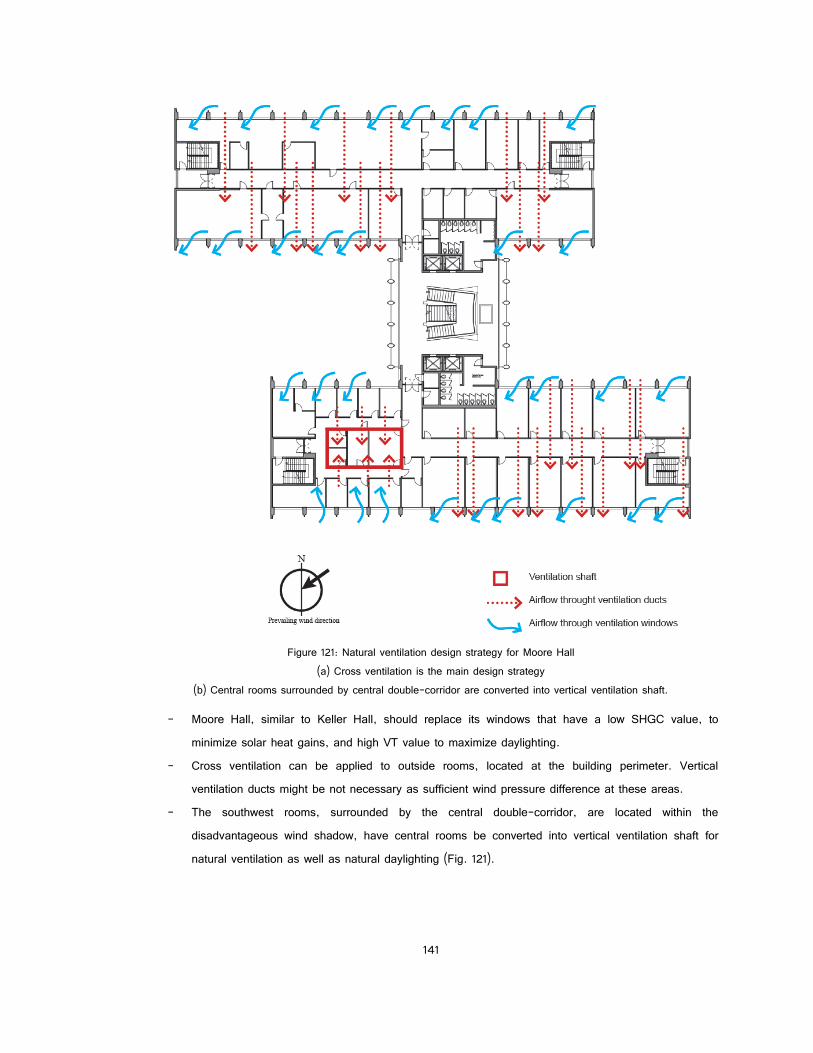
141
Figure 121: Natural ventilation design strategy for Moore Hall
(a) Cross ventilation is the main design strategy (b) Central rooms surrounded by central double-corridor are converted into vertical ventilation shaft.
- Moore Hall, similar to Keller Hall, should replace its windows that have a low SHGC value, to minimize solar heat gains, and high VT value to maximize daylighting.
- Cross ventilation can be applied to outside rooms, located at the building perimeter. Vertical ventilation ducts might be not necessary as sufficient wind pressure difference at these areas.
- The southwest rooms, surrounded by the central double-corridor, are located within the disadvantageous wind shadow, have central rooms be converted into vertical ventilation shaft for natural ventilation as well as natural daylighting (Fig. 121).

142
7.3.4 Hawai‘i Hall
Figure 122: Hawai‘i Hall.
Historically-significant building with surrounded by spacious green yards in the front and the back.
Hawai‘i Hall is a three-story UH administration building comprised only of offices, surrounded by a large lawn and palm trees (Fig. 122). These landscape conditions have the potential to absorb both direct and indirect radiation, reducing the surrounding outdoor ambient air temperature. Although it is a building form with the “I” shape, running along a north-south direction, its two wings are extended to a corrugation form for solar mitigation.
This building has a mixed layout, featuring a single central corridor in its middle segment and a deep plan layout of the two wings. Hawai‘i Hall is historically-significant, and is therefore subject to historic preservation regulations. Any proposed redesign to retrofit this type has to follow specific, relevant criteria. In the scope of this study, natural ventilation, as could be applied to this building, is designed to preserve its façades.
Natural ventilation design recommendations
- Preservation of the existing building façades and other key historical features should determine the natural ventilation design of the building.
- Since the existing building facades should be preserved, a “double-wall” façade is recommended to allow for the secondary wall to place necessary and appropriate ventilation windows and/or ventilation ducts (Fig. 123).
- The existing building facades can act as shading devices for the building. However, low SHGC glazed windows and/or window blinds are necessary to mitigate heat gain from solar radiation, especially for east and west facing windows.
- Cross ventilation strategy is applicable to the middle segment of the building, while the two wings with deep layout should utilize their staircases as atria to increase the ventilation performance of these areas.

143
Figure 123: Natural ventilation design strategy for Gilmore Hall
(a) Existing building façades are preserved by using double-wall system (b) Cross ventilation apply for the middle segment of the building
(c) Staircases are converted into atrium using for stack ventilation of the wings

144
CHAPTER 8
SUMMARY AND FURTURE RECOMMENDATIONS
8.1 Summary of study objectives
The main objective of this research is to use parametric studies and building energy simulations to explore optimal, natural ventilation schemes for the design of high performance, naturally ventilated, non-residential buildings in hot and humid climates. To achieve this goal, several tasks are defined, including: 1) to investigate the design scheme of naturally ventilated buildings in hot and humid climates using Kuykendall Hall as a case study; 2) to propose and optimize schemes for designing naturally ventilated, high-performance, non-residential buildings in the particular warm and humid climate of Hawai‘i, using HIG buildings for a focused application of the study; 3) to evaluate the potential of natural ventilation systems and the application of proposed natural ventilation design schemes for retrofitting other UHM campus buildings.
8.2 Summary of methodology
The AN model, coupled with thermal model in EnergyPlus application, was constructed to represent the actual building. It was calibrated by using Building Information Modeling (BIM) data on the building, surveys, the relevant U.S. Department of Energy commercial reference buildings having the same climate zone type defined by ASHRAE, and the monthly measuring of energy consumption for the actual building.
The pressure coefficients required for plugging into the AN model were obtained from a CFD study. To accomplish this, exterior air movement around the HIG buildings was analyzed using the Flow Designer application, taking account of adjacent buildings as obstructions. Building surfaces were divided into individual patches for calculating average pressure coefficients at every 22.5 degree wind directions.
To investigate a wide range options among natural ventilation design schemes, all energy models were replicated, with the opening sizes of ventilation ducts and ventilation windows varying from 0 (completely closed) to 1.0 (at a full allowable width). These energy models then were simulated by using the weather data collected both at the site’s weather station and TMY3 weather data file at the PHNL.
The adaptive thermal comfort criterion was used to evaluate the performance of the proposed natural ventilation design schemes. To accomplish this, the predicted indoor operative temperature data from the energy simulation were plugged into the formulation spreadsheet in Excel, to calculate the number of total discomfort hours during the occupied period of one year.

145
The four other buildings selected on the UHM campus were chosen for evaluating their potential for application of the proposed natural-ventilation design schemes. The methodology used for this aspect of the study was mainly walk-through observation.
8.3 Summary of results
The main results from this study consist of the numbers of discomfort hours predicted during an annual occupied hours for each of the natural ventilation design schemes, at different configurations of ventilation ducts and ventilation windows per the size of their openings. The results showed that the Natural Ventilation Design Scheme 1, which relies only on cross-ventilation, is either not the optimal design strategy for this building, or it would require supplementary mechanical ventilation systems in order to maintain thermal comfort during discomfort hours. Schemes 2 and 3 were found to be better natural design strategies, allowing a lower number of discomfort hours. The results of the study confirm that, when supplementing the ventilation shafts with both ventilation ducts or ventilation windows, either of them should be completely closed, so as to achieve the lowest number of discomfort hours. This could then result in eliminating the use of either ventilation ducts or ventilation windows in the design schemes altogether. Scheme 3 was concluded to be the optimal natural design scheme for this building, for the following reason: it permits only a minimal number of discomfort hours, utilizing the existing service shaft for separate vertical ventilation ducts in order to mitigate noise travelling between adjacent spaces.
8.4 Recommendations for future research
8.4.1 Detailed modeling a specific ventilation system
Since the AN model is the main tool used in the study, acknowledging that it does not take the internal geometry of ventilation schemes into account, the schemes are modeled with a subtle complexity in geometry. Also, this study tried to examine a wide range of different sizes of ventilation components (e.g. the sizes of duct openings and windows, etc.) and these ventilation components were simplified and modeled to the maximum sizes defined by the 3D model.
The actual geometry of ventilation ducts and ventilation windows should be modeled to either account for the optimal aspect ratios (width/height,) or to use appropriate louvers and duct fittings to reduce friction and vibration noise. The pressure losses at these louvers and duct fittings, as well as that loss due to leakage, the length and geometry of ventilation ducts, ventilation shafts and ventilation corridors should be modeled in a further investigation.
8.4.2 Automated control system for the openings of the ventilation ducts, ventilation windows and ventilation shafts in Natural Ventilation Design Scheme 2

146
The results for this showed that pressure difference between the two openings of the ventilation shafts, inducing the air flow through the longitudinal corridor, would impact cross-ventilation. For example, in the case of northerly winds causing maximum stagnation pressure at the openings of the ventilation shafts, any cross-ventilation would be at a minimum. To overcome this, an automated control system, based on the outdoor wind condition at the site to govern the opening sizes (by closing or opening) of the ventilation windows, ducts and shafts, could be used to maximize cross-ventilation, and should be studied further.
8.4.3 Calibration with data measured at naturally ventilated spaces
The baseline model was constructed to represent the actual building, based on the updated Building Information Modeling (BIM) file, the survey of the existing constructions, the relevant reference commercial building developed by the U.S. Department of Energy (US. DoE) and the current UHM academic calendar for the occupancy schedule. This model then was calibrated with the measured monthly energy consumption of the whole building. A measurement of break-down energy consumption of this actual building is essential for validating the baseline model. In addition, due to time constraints on the study, there was no other reliable data available to validate this baseline. Therefore, further studies should consider conducting data measurement (such as temperature, humidity, wind speed, breakdown energy consumption into building system categories, etc.) at certain rooms, and compare these data sets with the predicted results from the energy models.
8.4.4 Mechanical ventilation and hybrid ventilation systems
This study mostly focused on the Hawai‘i climate, which features favorable temperatures and quite sufficient wind throughout a typical year. Natural ventilation, therefore, is the main design strategy recommended to deliver human thermal comfort for buildings here. However, mechanical ventilation remains an indispensable system in contemporary, high-performance buildings; needed to assist the natural ventilation in cases of adverse outdoor conditions, in order to maintain human thermal comfort throughout the course of a year. Therefore, assisted mechanical ventilation and/or hybrid ventilation integrated into the natural ventilation design should be considered in the future research.
8.4.5 Study of thermal comfort as elevated by ceiling fans
This study has not considered the effect of ceiling fans on the comfort model when calculating discomfort hours. However, these are very important tools used to enhance thermal comfort by elevating air movement to offset excessive heat gains, through increased convective heat loss at through the skin. This allows for increasing the maximum, acceptable operative temperature under certain conditions. A study on the thermal comfort as elevated by ceiling fans should be further investigated, using CFD analysis.
8.4.6 Ventilation effectiveness study with CFD

147
Since the AN model used in this study assumes that all spaces are well-mixed with uniform temperature, and that their geometries are not taken into account therein, the actual ventilation performance throughout these spaces might differ from the AN models. For example, there might be some “dead spots” resulting from the geometries of the spaces, the sizes and locations of the openings, as well as the presence of any furnishings and/or partitions. To tackle this issue, a further study on the ventilation effectiveness of the individual spaces should be carried out, using CFD analysis.
8.5 Conclusion
With an increased awareness of the cost and environmental impacts of energy use, natural ventilation has become an increasingly attractive method of providing thermal comfort with indoor environmental quality while significantly reducing energy consumption. Natural ventilation does not simply mean the utilization of natural driven forces to ventilate spaces. Natural ventilation also refers to design techniques for achieving thermal comfort by ventilation and cooling effects. The design of natural ventilation involves in the integrated passive cooling concept, including heat protection, heat rejection and heat modulation. This concept can occur throughout different design stages from urban, site and building design.
Natural ventilation allows the occupants to be thermally comfortable over a much wider range of indoor temperatures compared to occupants of air-conditioned buildings. Moreover, in the same comparison, people in naturally ventilated buildings are more tolerant to higher noise levels. These are the results from the lower expectation of noise and thermal comfort, as well as the capabilities and opportunities of those occupants to adapt to thermal environments and noise levels. However, the misuse and ignorance of occupants can significantly impact on the performance of the entire building. Manually override building management system is vital in the design of a naturally ventilated building.
The most challenge of the applicability of natural ventilation is climate. In hot and humid climates, high temperature can limit the potential for daytime cooling and high humidity can cause condensation in building surfaces at nighttime, resulting in mold-related issues. Dehumidification is necessary in certain circumstances but the selection and operation of the dehumidification system should take the accumulated cost of maintenance and operation into account.
Since mechanical ventilation and cooling systems are capable to meet any thermal loads and to allow for any architectural requirements, the design of a mechanically ventilated and/or air-conditioned building conventionally can be simply divided and carried out by separate design groups based on their disciplines. For example, architects work on building layouts, envelopes and leave building structure, thermal requirement, room acoustics, lighting, and so on to relevant engineers who will tackle specific work. On the contrary, naturally ventilation requires the highly integrative approach to address multiple design parameters

148
related to occupants’ activities, ventilation mechanism in architectural design, lighting design, acoustic strategy, humidity control, building management system, etc.
These design parameters normally have been grouped and considered separately in the designs of mechanically ventilated and/or air-conditioned buildings. However, in the design for natural ventilation, the performance of naturally ventilated buildings significantly depends on the interaction between all design parameters as well as how these design parameters react to the full dynamics of the outdoor environmental conditions and varying level of human activities over time.
Using building energy simulation in this thesis is an attempt to apply the above ideas into the design of naturally ventilated buildings. In this thesis, each proposed natural ventilation design schemes with different configurations were simulated and evaluated, based on the thermal comfort levels at every occupied hour over the course of a year. Thermal comfort level, size and configuration of ventilation ducts and windows which affect on ventilation effectiveness, indoor and outdoor noise, potential of mold growth over time, are quantitative criteria in optimizing the design of naturally ventilated buildings.
This thesis allows for a better understanding on the feasibility of natural ventilation design schemes in building retrofitting as well new designing of naturally ventilated buildings. By using the most current and advanced building energy simulation technology coupling with AN and CFD modeling, this analysis approach helps to predict the overall performance of the whole building for long period of time, as well as identify any special condition at which a further investigation should be taken.
Finally, with a more powerful CFD code (CFD application), comprehensive Airflow Network and energy modeling, this thesis could provide an important and reliable analysis approach not only for the decision-making process in the research and design phases, but also for the controlling plan of naturally ventilated buildings, especially in hot and humid climates.

149
APPENDIX A
Humidity Control In hot and humid climates, humidity control is very important in order to avoid a level of moisture condensation on building materials that might cause mold development and reduce the building’s durability. To avoid mold development, the equilibrium relative humidity (ERH) should be less than 80% within any of the layers inside the building envelopes. A typical exterior wall for the hot and humid climates, shown in Table 19, was simulated by the MOIST application using TMY3 weather data at PHNL.
Table 19: Typical exterior wall for hot and humid climates
Permeance values of materials {perm}
Finishing (Latex Primer/Sealer) 6.28 Plywood 0.7 Vapor barrier (Kraft paper) 0.03 Air gap 1” 162 Insulation R19 23.94 Gypsum board 50
Table 20: Number of hours over the threshold for mold growth in a typical exterior wall for the Honolulu climate.
Number of hours over the Threshold for Mold Growth (ERH>80%)
Indoor DT (F) 50 55 60 65 70 75 80 85 90 95 100
90 2367 8760 8760 8760 8760 8760 8737 8682 8734 8659 8429
85 8340 8737 8760 8758 8703 8464 8653 8633 8666 8679 8469
80 34 25 23 551 2434 3833 5853 8535 8555 8648 8511
75 34 25 23 17 16 14 3902 8535 8431 8523 8556
70 34 25 23 17 16 14 756 5765 8245 8285 8481
65 34 25 23 17 16 14 9 3562 8145 8121 8212
60 34 25 23 17 16 14 9 168 5294 7946 7966
55 34 25 23 17 16 14 9 7 2816 7831 7802
50 34 25 23 17 16 14 9 7 5 4008 7717
Indoor RH (%)
Finishing Vapor barrier Plywood Air gap Insulation (R19) Gypsum board Finishing

150
Lab #105 - Hourly predicted mold growth occurrence inside exterior walls
Figure 124: Hourly predicted mold growth occurrence inside exterior walls
of the Lab #105 in Nautral Ventilation Design Scheme 1 with ventilation ducts and ventilation windows having their percentage to full free areas of 25% (0.25)
Office #205 - Hourly predicted mold growth occurrence inside exterior walls
Figure 125: Hourly predicted mold growth occurrence inside exterior walls
of the Office #205 in Nautral Ventilation Design Scheme 1 with ventilation ducts and ventilation windows having their percentage to full free areas of 25% (0.25)
The number of hours over the threshold for mold growth, a condition occurring when the equilibrium relative humidity at any layer of the wall exceeds 80%, is shown in Table 20. It shows the range of air drybulb temperatures (DT) and relative humidity (RH) from which the number of moisture development hours sharply

151
drops. It reveals that it is the combination of air temperature and relative humidity, rather than only relative humidity, should be considered in humidity control planning, in order to avoid moisture development. This study makes clear that it is very important to control both indoor air temperature and relative humidity within this range.
This range is used as the reference table to calculate the accumulative number of hours at which the mold growth likely occurs. This can be done by looking up both indoor hourly drybulb air temperature and relative humidity and comparing these values with the reference table. The application of this study shows an example of predicting the hourly mold growth occurrence inside exterior walls from the Natural Design Scheme 1 with ventilation ducts and ventilation windows having their percentage to full free areas of 25% (0.25). The resultant data shows that Lab #105 and Office #205 might undergo 2233 hours (26%) and 1937 hours (22%) at which mold growth might occur, over a course of the year. This prediction also allows for mold-control planning (e.g. dehumidification operation schedule) shown in the Figures 124 and 125.

152
APPENDIX B Thermal Comfort Enhancement by Using Ceiling Fans
Air movement helps to accelerate the evaporation of skin to reduce human body temperature, thus to increase the thermal comfort range which is governed mainly by operative temperature. For example, by elevating the air speed to 150fpm (0.75m/s), the upper limit of thermal comfort range for a typical sedentary activity can be expanded 4.5F (2.5C) (Fig. 126). Using ceiling fans is very important for natural ventilation, not only to enhance the thermal comfort but also to circulate fresh air inside spaces, thus improving the ventilation effectiveness. Ceiling fans also are energy efficient, offer low-cost installation and during operation.
Figure 126: Elevated air speed resulting in an increase in temperature range of thermal comfort.131
For example, an increase of air speed of 150fpm (0.75m/s) will expand the thermal comfort 4.5F (2.5C)
This section demonstrates the application of the thesis’ study approach in predicting the performance of energy models, particularly per the discomfort hours during the occupied period of a year, per two scenarios: without ceiling fans and using ceiling fans. The energy model was used is Natural Ventilation Design Scheme 1 with ventilation ducts and ventilation windows having their percentage to full free areas of 25% (0.25), calculating the discomfort hours during annual occupied lab hours of room Lab #105 (Fig. 109 and 110) and the discomfort hours during annual occupied office hours of room Office #205 (Fig. 111 and 112).
The resultant data revealed that without ceiling fans, Lab #105 might experience 123 discomfort hours during annual lab hours (3.4%); while for Office #205, this number is 184 (3.8%). By using ceiling fans to produce an air speed of 150fmp (0.75m/s), the maximum temperature for the adaptive thermal comfort range would
131 ANSI/ASHRAE, “ASHRAE 55-2010: Thermal Environmental Conditions for Human Occupancy.”

153
be raised an addition by 4.5F, resulting in all given rooms falling within the comfort range during their occupied hours.
This study can be used not only for fan system controlling but also in estimating its associated energy consumption. The draft effect from ceiling fans might lead to local thermal discomfort, caused by a vertical air temperature difference between the feet and the head. This issue, however, would be investigated in further study.
Lab #105 - Hourly thermal discomfort
Figure 127: Hourly thermal discomfort during annual lab hours of Lab #105
illustrated under standard adaptive thermal comfort chart (top); illustrated under flood plot (bottom) in Nautral Ventilation Design Scheme 1
with ventilation ducts and ventilation windows having their percentage to full free areas of 25% (0.25)

154
Figure 128: Thermal comfort enhancement by ceiling fans (Lab #105) before (top) and after (bottom), using ceiling fans to elevate air speed by 150fpm
in Nautral Ventilation Design Scheme 1 with ventilation ducts and ventilation windows having their percentage to full free areas of 25% (0.25
90% comfort range = Tmean monthly outdoor ±4.5F 80% comfort range = Tmean monthly outdoor ±6.3F
Expanded comfort range by elevating airspeed at 150fpm (0.75m/s), 80% exp. comfort range = 80% comfort range + 4.5F

155
Office #205 - Hourly thermal discomfort
Figure 129: Hourly thermal discomfort during annual office hours of Office #205
illustrated under standard adaptive thermal comfort chart (top); illustrated under flood plot (bottom) in Nautral Ventilation Design Scheme 1
with ventilation ducts and ventilation windows having their percentage to full free areas of 25% (0.25)

156
Figure 130: Thermal comfort enhancement by ceiling fans (Office #205)
before (top) and after (bottom), using ceiling fans to elevate air speed by 150fpm in Nautral Ventilation Design Scheme 1
with ventilation ducts and ventilation windows having their percentage to full free areas of 25% (0.25)
90% comfort range = Tmean monthly outdoor ±4.5F 80% comfort range = Tmean monthly outdoor ±6.3F
Expanded comfort range by elevating airspeed at 150fpm (0.75m/s), 80% exp. comfort range = 80% comfort range + 4.5F

157
APPENDIX C HIG Building Pressure Coefficients

158
APPENDIX D Default Dimensions for Ventilation Ducts and Ventilation Windows
of the Given Rooms in the Energy Models

159
APPENDIX F Natural Ventilation Design Scheme 1
Discomfort hours (during annual occupied office and lab hours) per variations in free areas of ventilation windows and ventilation ducts (sorted here by window and duct for comparison)

160
APPENDIX G Natural Ventilation Design Scheme 2
Discomfort hours (during annual occupied office and lab hours) per variations in free areas of ventilation windows
and ventilation ducts (sorted here by window and duct for comparison)

161
APPENDIX F Natural Ventilation Design Scheme 3
Discomfort hours (during annual occupied office and lab hours) per variations in free areas of ventilation windows
and ventilation ducts (sorted here by window and duct for comparison)

162
APPENDIX H Natural Ventilation Strategies
This appendix shows five different Natural Ventilation Strategies drawn from three proposed Natural Ventilation Design Schemes in the Chapter 7 based on their adaptability to architectural design of new or existing buildings. Strategy 1 and 2 are based on the Natural Ventilation Design Scheme 1. Strategy 3 is as Scheme 2, after eliminating the use of ventilation ducts, while Strategies 4 and 5 are two variations of Scheme 3 with differently locating ventilation shafts. The mixed strategy shows how these natural ventilation strategies can be mixed and applied for a design of a four story building.
Natural Ventilation Design Strategy 1
This strategy is derived from Natural Ventilation Design Scheme 1. It is applicable in an area where prevailing wind directions are quite consistent and wind-driven pressure difference is sufficient for cross ventilation.
Figure 131: Natural Ventilation Design Strategy 1
Natural Ventilation Design Strategy 2
The working concept of this strategy is similar to that of Natural Ventilation Design Strategy 1, except ventilation duct’s height is reduced while its width is extended for covering an entire room. This strategy requires a room with adequate floor-to-ceiling height for installing ventilation duct and elevating the floor.

163
With full-width and reduced-height exterior louvers, this strategy allows for a convenience in façade design and daylighting enhancement.
Figure 132: Natural Ventilation Design Strategy 2
Natural Ventilation Design Strategy 3
This strategy is derived from Natural Ventilation Design Scheme 2 in which the ventilation ducts are eliminated while the corridor is utilized as a longitudial ventilation corridor and connected to two ventilation shafts at the its ends. This strategy is applicable to an area where wind-driven pressure difference is insufficient for cross ventilation due to improper building orientation relative to the prevailing wind direction. This strategy also helps to eliminate the use of ventilation ducts set above occupied spaces. However, the sharing corridor might cause indoor noise traveling between rooms via the corridor or from the corridor into rooms.
Figure 133: Natural Ventilation Design Strategy 3
Natural Ventilation Design Strategy 4
Each room is hooked to a separate vertical ventilation shaft in the service shaft (similar to the one of HIG building). This strategy was approved its better performance over Strategy 3 for reducing the leghth of ventilation path, resulting in less pressure loss by ventilation ducts’ friction. This strategy also helps to mitigate indoor noise problem as wll as eliminates the use of ventilation ducts set above occupied spaces.

164
Figure 134: Natural Ventilation Design Strategy 4
Natural Ventilation Design Strategy 5
Figure 135: Natural Ventilation Design Strategy 5
This strategy is similar to Strategy 4, except its ventialtion shafts are placed at the exterior façades. This configuration is sometimes necessary when placement of internal ventilation shafts is impractical. External ventilation shafts and ventilation ducts, however, might impact on architectural building façade design and daylight performance.

165
Mixed Natural Ventilation Design Strategy
This strategy combines the above strategies, applied on different floors and based on their height, which is associated to wind-driven forces. The top floor, with sufficient wind-driven pressure difference, can be applied by simple cross ventilation while the rest might need the supplementation of ventilation shafts to utilize the negative pressure at their outlet openings to suck the air out. Internal ventilation shafts helps to eliminate the use of ventilation duct set above occupied spaces on the third floor. The first and second floor, however, set ventilation sharts at the ouside, in order to avoid their occupation of the corridor space.
Figure 136: Mixed Natural Ventilation Design Strategy

166
BIBLIOGRAPHY Abdullah, Abd Halid, and Fan Wang. “Design and Low Energy Ventilation Solutions for Atria in the Tropics.” Sustainable
Cities and Society 2, no. 1 (February 2012): 8–28.
Allard, Francis, and Mat Santamouris, eds. Natural Ventilation in Buildings: A Design Handbook. London: James & James (Science Publishers) Ltd., 1998.
ANSI/ASHRAE. “ASHRAE 55-2010: Thermal Environmental Conditions for Human Occupancy”. American Society of Heating, Cooling and Air-Conditioning Engineers, Inc, 2010.
“ASHRAE Standard 62.1-2010: Ventilation for Acceptable Indoor Air Quality”. American Society of Heating, Cooling and Air-Conditioning Engineers, Inc, 2010.
Arnold, Chris. “Building Envelope Design Guide - Introduction.” Whole Building Design Guide (WBDG), 2009. http://www.wbdg.org/design/env_introduction.php (accessed April 20, 2012).
Arundel, Anthony V., Elia M. Sterling, Juith H. Biggin, and Theodor D. Sterling. “Indirect Health Effects of Relative Humidity in Indoor Environments.” Environmental Health Perspectives 65, no. 3 (March 1986): 351–61.
ASHRAE. ASHRAE 2008 Handbook HVAC Systems and Equipment. ASHRAE 2008 Handbook HVAC Systems and Equipment. American Society of Heating, Cooling and Air-Conditioning Engineers, Inc, 2008.
“ASHRAE 2009 Fundamentals”. American Society of Heating, Cooling and Air-Conditioning Engineers, Inc, 2009.
Axley, James W. “Application of Natural Ventilation for U. S. Commercial Buildings Climate Suitability Design Strategies & Methods Modeling Studies Application of Natural Ventilation for U. S. Commercial Buildings Climate Suitability Design Strategies & Methods Modeli.” Technology. National Institute of Standards and Technology, 2001.
A’zami, A. “Badgir in Traditional Iranian Architecture.” 1021–1026. Santorini Greece: International Conference “Passive and Low Energy Cooling for the Built Environment”, 2005.
Boutet, Terry S. Controlling Air Movement: A Manual for Architects and Builders. New York: McGraw-Hill, 1987.
Bry-Air Inc. “Desiccant Dehumidification Vs. Mechanical Refrigeration”, n.d. http://www.bry-air.com/applications/moisture_regain_prevention/desiccant-dehumidification-vs-mechanical-refrigeration.html (accessed April 20, 2012).
Burge, P S. “Sick Building Syndrome.” Occupational and Environmental Medicine 61, no. 2 (February 1, 2004): 185–190.
Caciolo, Marcello, Dominique Marchio, and Pascal Stabat. “Survey of The Existing Approaches to Assess and Design Natural Ventilation and Need for Further Developments.” In Building, 220–227. Glasgow: Eleventh International IBPSA Conference, 2009.
Chong, Cedric D.O. Benchmarking Study. Honolulu: Hawaiian Electric Company, n.d.
CIBSE. “Energy Efficiency in Buildings: CIBSE Guide F”. London: The Chartered Institution of Building Services Engineers, 2004.
Costola, D, B Blocken, and Hensen J. L. M. “Overview of Pressure Coefficient Data in Building Energy Simulation and Airflow Network Programs.” Building and Environment (2009).
Crawley, Drury B, Linda K Lawrie, Curtis O Pedersen, Frederick C Winkelmann, Michael J Witte, Richard K Strand, Richard J Liesen, et al. “EnergyPlus Structure.” In SimBuild 2004. IBPSA-USA National Conference, 2004.
D. L. Adams Associations. Acoustical Modeling for Naturally Ventilated Core Learning Spaces, 2011.

167
De Dear, Richard, and G.S. Brager. “Developing an Adaptive Model of Thermal Comfort and Preference”. Center for the Built Environment UC Berkeley, 1998.
Dear, Richard J De, and Gail S Brager. “Thermal Comfort in Naturally Ventilated Buildings: Revisions to ASHRAE Standard 55.” Energy and Buildings 34 (2002): 549–561.
Department of Energy. “Energy Plus”, 2011. http://apps1.eere.energy.gov/buildings/energyplus/ (accessed April 20, 2012).
Emmerich, Steven J, W Stuart Dols, and James W Axley. “Plan for Design and Analysis Tools Natural Ventilation Review and Plan for Design and Analysis Tools.” Director. National Institute of Standards and Technology, 2001.
Energy Star. “Dehumidifier Basics”, n.d. http://www.energystar.gov/index.cfm?c=dehumid.pr_basics_dehumidifiers (accessed April 20, 2012).
EnergyPlus. Use EnergyPlus for Compliance: Hints on Using EnergyPlus for Compliance with Standards and Rating Systems, 2011.
Ernest Orlando Lawrence Berkeley National Laboratory. “EnergyPlus Engineering Reference”. The US. Department of Energy, 2012.
Fange, P. O. Thermal Comfort. McGraw-Hill, 1970.
Field, C D, and J Digerness. “Acoustic Design Criteria for Naturally Ventilated Buildings.” In Acoustics 08, 5375–5379. Paris: Acoustics 2008, 2008.
Field, Chris. “Satisfactory Background Noise Levels in Naturally Ventilated Buildings - Challenging Acoustic Criteria Used in the Past.” In Proceedings of 20th International Congress on Acoustics, ICA 2010. Sydney, 2010.
Finn, Donal P., Darragh Connolly, and Paul Kenny. “Sensitivity Analysis of a Maritime Located Night Ventilated Library Building.” Solar Energy 81, no. 6 (June 2007): 697–710.
Ghiaus, Cristian, and Francis Allard, eds. Natural Ventilation in the Urban Environment: Assessment and Design. Natural Ventilation in the Urban Environment: Assignment and Design. London: Earthscan, 2004.
Givoni, B. Man, Climate and Architecture. 2nd ed. London: Applied Science Publishers Ltd., 1976.
Gratia, Elisabeth, and Andrè De Herde. “Guidelines for Improving Natural Daytime Ventilation in an Office Building with a Double-skin Facade.” Solar Energy 81, no. 4 (April 2007): 435–448.
Gratia, Elisabeth, and André De Herde. “The Most Efficient Position of Shading Devices in a Double-skin Facade.” Energy and Buildings 39, no. 3 (March 2007): 364–373.
Group 70 International. Long Range Development Plan: University of Hawaii, Mānoa Campus 2007 Update. Honolulu, 2007. http://manoa.hawaii.edu/planning/LRDP/lrdp.html.
Gu, Lixing. “Airflow Network Modeling in EnergyPlus.” In Building Simulation. Florida Solar Energy Center/University of Central Florida, 2007.
Haas, Anne, Andreas Weber, Viktor Dorer, Werner Keilholz, and Roger Pelletret. “COMIS V3.1 Simulation Environment for Multizone Air Flow and Pollutant Transport Modelling.” Energy and Buildings 34, no. 9 (October 2002): 873–882.
Harriman, Lew, Geoff Brundrett, and Reinhold Kittler. Humidity Control: Design Guide For Commercial and Institutional Buildings. American Society of Heating, Cooling and Air-Conditioning Engineers, Inc, 2008.
Hazim B. Awbi. Ventilation of Buildings. 2nd ed. New York: Spon Press, n.d.
Hughes, Ben Richard, and Mak Cheuk-Ming. “A Study of Wind and Buoyancy Driven Flows Through Commercial Wind Towers.” Energy and Buildings 43, no. 7 (July 2011): 1784–1791.
168
Ken Yeang Architect. “Roof-roof House in Kuala Lumper, Malaysia”, 1985. http://vi.sualize.us/view/4d9486c34266e8f1372172075bbbd04d/ (accessed April 20, 2012).
Khanal, Rakesh, and Chengwang Lei. “Solar chimney—A Passive Strategy for Natural Ventilation.” Energy and Buildings 43, no. 8 (August 2011): 1811–1819.
Kleiven, Tommy. “Natural Ventilation in Buildings: Architectural Concepts, Consequences and Possibilities”. Norwegian Unversity of Science and Technology, 2003.
Kowalski, Wally, and Eric Bumett. “Mold and Buildings.” The Pennsylvania Housing Research Center. The Pennsylvania Housing Research Center, n.d. http://www.engr.psu.edu/phrc/pubs/bb0301.pdf (accessed April 20, 2012).
Krausse, Birgit, Malcolm Cook, and Kevin Lomas. “Environmental Performance of a Naturally Ventilated City Centre Library.” Energy and Buildings 39, no. 7 (July 2007): 792–801.
Lechner, Norbert. Heating, Cooling, Lighting: Design Methods for Architects. London: John Wiley & Sons Ltd., 2001.
Liddament, Martin W. A Guide to Energy Efficient Ventilation. Coventry: The Air Infiltration and Ventilation Center, 1996.
Liu, Pei-Chun, Hsien-Te Lin, and Jung-Hua Chou. “Evaluation of Buoyancy-driven Ventilation in Atrium Buildings Using Computational Fluid Dynamics and Reduced-scale Air Model.” Building and Environment 44, no. 9 (September 2009): 1970–1979.
Loisos + Ubbelohde. Site Collected Data Compared to Airport Data and TMY Data, 2011.
Malkawai, Ali, and Godfried Augenbroe, eds. Advanced Building Simulation. New York: Spon Press, 2004.
Morse, Roger. “Indoor Air Quality and Mold Prevention of Building Envelope.” Whole Building Design Guide (WBDG), 2009. www.wbdg.org/resources/env_iaq.php (accessed April 02, 2012).
NAM (Newcomb Anderson McCormick). Strategic Energy Plan University of Hawai’i at Mānoa, 2011.
National Institute of Building Sciences. “High Performance Building Council”, n.d. http://www.nibs.org/index.php/hpbc/about/ (accessed April 20, 2012).
Neufert, Ernest, and Peter Neufert. Neufert: Architect’s Data. Edited by Bousmaha Baiche and Nicholas Walliman. 3rd ed. Oxford: Blackwell Science, 2002.
Oak Ridge National Laboratory and the Fraunhofer Institute for Building Physics. “WUFI”, n.d. http://www.hoki.ibp.fhg.de/wufi/wufi_frame_e.html (accessed April 20, 2012).
Parkin, P.H., H.R. Humphrey, and J.R. Cowell. Acoustics, Noise and Buildings. 4th ed. London: Faber and Faber, 1979.
Pesaran, A. Ahmad. “A Review of Desiccant Dehumidification Technology.” In Proceedings of Electric Dehumidification: Energy Efficient Humidity Control for Commercial and Institutional Buildings Conference. New Orleans: National Renewable Energy Laboratory, 1993.
Prowler, Don. “Mold and Moisture Dynamics.” Whole Building Design Guide (WBDG), 2010. www.wbdg.org/resources/moisturedynamics.php.
De Salis, M.H.F., D.J. Oldham, and S. Sharples. “Noise Control Strategies for Naturally Ventilated Buildings.” Building and Environment 37, no. 5 (May 2002): 471–484.
Santamouris, M., and D. Asimakopoulos, eds. Passive Cooling of Buildings. London: James & James (Science Publishers) Ltd., 1996.
Seppanen, O, and W J Fisk. “Relationship of SBS-Symptoms and Ventilation System Type in Office Buildings”. Lawrence Berkeley National Laboratory, 2002.

169
Stein, Bemjamin. Building Technology: Mechanical and Electrical Systems. 2nd ed. New York: John Wiley & Sons Ltd., 1997.
Teal Products. “Electric Window Controls”, n.d. http://www.windowopeners.co.uk (accessed April 20, 2012).
The Office of the Assistant Vice Chancellor for Planning. “Kuykendall Hall: Renovation Project Update”, 2011. manoa.hawaii.edu/chancellor/.../projects/Kuy_Monitoring.pdf (accessed April 20, 2012).
The U.S Environmental Protection Agency. “Green Building”, n.d. http://www.epa.gov/greenbuilding/index.htm.
U.S. Department of Energy. “2010 Buildings Energy Data Book”, 2011.
Achieving a Net Zero Energy Retrofit in a Humid, Temperate Climate - Lessons from the University of Hawai’i at Mānoa, n.d. http://apps1.eere.energy.gov/buildings/publications/pdfs/alliances/uhm_net_zero_case_study.pdf.
Walker, Andy. “Natural Ventilation.” Whole Building Design Guide (WBDG), 2010. http://www.wbdg.org/resources/naturalventilation.php (accessed April 20, 2012).
Westphalen, Detlef, and Scott Koszalinski. Energy Consumption Characteristics of Commercial Building HVAC Systems Volume II : Thermal Distribution , Auxiliary Equipment , and Ventilation. Vol. II, 1999.
www.EngineeringToolBox.com. “Air Change Rates for Typical Rooms and Buildings”, n.d. http://www.engineeringtoolbox.com/air-change-rate-room-d_867.html (accessed April 20, 2012).
Zhong, Zhipeng, Lignfeng Ma, and E. James Braun. “MOIST 4.02 and BMOIST 1.0”. Ray W. Herrik Laboratories Purdue University, 2008. https://engineering.purdue.edu/MOIST/.
“Double-skin Facade.” Wikipedia, n.d. http://en.wikipedia.org/wiki/Double-skin_facade (accessed April 2, 2012).
“Intelligent Controls”, n.d. http://www.passivent.com/intelligent_controllers.html (accessed February 20, 2012).
Natural Ventilative Cooling of Buildings: Design Manual 11.02. Department of the Navy, Naval Facilities Engineeringn Command, 1986.
“Solar Reflectance Index and Cool Roofs”, 2008. http://www.buildinggreen.com/auth/article.cfm/2008/1/1/Solar-Reflectance-Index-and-Cool-Roofs/ (accessed March 25, 2012).
“Sydney’s First Major ‘double-skin’ High-rise”, n.d. http://redchalksketch.wordpress.com/2011/02/14/sydney’s-first-major-“double-skin”-high-rise/ (accessed January 29, 2012).
“The Encyclopedic Reference to EnergyPlus Input and Output”. Enrest Orlando Lawrence Berkely National Laboratory, 2012.
“UH Mānoa Partners with White House on Energy Savings for Hawai’i”, 2011. http://www.uhm.hawaii.edu/news/article.php?aId=4822 (accessed April 20, 2012).
University of Hawaii Kuykendall Hall Renovation: Mechanical Basis of Design, 2011.
“Weather and Climate.” Waianae Ecological Characterization, n.d. http://www.state.hi.us/dbedt/czm/initiative/wec/html/weather/index.htm (accessed April 20, 2012).
“Window Technologies: Low-e Coatings”, n.d. http://www.efficientwindows.org/lowe.cfm (accessed April 20, 2012).