optimization of offshore oil&gas separation train · and temperature values for an offshore...
TRANSCRIPT

Student Report
Optimization
of
Offshore Oil&Gas Separation Train
Master Thesis Project
K10k-3-F17
Aalborg University Esbjerg
Niels Bohrs vej 8, 6700 Esbjerg


i
Title Page
Title: Optimization of Offshore Oil&Gas Separation Train
Supervisor: Marco Maschietti
Group: K10k-3-F17
Project Period: 01/02/2017 – 08/06/2017
Institution: Aalborg University Esbjerg
Student:
Pasquale Antonino Petrarulo (20157574)


iii
Abstract
The aim of this project was to develop optimization strategies to find the optimal operating pressure
and temperature values for an offshore Oil&Gas separation train, in order to maximize the recovery
of C3+ hydrocarbons in a stable Crude Oil stream at storage conditions, and the recovery of C1&2
hydrocarbons in Gas phase.
Three different kinds of petroleum reservoir fluids were chosen for this study: Gas Condensate, Near
Critical and Black Oil mixtures (ascending molecular weight order). Moreover, 60 bar and 70°C, 30
bar and 40°C were selected as feed stream flowing conditions, while 1.2 bar and 15°C were fixed as
stock tank pressure and temperature. The Original Optimizer of the Aspen HYSYS process simulator
was used as optimization tool.
Two different simulation flowsheets were developed: a separation train composed by 2 two – phase
separators and a sequence of 3 two – phase separators, before the storage tank. It was assumed that
pressure and temperature of the first separator of the train are fixed and equal to the reservoir fluids
flowing conditions. The stability constraint of the optimization was decided to be expressed by the
bubble point pressure of the Crude Oil delivered to the stock tank: this pressure must be equal or
lower than the 70% of the stock pressure condition (0.85 bar).
Performing the constrained optimization by mean of the BOX method subroutine of Aspen HYSYS,
it results that the production of Crude Oil, matching at the same time the recovery requirements and
the stability constraint, can be realized setting the pressure of the last separator equal to the tank
pressure and the temperature higher than the one at stock tank. Moreover, when using a sequence of
3 separators, large pressure drops should be realized between the first and the second separator.
As the number of separators increases, the recovery of C3+ hydrocarbons increases according to the
kind of mixture and the first separator operating conditions: for Gas Condensate – like fluids the
recovery increases from 19.1% to 25.3%, for Near Critical – like streams from 6.2% to 7.7%, and for
Black Oil – like mixtures from 0.01% up to 2.4%.
The simulation of the separation train does not highlight a significant change of the optimal pressures
and temperatures, when varying the composition of the reservoir fluid processed. On the other hand,
the heavier the fluid processed, the higher the recovery of C3+ hydrocarbons in Crude Oil and the
lower the amount of propane and heavier hydrocarbons to be recovered from the Gas phase.


v
Preface & Acknowledgments
This is a 10th semester Master Thesis project, which was written in the spring semester of 2017 by a
student enrolled in the Chemical Engineering Master’s programme at Aalborg University Esbjerg.
The list of references can be found on page 45. References are enclosed into round brackets, showing
authors and publication year.
In this report, decimals are separated by a dot.
After References, Appendix can be found. The Appendix includes the tables containing the data
generated during the different study cases developed.
I would like to express my gratitude to my supervisor, Dr. Marco Maschietti, whose patient and wise
guidance throughout this project allowed me to deal with and solve any problem in front of me,
learning from each new challenge.
I would like to thank all my university fellows, near and far away friends, uncles, aunts and cousins
from Denmark to Italy and back, for their support during the development of my Master’s Thesis and
the help through my path in these two years.
I especially and above all want to thank my family: Petrarulo Igino Pasquale Mauro, Petrarulo
Savino and Iacoviello Anna, Petrarulo Mariarosaria and Elena, Colonna Domenico. Thank you
all for the support and love you have for me every day of my life.
Dedicated to Albano Mariarosaria,
your love is always cornerstone of my life


vii
Table of Contents
Chapter 1…………………………………………………………………………1
1.1 Introduction……………………………………………………………………………….1
1.2 Petroleum Reservoir Fluids………………………………………………………………2
1.3 Offshore Facilities………………………………………………………………………...7
1.3.1 Separation Process………………………………………………………………….9
1.3.2 Oil Treatment & Storage………………………………………………………… .11
1.3.3 Gas Treatment……………………………………………………………………..13
1.3.4 Water Treatment…………………………………………………………………...14
1.4 Project Delimitation……………………………………………………………………..15
1.5 Project Definition………………………………………………………………………..17
Chapter 2……………………………………………………………………….. 19
2.1 Oil&Gas Separation Train Optimization………………………………………………...19
2.2 Optimization Strategies…………………………………………………………………..27
Chapter 3………………………………………………………………………...33
1. 3.1 Optimization Results and
Discussion……………………………………………………33
3.1.1 Case Study 1: Sequence of Two Separators……………………………………….33
3.1.2 Case Study 2: Sequence of Three Separators……………………………………...37
Conclusions………………………………………………………………………41
Recommendations……………………………………………………………….43
References………………………………………………………………………..45
Appendix…………………………………………………………………………47


1
Chapter 1
1.1. Introduction
Starting from the 19th century, fossil fuels became the main source of energy (by mean of
combustion), due to the development and rise of new technology in many fields, but especially in
transportations, and because of their relative low price. Fossil fuels include Crude Oil, Gas and Coal
supplying the 41%, 24% and 23% of the energy consumption worldwide respectively (The Ecology
Global Network, 2010).
Furthermore, several commonly used materials are produced by processing chemicals derived from
Crude Oil. Important examples are plastics, which are high molecular weight organic polymers,
where the main chain often has a petrochemical as principal compound. One of the most widely used
polymers is polyester (ester functional group in the main chain), commonly employed to produce
fabrics for clothes. Other examples are fertilizers and common chemicals like detergents, solvents
and adhesives. The former consists in compounds that can improve the quality of the soil enhancing
plants growth. Urea (CO(NH2)2) is an important fertilizer obtained by processing ammonia (NH3),
which is produced through hydrogen derived from hydrocarbons. The latter are derived from olefins,
which are products of the fluid catalytic cracking of Crude Oil fractions (Petrarulo, 2016).
Figure 1. Oil&Gas Industry (adapted from image of (Piping Engineering, 2015))

As shown in Figure 1, Oil&Gas Industry involves the operations of exploration and drilling of wells,
which are spread worldwide, and the possible consequent extraction of the so – called petroleum
reservoir fluids and their processing for the delivery of different products.
North Sea Oil&Gas industry began in the 1960’s with the discovery of the first significant reservoirs,
but that area became a key non – OPEC (Organization of the Petroleum Exporting Countries) region
just between 1980’s and 1990’s. Indeed, in those years major projects for the exploitation of wells
came on stream. Because of the large depths of the North Sea reservoirs and the climate inhospitality
of the region, the Oil&Gas industry requires high – technology offshore facilities in this area.
Therefore, production results to have a relatively high cost. Despite that, the political stability and the
ideal position respect to the European market allowed this area to become a major producer in the
Oil&Gas market. Currently, North Sea production of Crude Oil and Natural Gas reached a plateau
and a long – term decline is expected to begin. According to CIA World Factbook, in 2008 North Sea
proven Crude Oil reserves accounted for about 11.2 billion of oil barrel: 59% is owned by Norway,
the 30% belongs to the UK and the 7% is disposed by Denmark. The remaining 4% is shared between
Germany and Holland. In the near future, the improvement of the Crude Oil recovery, together with
new projects and the discovery of new sizeable volumes of reservoir fluids, will delay the downward
trend of Oil&Gas Industry in the North Sea (Offshore Center Danmark, 2010).
1.2. Petroleum Reservoir Fluids
Petroleum reservoir fluids are mixtures of thousands of components, consisting mainly in
hydrocarbons and small amounts of inorganic chemicals, among which water, carbon dioxide (CO2),
nitrogen (N2), hydrogen sulphide (H2S) are the most common (Pedersen & Christensen, 2007).
Those fluids originated from the bodies of single celled aquatic organisms, which are the progenitors
of the current algae, plankton etc. The process of petroleum formation starts with the burial of these
organisms under layers of clay and sediments, forming a matrix made up of organic matter and clay.
This matrix is slowly turned into a new material called kerogen. If the deposition of clay and
sediments continues, kerogen is entombed deeper and deeper, with a corresponding increase of
pressure and temperature. For periods of time long enough (millions of years) and between 760 m
and 4900 m depth, kerogen transformation into oil and gas occurs. Because of differences of pressure,
petroleum fluid starts to flow laterally, following the path formed by permeable rocks, until reaching
dome structures, called anticlines, where it is trapped. Consequently, petroleum starts to accumulate
over time (formation of true reservoirs can thus take eons). Buoyancy forces in the reservoirs produce
a separation in the fluids, where water disposes in the bottom while natural gas floats on the top. If
pressure is high enough, part of the gas is dissolved in petroleum fluids (Tabak, 2009).
Petroleum reservoir fluids can be classified according to the critical temperatures of those
hydrocarbon multicomponent mixtures compared to the temperature of the reservoir. Indeed,
considering a phase envelope in a PT diagram, critical temperature is the meeting point of bubble and
dew pressure branches.

3
Figure 2. Structure of a Typical Petroleum Reservoir Fluid Well (Tabak, 2009)
Therefore, varying the composition of a well fluid, the critical temperature and the branches of the
phase envelope change accordingly (Figure 3). While reservoir temperature (Tres and T′res in Figure
3) remains almost constant during exploiting, extraction of fluids from wells produces a decrease of
pressure inside the reservoir. Thus, extracting matter from the reservoir, the position of the system in
the PT diagram moves approaching one of two branches. This means that the number of phases in the
reservoir can change. Four main groups of fluids can be identified (Pedersen & Christensen, 2007):
• Natural Gas: the reservoir fluid is gas phase and pressure decrease does not produce the
formation of a new phase
• Gas Condensate: the reservoir fluid is a gas phase mainly. Pressure decrease leads to meet
the dew point pressure branch, therefore the formation of a liquid phase occurs.
• Near Critical: the reservoir fluid is mainly a liquid phase. If the well temperature is smaller
than mixture critical temperature, decreasing pressure approaches bubble point pressure
branch, meaning a gas phase is forming. If well temperature is higher than mixture critical
temperature, decreasing pressure approaches dew point pressure branch, meaning a second
liquid phase is forming.
• Black Oil: the reservoir fluid is mainly a liquid phase and pressure decrease always leads to
meet the bubble point pressure branch, and thus to the formation of a gas phase.
Generally speaking, the lightest hydrocarbons present in this kind of fluids are methane (CH4), ethane
(C2H6) and propane (C3H8), which are referred to as C1, C2 and C3 respectively. Heavier hydrocarbons
are similarly referred to the same way using the number of carbon atoms.
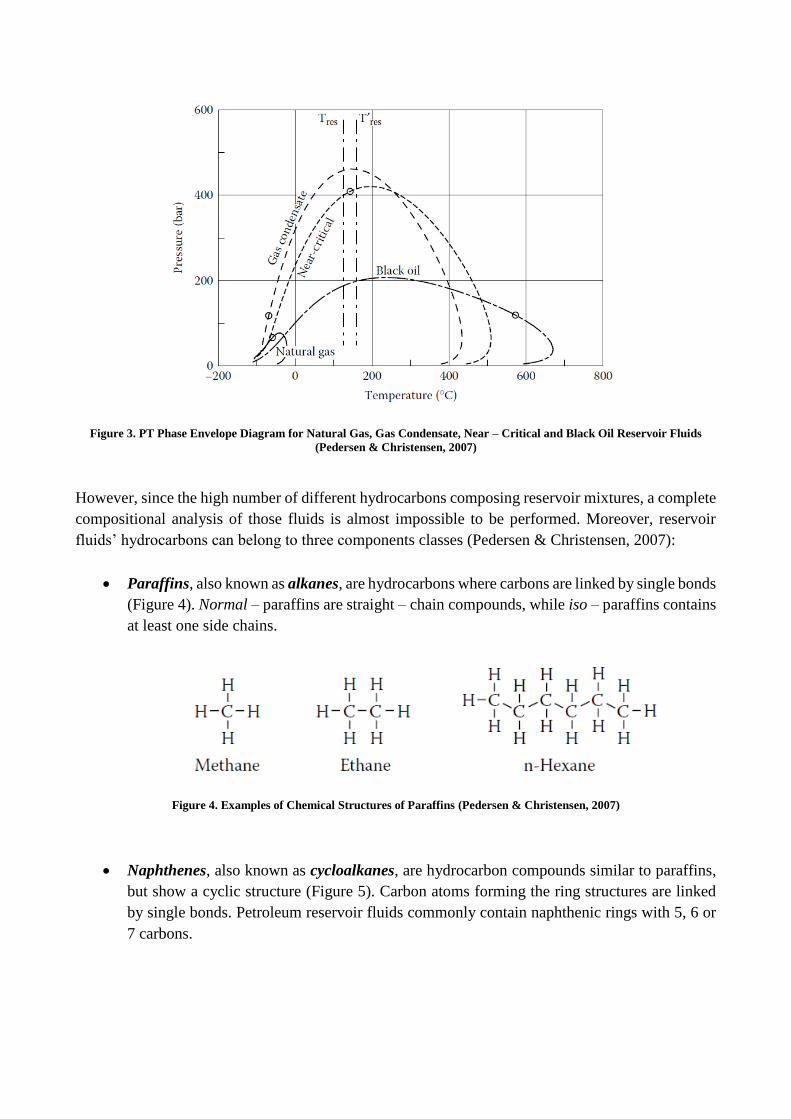
Figure 3. PT Phase Envelope Diagram for Natural Gas, Gas Condensate, Near – Critical and Black Oil Reservoir Fluids
(Pedersen & Christensen, 2007)
However, since the high number of different hydrocarbons composing reservoir mixtures, a complete
compositional analysis of those fluids is almost impossible to be performed. Moreover, reservoir
fluids’ hydrocarbons can belong to three components classes (Pedersen & Christensen, 2007):
• Paraffins, also known as alkanes, are hydrocarbons where carbons are linked by single bonds
(Figure 4). Normal – paraffins are straight – chain compounds, while iso – paraffins contains
at least one side chains.
Figure 4. Examples of Chemical Structures of Paraffins (Pedersen & Christensen, 2007)
• Naphthenes, also known as cycloalkanes, are hydrocarbon compounds similar to paraffins,
but show a cyclic structure (Figure 5). Carbon atoms forming the ring structures are linked
by single bonds. Petroleum reservoir fluids commonly contain naphthenic rings with 5, 6 or
7 carbons.

5
Figure 5. Examples of Chemical Structures of Naphtenes (Pedersen & Christensen, 2007)
• Aromatics are hydrocarbon chemicals containing one or more hexagonal structures, where
carbon atoms are connected by alternating double and single bonds (Figure 6). The simplest
aromatic compound is benzene (C6H6), but in reservoir fluids it is common to find polycyclic
aromatics like naphthalene (C10H8).
Figure 6. Examples of Chemical Structures of Aromatics (Pedersen & Christensen, 2007)
Therefore, starting from C6, it is possible to find different kinds of hydrocarbons with the same
number of carbon atoms. Generally speaking, densities of hydrocarbons with the same number of
carbon atoms increase according to the scheme:
𝑃 → 𝑁 → 𝐴
Moreover, considering the data regarding properties of some reservoir fluids constituents listed in
Table 1, physical properties of reservoir fluids components can vary in a wide range.

Table 1. Physical Properties of some Reservoir Fluids Components
Component Formula Molecular
Weight
(g/mol)
Normal
Boiling
Point (°C)
Density at
1 atm and 20°C
(g/cm3)
Critical
Temperature
(°C)
Critical
Pressure
(bar)
Acentric
Factor
Nitrogen N2 28.01 -195.8 0.0012 -147 33.9 0.04
Carbon Dioxide CO2 44.01 -78.5 0.0019 31.1 73.8 0.225
Methane CH4 16.04 -161.6 0.0007 -82.6 46 0.008
Ethane C2H6 30.07 -87.6 0.0028 32.3 48.8 0.098
Propane C3H8 44.09 -42.1 0.002 96.7 42.5 0.152
n – Hexane C6H14 86.17 68.8 0.659 234.3 29.7 0.296
Cyclohexane C6H12 84.16 80.7 0.779 280.4 40.7 0.212
Benzene C6H6 78.11 80.1 0.885 289 48.9 0.212
n – Decane C10H22 142.28 174.2 0.730 344.6 21.2 0.489
Naphthalene C10H8 128.17 218 0.971 475.3 40.5 0.302
A reliable characterization of petroleum reservoir fluids can be obtained grouping hydrocarbons
heavier than nC5 into cuts named carbon number fractions, based on their normal boiling points.
General cut points are fixed using n – paraffins boiling points: C6 fraction includes hydrocarbons
whose boiling point is between 0.5°C above the boiling point of nC5 and 0.5°C above the boiling
point of nC7. Similarly, C7 fraction includes hydrocarbons whose boiling point is between 0.5°C
above the boiling point of nC6 and 0.5°C above the boiling point of nC8, etc. The content of paraffins
(P), naphthenes (N) and aromatics (A) per each carbon number fraction cut is called PNA distribution,
and it can be used as reference to have an idea of the density of cuts and vice versa: the higher the
density, the more aromatic the cut and the higher the content of aromatics, the denser the carbon
faction.
Compositional analysis is carried out analysing the sample of the reservoirs, which can be taken in
the bottom of the well (single phase) or after a first separation made after the extraction (gas and
liquid sample). Both kind of samples are then flashed at standard conditions (1.01 bar, 288.15 K) and
the two phases are analysed separately. Gas – Chromatography (GC) and True Boiling Point (TBP)
are common analytical analysis used for the characterization of reservoir fluids samples. The former
is ideal for the gas phase: a small sample of the gas is injected in a GC column, which separates the
components showing a peak per each one on a chromatogram. Using proper detectors and performing
the analysis the right way, it is possible to identify and quantify each one component of the gas phase.
The TBP analysis is well suited for the characterization of the liquid phase: the samples’ components
are split based on their boiling points, identifying the different cuts whose molecular weight and
density is then measured. The distillation is performed at atmospheric pressure up to C10, afterwards
the pressure is lowered to 2.26 mbar, allowing the separation of the heavier hydrocarbons and
avoiding their thermal decomposition. The measurement of the molecular weight is performed
through the study of the freezing point depression phenomenon, using a suitable solvent. On the other
hand, density is usually measured by mean of densitometers (Pedersen & Christensen, 2007).
Pressure and temperature inside reservoirs depend on their depths and the heat exchange through their
walls, and needs to be measured case by case. Generally speaking, wells pressure can vary between
150 bar and 410 bar, while temperature rarely is higher than 100°C. At these conditions, the liquid
phase to be extracted contains water and absorbed gases (Society of Petroleum Engineers, s.d.).

7
After extraction, operating pressure and temperature of well fluids are lower than in the reservoir, and
the flow is a mixture of oil, gas and water. Therefore, a separation process is required to split the flow
into the different phases for the following processing.
1.3. Offshore Facilities
Offshore Crude Oil and Gas production involves facilities which allow the extraction of petroleum
reservoir fluids from beneath the sea, and to process them to separate Crude Oil from the Gas, whose
further treatment leads to the production of LNG and other products like propane, butane etc.
Oil&Gas production from subsea began in the 1950s, exploiting shallow reservoirs (200 m seabed
depth) using platforms built on the seabed using concrete and metal legs. Since the 1990s, companies
began to extract petroleum fluids from deeper reservoirs (300 m – 1500 m seabed depth). Nowadays,
reservoirs fluids are extracted from wells deep up to 3000 m – 3500 m under the seabed, accounting
for the 30% of the worldwide Crude Oil production and the 27% of the global Natural Gas production
(Total S.A., 2015).
Different kinds of offshore facilities can be employed, depending on size and the depth of seabed.
Common offshore structures are the following (Devold, 2013):
• Shallow Water Complex Platform: it is used for water depths up to 100 m and it is composed
by independent platforms connected using gangway bridges (Figure 7). Each one of those
units includes a different part of the whole process and utilities.
Figure 7. Shallow Water Complex Platform (Csanyi, 2017)

• Gravity Base Platform: it consists in a platform placed on fixed and large steel reinforced
concrete structures, built on the seabed (Figure 8). It is used in the case of large fields with a
water depth between 100 m and 500 m and it includes Crude Oil storage tanks placed on the
bottom of the concrete support legs.
Figure 8. Gravity Base Platform (Csanyi, 2017)
• Floating Production Systems: these are production sites where facilities are placed on
floating structure (Figure 9). The most common are the following:
- Floating Production Storage and Offloading (FPSO): it is an independent structure, where
the Crude Oil produced is offloaded periodically through a shuttle tanker. They can
produce between 10000 and 200000 barrels of Crude Oil per day.
- Tension Leg Platform (TLP): it is a floating structure hold in a specific position by
tensioned tendons, fixed on the seabed through several piles. It can be used for a wide
range of water depths up to 2000 m.
- SPAR: it is a structure consisting in a floating cylindrical hull which supports a fixed
platform.

9
• Subsea Production Systems: these structures are placed on the sea floor and can only extract
and transport reservoir fluids towards other facilities for the separation, through undersea
pipelines (Figure 9). Subsea systems are commonly used for water depths of 500 m or more.
Figure 9. Floating & Subsea Production Systems (American Petroleum Institute, 2017)
Offshore production facilities have different constraints concerning costs, space availability and
environmental issues. Indeed, each platform is built on purpose, based on the reservoir fluid(s)
expected to receive as feed and the kind of well to be exploited, making investments for billions of
dollars. Therefore, choices regarding production equipment need to be carefully considered.
Moreover, since space is limited on offshore platforms and enlargements are not likely possible after
building, the equipment has to be as compact and lightweight as possible. Furthermore, blowout risks
with consequent environmental damage are important possible events on this kind of facilities. It is
thus important to foresee potential issues and plan emergency cases solutions and constant vigilance
( (Magalhães, et al., 2015), (Total S.A., 2015)).
1.3.1. Separation Process
The target of the separation of reservoir fluids from undersea wells is to produce a Gas stream as
much free as possible of C3+ hydrocarbons and a Crude Oil stable at storage conditions. Indeed, the
Crude Oil produced must not undergo to any vaporization when delivered into the storage tank and
in the event of small variations of storage pressure and/or temperature.

As it is shown in Figure 10, those aims are often accomplished by progressively reducing pressure
and temperature of the fluid, through a multistage separation consisting in a sequence of two or three
separators, which forms a configuration named separation train. The first separator is usually a vessel
where liquid (Crude Oil), Gas and water are separated mainly by density, at reservoir fluid pressure
and temperature, unless different conditions of pressure and temperature are required. Gas phase goes
to the top of the vessel and is sent to the gas treatment unit, where dehydration, C3+ condensate
removal and other processes are performed. Water of the reservoir fluid processed goes to the bottom
of the separator and then routed to the produced water treatment unit, before it is available for
reinjection in the well or disposal in the sea. Crude Oil from the first separator flows to the second
separator, where pressure and/or temperature are reduced. This way a minor further fraction of gas is
released by the vaporization of the light hydrocarbons still present in the liquid phase. Moreover, a
further small amount of water is removed from the liquid and is combined with the water coming out
of the first separator. A third separator might be required for a further separation to meet the liquid
product requirements, regarding stability and recovery, and further reduce water content. Gas released
from the second and, eventually, third separator is compressed and mixed with the gas coming out
from the first separator. The Crude Oil produced is then stored into tanks, before being routed towards
the oil treatment unit for the removal of the remaining water and salts, and then to the refinery plant
(Piping Engineering, 2015).
Figure 10. Oil&Gas Separation Train

11
Separators to be used are primarily classified depending on the number of phases they can manage.
According to this principle, it is possible to distinguish two kinds of separators commonly used in
Oil&Gas Industry (Piping Engineering, 2015):
• Two Phase Separator: it separates the reservoir fluid flow into a liquid and a gas phases.
• Three Phase Separator: it splits the well fluid into oil, gas and water flows, mainly by density.
Furthermore, separators can be distinguished into two main different classes depending on their
configuration (Piping Engineering, 2015):
• Horizontal Separator: it is a common choice for three phase separations and reservoir fluids
with a low amount of gas with respect to the amount of oil (Gas Oil Ratio – GOR). It is easy
to install and provides a sufficient residence time for the liquid – liquid split, with a large area
for the liquid phase that reduces the turbulence through a better foam dispersion. However,
this kind of vessel is difficult to clean from deposits of sand, wax, paraffins etc., the liquid
level control results to be more critical and only a portion of the vessel shell is available for
gas release.
• Vertical Separator: it is a well – suited choice in the event of reservoir fluids with a high GOR
and for two – phase separations. Despite the difficulty of the installation, the bigger diameter
required for the same amount of gas managed by a horizontal separator and the higher cost,
the separation of the oil from gas is easier due to the complete vessel diameter available for
the gas flowing to the top and liquid level control is less critical. Moreover, the removal of
deposits results to be easier.
1.3.2. Oil Treatment & Storage
After the separation train, Crude Oil still contains up to the 2% of water together with soluble and
insoluble salts. Additional treatments are required to remove those salts and water traces since they
are likely to form a more and more stable emulsion and sediments over time, causing issues as
corrosion, incrustation and bubbles in the pipeline during transportation of the oil.

Crude Oil dehydration on offshore facilities is commonly performed by injecting the proper amount
of a demulsifier chemical and introducing the oil into an electrostatic coalescer. The target is to reduce
water content up to 0.5%. The demulsifier reduces the interfacial tension between oil (continuous
phase) and water (dispersed phase), destabilizing the emulsion. At the same time, the electrostatic
coalescer applies an electrostatic field to the fluid, charging the water droplets and forming dipoles
that enhance water particles coalescence. Moreover, fluid heating allows to reduce oil viscosity,
allowing water droplets to move more easily and collide with higher forces. This dehydration
technique is the most widely used since it allows to minimize the space and weight required for the
operation equipment, and the amount and cost of the demulsifier to be used.
Crude Oil desalting is carried out by mean of mixing the proper amount of fresh water with
dehydrated oil, dissolving the salt crystals. Afterwards, a second dehydration produces an oil
containing a less saline and proper amount of water. In particular, salts content needs to be between
4.5 kg and 13.6 kg per thousand Crude Oil barrels.
Physical properties and some compositional aspects of the Crude Oil after separation and treatment
can vary in a wide range. Those physical and compositional features are included in the crude assays,
which are reports used for sales purposes by the producers. Typical main characteristics listed in those
assays are the following (Piping Engineering, 2015):
- Specific gravity (SG) & API gravity: they are two expressions of Crude Oil density
commonly used in oil industry
𝑆𝐺 = 𝜌𝐶𝑟𝑢𝑑𝑒 𝑂𝑖𝑙
𝜌𝑊𝑎𝑡𝑒𝑟
Equation 1
°𝐴𝑃𝐼 = 141.5
𝑆𝐺− 131.5
Equation 2
Where ρCrudeOil and ρWater are the density of Crude Oil and water respectively, expressed
in g/cm3 (density of water is set at 1 g/cm3). Specific gravity is measured experimentally
with a hydrometer at 15°C, then it is converted into API gravity. Those parameters may
vary in a wide range: light crudes are gas – like mixtures with 65° API, while heavy crudes
are semisolid materials with about 10° API.
- Sulphur content: it is the weight percentage of sulphur contained in the Crude Oil,
depending on which it is possible to distinguish the oil produced in two classes
• Sweet Crude: < 0.5%
• Medium Sour Crude: 0.5% − 1.5%
• Sour Crude: > 1.5%

13
- Reid Vapour Pressure (RVP): it is a measure of the volatility of the Crude Oil produced,
and it is defined as the absolute vapour pressure exerted by a substance at 100°F (37.8°C).
RVP is an experimental measure that follows the standard test method ASTM D – 323.
Typical values of RVP for a Crude Oil are 0.69 and 0.83 bar (10 – 12 psi).
Crude Oil can be stored into different kinds of tanks, by shape and size, throughout its production and
distribution. The choice of storage equipment should consider many different aspects, like storage
capacities in relation to foreseen production, pressure and temperature of the oil, design issues, etc.
On most of production facilities, Crude Oil is sent directly to refineries or tanker terminals through
the pipeline, where 10 to 100 tanks of varying size and volume can store up to 50 million Crude Oil
barrels. If the offshore platform does not have a direct pipeline system, Crude Oil is stored on board
into storage tanks, which are regularly offloaded by shuttle tankers (every two weeks mostly), storing
several million barrels. On gravity base platforms, oil is stored into cells around the concrete shafts,
while on floating production sites the crude can be stored in onboard tanks or separate storage tanks.
The most widely used tanks are vertical cylinders, with capacity ranging between 100 to 1.5 million
barrels where pressure and temperature are usually nearly – atmospheric. Moreover, storage tanks are
equipped with gauging systems, as floats and level radars, to measure the level reached by the fluid
and converting those data to the volume of Crude Oil stored ((Devold, 2013), (Magalhães, et al.,
2015), (Society of Petroleum Engineers, 2012)).
1.3.3. Gas Treatment
Gas stream produced by the separation train is composed by methane, ethane and traces of higher
hydrocarbons. Moreover, small fractions of water vapour, carbon dioxide, hydrogen sulphide,
nitrogen and other impurities are present. Therefore, this raw Gas stream must be treated to meet the
specifications required to produce NGL etc (Figure 11). The first step is the removal of hydrocarbons
heavier than methane and ethane and acid gases removal. The former is performed cooling the gas
below its dew point and routing the resulting gas – liquid mixture into a high pressure three – phase
separator to split water, gas and liquid hydrocarbons. The latter uses an amine – based absorption for
the removal of carbon dioxide and hydrogen sulphide, through an absorber, amine regenerator and
corresponding accessory equipment. Afterwards, the gas stream is dehydrated using an absorption
using glycols, pressure swing absorber or membranes. Additional treatments are the removal of
mercury through molecular sieves and the rejection of nitrogen traces, by mean of a cryogenic
distillation, whose result is a high concentration nitrogen gas stream. The water removed by the
condensate removal and dehydration is sent to the produced water treatment unit, while the
hydrocarbon condensate removed is addressed to the oil refinery (Devold, 2013).

1.3.4. Water Treatment
The water recovered through the separation train and gas processing contains traces of oil and other
impurities. Produced water stream can be reused through reinjection in the reservoir to enhance
production, or it is discharged in the sea. In the latter event, impurities and oil must be removed by
mean of several processing. In particular, oil concentration must be lowered below 40 mg/L.
The first step is the sand cyclone which removes sand impurities, that are afterwards washed again
before being discharged. Then, the water stream is sent to a hydrocyclone to remove oil droplets: a
steady vortex forces the separation of the oil phase in the middle from the water on the side. The oil
phase recovered is usually recycled to the third separator of the separation train. As last treating step,
a degassing drum is used to further remove oil droplets from water: the gas dispersed in the water
stream start to rise to the surface, dragging oil droplets with them. Thus, the oil film produced is
drained and water can be discharged into the sea (Devold, 2013).
Figure 11. Block Flow Diagram of Gas Treating Process

15
1.4. Project Delimitation
Over the last 30 years, North Sea has had a key role in the production of Crude Oil and Gas in the
European frame, representing an important tool to avoid a complete dependence from Middle – East
Crude Oil import. North Sea oil and gas production reached the peak of production during the first
four years of the last decade, and a progressive decline of the largest and oldest fields in this area
began ever since. Therefore, Oil&Gas Industry in the North Sea has to deal with important challenges
in the future to maintain its key role in the European Oil&Gas market. The main efforts in delaying
the decline of petroleum reservoirs over the North Sea are being done by the development of new
technology for the exploration and drilling of new sizeable oil volumes, and enhancement of the oil
and gas production from the existing reservoirs (Institute for the Analysis of Global Security, 2004).
Offshore platforms are complex facilities aimed to exploit subsea oil and gas reservoirs, requiring
billions of dollars of investments. Those funding are granted based on cost competitive projects,
developed case – by – case for specific petroleum wells. Therefore, the optimization of both new and
old offshore oil and gas facilities in order to maximize the profit is a crucial aim in Oil&Gas Industry
for the near future. Indeed, on the one hand the operating conditions of the units on old facilities may
be adjusted in response to changes in the feed stream conditions to be treated, since a single platform
can receive fluids from different wells, and those streams can vary their operating conditions,
compositions and flow rates. On the other hand, it is profitable designing new offshore platforms
aiming to maximize the amount and quality of oil and gas produced, and allowing the adjustment of
the operating parameters according to the variations of compositional and operating conditions of the
feed.
The main core of the oil and gas production process is the separation of the well fluids into water, gas
and oil through a sequence of three – phase and/or two – phase separators, where a progressive
reduction of pressure and temperature occurs. That separation aims to produce a gas stream as much
free as possible of propane and heavier hydrocarbons, delivering a stable oil. The oil phase is defined
stable when it does not vaporize when it is delivered to the tank, and if storage pressure and/or
temperature fluctuations occur. The optimization of the oil and gas production thus involves the
investigation of the optimal operating pressures and temperatures of the separators to be used on the
platforms, in order to meet the requested targets. Moreover, the variation of those optimal conditions
depending on the number of separators used and the feed conditions is of particular interest.


17
1.5. Project Definition
Based on the project delimitation, the main focus of the project is the following:
Develop simulation models of a petroleum reservoir fluids separation process to optimize separators
pressure and temperature values, in order to maximize the separation of heavy hydrocarbons (C3+)
in the Crude Oil, and light hydrocarbons (C1&2) in the Gas stream produced.
The specific aims set to achieve the above – stated goal of the project include:
i. Choose the suitable thermodynamic model to be used in the simulation models for the
characterization of the phase equilibria of multicomponent mixtures, based on the operating
conditions of the process.
ii. Develop optimization strategies to evaluate the optimal separation train operating pressures
and temperatures, varying the number of separators to be used (1, 2, 3) before the storage tank.
iii. Evaluate the variation of optimal pressures and temperatures of the separators depending on
the reservoir fluid features:
- Composition
- Pressure and temperature

19
Chapter 2
2.1. Oil&Gas Separation Train Optimization
As first step, the optimization of the Oil&Gas separation process requires the definition of the details
of the feed stream. Therefore, composition, pressure and temperature of the petroleum reservoir fluid
need to be defined.
As explained in section 1.2, different kinds of well fluids exist, depending on their composition which
determines the critical properties, and thus their phase behaviour inside the reservoir during
extraction. As the aim of these project is investigating the separation of hydrocarbon components
between Crude Oil and Gas, reservoir fluid composition(s) is(are) considered on free – water basis.
Since no literature has been found regarding the change in composition of the feed of this separation
process, and having the aim of making this project widely effective, three different kinds of reservoir
fluids compositions are considered:
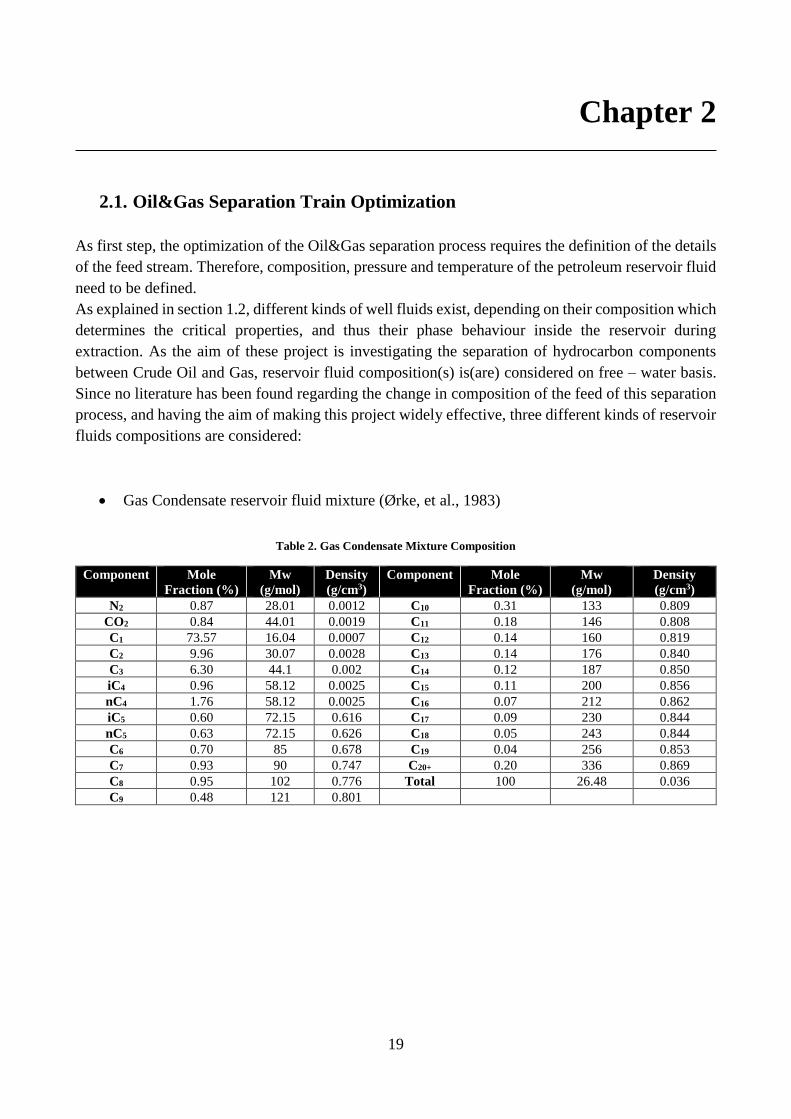
• Gas Condensate reservoir fluid mixture (Ørke, et al., 1983)
Table 2. Gas Condensate Mixture Composition
Component Mole
Fraction (%)
Mw
(g/mol)
Density
(g/cm3)
Component Mole
Fraction (%)
Mw
(g/mol)
Density
(g/cm3)
N2 0.87 28.01 0.0012 C10 0.31 133 0.809
CO2 0.84 44.01 0.0019 C11 0.18 146 0.808
C1 73.57 16.04 0.0007 C12 0.14 160 0.819
C2 9.96 30.07 0.0028 C13 0.14 176 0.840
C3 6.30 44.1 0.002 C14 0.12 187 0.850
iC4 0.96 58.12 0.0025 C15 0.11 200 0.856
nC4 1.76 58.12 0.0025 C16 0.07 212 0.862
iC5 0.60 72.15 0.616 C17 0.09 230 0.844
nC5 0.63 72.15 0.626 C18 0.05 243 0.844
C6 0.70 85 0.678 C19 0.04 256 0.853
C7 0.93 90 0.747 C20+ 0.20 336 0.869
C8 0.95 102 0.776 Total 100 26.48 0.036
C9 0.48 121 0.801

• Near Critical reservoir fluid mixture (Rogne & Fjareide, 1983)
Table 3. Near Critical Mixture Composition
Component Mole
Fraction (%)
Mw
(g/mol)
Density
(g/cm3)
Component Mole
Fraction (%)
Mw
(g/mol)
Density
(g/cm3)
N2 0.87 28.01 0.0012 C10 0.92 134 0.788
CO2 0.96 44.01 0.0019 C11 0.86 148 0.791
C1 57 16.04 0.0007 C12 0.94 162 0.801
C2 9.28 30.07 0.0028 C13 0.81 177 0.818
C3 5.82 44.1 0.002 C14 0.67 188 0.830
iC4 1.19 58.12 0.0025 C15 0.75 201 0.836
nC4 2.19 58.12 0.0025 C16 0.48 215 0.841
iC5 0.99 72.15 0.616 C17 0.55 234 0.839
nC5 1.07 72.15 0.626 C18 0.52 250 0.843
C6 1.52 85 0.677 C19 0.46 264 0.852
C7 2.38 92 0.734 C20+ 5.53 496 0.913
C8 2.72 104 0.756 Total 100 67.44 0.197
C9 1.72 119 0.775
• Black Oil reservoir fluid mixture (Pedersen & Christensen, 2007)
Table 4. Black Oil Mixture Composition
Component Mole
Fraction (%)
Mw
(g/mol)
Density
(g/cm3)
Component Mole
Fraction (%)
Mw
(g/mol)
Density
(g/cm3)
N2 0.49 28.01 0.0012 C15 2.03 206 0.842
CO2 0.31 44.01 0.0019 C16 1.67 222 0.849
C1 44.01 16.04 0.0007 C17 1.38 237 0.845
C2 3.84 30.07 0.0028 C18 1.36 251 0.848
C3 1.12 44.1 0.002 C19 1.19 263 0.858
iC4 0.61 58.12 0.0025 C20 1.02 275 0.863
nC4 0.72 58.12 0.0025 C21 0.89 291 0.868
iC5 0.69 72.15 0.616 C22 0.78 305 0.873
nC5 0.35 72.15 0.626 C23 0.72 318 0.877
C6 1.04 86.18 0.655 C24 0.64 331 0.881
C7 2.87 96 0.738 C25 0.56 345 0.885
C8 4.08 107 0.765 C26 0.53 359 0.889
C9 3.51 121 0.781 C27 0.48 374 0.893
C10 3.26 134 0.792 C28 0.46 388 0.897
C11 2.51 147 0.796 C29 0.45 402 0.900
C12 2.24 161 0.810 C30+ 9.96 449.1 0.989
C13 2.18 175 0.825 Total 100 125.9 0.418
C14 2.07 190 0.836
Flowing pressure and temperature of the stream processed in a separation train may vary case by case.
Kim (Kim, et al., 2014) assumes a feed stream flowing at about 48.4°C and 29 bar, while Magalhães
(Magalhães, et al., 2015) assigns reservoir fluid operating conditions of 62°C and 50 bar. Thus, two set of
operating conditions are considered to extend the validity of this study:
• 60 bar, 70°C
• 30 bar, 40°C

21
As stated in section 1.3.1, Oil&Gas separation process involves successive splits of different phases
using suitable separators, by mean of density difference and/or progressive reduction of pressure and
temperature. Since compositions of the reservoir fluids considered are on free – water basis, the
separation process involves successive splits of a vapour/gas phase from a liquid phase (Figure 12).
Each single separation stage accomplishes a flash separation. A flash is defined as a system where
overall composition, pressure and temperature of the feed stream are known and, if a phase split
occurs, compositions of the phases at equilibrium can be calculated, together with the relative amount
of the two phases.
The well fluids considered are composed by similar non – polar components (hydrocarbons) and
slightly – polar components (carbon dioxide) and nitrogen (inert).
Figure 12. Flash Separation Stage
Under those conditions, when pressure is low (close to atmospheric), the vapour/gas and liquid phase
can be considered ideal and the equilibrium is described using the following equations:
• Raoult’s Law: Vapour – Liquid Equilibria (VLE)
𝑦𝑖 =𝑃𝑠𝑖
(𝑇)
𝑃𝑥𝑖 = 𝐾𝑖𝑥𝑖
Equation 3.
𝑓𝑜𝑟 𝑖 = 1, … , 𝑐
where Ps is vapour pressure, K is the distribution coefficients and c is the number of
components of the mixture.

• Henry’s Law: Gas – Liquid Equilibria (GLE)
𝑦𝑖 = 𝐻𝐿𝑖
(𝑇)
𝑃𝑥𝑖 = 𝐾𝑖𝑥𝑖
Equation 4.
𝑓𝑜𝑟 𝑖 = 1, … , 𝑐
where HL is the Henry’s constant K is the distribution coefficients and c is the number of
components of the mixture.
Volatile components have distribution coefficients higher than 1, while the K – ratios of heavy
components vary between 0 and 1.
As the pressure of the system is far from atmospheric pressure, under the above – stated conditions
of compositions reservoir fluid considered, both vapour/gas and liquid phases are not ideal. Those
phases are at equilibrium when the following condition is fulfilled:
𝑓𝐿𝑖(𝑃, 𝑇, 𝑥1, … , 𝑥𝑐−1) = 𝑓𝑉𝑖
(𝑃, 𝑇, 𝑦1, … , 𝑦𝑐−1)
↓ 𝑃𝑥𝑖𝜑𝐿𝑖
( 𝑃, 𝑇, 𝑥1, … , 𝑥𝑐−1 ) = 𝑃𝑦𝑖𝜑𝑉𝑖(𝑃, 𝑇, 𝑦1, … , 𝑦𝑐−1)
↓
𝑦𝑖 = 𝜑𝐿𝑖
( 𝑃, 𝑇, 𝑥1, … , 𝑥𝑐−1 )
𝜑𝑉𝑖(𝑃, 𝑇, 𝑦1, … , 𝑦𝑐−1)
𝑥𝑖 = 𝐾𝑖𝑥𝑖
𝑓𝑜𝑟 𝑖 = 1, … , 𝑐
where fL, φL and fV, φV are the fugacity and fugacity coefficients of liquid and vapour phase
respectively, while c is the number of components of the mixture. Therefore, the phase equilibria
calculations require to apply models for the determination of vapour and liquid phases fugacity
coefficients. Soave – Redlich Kwong and Peng – Robinson Cubic Equations of State (CEOS) are the
most used thermodynamic models to describe non – ideal vapour/gas and liquid phases.
23
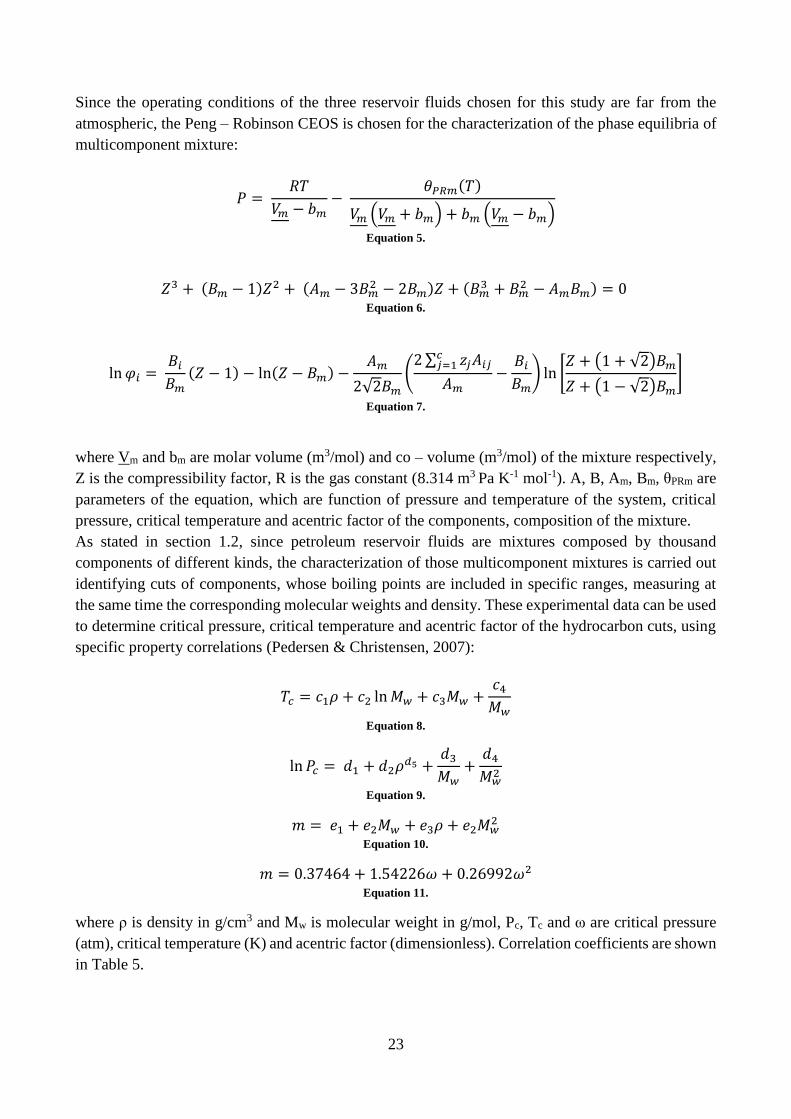
Since the operating conditions of the three reservoir fluids chosen for this study are far from the
atmospheric, the Peng – Robinson CEOS is chosen for the characterization of the phase equilibria of
multicomponent mixture:
𝑃 = 𝑅𝑇
𝑉𝑚 − 𝑏𝑚−
𝜃𝑃𝑅𝑚(𝑇)
𝑉𝑚 (𝑉𝑚 + 𝑏𝑚) + 𝑏𝑚 (𝑉𝑚 − 𝑏𝑚)
Equation 5.
𝑍3 + (𝐵𝑚 − 1)𝑍2 + (𝐴𝑚 − 3𝐵𝑚2 − 2𝐵𝑚)𝑍 + (𝐵𝑚
3 + 𝐵𝑚2 − 𝐴𝑚𝐵𝑚) = 0
Equation 6.
ln 𝜑𝑖 = 𝐵𝑖
𝐵𝑚
(𝑍 − 1) − ln(𝑍 − 𝐵𝑚) −𝐴𝑚
2√2𝐵𝑚
(2 ∑ 𝑧𝑗𝐴𝑖𝑗
𝑐𝑗=1
𝐴𝑚−
𝐵𝑖
𝐵𝑚) ln [
𝑍 + (1 + √2)𝐵𝑚
𝑍 + (1 − √2)𝐵𝑚
]
Equation 7.
where Vm and bm are molar volume (m3/mol) and co – volume (m3/mol) of the mixture respectively,
Z is the compressibility factor, R is the gas constant (8.314 m3 Pa K-1 mol-1). A, B, Am, Bm, θPRm are
parameters of the equation, which are function of pressure and temperature of the system, critical
pressure, critical temperature and acentric factor of the components, composition of the mixture.
As stated in section 1.2, since petroleum reservoir fluids are mixtures composed by thousand
components of different kinds, the characterization of those multicomponent mixtures is carried out
identifying cuts of components, whose boiling points are included in specific ranges, measuring at
the same time the corresponding molecular weights and density. These experimental data can be used
to determine critical pressure, critical temperature and acentric factor of the hydrocarbon cuts, using
specific property correlations (Pedersen & Christensen, 2007):
𝑇𝑐 = 𝑐1𝜌 + 𝑐2 ln 𝑀𝑤 + 𝑐3𝑀𝑤 +𝑐4
𝑀𝑤
Equation 8.
ln 𝑃𝑐 = 𝑑1 + 𝑑2𝜌𝑑5 +𝑑3
𝑀𝑤+
𝑑4
𝑀𝑤2
Equation 9.
𝑚 = 𝑒1 + 𝑒2𝑀𝑤 + 𝑒3𝜌 + 𝑒2𝑀𝑤2
Equation 10.
𝑚 = 0.37464 + 1.54226𝜔 + 0.26992𝜔2 Equation 11.
where ρ is density in g/cm3 and Mw is molecular weight in g/mol, Pc, Tc and ω are critical pressure
(atm), critical temperature (K) and acentric factor (dimensionless). Correlation coefficients are shown
in Table 5.

Table 5. Property Correlation Coefficients (Pedersen & Christensen, 2007)
Subindex/Coefficient 1 2 3 4 5
c 7.34043∙10 9.73562∙10 6.18744∙10-1 -2.05932∙103 -
d 7.28462∙10-2 2.18811 1.6391∙102 -4.04323∙103 0.25
e 3.73765∙10-1 5.49269∙10-3 1.17934∙10-2 -4.93049∙10-6 -
Using the data of density and molecular weights listed in Table 2, Table 3 and Table 4, it is possible
to determine the critical properties and the acentric factors of three reservoir fluids chosen for this
study (Table 6, Table 7, Table 8).
Table 6. Properties of Gas Condensate Mixture’s Components
Component Pc (bar) Tc (K) ω Component Pc (bar) Tc (K) ω
N2 33.9 126.2 0.04 C9 25.4 583.5 0.366
CO2 73.8 304.2 0.225 C10 23.7 602.3 0.395
C1 46 190.6 0.008 C11 22.1 620.7 0.426
C2 48.8 305.4 0.098 C12 20.8 640.3 0.457
C3 42.5 369.8 0.152 C13 19.7 662.2 0.491
iC4 36.5 408.1 0.176 C14 19.1 676.4 0.514
nC4 38 425.2 0.193 C15 18.3 692.1 0.539
iC5 33.8 460.4 0.227 C16 17.8 706.2 0.562
nC5 33.7 469.5 0.251 C17 16.8 724.7 0.594
C6 31.2 510.7 0.271 C18 16.3 738.6 0.616
C7 31.3 525.7 0.286 C19 15.9 752.8 0.637
C8 28.7 550.2 0.318 C20+ 14.2 831.9 0.745
Table 7. Properties of Near Critical Mixture’s Components
Component Pc (bar) Tc (K) ω Component Pc (bar) Tc (K) ω
N2 33.9 126.2 0.04 C9 25.3 578.5 0.361
CO2 73.8 304.2 0.225 C10 23.2 602.2 0.398
C1 46 190.6 0.008 C11 21.6 622.2 0.43
C2 48.8 305.4 0.098 C12 20.4 641.6 0.461
C3 42.5 369.8 0.152 C13 19.4 661.9 0.493
iC4 36.5 408.1 0.176 C14 18.8 676.1 0.516
nC4 38 425.2 0.193 C15 18.1 691.8 0.541
iC5 33.8 460.4 0.227 C16 17.4 708.1 0.657
nC5 33.7 469.5 0.251 C17 16.6 728.7 0.601
C6 31.2 510.6 0.271 C18 16 745.9 0.627
C7 30.4 528.6 0.291 C19 15.7 760.9 0.649
C8 27.9 552.2 0.323 C20+ 12.7 974 0.858

25
Table 8. Properties of Black Oil Mixture’s Components
Component Pc (bar) Tc (K) ω Component Pc (bar) Tc (K) ω
N2 33.9 126.2 0.04 C14 18.7 678.9 0.52
CO2 73.8 304.2 0.225 C15 17.9 698 0.551
C1 46 190.6 0.008 C16 17.2 716.4 0.58
C2 48.8 305.4 0.098 C17 16.5 732.3 0.606
C3 42.5 369.8 0.152 C18 16 747.3 0.629
iC4 36.5 408.1 0.176 C19 15.7 760.4 0.648
nC4 38 425.2 0.193 C20 15.4 772.8 0.666
iC5 33.8 460.4 0.227 C21 15.1 789 0.689
nC5 33.7 469.5 0.251 C22 14.8 802.9 0.707
C6 30.3 511.4 0.274 C23 14.6 815.6 0.724
C7 29.5 536.5 0.302 C24 14.4 828.1 0.739
C8 27.4 558 0.331 C25 14.1 841.4 0.755
C9 25.1 582.1 0.366 C26 13.9 854.4 0.769
C10 23.3 602.5 0.398 C27 13.8 868.2 0.784
C11 21.8 621.2 0.428 C28 13.6 880.9 0.796
C12 20.6 641 0.459 C29 13.5 893.5 0.807
C13 19.6 659.9 0.489 C30+ 13.6 940.5 0.839
As stated in section 1.5, the target of the separation train optimization is to maximize at the same time
the recovery of C3+ hydrocarbons in Crude Oil, and the recovery C1/2 hydrocarbons in the Gas
produced.
Figure 13. Block Flow Diagram of Separation train
Looking at the scheme in Figure 13, the above – mentioned recoveries are defined as follows:
𝑅𝑜𝑖𝑙 = 𝐿𝐶𝑟𝑢𝑑𝑒 𝑂𝑖𝑙 ∑ 𝑥𝑖
4𝐶𝑛𝑖=𝐶3
𝐹 ∑ 𝑧𝑘𝐶𝑛𝑘=𝐶3
= (1 − 𝛼𝑉1)(1 − 𝛼𝑉2
)(1 − 𝛼𝑉3)(1 − 𝛼𝑉4
)∑ 𝑥𝑖
4𝐶𝑛𝑖=𝐶3
∑ 𝑧𝑘𝐶𝑛𝑘=𝐶3
Equation 12.

𝑅𝑔𝑎𝑠 = 𝐺1 ∑ 𝑦𝑖
1𝐶2𝑖=𝐶1
𝐹 ∑ 𝑧𝑘𝐶2𝑘=𝐶1
+𝐺2 ∑ 𝑦𝑖
2𝐶2𝑖=𝐶1
𝐹 ∑ 𝑧𝑘𝐶2𝑘=𝐶1
+𝐺3 ∑ 𝑦𝑖
3𝐶2𝑖=𝐶1
𝐹 ∑ 𝑧𝑘𝐶2𝑘=𝐶1
=
=𝛼𝑉1
∑ 𝑦𝑖1𝐶2
𝑖=𝐶1
∑ 𝑧𝑘𝐶2𝑘=𝐶1
+𝛼𝑉2
(1 − 𝛼𝑉1) ∑ 𝑦𝑖
2𝐶2𝑖=𝐶1
∑ 𝑧𝑘𝐶2𝑘=𝐶1
+𝛼𝑉3
(1 − 𝛼𝑉1)(1 − 𝛼𝑉2
) ∑ 𝑦𝑖3𝐶2
𝑖=𝐶1
∑ 𝑧𝑘𝐶2𝑘=𝐶1
Equation 13.
Equation 12 and Equation 13 can be generalized, deriving the following equations:
𝑅𝑜𝑖𝑙 = (∏(1 − 𝛼𝑉𝑗)
𝑁+1
𝑗=1
)∑ 𝑥𝑖
𝑁+1𝐶𝑛𝑖=𝐶3
∑ 𝑧𝑘𝐶𝑛𝑘=𝐶3
Equation 14.
𝑅𝑔𝑎𝑠 = ∑ 𝛼𝑉𝑖
𝑁𝑖=1 ∏ (1 − 𝛼𝑉1−𝑗
) ∑ 𝑦𝑘𝑖𝐶2
𝑘=𝐶1
𝑖𝑗=1
∑ 𝑧𝑘𝐶2𝑘=𝐶1
Equation 15.
where Roil and Rgas are the recoveries in Crude Oil and Gas respectively (values included between 0
and 1), N is the number of separators and n is the higher carbon number fraction in the reservoir fluid.
Since the optimization aims to maximize both recoveries at the same time, those variables need to be
combined into one objective function. Many kinds of combinations are possible: linear, exponential,
etc. Since no valid reason was found to promote a specific kind of function, a linear combination of
the recovery in Crude Oil and Gas is used (Equation 16). The constants to be used in the objective
function are determined using the prices of Oil and Gas (Equation 17 and Equation 18). Indeed, this
way the importance of the two recoveries is weighted during the optimization. The prices considered
for Crude Oil and Gas in this optimization are 326 US$/m3 and 0.388 US$/m3 respectively (U.S.
Department of Energy, 2008). Since both the constants of the linear combination and the recoveries
values are included between 0 and 1, the objective function varies in the same range.
Φ(𝑅𝑜𝑖𝑙, 𝑅𝑔𝑎𝑠) = 𝑐1𝑅𝑜𝑖𝑙 + 𝑐2𝑅𝑔𝑎𝑠
Equation 16.
𝑐1 =𝑃𝑟𝑖𝑐𝑒𝑜𝑖𝑙
𝑃𝑟𝑖𝑐𝑒𝑜𝑖𝑙 + 𝑃𝑟𝑖𝑐𝑒𝑔𝑎𝑠= 0.99
Equation 17.

27
𝑐2 = 1 − 𝑐1 = 0.01
Equation 18.
The optimization of the separation process is constrained by the need to produce a stable Crude Oil.
As explained in section 1.3.1, the oil phase produced from the last separator must stay in liquid phase
when pressure and/or temperature are reduced to stock conditions and the product is delivered to the
storage tank. Moreover, no vaporization must occur if storing conditions undergo to slight variations.
This stability constraint is thus expressed as bubble point pressure of the Crude Oil, at the storage
temperature, must be equal or lower than a certain percentage of the pressure in the storage tank:
𝑃𝐵(𝑥1𝑁+1, … , 𝑥𝑐
𝑁+1, 𝑇𝑠𝑡𝑜𝑐𝑘) ≤ 𝜃𝑃𝑠𝑡𝑜𝑐𝑘
Equation 19.
𝑤𝑖𝑡ℎ 0 < 𝜃 < 1
where N is the number of separators and c is the number of components in the mixture. The closer θ
to 0, the stricter the stability constraint.
The storing conditions can vary case by case. Both Kim (Kim, et al., 2014) and Kylling (Kylling,
2009) suggest a nearly – atmospheric storage pressure and temperature. Therefore, stock conditions
are fixed at 1.2 bar and 15°C.
2.2. Optimization Strategies
The development of models for the simulation of the Oil&Gas separation process can be performed
through different tools.
Chemical process simulators are softwares widely used for the design and/or evaluation of whole or
sections of already existing or not yet existing chemical plants. One of the most important process
simulators is Aspen HYSYS, by AspenTech. This software allows wide choices regarding the built –
in thermodynamic models and routines, in order to simulate different kinds of processes and optimize
their operating conditions. Moreover, it results to be a very well tested tool in process engineering,
thus their results are considered very reliable.
Alternatively, MATLAB can be used for the development of codes that can simulate the separation
process by mean of successive flash calculations. On the one hand, self – built programs allow to
have great flexibility regarding the implementation of flash calculations methods and optimization
strategies. On the other hand, MATLAB codes development may be time consuming and it may not
return reliable results.
In this project, Aspen HYSYS V9 process simulator (full licence provided by Aalborg University) is
used because of the reliability of the software and its wide use in Oil&Gas companies.

Firstly, three component lists have to be created to model the three reservoir fluids chosen for this
study. Nitrogen, carbon dioxide and hydrocarbons from C1 to nC5 are already present into the HYSYS
dataset. The carbon fraction cuts of the selected fluids are modelled as hypothetical components,
specifying “hydrocarbon” as components class. The data shown in tables from 2 to 4 and from 6 to 8
are given as input for characterization of the components.
Figure 14. Aspen HYSYS Hypothetical Components Input Screen
Secondly, different flowsheets are developed to study the separation process, using the three different
feed streams selected and varying the number of separators. As stated in section 1.3.1, unless
otherwise required, pressure and temperature of the first separator of a separation train are the flowing
conditions of the feed stream. In this study, the separation process is simulated as a sequence of at
first 2, and then 3 separators, assuming that the reservoir fluids are flashed at their flowing pressure
and temperature in the first separator. Additionally, the Crude Oil tank is simulated by mean of a
separator. Since only vapour/gas – liquid phase splits are considered in this project, two – phase
separators are modelled in the simulator. Figure 15 shows the screen for the configuration of a two –
phase separator in the HYSYS simulation environment.
Figure 15. Two – Phase Separator Setup Screen

29
The optimization of the operating pressure and temperature is carried out by mean of the HYSYS
Original Optimizer. The first step (Figure 16) is the selection of the variables to be adjusted to meet
the optimization aims needed, the range in which those variables should be varied (lower and upper
bound). In this project, the variables to be optimized are the pressures and temperatures of the streams
entering the separators. Afterwards, the parameters needed for the optimization must be specified in
the spreadsheet (Figure 17).
Figure 16. Variable Tab of the Original Optimizer
Therefore, vapour fractions, molar compositions, recoveries in Crude Oil and Gas, objective function
and bubble point Crude Oil at stock temperature are stated and connected to the main flowsheet.
Figure 17. Original Optimizer Spreadsheet

Afterwards, the cell containing the objective function is specified in the Functions tab (Figure 18)
and the option “maximize” is chosen. Then, the cell containing the parameters used as constraints are
indicated and the relation between them (lower, equal or higher) is stated. In this project, the
constraint is the bubble point pressure of the Crude Oil stored in the tank and it must be lower than a
fixed percentage of the tank pressure. Literature suggests that, at the storage temperature (15°C), the
boiling pressure of the stored Crude Oil should be between 0.68 bar and 0.88 bar (Piping Engineering,
2015). Therefore, in this project the constraint for the optimization is that the bubble point pressure
of the Crude Oil is equal or lower than 0.85 bar (70% of the tank pressure).
Figure 18. Functions Tab of the Original Optimizer
In the end, the Parameter tab allows to choose the details of the optimization (Figure 19). The main
detail is the optimization method to be used. HYSYS allows several choices according to some
aspects of the optimization to be performed (linear or non – linear objective function, equality and/or
inequality constraints):
Figure 19. Parameter Tab of the Original Optimizer

31
• BOX Method: it is a sequential search technique to solve problems with non – linear objective
functions, which are subjected to non – linear inequality constraints, without using derivatives.
It is not very efficient and requires many iterations to converge to the global solution, but if
applicable it results to be very robust. This method evaluates the function in different points
around a suitable starting point and within a suitable range. Once having found a point that
optimize the objective function and satisfy the constraints at same time, an extrapolation is
used to find the next point. If the new point satisfies the requirements, one more extrapolation
is performed, otherwise new points are generated around the last suitable point and the search
is repeated.
• Sequential Quadratic Programming (SQP): it is a optimization method, which that generates
a Lagrangian function using the objective function, the constraints and the Lagrange’s
multipliers. Then, an appropriate search direction is found by solving a quadratic subproblem,
where a quadratic linear approximation of the Lagrangian function and its second derivative
matrix are used. SQP is considered the most efficient optimization method for non – linear
objective functions, with linear and/or non – linear equality and/or inequality constraints.
However, it does not handle large number of variables and it is mostly used for local
optimizations
• Mixed Method: this method uses at first the BOX method until converge to the global
constrained optimum of the objective function. Then the SQP method is used to locate the
final solution. This way the global optimization of the BOX method is combined with the
efficiency of the SQP method.
• Fletcher – Reeves Method: it is an optimization method which is effective for general
problems with no constraints. Given a starting point, the program evaluates the gradient of the
function with respect to the primary variables and the search direction as conjugated of the
gradient. A one – dimensional search is performed until funding the local optimum.
• Quasi – Newton Method: this method does not handle constraints and determines a search
direction by approximating the inverse of the Hessian matrix of the objective function.
The descriptions of the optimization methods suggest that a suitable choice to find the global optimal
values for pressures and temperatures of the Oil&Gas separation process is the BOX method.

33
Chapter 3
3.1. Optimization Results and Discussion
As explained in section 2.1, the flowsheets developed for the simulation of the Oil&Gas separation
in the HYSYS simulator environment include sequences of at first 2, and then 3 two – phase
separators. One additional separator is used to simulate the Crude Oil storage tank.
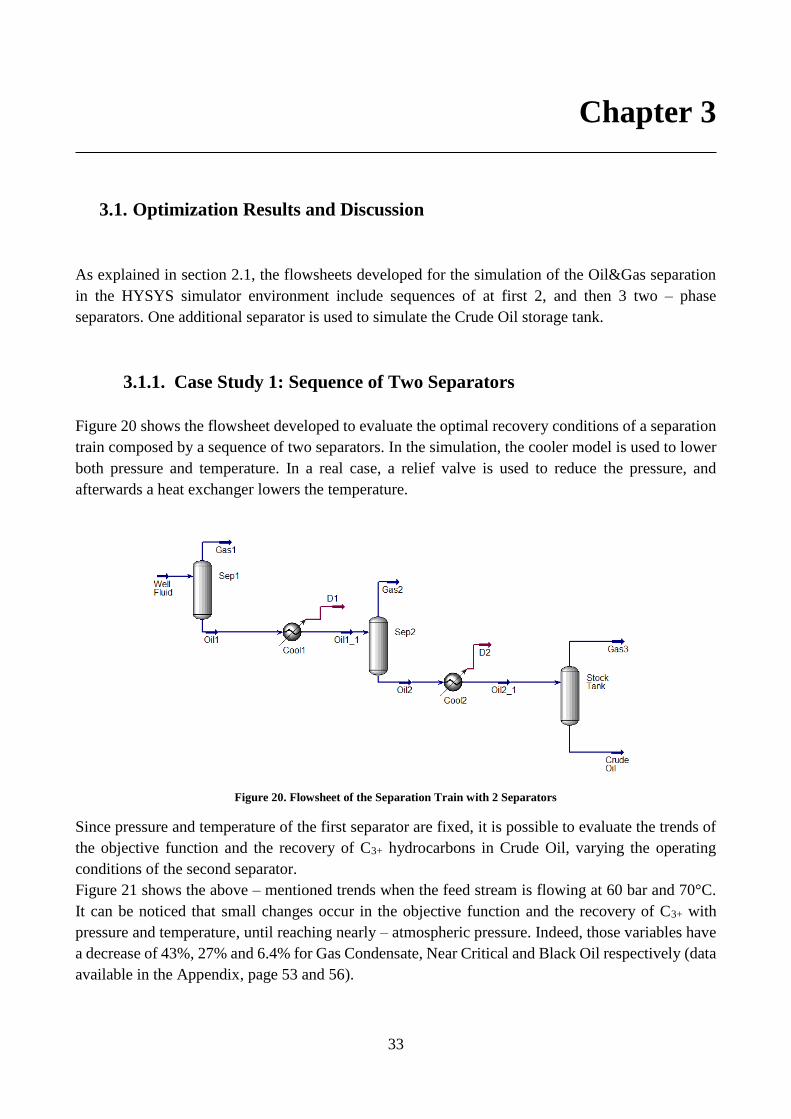
3.1.1. Case Study 1: Sequence of Two Separators
Figure 20 shows the flowsheet developed to evaluate the optimal recovery conditions of a separation
train composed by a sequence of two separators. In the simulation, the cooler model is used to lower
both pressure and temperature. In a real case, a relief valve is used to reduce the pressure, and
afterwards a heat exchanger lowers the temperature.
Figure 20. Flowsheet of the Separation Train with 2 Separators
Since pressure and temperature of the first separator are fixed, it is possible to evaluate the trends of
the objective function and the recovery of C3+ hydrocarbons in Crude Oil, varying the operating
conditions of the second separator.
Figure 21 shows the above – mentioned trends when the feed stream is flowing at 60 bar and 70°C.
It can be noticed that small changes occur in the objective function and the recovery of C3+ with
pressure and temperature, until reaching nearly – atmospheric pressure. Indeed, those variables have
a decrease of 43%, 27% and 6.4% for Gas Condensate, Near Critical and Black Oil respectively (data
available in the Appendix, page 53 and 56).

Figure 21. Feed Conditions: 60 bar, 70°C;
Left Panel: Trend of the Objective Function (Ф); Right Panel: Trend of the Recovery of C3+ in Crude Oil (Roil)
Figure 22. Bubble Point Pressure of Crude Oil produced (Pb, bar) as function Pressure (bar) and Temperature (°C) of the
Second Separator

35
Figure 22 shows the trend of the bubble point pressure at stock temperature (15°C) of the Crude Oil
in the stock tank, as function of operating conditions of the second separator. It is possible to notice
that, as the second stage pressure decreases, the bubble point pressure decreases. Thus, it is reasonable
to expect that the stability constraint is met when the pressure of the second separator is very close to
the tank pressure (1.2 bar). The data regarding the trend of Crude Oil bubble point pressure are shown
in the Appendix (page 59).
An optimization is performed to maximize the objective function, respecting the volatility constraint.
As it is shown in Table 9, in the case of two separators before the storage tank, a stable Crude Oil can
be produced reducing the pressure of the liquid from the first separator up to stock pressure.
Moreover, temperature needs to be almost halved in the case of Gas Condensate and Near Critical
reservoir fluids, while a reduction of about 7°C is required for Black Oil mixture.
Table 9. Results of the Optimization for a Sequence of Two Separators
Fluids
Parameters
Gas Condensate Near Critical Black Oil
P1 (bar) 60 60 60
T1 (°C) 70 70 70
αV1 (Vapour Fraction) 0.93 0.66 0.36
P2 (bar) 1.2 1.2 1.2
T2 (°C) 39 39 53
αV2 (Vapour Fraction) 0.46 0.36 0.24
Ф 0.24 0.665 0.937
Roil 0.23 0.664 0.937
Rgas 0.999 0.999 0.999
Pb Crude Oil at 15°C (bar) 0.81 0.84 0.85
In all three cases, the recovery of C1 and C2 hydrocarbons in Gas phase is nearly complete (99%),
while the recovery of C3 and heavier hydrocarbons in Crude Oil is very low for the Gas Condensate
(23%), while it is higher for Near Critical mixture (66.4%) and Black Oil fluid (93.7%). The
compositions of the Crude Oil streams produced are shown in the Appendix (page 47).
Considering 30 bar and 40°C as pressure and temperature of the feed streams and the first separator,
Figure 23 shows the trends of the objective function and the recovery of C3+ hydrocarbons in Crude
Oil, varying pressure and temperature of the second separator. As it can be seen, those two variables
change slightly varying the operating conditions of the second separator, until reaching nearly –
atmospheric pressures. Indeed, decline of the 27%, 16% and 2% occur for Gas Condensate, Near
Critical and Black Oil fluids respectively when approaching stock pressure (data available in the
Appendix, page 53 and 56).
Figure 24 shows the trend of the bubble point pressure at stock temperature (15°C) of the stream
delivered to the storage tank, as function of operating conditions of the second separator. As in the
previous case, the bubble point pressure decreases as the second separator pressure decreases.
Therefore, it is reasonable to expect that the stability constraint is met when the pressure of the second
separator is very close to the tank pressure (1.2 bar).

Figure 23. Feed Conditions: 30 bar, 40°C;
Left Panel: Trend of the Objective Function (Ф); Right Panel: Trend of the Recovery of C3+ in Crude Oil (Roil)
Figure 24. Bubble Point Pressure of Crude Oil produced (Pb, bar) as function Pressure (bar) and Temperature (°C) of the
Second Separator

37
The results of an optimization to maximize the objective function and respecting the volatility
constraint are shown in Table 10. The optimal pressure of the second separator to produce a stable
Crude Oil is equal to the one of the stock tank for all the three compositions considered. Moreover,
the optimal temperature needs to be lowered up to 34°C for the Gas Condensate mixture and to 36°C
for the Near Critical fluid. It is possible to notice that the optimal conditions for the Black Oil bring
to a stable Crude Oil, but its bubble point exceeds the fixed constraint of about the 11.5%.
Table 10. Results of the Optimization for a Sequence of Two Separators
Fluids
Parameters
Gas Condensate Near Critical Black Oil
P1 (bar) 30 30 30
T1 (°C) 40 40 40
αV1 (Vapour Fraction) 0.93 0.69 0.42
P2 (bar) 1.2 1.2 1.2
T2 (°C) 34 36 36
αV2 (Vapour Fraction) 0.37 0.28 0.15
Ф 0.309 0.703 0.96
Roil 0.308 0.702 0.96
Rgas 0.999 0.999 0.997
Pb Crude Oil at 15°C (bar) 0.84 0.84 0.96
In all three cases, the recovery of C1 and C2 hydrocarbons in Gas phase is nearly complete (99%),
while the recovery of C3 and heavier hydrocarbons in Crude Oil is low for the Gas Condensate fluid
(30.8%), it is middle for Near Critical mixture (70.2%) and quite high for the Black Oil fluid (96%).
The composition of Crude Oil produced at the optimal conditions are shown in the Appendix (page
47).
The results of the above – shown optimizations suggest that a configuration where a separation train
is composed by a sequence of two separators (the first one operating at the flowing pressure and
temperature) can deliver a stable Crude Oil. However, the recovery of C3+ hydrocarbons is not
satisfactory. Indeed, when processing Gas Condensate and Near Critical mixtures, the amount of
initial C3 and heavier hydrocarbons in the Gas produced ranges between the 28% and the 77%. This
means that, before being addressed to treating processes, a consistent amount of condensate needs to
be removed from the gas, to achieve an effective recovery of C3+ hydrocarbons.
3.1.2. Case Study 2: Sequence of Three Separators
Figure 25 shows the flowsheet developed to evaluate the optimal recovery conditions of a separation
train composed by a sequence of three separators. As in the previous case study, in the simulation the
cooler model is used to lower both pressure and temperature. In a real case, relief valves are used to
reduce the pressure, and afterwards heat exchangers lower the temperature.

Figure 25. Flowsheet of the Separation Train with 3 Separators
Considering 60 bar and 70°C as feed stream flowing conditions and operating pressure and
temperature of the first separator,
Table 11 shows the results of the optimization of the operating conditions of the second and third
separator. For the Gas Condensate, Near Critical and Black Oil fluids, a large pressure drop is required
between the first and the second separator (from 60 bar to 8 bar). Moreover, for Gas Condensate and
Near Critical mixtures, temperatures are almost equally distanced between separators. For the Black
Oil reservoir fluid, temperatures of second and third separator are close to the first separator
temperature condition.
Table 11. Results of the Optimization for a Sequence of Three Separators
Fluids
Parameters
Gas Condensate Near Critical Black Oil
P1 (bar) 60 60 60
T1 (°C) 70 70 70
αV1 (Vapour Fraction) 0.93 0.66 0.36
P2 (bar) 8 8 8
T2 (°C) 52 53 53
αV2 (Vapour Fraction) 0.3 0.24 0.18
P3 (bar) 1.2 1.2 1.2
T3 (°C) 35 38 51
αV3 (Vapour Fraction) 0.13 0.1 0.23
Ф 0.275 0.72 0.97
Roil 0.274 0.72 0.97
Rgas 0.999 0.998 0.998
Pb Crude Oil at 15°C (bar) 0.78 0.77 0.79
39
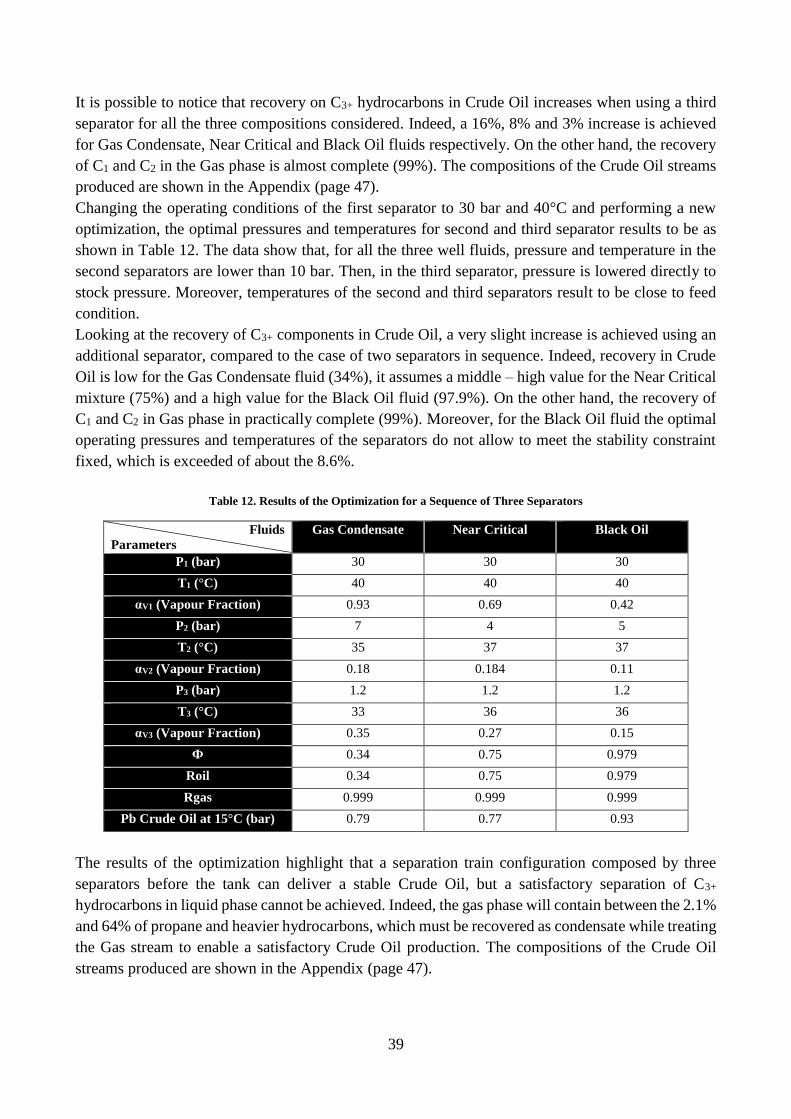
It is possible to notice that recovery on C3+ hydrocarbons in Crude Oil increases when using a third
separator for all the three compositions considered. Indeed, a 16%, 8% and 3% increase is achieved
for Gas Condensate, Near Critical and Black Oil fluids respectively. On the other hand, the recovery
of C1 and C2 in the Gas phase is almost complete (99%). The compositions of the Crude Oil streams
produced are shown in the Appendix (page 47).
Changing the operating conditions of the first separator to 30 bar and 40°C and performing a new
optimization, the optimal pressures and temperatures for second and third separator results to be as
shown in Table 12. The data show that, for all the three well fluids, pressure and temperature in the
second separators are lower than 10 bar. Then, in the third separator, pressure is lowered directly to
stock pressure. Moreover, temperatures of the second and third separators result to be close to feed
condition.
Looking at the recovery of C3+ components in Crude Oil, a very slight increase is achieved using an
additional separator, compared to the case of two separators in sequence. Indeed, recovery in Crude
Oil is low for the Gas Condensate fluid (34%), it assumes a middle – high value for the Near Critical
mixture (75%) and a high value for the Black Oil fluid (97.9%). On the other hand, the recovery of
C1 and C2 in Gas phase in practically complete (99%). Moreover, for the Black Oil fluid the optimal
operating pressures and temperatures of the separators do not allow to meet the stability constraint
fixed, which is exceeded of about the 8.6%.
Table 12. Results of the Optimization for a Sequence of Three Separators
Fluids
Parameters
Gas Condensate Near Critical Black Oil
P1 (bar) 30 30 30
T1 (°C) 40 40 40
αV1 (Vapour Fraction) 0.93 0.69 0.42
P2 (bar) 7 4 5
T2 (°C) 35 37 37
αV2 (Vapour Fraction) 0.18 0.184 0.11
P3 (bar) 1.2 1.2 1.2
T3 (°C) 33 36 36
αV3 (Vapour Fraction) 0.35 0.27 0.15
Ф 0.34 0.75 0.979
Roil 0.34 0.75 0.979
Rgas 0.999 0.999 0.999
Pb Crude Oil at 15°C (bar) 0.79 0.77 0.93
The results of the optimization highlight that a separation train configuration composed by three
separators before the tank can deliver a stable Crude Oil, but a satisfactory separation of C3+
hydrocarbons in liquid phase cannot be achieved. Indeed, the gas phase will contain between the 2.1%
and 64% of propane and heavier hydrocarbons, which must be recovered as condensate while treating
the Gas stream to enable a satisfactory Crude Oil production. The compositions of the Crude Oil
streams produced are shown in the Appendix (page 47).


41
Conclusions
The results of the Oil&Gas separation train optimization shown in the previous chapter allow the
draw some conclusions.
Assuming 1.2 bar and 15°C as storage conditions, the production of Crude Oil matching the fixed
stability constraint (bubble point pressure of Crude Oil at stock temperature equal or lower than 70%
of tank pressure) requires that the last separator before the stock tank operates at storage pressure.
Moreover, the temperature of the last separator needs to be higher than the tank temperature,
depending on the molecular weight of the fluid processed (the heavier the fluid, the higher the
temperature).
Analysing the recovery of C3+ hydrocarbons in Crude Oil and C1 and C2 hydrocarbons in the Gas
phase, it results that the latter is practically complete (99%) both using two and three separators before
the stock tank. The former results to be very low for Gas Condensate – like mixtures (23% – 27.5%
when using two separators and 30.8% – 34% when using a sequence of three separators), it has a
moderate value processing Near Critical – like reservoir fluids (66.4% – 70.3% when using two
separators and 72% – 75% when using a train of three separators), while it reaches high values for
Black Oil – like well mixtures (93.7% – 97% when using two separators and 96% – 97.9% when
using a train of three separators). Therefore, it is fair to state that a separation train composed by a
sequence of three separators allows to better recover C3 and heavier hydrocarbons in Crude Oil and
C1&2 hydrocarbons in the Gas stream produced.
The composition of the petroleum reservoir fluid to be processed slightly influence the operating
conditions of the separators. Since as the molecular weight of the hydrocarbon feed decreases the
recovery of C3+ in Crude Oil decreases, the more volatile the well mixture extracted, the higher the
amount of C3+ condensate that must be recovered from the Gas phase. Furthermore, maximizing the
recovery of propane and heavier hydrocarbons brings to large pressure drops between the first
separator and the second one, leading to a high energy consumption at the compressors, to pressurize
the Gas streams from the second and third separator to mix them with the Gas stream from the first
separator.


43
Recommendations
After having completed this Master’s Thesis project, some recommendations can be suggested for
future developments of Oil&Gas separation train optimization.
An interesting aspect for future evaluations is the influence of the reservoir fluid stream operating
conditions to be fed to the first separator. Indeed, a reduction of pressure and temperature before the
first separator might lead to increase the recovery in Crude Oil and Gas phase and to smaller pressure
drops between separators.
Moreover, the development of self – built MATLAB programs to simulate the separation process
might be useful. Indeed, it could give the possibility to extend the complexity the optimization,
including the energy consumption in compressors, liquid – liquid equilibria calculations (the
composition of reservoir fluids includes water) and size of the equipment.


45
References
A. P. I., 2017. energyAPI. [Online]
Available at: http://www.api.org/oil-and-natural-gas/wells-to-consumer/exploration-and-
production/offshore/offshore-production-facilities
[Accessed on 08 05 2017].
Csanyi, E., 2017. Electical Engineering Portal. [Online]
Available at: http://electrical-engineering-portal.com/5-most-common-offshore-oil-and-gas-
production-facility-types
[Accessed on 08 05 2017].
Devold, H., 2013. Oil and gas production handbook. III a cura di Oslo: ABB Oil and Gas.
I. f. t. A. o. G. S., 2004. IAGS. [Online]
Available at: http://www.iags.org/n0524043.htm
[Accessed on 15 05 2017].
Kim, I. H. et al., 2014. Simulation-Based Optimization of Multistage Separation Process in
Offshore Oil and Gas Production Facilities. Industrial & Engineering Chemestry Research, Volume
53, pp. 8810 - 8820.
Kylling, Ø. W., 2009. Optimizing separator pressure in a multistage crude oil production plant,
Trondheim: Norwegian University of Science and Technology.
Magalhães, A. C., Silva, F., Cobos, J. & Nunes, J. C. Q., 2015. Process Design of Offshore
Separation Train, Esbjerg: Aalborg University Esbjerg Campus.
O. C. D., 2010. OffshoreBook, Esbjerg: Morten Holmager.
Ørke, T., Martinsen, A. & Odden, W., 1983. Compositional analysis for Statoil, well 15/9-15, s.l.:
Statoil Exploration & Production Laboratory.
P. E., 2015. Piping Engineering. [Online]
Available at: http://www.piping-engineering.com/crude-oil-processing-offshore-facilities.html
[Accessed on 07 05 2017].
Pedersen, K. S. & Christensen, P. L., 2007. C7+ Characterization. In: Phase Behavior of Petroleum
Reservoir Fluids. Søllerød: Taylo&Francis, pp. 80-113.
Pedersen, K. S. & Christensen, P. L., 2007. Compositional Analysis. In: Phase Behavior of
Petroleum Reservoir Fluids. Søllerød: Taylor&Francis Group, pp. 12-39.
Pedersen, K. S. & Christensen, P. . L., 2007. Petroleum Reservoir Fluids. In: Phase Behavoir of
Petroleum Reservoir Fluids. Søllerød: Taylor&Francis Group, pp. 1-11.

Petrarulo, P. A., 2016. Conceptual process design of the downstream of the Kraft lignin
hydrothermal liquefaction for the recovery of water soluble phenolic compounds, Esbjerg: Aalborg
University Esbjerg.
Rogne, O. & Fjareide, B., 1983. PVT of bottom hole sample from well 34/10-17, s.l.: Statoil
Exploration & Production Laboratory.
S. o. P. E., 2012. PetroWiki. [Online]
Available at: http://petrowiki.org/Oil_storage
[Accessed on il giorno 10 05 2017].
S. o. P. E., s.d. PetroWiki. [Online]
Available at: http://petrowiki.org/Reservoir_pressure_and_temperature#cite_ref-r1_1-0
[Accessed on 09 05 2017].
Tabak, J., 2009. The Geology and Chemistry of Oil. In: Coal and Oil. s.l.:Facts On File, pp. 115-
187.
T. E. G. N., 2010. Ecology.com. [Online]
Available at: http://www.ecology.com/2011/09/06/fossil-fuels-renewable-energy-resources/
[Accessed on 05 05 2017].
T. S., 2015. Planete Energies. [Online]
Available at: http://www.planete-energies.com/en/medias/close/offshore-oil-and-gas-production
[Accessed on 26 04 2017].
U. D. o. E., 2008. Energy Information Administration. [Online]
Available at: https://www.eia.gov/outlooks/steo/report/prices.cfm
[Accessed on 05 2017].

47
Appendix
Crude Oil Compositions at Optimal Conditions
• Sequence of Two Separators
o First Separator at 60 bar & 70°C
Table A1. Composition from Gas Condensate Petroleum Reservoir Fluid
Component Mole Fraction
(%)
Mw
(g/mol)
Density
(g/cm3)
Component Mole Fraction
(%)
Mw
(g/mol)
Density
(g/cm3)
N2 4.29∙10-6 28.01 0.0012 C9 11.06 121 0.801
CO2 0.01 44.01 0.0019 C10 7.71 133 0.809
C1 0.22 16.04 0.0007 C11 4.7 146 0.808
C2 0.42 30.07 0.0028 C12 3.77 160 0.819
C3 1.76 44.1 0.002 C13 3.85 176 0.840
iC4 0.96 58.12 0.0025 C14 3.33 187 0.850
nC4 2.67 58.12 0.0025 C15 3.07 200 0.856
iC5 2.48 72.15 0.616 C16 1.96 212 0.862
nC5 3.34 72.15 0.626 C17 2.52 230 0.844
C6 7.89 85 0.678 C18 1.41 243 0.844
C7 12.78 90 0.747 C19 1.13 256 0.853
C8 17.3 102 0.776 C20+ 5.64 336 0.869
Table A2. Composition from Near Critical Petroleum Reservoir Fluid
Component Mole Fraction
(%)
Mw
(g/mol)
Density
(g/cm3)
Component Mole Fraction
(%)
Mw
(g/mol)
Density
(g/cm3)
N2 6.06∙10-6 28.01 0.0012 C9 7.62 119 0.775
CO2 0.002 44.01 0.0019 C10 4.19 134 0.788
C1 0.2 16.04 0.0007 C11 3.96 148 0.791
C2 0.41 30.07 0.0028 C12 4.36 162 0.801
C3 1.36 44.1 0.002 C13 3.77 177 0.818
iC4 0.79 58.12 0.0025 C14 3.12 188 0.830
nC4 2.01 58.12 0.0025 C15 3.49 201 0.836
iC5 1.85 72.15 0.616 C16 2.24 215 0.841
nC5 2.34 72.15 0.626 C17 2.57 234 0.839
C6 5.08 85 0.677 C18 2.43 250 0.843
C7 8.92 92 0.734 C19 2.15 264 0.852
C8 11.33 104 0.756 C20+ 25.8 496 0.913

Table A3. Composition from Black Oil Petroleum Reservoir Fluid
Component Mole Fraction
(%)
Mw
(g/mol)
Density
(g/cm3)
Component Mole
Fraction (%)
Mw
(g/mol)
Density
(g/cm3)
N2 7.65∙10-6 28.01 0.0012 C14 4.27 190 0.836
CO2 0.01 44.01 0.0019 C15 4.19 206 0.842
C1 0.33 16.04 0.0007 C16 3.45 222 0.849
C2 0.25 30.07 0.0028 C17 2.85 237 0.845
C3 0.28 44.1 0.002 C18 2.81 251 0.848
iC4 0.33 58.12 0.0025 C19 2.46 263 0.858
nC4 0.49 58.12 0.0025 C20 2.11 275 0.863
iC5 0.78 72.15 0.616 C21 1.84 291 0.868
nC5 0.44 72.15 0.626 C22 1.61 305 0.873
C6 1.76 86.18 0.655 C23 1.49 318 0.877
C7 5.32 96 0.738 C24 1.32 331 0.881
C8 7.96 107 0.765 C25 1.16 345 0.885
C9 7.07 121 0.781 C26 1.09 359 0.889
C10 6.65 134 0.792 C27 0.99 374 0.893
C11 5.15 147 0.796 C28 0.95 388 0.897
C12 4.61 161 0.810 C29 0.93 402 0.900
C13 4.49 175 0.825 C30+ 20.54 449.1 0.989
o First Separator at 30 bar & 40°C
Table A4. Composition from Gas Condensate Petroleum Reservoir Fluid
Component Mole Fraction
(%)
Mw
(g/mol)
Density
(g/cm3)
Component Mole Fraction
(%)
Mw
(g/mol)
Density
(g/cm3)
N2 2.6∙10-6 28.01 0.0012 C9 9.91 121 0.801
CO2 0.01 44.01 0.0019 C10 6.58 133 0.809
C1 0.17 16.04 0.0007 C11 3.88 146 0.808
C2 0.47 30.07 0.0028 C12 3.04 160 0.819
C3 2.48 44.1 0.002 C13 3.06 176 0.840
iC4 1.46 58.12 0.0025 C14 2.62 187 0.850
nC4 4.13 58.12 0.0025 C15 2.41 200 0.856
iC5 3.64 72.15 0.616 C16 1.53 212 0.862
nC5 4.77 72.15 0.626 C17 1.97 230 0.844
C6 9.53 85 0.678 C18 1.09 243 0.844
C7 14.48 90 0.747 C19 0.88 256 0.853
C8 17.51 102 0.776 C20+ 4.38 336 0.869

49
Table A5. Composition from Near Critical Petroleum Reservoir Fluid
Component Mole Fraction
(%)
Mw
(g/mol)
Density
(g/cm3)
Component Mole Fraction
(%)
Mw
(g/mol)
Density
(g/cm3)
N2 3.97∙10-6 28.01 0.0012 C9 7.41 119 0.775
CO2 0.02 44.01 0.0019 C10 4.02 134 0.788
C1 0.16 16.04 0.0007 C11 3.77 148 0.791
C2 0.46 30.07 0.0028 C12 4.14 162 0.801
C3 1.85 44.1 0.002 C13 3.57 177 0.818
iC4 1.1 58.12 0.0025 C14 2.95 188 0.830
nC4 2.75 58.12 0.0025 C15 3.3 201 0.836
iC5 2.31 72.15 0.616 C16 2.12 215 0.841
nC5 2.84 72.15 0.626 C17 2.42 234 0.839
C6 5.49 85 0.677 C18 2.29 250 0.843
C7 9.28 92 0.734 C19 2.03 264 0.852
C8 11.32 104 0.756 C20+ 24.37 496 0.913
Table A6. Composition from Black Oil Petroleum Reservoir Fluid
Component Mole
Fraction (%)
Mw
(g/mol)
Density
(g/cm3)
Component Mole Fraction
(%)
Mw
(g/mol)
Density
(g/cm3)
N2 6.05∙10-6 28.01 0.0012 C14 4.17 190 0.836
CO2 0.015 44.01 0.0019 C15 4.09 206 0.842
C1 0.34 16.04 0.0007 C16 3.36 222 0.849
C2 0.4 30.07 0.0028 C17 2.78 237 0.845
C3 0.51 44.1 0.002 C18 2.74 251 0.848
iC4 0.56 58.12 0.0025 C19 2.39 263 0.858
nC4 0.79 58.12 0.0025 C20 2.05 275 0.863
iC5 1.05 72.15 0.616 C21 1.79 291 0.868
nC5 0.57 72.15 0.626 C22 1.57 305 0.873
C6 1.94 86.18 0.655 C23 1.44 318 0.877
C7 5.57 96 0.738 C24 1.29 331 0.881
C8 8.07 107 0.765 C25 1.13 345 0.885
C9 7.01 121 0.781 C26 1.07 359 0.889
C10 6.54 134 0.792 C27 0.97 374 0.893
C11 5.05 147 0.796 C28 0.93 388 0.897
C12 4.51 161 0.810 C29 0.91 402 0.900
C13 4.39 175 0.825 C30+ 20.01 449.1 0.989
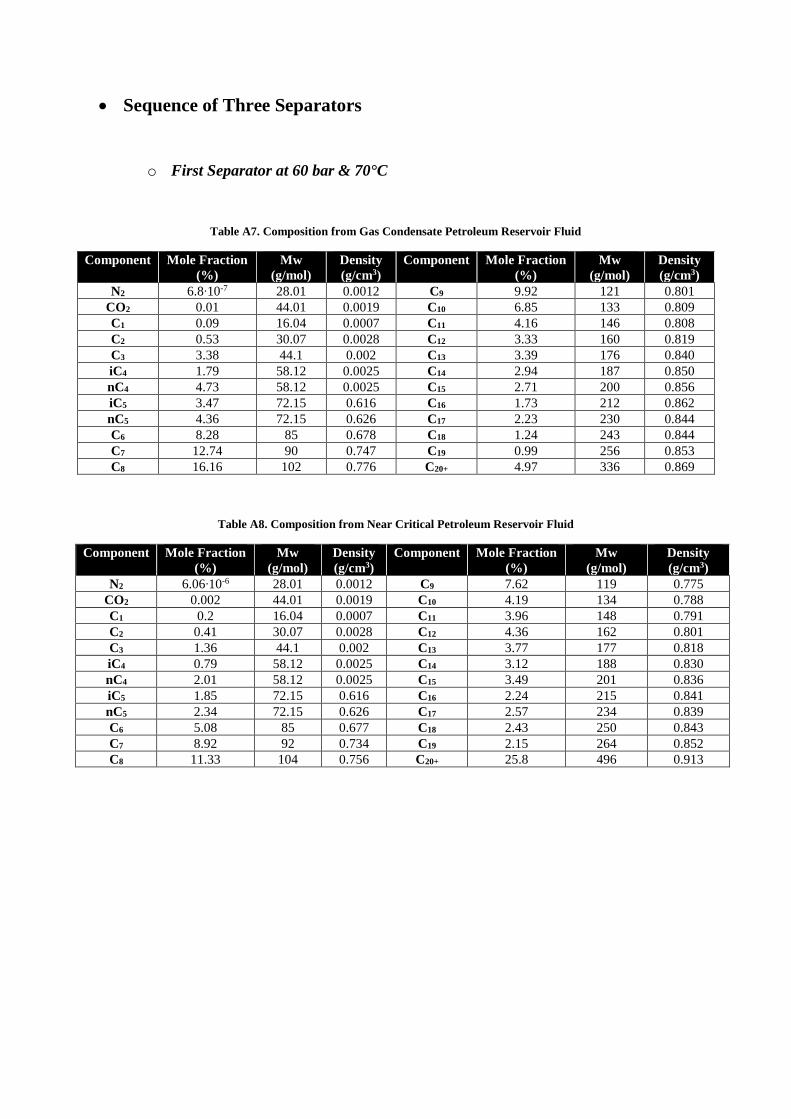
• Sequence of Three Separators
o First Separator at 60 bar & 70°C
Table A7. Composition from Gas Condensate Petroleum Reservoir Fluid
Component Mole Fraction
(%)
Mw
(g/mol)
Density
(g/cm3)
Component Mole Fraction
(%)
Mw
(g/mol)
Density
(g/cm3)
N2 6.8∙10-7 28.01 0.0012 C9 9.92 121 0.801
CO2 0.01 44.01 0.0019 C10 6.85 133 0.809
C1 0.09 16.04 0.0007 C11 4.16 146 0.808
C2 0.53 30.07 0.0028 C12 3.33 160 0.819
C3 3.38 44.1 0.002 C13 3.39 176 0.840
iC4 1.79 58.12 0.0025 C14 2.94 187 0.850
nC4 4.73 58.12 0.0025 C15 2.71 200 0.856
iC5 3.47 72.15 0.616 C16 1.73 212 0.862
nC5 4.36 72.15 0.626 C17 2.23 230 0.844
C6 8.28 85 0.678 C18 1.24 243 0.844
C7 12.74 90 0.747 C19 0.99 256 0.853
C8 16.16 102 0.776 C20+ 4.97 336 0.869
Table A8. Composition from Near Critical Petroleum Reservoir Fluid
Component Mole Fraction
(%)
Mw
(g/mol)
Density
(g/cm3)
Component Mole Fraction
(%)
Mw
(g/mol)
Density
(g/cm3)
N2 6.06∙10-6 28.01 0.0012 C9 7.62 119 0.775
CO2 0.002 44.01 0.0019 C10 4.19 134 0.788
C1 0.2 16.04 0.0007 C11 3.96 148 0.791
C2 0.41 30.07 0.0028 C12 4.36 162 0.801
C3 1.36 44.1 0.002 C13 3.77 177 0.818
iC4 0.79 58.12 0.0025 C14 3.12 188 0.830
nC4 2.01 58.12 0.0025 C15 3.49 201 0.836
iC5 1.85 72.15 0.616 C16 2.24 215 0.841
nC5 2.34 72.15 0.626 C17 2.57 234 0.839
C6 5.08 85 0.677 C18 2.43 250 0.843
C7 8.92 92 0.734 C19 2.15 264 0.852
C8 11.33 104 0.756 C20+ 25.8 496 0.913
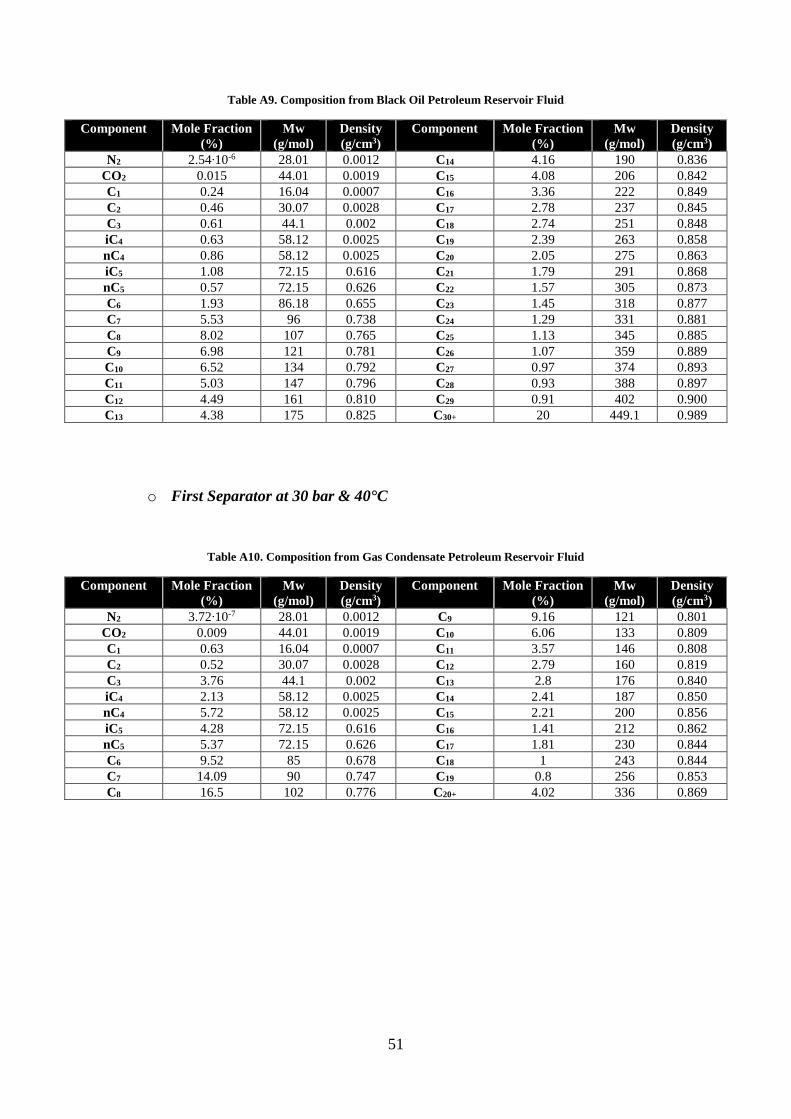
51
Table A9. Composition from Black Oil Petroleum Reservoir Fluid
Component Mole Fraction
(%)
Mw
(g/mol)
Density
(g/cm3)
Component Mole Fraction
(%)
Mw
(g/mol)
Density
(g/cm3)
N2 2.54∙10-6 28.01 0.0012 C14 4.16 190 0.836
CO2 0.015 44.01 0.0019 C15 4.08 206 0.842
C1 0.24 16.04 0.0007 C16 3.36 222 0.849
C2 0.46 30.07 0.0028 C17 2.78 237 0.845
C3 0.61 44.1 0.002 C18 2.74 251 0.848
iC4 0.63 58.12 0.0025 C19 2.39 263 0.858
nC4 0.86 58.12 0.0025 C20 2.05 275 0.863
iC5 1.08 72.15 0.616 C21 1.79 291 0.868
nC5 0.57 72.15 0.626 C22 1.57 305 0.873
C6 1.93 86.18 0.655 C23 1.45 318 0.877
C7 5.53 96 0.738 C24 1.29 331 0.881
C8 8.02 107 0.765 C25 1.13 345 0.885
C9 6.98 121 0.781 C26 1.07 359 0.889
C10 6.52 134 0.792 C27 0.97 374 0.893
C11 5.03 147 0.796 C28 0.93 388 0.897
C12 4.49 161 0.810 C29 0.91 402 0.900
C13 4.38 175 0.825 C30+ 20 449.1 0.989
o First Separator at 30 bar & 40°C
Table A10. Composition from Gas Condensate Petroleum Reservoir Fluid
Component Mole Fraction
(%)
Mw
(g/mol)
Density
(g/cm3)
Component Mole Fraction
(%)
Mw
(g/mol)
Density
(g/cm3)
N2 3.72∙10-7 28.01 0.0012 C9 9.16 121 0.801
CO2 0.009 44.01 0.0019 C10 6.06 133 0.809
C1 0.63 16.04 0.0007 C11 3.57 146 0.808
C2 0.52 30.07 0.0028 C12 2.79 160 0.819
C3 3.76 44.1 0.002 C13 2.8 176 0.840
iC4 2.13 58.12 0.0025 C14 2.41 187 0.850
nC4 5.72 58.12 0.0025 C15 2.21 200 0.856
iC5 4.28 72.15 0.616 C16 1.41 212 0.862
nC5 5.37 72.15 0.626 C17 1.81 230 0.844
C6 9.52 85 0.678 C18 1 243 0.844
C7 14.09 90 0.747 C19 0.8 256 0.853
C8 16.5 102 0.776 C20+ 4.02 336 0.869

Table A11. Composition from Near Critical Petroleum Reservoir Fluid
Component Mole Fraction
(%)
Mw
(g/mol)
Density
(g/cm3)
Component Mole Fraction
(%)
Mw
(g/mol)
Density
(g/cm3)
N2 5.69∙10-7 28.01 0.0012 C9 7.07 119 0.775
CO2 0.02 44.01 0.0019 C10 3.81 134 0.788
C1 0.06 16.04 0.0007 C11 3.57 148 0.791
C2 0.51 30.07 0.0028 C12 3.91 162 0.801
C3 2.94 44.1 0.002 C13 3.37 177 0.818
iC4 1.66 58.12 0.0025 C14 2.79 188 0.830
nC4 3.92 58.12 0.0025 C15 3.13 201 0.836
iC5 2.77 72.15 0.616 C16 2 215 0.841
nC5 3.26 72.15 0.626 C17 2.29 234 0.839
C6 5.62 85 0.677 C18 2.17 250 0.843
C7 9.21 92 0.734 C19 1.92 264 0.852
C8 10.94 104 0.756 C20+ 23.05 496 0.913
Table A12. Composition from Black Oil Petroleum Reservoir Fluid
Component Mole Fraction
(%)
Mw
(g/mol)
Density
(g/cm3)
Component Mole Fraction
(%)
Mw
(g/mol)
Density
(g/cm3)
N2 2.03∙10-6 28.01 0.0012 C14 4.11 190 0.836
CO2 0.02 44.01 0.0019 C15 4.03 206 0.842
C1 0.26 16.04 0.0007 C16 3.31 222 0.849
C2 0.67 30.07 0.0028 C17 2.74 237 0.845
C3 0.83 44.1 0.002 C18 2.7 251 0.848
iC4 0.77 58.12 0.0025 C19 2.36 263 0.858
nC4 1.02 58.12 0.0025 C20 2.02 275 0.863
iC5 1.18 72.15 0.616 C21 1.77 291 0.868
nC5 0.62 72.15 0.626 C22 1.55 305 0.873
C6 1.98 86.18 0.655 C23 1.43 318 0.877
C7 5.58 96 0.738 C24 1.27 331 0.881
C8 8.02 107 0.765 C25 1.11 345 0.885
C9 6.94 121 0.781 C26 1.05 359 0.889
C10 6.46 134 0.792 C27 0.95 374 0.893
C11 4.98 147 0.796 C28 0.91 388 0.897
C12 4.44 161 0.810 C29 0.89 402 0.900
C13 4.32 175 0.825 C30+ 19.72 449.1 0.989

53
Results of the Objective Function (Ф)
Sequence of Two Separators
• First separator at 60 bar & 70°C
o Gas Condensate Mixture
Table A13. Trend of the Objective Function, varying Pressure and Temperature of Second Separator
Temperature (°C)
Pressure (bar)
69 63 57 51 45 39 33 27 21 15
59 0.333 0.333 0.333 0.333 0.333 0.333 0.333 0.333 0.333 0.333
52.6 0.332 0.332 0.333 0.333 0.333 0.333 0.333 0.333 0.333 0.333
46.2 0.330 0.331 0.331 0.332 0.332 0.333 0.333 0.333 0.333 0.333
39.7 0.327 0.329 0.329 0.330 0.331 0.332 0.332 0.333 0.333 0.333
33.3 0.325 0.326 0.327 0.328 0.329 0.330 0.331 0.331 0.332 0.332
26.9 0.321 0.323 0.324 0.326 0.327 0.328 0.329 0.330 0.331 0.331
20.5 0.315 0.317 0.319 0.321 0.323 0.325 0.326 0.328 0.329 0.330
14.1 0.304 0.308 0.311 0.314 0.317 0.319 0.321 0.323 0.325 0.326
7.6 0.283 0.288 0.293 0.297 0.302 0.306 0.309 0.313 0.316 0.319
1.2 0.189 0.201 0.211 0.222 0.231 0.240 0.248 0.256 0.263 0.270
o Near Critical Mixture
Table A14. Trend of the Objective Function, varying Pressure and Temperature of Second Separator
Temperature (°C)
Pressure (bar)
69 63 57 51 45 39 33 27 21 15
59 0.815 0.815 0.815 0.815 0.815 0.815 0.815 0.815 0.815 0.815
52.6 0.812 0.813 0.814 0.815 0.815 0.815 0.815 0.815 0.815 0.815
46.2 0.809 0.811 0.812 0.813 0.813 0.814 0.815 0.815 0.815 0.815
39.7 0.806 0.808 0.809 0.810 0.811 0.812 0.813 0.814 0.814 0.815
33.3 0.802 0.804 0.805 0.807 0.809 0.810 0.811 0.812 0.813 0.813
26.9 0.795 0.798 0.801 0.803 0.805 0.807 0.808 0.809 0.811 0.812
20.5 0.786 0.790 0.793 0.796 0.799 0.801 0.804 0.806 0.807 0.809
14.1 0.770 0.775 0.780 0.785 0.789 0.792 0.796 0.799 0.801 0.804
7.6 0.736 0.744 0.751 0.758 0.765 0.771 0.776 0.782 0.786 0.791
1.2 0.592 0.608 0.624 0.638 0.652 0.665 0.677 0.688 0.699 0.710
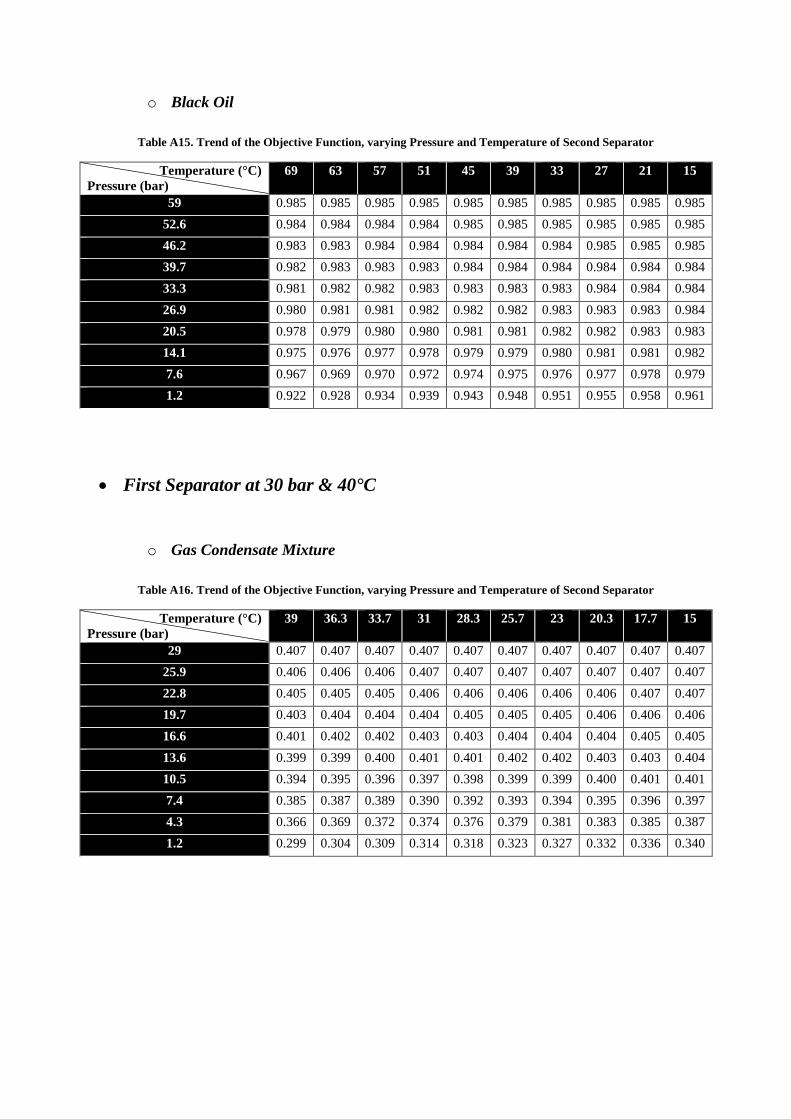
o Black Oil
Table A15. Trend of the Objective Function, varying Pressure and Temperature of Second Separator
Temperature (°C)
Pressure (bar)
69 63 57 51 45 39 33 27 21 15
59 0.985 0.985 0.985 0.985 0.985 0.985 0.985 0.985 0.985 0.985
52.6 0.984 0.984 0.984 0.984 0.985 0.985 0.985 0.985 0.985 0.985
46.2 0.983 0.983 0.984 0.984 0.984 0.984 0.984 0.985 0.985 0.985
39.7 0.982 0.983 0.983 0.983 0.984 0.984 0.984 0.984 0.984 0.984
33.3 0.981 0.982 0.982 0.983 0.983 0.983 0.983 0.984 0.984 0.984
26.9 0.980 0.981 0.981 0.982 0.982 0.982 0.983 0.983 0.983 0.984
20.5 0.978 0.979 0.980 0.980 0.981 0.981 0.982 0.982 0.983 0.983
14.1 0.975 0.976 0.977 0.978 0.979 0.979 0.980 0.981 0.981 0.982
7.6 0.967 0.969 0.970 0.972 0.974 0.975 0.976 0.977 0.978 0.979
1.2 0.922 0.928 0.934 0.939 0.943 0.948 0.951 0.955 0.958 0.961
• First Separator at 30 bar & 40°C
o Gas Condensate Mixture
Table A16. Trend of the Objective Function, varying Pressure and Temperature of Second Separator
Temperature (°C)
Pressure (bar)
39 36.3 33.7 31 28.3 25.7 23 20.3 17.7 15
29 0.407 0.407 0.407 0.407 0.407 0.407 0.407 0.407 0.407 0.407
25.9 0.406 0.406 0.406 0.407 0.407 0.407 0.407 0.407 0.407 0.407
22.8 0.405 0.405 0.405 0.406 0.406 0.406 0.406 0.406 0.407 0.407
19.7 0.403 0.404 0.404 0.404 0.405 0.405 0.405 0.406 0.406 0.406
16.6 0.401 0.402 0.402 0.403 0.403 0.404 0.404 0.404 0.405 0.405
13.6 0.399 0.399 0.400 0.401 0.401 0.402 0.402 0.403 0.403 0.404
10.5 0.394 0.395 0.396 0.397 0.398 0.399 0.399 0.400 0.401 0.401
7.4 0.385 0.387 0.389 0.390 0.392 0.393 0.394 0.395 0.396 0.397
4.3 0.366 0.369 0.372 0.374 0.376 0.379 0.381 0.383 0.385 0.387
1.2 0.299 0.304 0.309 0.314 0.318 0.323 0.327 0.332 0.336 0.340

55
o Near Critical Mixture
Table A17. Trend of the Objective Function, varying Pressure and Temperature of Second Separator
Temperature (°C)
Pressure (bar)
39 36.3 33.7 31 28.3 25.7 23 20.3 17.7 15
29 0.832 0.832 0.832 0.832 0.832 0.832 0.832 0.832 0.832 0.832
25.9 0.831 0.831 0.831 0.831 0.832 0.832 0.832 0.832 0.832 0.832
22.8 0.829 0.830 0.830 0.830 0.831 0.831 0.831 0.831 0.832 0.832
19.7 0.827 0.828 0.828 0.829 0.829 0.829 0.830 0.830 0.830 0.831
16.6 0.825 0.825 0.826 0.827 0.827 0.828 0.828 0.829 0.829 0.829
13.6 0.821 0.822 0.823 0.823 0.824 0.825 0.826 0.826 0.827 0.827
10.5 0.815 0.816 0.817 0.818 0.820 0.821 0.822 0.823 0.823 0.824
7.4 0.804 0.806 0.808 0.809 0.811 0.813 0.814 0.816 0.817 0.819
4.3 0.779 0.783 0.786 0.789 0.792 0.794 0.797 0.800 0.802 0.804
1.2 0.697 0.703 0.708 0.714 0.719 0.724 0.729 0.734 0.739 0.744
o Black Oil Mixture
Table A18. Trend of the Objective Function, varying Pressure and Temperature of Second Separator
Temperature (°C)
Pressure (bar)
39 36.3 33.7 31 28.3 25.7 23 20.3 17.7 15
29 0.986 0.986 0.986 0.986 0.986 0.986 0.986 0.986 0.986 0.986
25.9 0.985 0.985 0.986 0.986 0.986 0.986 0.986 0.986 0.986 0.986
22.8 0.985 0.985 0.985 0.985 0.985 0.985 0.985 0.986 0.986 0.986
19.7 0.985 0.985 0.985 0.985 0.985 0.985 0.985 0.985 0.985 0.985
16.6 0.984 0.984 0.984 0.985 0.985 0.985 0.985 0.985 0.985 0.985
13.6 0.983 0.984 0.984 0.984 0.984 0.984 0.984 0.984 0.985 0.985
10.5 0.982 0.983 0.983 0.983 0.983 0.983 0.984 0.984 0.984 0.984
7.4 0.980 0.981 0.981 0.981 0.982 0.982 0.982 0.982 0.983 0.983
4.3 0.976 0.977 0.977 0.978 0.978 0.979 0.979 0.980 0.980 0.980
1.2 0.958 0.960 0.961 0.962 0.964 0.965 0.966 0.967 0.968 0.969

Recovery of C3+ Hydrocarbons in Crude Oil (Roil)
Sequence of Two Separators
• First Separator at 60 bar & 70°C
o Gas Condensate Mixture
Table A19. Trend of C3+ Hydrocarbons Recovery in Crude Oil, varying Pressure and Temperature of Second Separator
Temperature (°C)
Pressure (bar)
69 63 57 51 45 39 33 27 21 15
59 0.332 0.333 0.333 0.333 0.333 0.333 0.333 0.333 0.333 0.333
52.6 0.331 0.331 0.332 0.332 0.333 0.333 0.333 0.333 0.333 0.333
46.2 0.329 0.330 0.330 0.331 0.332 0.332 0.332 0.333 0.333 0.333
39.7 0.327 0.328 0.329 0.329 0.330 0.331 0.331 0.332 0.332 0.332
33.3 0.324 0.325 0.326 0.327 0.328 0.329 0.330 0.331 0.331 0.332
26.9 0.320 0.322 0.323 0.325 0.326 0.327 0.328 0.329 0.330 0.330
20.5 0.314 0.316 0.319 0.321 0.322 0.324 0.325 0.327 0.328 0.329
14.1 0.304 0.307 0.310 0.313 0.316 0.318 0.321 0.322 0.324 0.326
7.6 0.282 0.287 0.292 0.297 0.301 0.305 0.309 0.312 0.315 0.318
1.2 0.188 0.200 0.211 0.221 0.230 0.239 0.247 0.255 0.262 0.269
o Near Critical Mixture
Table A20. Trend of C3+ Hydrocarbons Recovery in Crude Oil, varying Pressure and Temperature of Second Separator
Temperature (°C)
Pressure (bar)
69 63 57 51 45 39 33 27 21 15
59 0.815 0.815 0.815 0.815 0.815 0.815 0.815 0.815 0.815 0.815
52.6 0.812 0.813 0.814 0.815 0.815 0.815 0.815 0.815 0.815 0.815
46.2 0.809 0.811 0.812 0.813 0.813 0.814 0.815 0.815 0.815 0.815
39.7 0.806 0.807 0.809 0.810 0.811 0.812 0.813 0.814 0.814 0.815
33.3 0.801 0.803 0.805 0.807 0.808 0.810 0.811 0.812 0.813 0.813
26.9 0.795 0.798 0.800 0.803 0.805 0.806 0.808 0.809 0.810 0.811
20.5 0.786 0.790 0.793 0.796 0.799 0.801 0.803 0.805 0.807 0.809
14.1 0.770 0.775 0.780 0.784 0.788 0.792 0.795 0.798 0.801 0.804
7.6 0.736 0.743 0.751 0.758 0.764 0.770 0.776 0.781 0.786 0.791
1.2 0.592 0.608 0.623 0.638 0.651 0.664 0.676 0.688 0.699 0.710

57
o Black Oil Mixture
Table A21. Trend of C3+ Hydrocarbons Recovery in Crude Oil, varying Pressure and Temperature of Second Separator
Temperature (°C)
Pressure (bar)
69 63 57 51 45 39 33 27 21 15
59 0.985 0.985 0.985 0.985 0.985 0.985 0.985 0.985 0.985 0.985
52.6 0.984 0.984 0.984 0.984 0.985 0.985 0.985 0.985 0.985 0.985
46.2 0.983 0.983 0.984 0.984 0.984 0.984 0.984 0.985 0.985 0.985
39.7 0.982 0.983 0.983 0.983 0.984 0.984 0.984 0.984 0.984 0.984
33.3 0.981 0.982 0.982 0.983 0.983 0.983 0.983 0.984 0.984 0.984
26.9 0.980 0.981 0.981 0.982 0.982 0.982 0.983 0.983 0.983 0.984
20.5 0.978 0.979 0.980 0.980 0.981 0.981 0.982 0.982 0.983 0.983
14.1 0.975 0.976 0.977 0.978 0.979 0.979 0.980 0.981 0.981 0.982
7.6 0.967 0.969 0.970 0.972 0.974 0.975 0.976 0.977 0.978 0.979
1.2 0.922 0.928 0.934 0.939 0.943 0.948 0.951 0.955 0.958 0.961
• First Separator at 30 bar & 40°C
o Gas Condensate
Table A22. Trend of C3+ Hydrocarbons Recovery in Crude Oil, varying Pressure and Temperature of Second Separator
Temperature (°C)
Pressure (bar)
39 36.3 33.7 31 28.3 25.7 23 20.3 17.7 15
29 0.406 0.406 0.406 0.406 0.406 0.406 0.406 0.406 0.406 0.406
25.9 0.405 0.405 0.406 0.406 0.406 0.406 0.406 0.406 0.406 0.406
22.8 0.404 0.404 0.405 0.405 0.405 0.405 0.406 0.406 0.406 0.406
19.7 0.403 0.403 0.403 0.404 0.404 0.404 0.405 0.405 0.405 0.405
16.6 0.401 0.401 0.402 0.402 0.403 0.403 0.403 0.404 0.404 0.404
13.6 0.398 0.399 0.399 0.400 0.401 0.401 0.402 0.402 0.403 0.403
10.5 0.393 0.394 0.395 0.396 0.397 0.398 0.399 0.399 0.400 0.401
7.4 0.385 0.386 0.388 0.389 0.391 0.392 0.393 0.394 0.396 0.397
4.3 0.365 0.368 0.371 0.373 0.376 0.378 0.380 0.382 0.384 0.386
1.2 0.298 0.303 0.308 0.313 0.318 0.322 0.326 0.331 0.335 0.339

o Near Critical Mixture
Table A23. Trend of C3+ Hydrocarbons Recovery in Crude Oil, varying Pressure and Temperature of Second Separator
Temperature (°C)
Pressure (bar)
39 36.3 33.7 31 28.3 25.7 23 20.3 17.7 15
29 0.832 0.832 0.832 0.832 0.832 0.832 0.832 0.832 0.832 0.832
25.9 0.831 0.831 0.831 0.831 0.832 0.832 0.832 0.832 0.832 0.832
22.8 0.829 0.829 0.830 0.830 0.830 0.831 0.831 0.831 0.831 0.832
19.7 0.827 0.828 0.828 0.829 0.829 0.829 0.830 0.830 0.830 0.831
16.6 0.824 0.825 0.826 0.826 0.827 0.827 0.828 0.828 0.829 0.829
13.6 0.821 0.821 0.822 0.823 0.824 0.825 0.825 0.826 0.827 0.827
10.5 0.814 0.816 0.817 0.818 0.819 0.821 0.822 0.822 0.823 0.824
7.4 0.803 0.805 0.807 0.809 0.811 0.813 0.814 0.816 0.817 0.818
4.3 0.779 0.782 0.785 0.789 0.791 0.794 0.797 0.799 0.802 0.804
1.2 0.697 0.702 0.708 0.713 0.719 0.724 0.729 0.734 0.739 0.744
o Black Oil Mixture
Table A24. Trend of C3+ Hydrocarbons Recovery in Crude Oil, varying Pressure and Temperature of Second Separator
Temperature (°C)
Pressure (bar)
39 36.3 33.7 31 28.3 25.7 23 20.3 17.7 15
29 0.986 0.986 0.986 0.986 0.986 0.986 0.986 0.986 0.986 0.986
25.9 0.985 0.985 0.986 0.986 0.986 0.986 0.986 0.986 0.986 0.986
22.8 0.985 0.985 0.985 0.985 0.985 0.985 0.985 0.986 0.986 0.986
19.7 0.985 0.985 0.985 0.985 0.985 0.985 0.985 0.985 0.985 0.985
16.6 0.984 0.984 0.984 0.985 0.985 0.985 0.985 0.985 0.985 0.985
13.6 0.983 0.984 0.984 0.984 0.984 0.984 0.984 0.984 0.985 0.985
10.5 0.982 0.982 0.983 0.983 0.983 0.983 0.984 0.984 0.984 0.984
7.4 0.980 0.981 0.981 0.981 0.982 0.982 0.982 0.982 0.983 0.983
4.3 0.976 0.977 0.977 0.978 0.978 0.979 0.979 0.980 0.980 0.980
1.2 0.958 0.960 0.961 0.962 0.964 0.965 0.966 0.967 0.968 0.969

59
Bubble Point Pressure of Crude Oil at 15°C
Sequence of Two Separators
• First Separator at 60 bar & 70°C
o Gas Condensate Mixture
Table A25. Trend of Bubble Point Pressure (bar) of Crude Oil at 15°C, varying Pressure and Temperature of Second
Separator
Temperature (°C)
Pressure (bar)
69 63 57 51 45 39 33 27 21 15
59 41.46 41.99 41.99 41.99 41.99 41.99 41.99 41.99 41.99 41.99
52.6 36.60 37.89 39.28 40.76 41.99 41.99 41.99 41.99 41.99 41.99
46.2 31.78 32.95 34.20 35.54 36.98 38.53 40.21 41.99 41.99 41.99
39.7 27.00 28.04 29.16 30.35 31.63 33.00 34.48 36.09 37.83 39.73
33.3 22.26 23.18 24.15 25.19 26.30 27.49 28.78 30.17 31.67 33.31
26.9 17.59 18.36 19.18 20.06 21.00 22.00 23.09 24.25 25.52 26.89
20.5 12.99 13.61 14.27 14.98 15.74 16.55 17.42 18.36 19.37 20.47
14.1 8.52 8.98 9.46 9.98 10.54 11.14 11.79 12.48 13.23 14.04
7.6 4.27 4.54 4.83 5.14 5.47 5.83 6.23 6.66 7.12 7.62
1.2 0.51 0.56 0.62 0.67 0.74 0.81 0.89 0.98 1.09 1.20
o Near Critical Mixture
Table A26. Trend of Bubble Point Pressure (bar) of Crude Oil at 15°C, varying Pressure and Temperature of Second
Separator
Temperature (°C)
Pressure (bar)
69 63 57 51 45 39 33 27 21 15
59 41.04 41.54 41.54 41.54 41.54 41.54 41.54 41.54 41.54 41.54
52.6 36.30 37.63 39.05 40.57 41.54 41.54 41.54 41.54 41.54 41.54
46.2 31.59 32.78 34.06 35.42 36.88 38.46 40.15 41.54 41.54 41.54
39.7 26.91 27.96 29.09 30.29 31.58 32.97 34.46 36.07 37.83 39.73
33.3 22.26 23.17 24.15 25.18 26.30 27.49 28.78 30.17 31.67 33.31
26.9 17.66 18.42 19.24 20.10 21.04 22.04 23.11 24.27 25.53 26.89
20.5 13.12 13.72 14.37 15.06 15.81 16.60 17.46 18.38 19.38 20.47
14.1 8.68 9.12 9.59 10.09 10.63 11.21 11.84 12.52 13.25 14.04
7.6 4.41 4.67 4.94 5.24 5.56 5.91 6.28 6.69 7.14 7.62
1.2 0.56 0.60 0.65 0.71 0.77 0.84 0.91 1.00 1.09 1.20

o Black Oil Mixture
Table A27. Trend of Bubble Point Pressure (bar) of Crude Oil at 15°C, varying Pressure and Temperature of Second
Separator
Temperature (°C)
Pressure (bar)
69 63 57 51 45 39 33 27 21 15
59 43.77 44.35 44.35 44.35 44.35 44.35 44.35 44.35 44.35 44.35
52.6 38.85 39.90 41.03 42.27 43.62 44.35 44.35 44.35 44.35 44.35
46.2 33.96 34.89 35.91 37.01 38.20 39.51 40.94 42.52 44.25 44.35
39.7 29.10 29.92 30.80 31.76 32.80 33.95 35.19 36.56 38.07 39.73
33.3 24.27 24.96 25.71 26.53 27.42 28.39 29.46 30.62 31.90 33.31
26.9 19.46 20.03 20.65 21.32 22.06 22.86 23.73 24.68 25.73 26.89
20.5 14.68 15.13 15.61 16.14 16.71 17.33 18.01 18.75 19.57 20.47
14.1 9.94 10.26 10.60 10.98 11.38 11.83 12.31 12.83 13.41 14.04
7.6 5.26 5.45 5.65 5.86 6.10 6.35 6.63 6.93 7.26 7.62
1.2 0.74 0.78 0.82 0.86 0.91 0.96 1.01 1.07 1.13 1.20
• First Separator at 30 bar & 40°C
o Gas Condensate Mixture
Table A28. Trend of Bubble Point Pressure (bar) of Crude Oil at 15°C, varying Pressure and Temperature of Second
Separator
Temperature (°C)
Pressure (bar)
39 36.3 33.7 31 28.3 25.7 23 20.3 17.7 15
29 23.86 24.37 24.54 24.54 24.54 24.54 24.54 24.54 24.54 24.54
25.9 21.21 21.67 22.14 22.63 23.13 23.65 24.19 24.54 24.54 24.54
22.8 18.56 18.98 19.41 19.85 20.31 20.78 21.26 21.77 22.29 22.82
19.7 15.92 16.29 16.68 17.08 17.49 17.91 18.34 18.79 19.25 19.73
16.6 13.29 13.62 13.96 14.31 14.67 15.04 15.42 15.82 16.22 16.64
13.6 10.67 10.96 11.25 11.55 11.86 12.18 12.51 12.85 13.20 13.56
10.5 8.08 8.32 8.56 8.81 9.07 9.33 9.60 9.88 10.17 10.47
7.4 5.53 5.72 5.90 6.09 6.29 6.50 6.71 6.92 7.15 7.38
4.3 3.06 3.18 3.30 3.43 3.56 3.70 3.84 3.98 4.13 4.29
1.2 0.76 0.80 0.84 0.89 0.93 0.98 1.03 1.08 1.14 1.20

61
o Near Critical Mixture
Table A29. Trend of Bubble Point Pressure (bar) of Crude Oil at 15°C, varying Pressure and Temperature of Second
Separator
Temperature (°C)
Pressure (bar)
39 36.3 33.7 31 28.3 25.7 23 20.3 17.7 15
29 23.87 24.37 24.54 24.54 24.54 24.54 24.54 24.54 24.54 24.54
25.9 21.23 21.69 22.16 22.65 23.15 23.66 24.20 24.54 24.54 24.54
22.8 18.60 19.01 19.44 19.88 20.33 20.80 21.28 21.78 22.29 22.82
19.7 15.98 16.34 16.72 17.11 17.52 17.93 18.36 18.80 19.26 19.73
16.6 13.36 13.68 14.01 14.36 14.71 15.07 15.45 15.83 16.23 16.64
13.6 10.76 11.03 11.32 11.61 11.91 12.22 12.54 12.87 13.20 13.56
10.5 8.18 8.40 8.63 8.87 9.12 9.37 9.63 9.90 10.18 10.47
7.4 5.63 5.80 5.98 6.16 6.35 6.54 6.74 6.94 7.16 7.38
4.3 3.15 3.26 3.37 3.49 3.61 3.73 3.87 4.00 4.14 4.29
1.2 0.80 0.84 0.88 0.92 0.96 1.00 1.05 1.10 1.15 1.20
o Black Oil
Table A30. Trend of Bubble Point Pressure (bar) of Crude Oil at 15°C, varying Pressure and Temperature of Second
Separator
Temperature (°C)
Pressure (bar)
39 36.3 33.7 31 28.3 25.7 23 20.3 17.7 15
29 24.70 25.11 25.41 25.41 25.41 25.41 25.41 25.41 25.41 25.41
25.9 22.03 22.40 22.78 23.17 23.58 24.01 24.46 24.92 25.41 25.41
22.8 19.36 19.69 20.03 20.38 20.75 21.13 21.53 21.94 22.37 22.82
19.7 16.70 16.99 17.29 17.60 17.92 18.25 18.60 18.96 19.34 19.73
16.6 14.05 14.29 14.55 14.81 15.09 15.37 15.67 15.98 16.31 16.64
13.6 11.39 11.60 11.81 12.03 12.26 12.50 12.75 13.01 13.28 13.56
10.5 8.75 8.91 9.08 9.26 9.44 9.63 9.83 10.03 10.24 10.47
7.4 6.12 6.24 6.36 6.49 6.62 6.76 6.91 7.06 7.21 7.38
4.3 3.50 3.58 3.66 3.74 3.82 3.91 4.00 4.09 4.19 4.29
1.2 0.94 0.96 0.99 1.02 1.04 1.07 1.10 1.13 1.17 1.20
