optimization of selected fermentation ...studentsrepo.um.edu.my/4767/1/final_thesis.pdf2...
TRANSCRIPT

1

2
OPTIMIZATION OF SELECTED FERMENTATION PARAMETERS FOR MICROBIAL BIOHYDROGEN
PRODUCTION USING FOOD WASTE AS THE MAJOR SUBSTRATE
NURUL AZWA BINTI MOHD YUNUS
FACULTY OF SCIENCE UNIVERSITY OF MALAYA
KUALA LUMPUR
2014 OPTIMIZATION OF SELECTED FERMENTATION PARAMETERS FOR MICROBIAL BIOHYDROGEN
PRODUCTION USING FOOD WASTE AS THE MAJOR SUBSTRATE

3
NURUL AZWA BINTI MOHD YUNUS
DISSERTATION SUBMITTED IN FULFILLMENT OF THE REQUIREMENTS FOR THE DEGREE OF
MASTER OF BIOTECHNOLOGY
INSTITUTE OF BIOLOGICAL SCIENCES FACULTY OF SCIENCE
UNIVERSITY OF MALAYA KUALA LUMPUR
2014

4

5
UNIVERSITI MALAYA
ORIGINAL LITERARY WORK DECLARATION
Name of Candidate: NURUL AZWA BINTI MOHD YUNUS
I/C/Passport No: 860214-14-5222
Regisration/Matric No.: SGF100007
Name of Degree: MASTER OF BIOTECHNOLOGY
Title of Project Paper/Research Report/Dissertation/Thesis (“this Work”):
“OPTIMIZATION OF SELECTED FERMENTATION PARAMETERS FOR MICROBIAL
BIOHYDROGEN PRODUCTION USING FOOD WASTE AS THE MAJOR SUBSTRATE”
Field of Study: ENVIRONMENTAL BIOTECHNOLOGY
I do solemnly and sincerely declare that:
(1) I am the sole author/writer of this Work, (2) This Work is original, (3) Any use of any work in which copyright exists was done by way of fair dealing and for
permitted purposes and any excerpt or extract from, or reference to or reproduction of any copyright work has been disclosed expressly and sufficiently and the title of the Work and its authorship have been acknowledged in this Work,
(4) I do not have any actual knowledge nor do I ought reasonably to know that the making of this work constitutes an infringement of any copyright work,
(5) I hereby assign all and every rights in the copyright to this Work to the University of Malaya (“UM”), who henceforth shall be owner of the copyright in this Work and that any reproduction or use in any form or by any means whatsoever is prohibited without the written consent of UM having been first had and obtained,
(6) I am fully aware that if in the course of making this Work I have infringed any copyright whether intentionally or otherwise, I may be subject to legal action or any other action as may be determined by UM.
(Candidate Signature) Date:
Subscribed and solemnly declared before,
Witness’s Signature Date:
Name ASSOC. PROF. DR MOHAMAD SUFFIAN MOHAMAD ANNUAR
Designation
Witness’s Signature Date:
Name PROFESSOR DR SHALIZA IBRAHIM
Designation

6
ABSTRACT
The energy crisis and current environmental degradation are the two vital issues
for global sustainable development. Hydrogen is seen as the energy of the future;
looking at the fluctuating price of oil and other natural gases prices, on top of the
increasing global awareness of increasing carbon dioxide level. This carbon dioxide
level is associated to global warming, acid rain and other disastrous phenomenon.
Hydrogen is a sustainable energy source with minimal use of hydrocarbon. These, plus
the high energy yield of 122 kJ/g makes hydrogen an attractive alternative to fossil fuels
(Guo et al, 2010)
The objective of this study was to find the optimum condition for anaerobic co-
digestion of food waste and sewage sludge and hydrogen (H2) production. The selected
parameters for optimization of hydrogen production (e.g. temperature, initial pH,
inoculum size) were analysed using Response Surface Methodology with Full Factorial
Design. Two types of substrates were tested; food waste as a sole substrate (Production
1) and food waste mixed with palm oil mill effluent (POME) at volume ratio 1:1
(Production 2).
The optimized conditions for both Production 1 and Production 2 were pH 4.5,
temperature of 35°C and inoculum size of 20%, (v/v) with maximum predicted
cumulative hydrogen production (MPCHP) of 0.22 ml hydrogen /ml substrate and 0.26
ml hydrogen /ml substrate, respectively.
Subsequent verification experiments at optimal parameter values yielded
cumulative hydrogen of 0.28 ml hydrogen /ml substrate for Production 1 and 0.33 ml
H2/ml substrate for Production 2.

7
ABSTRAK
Krisis tenaga dan pencemaran alam sekitar pada hari ini merupakan dua perkara
mustahak untuk pembangunan terperinci global. Hidrogen dilihat sebagai sumber
tenaga masa hadapan; melihat pada naik turun harga minyak dan gas asli yang lain.
Tambahan pula peningkatan kesedaran tentang kenaikan paras karbon dioksida dunia.
Paras karbon dioksida ini berkait rapat dengan pemanasan global, hujan asid dan
fenomena kemusnahan alam yang lain. Hidrogen ialah sumber tanaga yang boleh
diperbaharui dengan penggunaan hidrokarbon yang minimum. Hidrogen juga mencatat
penghasilan tenaga yang tinggi iaitu sebanyak 122 kJ/g, menjadikannya alternatif yang
menarik kepada minyak fosil (Guo et al, 2010).
Objektif kajian ini adalah untuk mencari keadaan yang paling optimum untuk
penghadaman bersama sisa makanan dan sisa kumbahan serta penghasilan hidrogen.
Parameter yang dipilih untuk mengoptimumkan penghasilan hidrogen (suhu, pH awalan
dan saiz inokulum) dianalisa menggunakan Response Surface Methodology dengan Full
Factorial Design. Terdapat dua jenis substrat yang diuji; sisa makanan sahaja sebagai
substrat (Produksi 1) dan sisa makanan dicampur dengan sisa buangan kilang kelapa
sawit pada nisbah isipadu 1:1 (Produksi 2).
Keadaan optimum untuk kedua-dua Produksi 1 dan Produksi 2 adalah pH
awalan 4.5, suhu 35°C dan saiz inokulum 20% (isipadu/ isipadu) dengan anggaran
penghasilan maksimum hidrogen kumulatif masing-masing sebanyak 0.22 ml hidrogen/
ml substrat dan 0.26 ml hidrogen/ ml substrat.
Kajian pengesahan seterusnya dilakukan dengan menggunakan nilai pada
keadaan optimum. Kajian ini mencatatkan penghasilan hidrogen kumulatif 0.28 ml
hidrogen/ ml substrat untuk Produksi 1 dan 0.33 ml hidrogen/ ml substrat untuk
Produksi 2.

8
ACKNOWLEDGEMENT
Firstly, my most profound appreciation to my supervisor; Professor Dr Shaliza binti
Ibrahim and co-supervisors; Associate Professor Dr Mohamad Suffian bin Mohamad
Annuar and Zadariana binti Jamil for their role in assisting and guiding me to complete
my research and dissertation.
I would like to thank Madam Budhi Primasari, the laboratory‟s assistant science officer
Madam Kalaiselvi a/p Palani and fellow postgraduate students for their assistance
throughout my laboratory work.
My deepest gratitude towards my parents; Mohd Yunus bin Samah and Marziah binti
Abdul Aziz for their never ending support. Thanks to my dearest family members and
closest friends for their help and encouragements.

9
CONTENTS
Page
ABSTRACT iii
ABSTRAK iv
ACKNOWLEDGEMENTS v
CONTENTS vi
ABBREVIATIONS ix
LIST OF EQUATIONS x
LIST OF FIGURES xii
LIST OF TABLES xvi
1.0 INTRODUCTION
OBJECTIVES OF STUDY 1
1.1 HYDROGEN AS AN ENERGY SOURCE 2
1.2 ANAEROBIC DIGESTION 5
1.3 ANAEROBIC MICROORGANISM 8
1.4 CHEMICAL OXYGEN DEMAND (COD) 11
2.0 LITERATURE REVIEW
2.1 DOMESTIC WASTE MANAGEMENT 12
2.1.1 Incineration 13
2.1.2 Landfill 15
2.1.3 Waste management in Malaysia 16
2.2 PALM OIL
2.2.1 Palm Oil Industry in Malaysia 18
2.2.2 Palm oil mill effluent (POME) 19
2.3 BIOHYDROGEN PRODUCTION METHODS 21
2.3.1 Biophotolysis of Water by Algae 23
2.3.2 Dark-fermentation Hydrogen Production 24
2.3.3 Two Stage Dark/Photofermentative Production of
Hydrogen
27
2.4 MICROBIOLOGY OF BIOHYDROGEN PRODUCTION 28

10
FROM WASTE
Page
2.4.1 The Biohydrogen Producers 29
2.4.2 Hydrogen Consumers and Metabolic Competitors 30
2.4.2.1 Homoacetogenic Bacteria 30
2.4.2.2 Sulfate-reducing Bacteria 31
2.4.2.3 Methanogens 32
2.4.2.4 Lactic Acid Bacteria 32
2.5 TYPES OF WASTE MATERIALS FOR BIOHYDROGEN
PRODUCTION
33
2.5.1 Food industry and Agricultural Waste 33
2.5.2 Palm oil mill effluent (POME) 34
2.5.3 Dairy Wastewater 35
2.5.4 Lignocellulosic materials 36
2.6 BIOLOGICAL REACTOR OPERATION 36
2.6.1 pH 37
2.6.2 Temperature 38
2.6.3 Hydrogen Partial Pressure 39
2.7 WASTE TO WEALTH: POTENTIAL OF USING
WASTES SUCH AS POME, FOOD WASTE AND
SEWAGE SLUDGE FOR BIOHYDROGEN
PRODUCTION IN MALAYSIA
40
2.8 RSM APPLICATION FOR BIOHYDROGEN
PRODUCTION
42
3.0 MATERIALS AND METHODS
3.1 REAGENTS 44
3.1.1 COD analysis
3.1.2 Total Kjeldahl Nitrogen (TKN) analysis
3.1.3 Gas Chromatography Volatile Fatty Acid (VFA) analysis
3.2 SAMPLE COLLECTION AND PREPARATION 44
3.2.1 Preparation of substrate
3.2.2 Sewage sludge

11
3.2.3 Palm Oil Mill Effluent (POME)
Page
3.3 EXPERIMENTAL DESIGN AND PROCEDURE 46
3.3.1 Inoculum preparation 46
3.3.2 Full factorial design 46
3.3.3 Experimental design 47
3.4 ANALYTICAL METHODS 52
3.4.1 Hydrogen analysis 53
3.4.2 TSS and VSS analysis 53
3.4.3 COD analysis 54
3.4.4 TKN analysis 55
3.4.4.1 Digestion
3.4.4.2 distillation
3.4.4.3 Titration
3.4.4.4 Calculation
4.0 RESULTS AND DISCUSSIONS
4.1 CHEMICAL CHARACTERIZATION 58
4.2 CUMULATIVE HYDROGEN PRODUCTION 59
4.3 COMPARISON BETWEEN ANAEROBIC AND
FACULTATIVE ANAEROBIC BACTERIA FOR
HYDROGEN PRODUCTION
60
4.3.1 Effect of initial pH 60
4.3.2 Effect of temperature 62
4.3.3 Effect of inoculum size 65
4.4 RESPONSE SURFACE METHODOLOGY 69
4.4.1 Analysis of Result for Cumulative Hydrogen Production for
Food Waste as Sole Substrate (Production 1)
70
4.4.2 Analysis of Result for Cumulative Hydrogen Production for
Food Waste mixed with POME as substrate (Production 2)
81
4.5 VERIFICATION EXPERIMENT AT OPTIMIZED
CONDITIONS
90
5.0 CONCLUSIONS 94

12
REFERENCES 96

13
ABBREVIATIONS
BOD Biological oxygen demand
COD Chemical oxygen demand
g Gram
GC Gas chromatography
h Hour
H2 Hydrogen
min Minute
ml Millilitre
POME Palm Oil Mill Effluent

14
LIST OF EQUATIONS
Equation Name Page
1.1 Production of hydrogen from hydrolysis of glucose 5
1.2 Theoretical COD per unit mass of CxHyOz 11
2.1 Direct biophotolysis for the transformation of solar energy into the
chemical energy needed for the splitting of water molecule to yield
hydrogen
23
2.2 Acetate pathway from glucose 28
2.3 Butyrate pathway 28
2.4 Acetate production from hydrogen and carbon dioxide 28
2.5 Propionate production from glucose 28
2.6 Ethanol production from glucose 29
2.7 Lactic acid production from glucose 29
2.8 Degradation of long chain fatty acid (LCFA) 39
2.9 Acetate degradation 39
3.1 Mass balance equation for hydrogen gas production calculated
from headspace measurement of gas composition and the total
volume of hydrogen produced
53
3.2 Calculation for TSS and VSS analysis 54
3.3 Calculation for TKN analysis 56

15
Equation Name Page
4.1 Regression equation generated by Minitab software in coded unit
for Production 1
71
4.2 Regression equation generated by Minitab software for Production
2
82

16
LIST OF FIGURES
Figure Name Page
1.1 A simplified examples of hydrogen production pathways 3
1.2 Allosteric regulations of glycolysis with respect to local oxygen 10
2.1 Data from the Municipal Solid Waste Characterization Report 12
2.2 Ladder of Lansink 13
2.3 Waste to energy plant diagram 14
2.4 2008 World palm oil productions‟ share 18
2.5 Sources of waste from palm oil milling 19
2.6 Microbial pathways in an ecosystem degrading agricultural waste.
The bold arrows indicate hydrogen producing pathways, and dotted-
line arrows indicate hydrogen-consuming pathways
30
2.7 Overview of renewable energy sectors and green technology
development
41
3.1 Experimental design to study hydrogen production from food waste
and mixed culture (Production 1) food waste with POME and mixed
culture (Production 2)
49
3.2 The experiments were conducted in an incubator shaker for 72 hours 50
3.3 Biogas produced was stored in acidic water (pH 2) using water
displacement method
51
3.4 The serum bottle was sealed with a rubber septa and aluminum cap 51
3.5 Gas chromatography machine (Perkin Elmer Autosystem GC) 52
3.6 Standard calibration curve for COD analysis 55
3.7 Flow chart of experimental steps 57

17
Figure Name Page
4.1 An example of chromatogram obtained using Perkin Elmer GC with
TCD
59
4.2 Cumulative hydrogen production for aerobic and anaerobic
condition at initial pH 4.
60
4.3 Cumulative hydrogen production for aerobic and anaerobic
condition at initial pH 5.5
61
4.4 Cumulative hydrogen production for aerobic and anaerobic
condition at initial pH 6.5
61
4.5 Cumulative hydrogen production for aerobic and anaerobic
condition at 35°C
63
4.6 Cumulative hydrogen production for aerobic and anaerobic
condition at 45°C
63
4.7 Cumulative hydrogen production for aerobic and anaerobic
condition at 55°C
64
4.8 Cumulative hydrogen production for aerobic and anaerobic
condition at inoculum size 2%
66
4.19 Cumulative hydrogen production for aerobic and anaerobic
condition at inoculum size 11%
66
4.10 Cumulative hydrogen production for aerobic and anaerobic
condition at inoculum size 20%
67
4.11 Main effects plot for hydrogen production for Production 1 73
4.12 Interaction plot for hydrogen produced in Production 1 (Food waste
only)
74
4.13 Residual plots for hydrogen production in Production 1 75
4.14 Normal plot of the standardized effects for Production 1 76

18
Figure Name Page
4.15 Contour plot of hydrogen production versus temperature and initial
pH from food waste (Production 1)
77
4.16 3D surface plot of hydrogen production versus temperature (B) and
initial pH (A) from food waste (Production 1)
78
4.17 Contour plot of hydrogen production versus inoculums size and
initial pH from food waste (Production 1).
79
4.18 Contour plot of hydrogen production versus inoculum size and
temperature from food waste (Production 1)
79
4.19 Cube plot for hydrogen production from food waste (Production 1) 80
4.20 Main effects plot of hydrogen production from food waste mixed
with POME as substrate (Production 2).
83
4.21 Interaction plot for hydrogen produced in Production 2 84
4.22 Residual plots for hydrogen production in Production 2 85
4.23 Normal plot of the standardized effects for Production 2 86
4.24 Contour plot of hydrogen production from food waste and POME
(Production 2) versus temperature and initial pH
87
4.25 Contour plot of hydrogen production from food waste and POME
(Production 2) versus inoculum size and initial pH
88
4.26 Contour plot of hydrogen production from food waste and POME
(Production 2) versus inoculum size and temperature.
88
4.27 Cube plot for hydrogen production from substrate of food waste and
POME (Production 2)
89
4.28 Overlaid contour plot for cumulative hydrogen production (ml) and
COD removal (%) versus pH and temperature for Production 1
90

19
Figure Name Page
4.29 Overlaid contour plot for cumulative hydrogen production (ml) and
COD removal (%) versus pH and inoculum for Production 2
91

20
LIST OF TABLES
Table Name Page
1.1 World primary oil demand and supply in million barrels per day 2
2.1 Comparison of all solid waste in Malaysia 17
2.2 Characteristics of palm oil mill effluent (POME) from palm oil mill 20
2.3 Comparison of various hydrogen production processes 22
2.4 Yields and rates of biohydrogen production from different waste
materials by dark fermentation
34
2.5 Dairy wastewater composition 36
2.6 Compare and contrast of different power options with the carbon
dioxide emitted and their costs
42
3.1 Experimental parameters for both anaerobic and facultative
anaerobic conditions
46
3.2 Variables and levels used in the factorial design 47
3.3 RSM Design by Minitab Pro 16.1.0.0 Software 48
4.1 Chemical analysis of food waste, sewage sludge and POME 58
4.2 Symbols for variables and their levels (RSM) 60
4.3 Estimated Effects and Coefficients for Hydrogen Production from
Food Waste (Production 1) (coded units)
70
4.4 Analysis of variance for hydrogen produced from food waste,
Production 1 (Coded units)
70
4.5 Estimated effects and coefficients for hydrogen production of
substrate food waste mixed with POME, Production 2
81
4.6 Analysis of variance for hydrogen produced from food waste mixed
with POME, Production 2 (Coded units)
81

21
Table Name Page
4.7 Summary of results for verification experiment 91

22
OBJECTIVES OF STUDY
I. To determine effect of temperature, inoculum size and initial pH on microbial
hydrogen production
II. To study the effect of sparging to produce a fully anaerobic condition for
microbial hydrogen production
III. To compare biohydrogen production in systems with and without palm oil mill
effluent (POME) supplement
IV. To apply Response Surface Methodology (RSM) in optimizing the system for
microbial hydrogen production

23
1.0 INTRODUCTION
1.1 Hydrogen as an Energy Source
Fossil fuels are quickly depleting and the fact that it causes pollution from emission of
carbon dioxide (CO2), carbon monoxide (CO), sulphur monoxide (SO), nitrogen oxide
(NO), among others increase the pressing needs to develop non-polluting and renewable
energy sources. Table 1.1 shows the world oil demand and supply forecasted until 2030.
It is obvious that the demand for oil in the major countries like United States, Europe,
China, and India will keep increasing and the supply will be insufficient over the years.
Table 1.1: World primary oil demand and supply in million barrels per day (World
Energy Outlook, 2006).
Demand 1980 2004 2005 2010 2015 2030
United States 17.4 20.5 20.6 21.6 23.1 25.0
Europe 14.7 14.5 14.4 14.9 15.4 15.4
China 1.9 6.5 6.6 8.4 10.0 15.3
India 0.7 2.6 2.6 3.2 3.7 5.4
Supply 1980 2004 2005 2010 2015 2030
United States 8.7 5.8 5.1 5.3 5.0 4.0
Europe 2.4 6.2 4.8 3.8 2.9 1.5
China 2.1 3.2 3.6 3.8 3.7 2.8
India 0.2 0.6 0.7 0.8 0.8 0.6
The energy demand and current environmental degradation are the two vital
issues for global sustainable development. Hydrogen (H2) is seen as the energy of the

24
future; looking at the fluctuating price of oil and other natural gases prices, on top of the
increasing global awareness of increasing carbon dioxide level. This carbon dioxide
level is associated with global warming, acid rain and other disastrous phenomenon.
Hydrogen is a sustainable energy source with minimal use of hydrocarbon. These, plus
the high energy yield of 122 kJ/g makes hydrogen an attractive alternative to fossil fuels
(Guo, Trably, Latrille, Carrere & Steyer, 2010)
Demand on hydrogen is not just limited for use as an energy source only,
hydrogen gas is a widely used as feedstock for production of chemicals, hydrogenation
of fats and oils in food industry, production of electronic devices, processing steel and
also for desulfurization and re-formulation of gasoline in refineries.
Conventional hydrogen gas production methods are steam reforming of methane
(SRM), and other hydrocarbons (SRH), non-catalytic partial oxidation of fossil fuels
(POX) and autothermal reforming which combines SRM and POX. These processes
require high energy level and temperatures (more than 850°C). Among other methods
that have been developed for improvement are the membrane processes, selective
oxidation of methane and oxidative dehydrogenation (Kapdan & Kargi, 2006).
Figure 1.1: A simplified examples of hydrogen production pathways (Lipman,
2011).

25
Biohydrogen production is a viable alternative to the other methods of hydrogen
gas production. Sustainable development and waste minimization issues cause
biohydrogen gas production from renewable sources to receive a lot of attention in
recent years. Biohydrogen production as a green technology can achieved by anaerobic
and photosynthetic microorganisms using carbohydrate rich and non-toxic raw
materials. Under anaerobic conditions, hydrogen is produced as a by-product during
conversion of organic wastes into organic acids which are then used for methane
generation. Acidogenic phase of anaerobic digestion of wastes can be manipulated to
improve hydrogen production.
Photosynthetic processes include algae and other photosynthetic
microorganisms, which use carbon dioxide and water for hydrogen gas production.
Some photo-heterotrophic bacteria utilize organic acids such as acetic, lactic and butyric
acids to produce H2 and CO2. The advantages of the photosynthesis method are high
hydrogen production and utilization of waste materials for the production. However, the
rate of hydrogen production is low and the technology for this process needs further
development (Levin, Islam, Cicek & Sparling, 2004).
Biohydrogen can be used directly in engines or in fuel cells for producing
electricity. Hydrogen has high energy content per unit weight. Through oxidative
combustion, water is the only by-product making biohydrogen a green energy source
that produce minimal pollution to the environment. Hydrogen can also be used as fuel
cells to directly generate electricity (Pan, Zhang, El-Mashad, Sun & Ying, 2008).
Production of biohydrogen through fermentative process uses a wide range of organic
substances and is technically simpler than photosynthetic processes.
Hydrogen is produced by both photosynthetic and chemosynthetic
microorganisms. In the case of chemosynthetic microorganisms, members of the genus

26
Clostridium are well known for their high hydrogen evolution rate during anaerobic
glucose degradation. Equation 1.1 shows production of hydrogen from hydrolysis of
glucose.
C6H12O6 + 6 H2O 6 CO2 + 12 H2 (Equation 1.1)
However, the bacteria also require metabolic energy for growth, which would
limit the production of hydrogen from carbohydrate to about 4 mol/mol of hexose,
reducing about 33% of the theoretical yield. (Doelle, 1994). Stoichiometrically,
Clostridium sp can produce 2 moles of hydrogen with 1 mole of n-butyrate or 4 moles
hydrogen with 2 moles of acetate from 1 mole of hexose (Kim, Han & Shin 2004).
1.2 Anaerobic Digestion
Anaerobic digestion is used mostly for the stabilization of solid composition. It
is a biological process, in the absence of oxygen for the breakdown of the organic
material by conversion to methane, carbon dioxide, biomass and inorganic products. It
is a process found in many naturally occurring anoxic environments including
watercourses, sediments or waterlogged soil. It can also be applied to a wide range of
feed stocks including industrial and municipal wastewaters, agricultural waste, food
industry waste and municipal waste (Ward et al, 2008).
In municipal solid waste treatment, anaerobic digestion is one of the options
available, mainly because anaerobic digestion gives useful by-products such as compost
and biogas. These by-products can be utilised as an energy source in developing
countries. It only requires relatively small space and it helps to cut down the amount of
greenhouse emissions compared to incineration or combustion, aerobic composting and
land-filling.

27
Hydrolytic bacteria form a variety of reduced end-products from
the fermentation of a given substrate. Questions have arisen about the metabolic
features that actually control carbon and electron flow to produce a given reduced end-
product during pure culture and mixed methanogenic cultures of hydrolytic bacteria.
Thermoanaerobium brockii is a thermophilic, hydrolytic bacterium that
ferments glucose via the Embden-Meyerhof Parnas pathway. T. brockii is an atypical
hetero-lactic acid bacterium because it forms molecular hydrogen (H2), along with lactic
acid and ethanol. The reduced end-products of glucose fermentation
are enzymatically formed from pyruvate.
Anaerobic digestion of waste has three basic steps; hydrolysis, fermentation and
methanogenesis.
1) Hydrolysis
Hydrolysis is the first step in anaerobic digestion where complex organics, such
as proteins, carbohydrates and lipids, are converted to soluble organic compounds that
can be hydrolyzed further to simple monomers through extracellular enzymes.
2) Fermentation
In fermentation, two processes are involved; acidogenesis and acetogenesis.
Acidogenesis occur where soluble organics such as glucose, amino acids and fatty acids
are degraded by acidogenic bacteria to volatile fatty acids (VFAs) and alcohols. After
that, acetogenesis will proceed where conversion of VFAs to acetate, H2 and CO2 by
acetogenic bacteria.
In the acidogenesis phase, complex molecules such as carbohydrates, lipids,
and proteins are broken down into soluble compounds by hydrolytic enzymes.
Examples of the hydrolytic enzymes are cellulases, hemicellulases, amylases,

28
lipases and proteases. The hydrolyzed compounds are fermented into volatile fatty acids
(acetate, propionate, butyrate and lactate), neutral compounds
(ethanol, methanol), ammonia, hydrogen and carbon dioxide.
Acetogenesis is one of the main reactions of this fermentation stage. The
intermediary metabolites produced are later on metabolized to acetate, hydrogen and
carbon dioxide gas by these three main groups of bacteria; homoacetogens, syntrophes
and sulphoreductors. For the acetic acid production, the bacteria Clostridium aceticum,
Acetobacter woodii and Clostridium termoautotrophicum are considered.
Clostridium sp produces butyrate and acetate, Enterobacteria produce acetate and
lactate, and hetero-fermentative bacteria will produce acetate, propionate, butyrate and
valerate, among others.
3) Methanogenesis
Methanogenesis is the step where acetate, H2 and CO2 are converted to methane gas
by methanogenic bacteria. Two groups of methanogenic bacteria are involved in
methane production. The first one is aceticlastic methanogens that separate acetate into
methane and carbon dioxide. The other one is a hydrogen-utilizing methanogens that
use hydrogen as electron donor and CO2 as the electron acceptor to produce methane
The production of biogas through anaerobic digestion has a lot of advantages
compared to other forms of waste treatment, including:
- Less biomass is produced;
- Successful in treating wet mass with less than 40% dry matter;
- More effective pathogen removal;
- Minimal emission of odour as 99% of volatile compounds are oxidatively
decomposed during combustion;

29
- Higher degree of compliance with many of national waste strategies
implemented to reduce the amount of biodegradable waste entering landfill;
- The slurry produced is an improved fertilizer in terms of both its availability to
plants and its rheology;
- The biogas can be a source of neutral carbon energy
According to Ward et al (2008), carbon dioxide released through natural
mineralisation is considered neutral in greenhouse gas terms, as the carbon has been
recently removed from the atmosphere by plant uptake, to be released again as part of
the carbon cycle. Controlled anaerobic digestion of organic material is therefore
environmentally beneficial since; it can contain the decomposition process in a sealed
environment; the potentially damaging methane is prevented from entering the
atmosphere. Subsequent burning of the gas will release carbon-neutral carbon dioxide
back to the carbon cycle. Also, the energy gained from combustion of methane will
displace fossil fuels, reducing the production of carbon dioxide that is not part of the
recent carbon cycle.
1.3 Anaerobic Microorganisms
Anaerobic microorganisms can be either obligate anaerobes or facultative
anaerobes. An obligate anaerobe is microorganism that lives in environment without
oxygen. Even a little amount of oxygen can heavily harm or kill this microbe. A
facultative anaerobe on the other hand flourish in oxygen-less environment but can also
survive in the presence of oxygen as it has a supporting mechanism under this
condition.
A facultative anaerobic organism usually generates adenine triphosphate
(ATP) by aerobic respiration in the presence of oxygen but is also capable of switching
to fermentation in absence of oxygen. In contrast, obligate anaerobes die in the presence

30
of oxygen. Examples of facultative anaerobic bacteria are Staphylococcus (Gram
positive), Escherichia coli (Gram negative), and Listeria (Gram positive).
The concentrations of oxygen and fermentable material in the environment
somehow affect the organism's use of aerobic respiration versus fermentation to derive
energy. In brewer's yeast, the Pasteur shift is the observed cessation of oxygen
consumption when fermentable sugar is supplied.
In a growing culture, the cell disfavours respiration due to more requirements
for production, when there is sufficient fermentable substrate available, regardless of
the energy output per mole of fermented material is far less than from respiration's
complete oxidation of the same substrate. However, the rate of production of ATP in
fermentation can be up to a 100 times faster than that of oxidative phosphorylation.
Hence, tissues and organisms that require fast consumption of ATP preferentially use
anaerobic glycolysis.
Under aerobic conditions, the molecule passes through glycolysis, and then
enters the citric acid cycle, where it is completely oxidized. The electrons removed as
NADH during glycolysis and the citric acid cycle are passed through an electron
transport chain (ETC) to create a proton motive force, which later generates ATP.
On the other hand, under anaerobic conditions, the citric acid cycle cannot be
utilized as it generates too much NAD. Thus, the cell undergoes fermentation. The ATP
produced is less than glycolysis but cell will compensate for this by consuming more
glucose in shorter time. This shift from slow aerobic to rapid anaerobic consumption of
glucose was first noted by Pasteur, hence the name „Pasteur Shift‟.
Figure 1.2 shows the allosteric regulations of glycolysis in the presence and
absence of oxygen. When oxygen level is limited, full glucose oxidation will decrease,

31
followed by decrease in levels of production of ATP and citrate. The Pasteur Effect
allows accelerated glycolysis to compensate for defective ATP production. However in
the event of absolute absence of oxygen, the spike in level of fructose-1,6-bisP, ADP,
AMP and inorganic phosphate causes a series of allosteric regulations, represented by
the green arrows to accelerate glycolysis.
Figure 1.2: Allosteric regulations of glycolysis with respect to local oxygen (Porporato
et al, 2011)
The sewage sludge is normally used as a source of microorganism mixed
culture. This is often preferred than pure culture since it is simpler and easier to control.
It also allows the use of broader sources of substrates and not to mention the potential
for wastewater treatment. However, in a mixed culture system, hydrogen produced
under anaerobic conditions may also be consumed by methanogens and homoacetogens
to produce methane and acetic acid. Therefore, in order to obtain maximum yield of
32
hydrogen, the mixed culture, or sludge, need to undergo a pretreatment step to suppress
as much as possible those hydrogen-consuming bacterias. Methods of pretreatments
include mechanical, ultrasonic disintegration, alkali pretreatment, acidic pretreatment,
heat pretreatment and thermo-chemical (Chong, Sabaratnam, Shirai & Hassan, 2009).
1.4 Chemical Oxygen Demand (COD)
The mass of an organic compound is not indicative for its COD. Hence, the
expression “mass of organic material” in the case of COD does not really reflect the
mass of the organic compounds, but rather the mass of oxygen required for a complete
oxidation. So it can be concluded that the mass of consumed oxygen will always be
equal to the mass of oxidised COD. The oxidation of organic material results it its
transformation into stable, inorganic compounds such as carbon dioxide and water.
Hence the mass of oxidised organic material (expressed as COD) can be measured
directly by the consumption of oxygen required for this oxidation. This is the basis for
respirometry; the study of biological processes by measuring the rate of oxygen
consumption.
The theoretical COD per unit mass of CxHyOz is given by the Equation 1.2:
CODt = 8x(4x + 1y-2z)/(12x + 1y +16z) g COD g-1
CxHyOz (Equation 1.2)

33
2.0 LITERATURE REVIEW
2.1 Domestic Waste and Management
There are a few types of waste such as domestic waste, industrial waste and building
and construction waste. Domestic waste is the waste generated from everyday use of a
household premise. Different type of waste will require different approach of
management. This is to reduce the negative impact it may give to the environment.
Figure 2.1 is a proof that food waste is the biggest contributor to solid waste.
Figure 2.1: Data from the Municipal Solid Waste Characterization Report (US EPA,
2010).
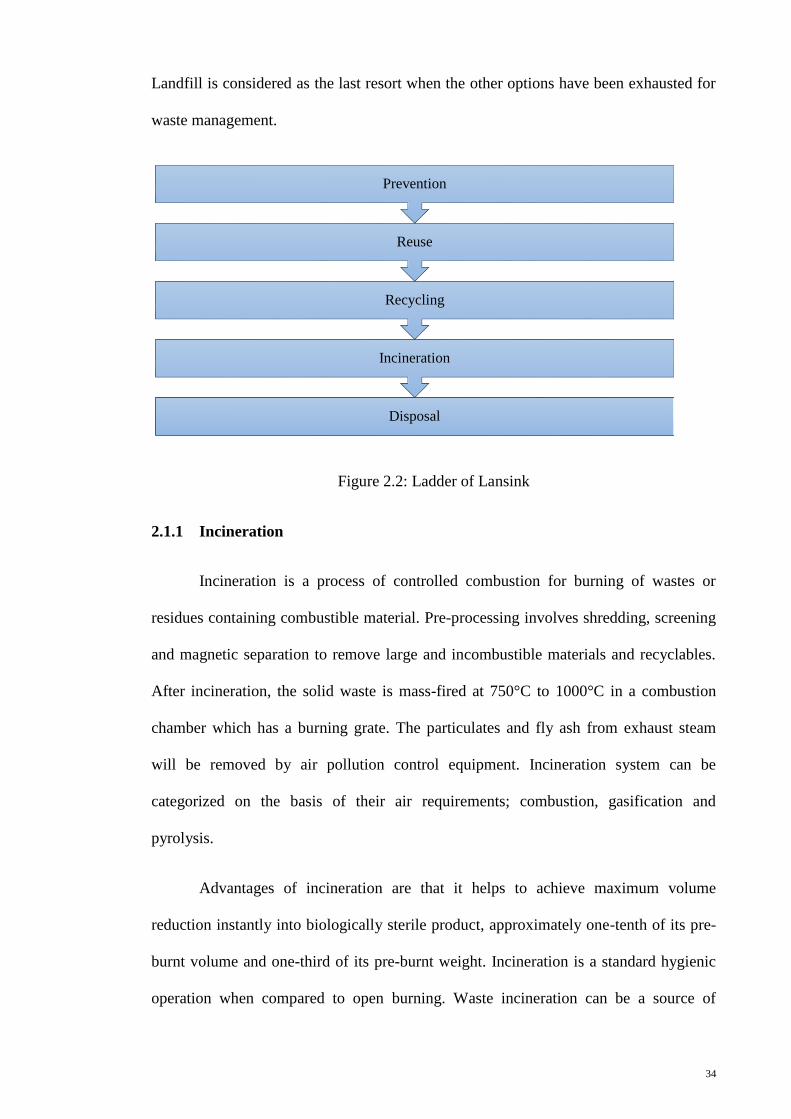
Figure 2.2 shows the Lansink‟s ladder, which is the principle of EU policy in
waste management. It was arranged in a decreasing manner from most preferred to least
preferred. The first is prevention of waste production, by designing minimal waste
production and design to enable beneficial use. Next is product recycling what is
commonly called as “Reuse”. The third step is material recycling for example plastic
bottles, cans and papers. After that is incineration and the last one is disposal to landfill.
21%
20%
12% 10%
9%
11%
6%
5% 5%
Plastics
Paper
Metals
Wood
Textiles
Yard trimmings
Glass
Rubber and leather
Other
Food waste
34
Landfill is considered as the last resort when the other options have been exhausted for
waste management.
Figure 2.2: Ladder of Lansink
2.1.1 Incineration
Incineration is a process of controlled combustion for burning of wastes or
residues containing combustible material. Pre-processing involves shredding, screening
and magnetic separation to remove large and incombustible materials and recyclables.
After incineration, the solid waste is mass-fired at 750°C to 1000°C in a combustion
chamber which has a burning grate. The particulates and fly ash from exhaust steam
will be removed by air pollution control equipment. Incineration system can be
categorized on the basis of their air requirements; combustion, gasification and
pyrolysis.
Advantages of incineration are that it helps to achieve maximum volume
reduction instantly into biologically sterile product, approximately one-tenth of its pre-
burnt volume and one-third of its pre-burnt weight. Incineration is a standard hygienic
operation when compared to open burning. Waste incineration can be a source of
Disposal
Incineration
Recycling
Reuse
Prevention
35
energy to produce steam for electric power generation, industrial process heating or hot
water for district heating; thus conserving invaluable fossil fuel resources. Incineration
requires minimal use of land and minimal burden on landfilling facilities. (Villanueva,
2007).
This method is favourable to countries with limited land area such as Singapore.
In 2002, Singapore produces about 7200 tonne per day of solid waste. For a city with
total land area of 682 km2
only and population of 4.1 million people, Singapore has
tremendous task of addressing waste disposal problem. 90% of the waste is incinerated
in the four incineration plants constructed with energy recovery.
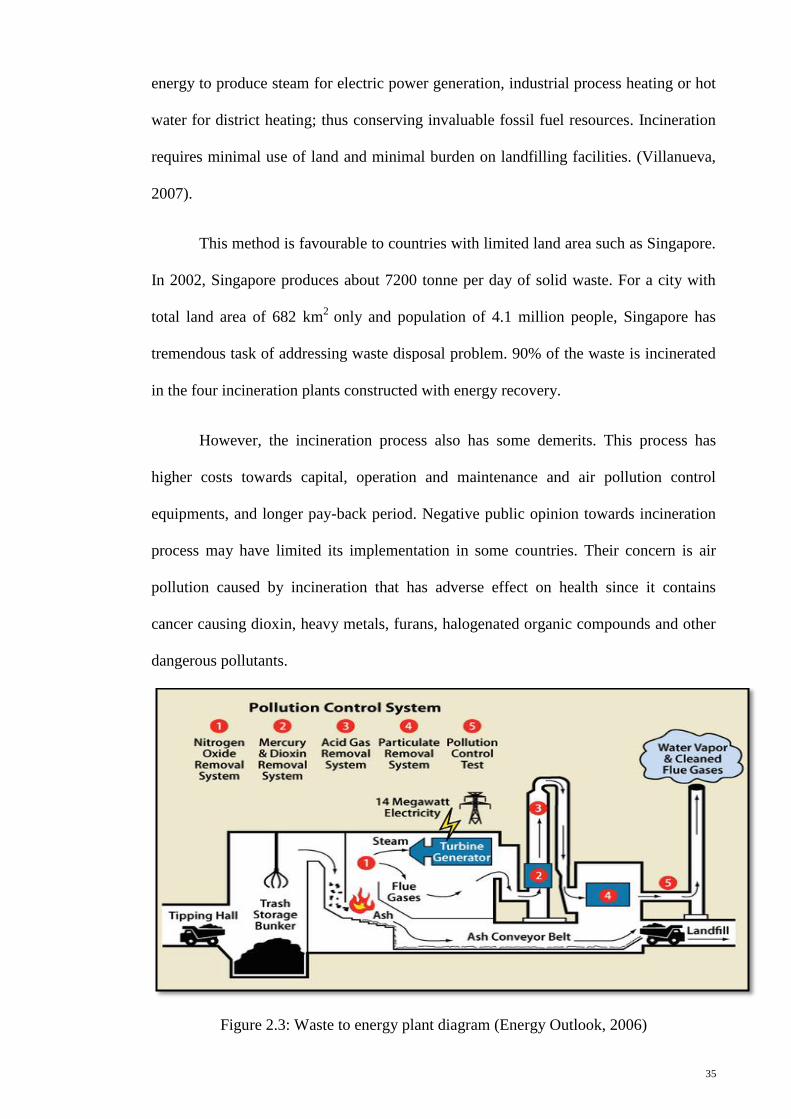
However, the incineration process also has some demerits. This process has
higher costs towards capital, operation and maintenance and air pollution control
equipments, and longer pay-back period. Negative public opinion towards incineration
process may have limited its implementation in some countries. Their concern is air
pollution caused by incineration that has adverse effect on health since it contains
cancer causing dioxin, heavy metals, furans, halogenated organic compounds and other
dangerous pollutants.
Figure 2.3: Waste to energy plant diagram (Energy Outlook, 2006)

36
Modern incinerator facilities can now be built with efficient combustion system
equipped with sophisticated gas clean-up processes that can doubled as energy
producers. This helps to reduce waste into inert residue with minimal pollution. Most
developed nations in Europe, United States and Japan have already implemented
stringent pollution emission limits from incineration plants.
2.1.2 Landfill
There are a few types of landfills; sanitary landfills, municipal solid waste
landfills, industrial waste landfills and construction waste landfills. Construction waste
landfills consist of the debris accumulated during construction, renovation and also
demolition of buildings, roads and bridges. An industrial waste landfill is for
nonhazardous solid waste associated with manufacturing and other industrial activities.
A municipal solid waste landfill is for domestic waste and it uses a synthetic liner to
isolate trash from the environment. A sanitary landfill has special geosynthetic and clay
lining to prevent leachate from dissipating into the environment and contaminating the
soil and ground water. Leachate consists of water and water-soluble compounds in the
refuse; the water may be from rainfall or from the waste itself.
Landfill liners are used to create a barrier between the waste and the
surrounding area. It also allows collection of leachate for treatment to reduce polluting
effect before released to the environment (Hughes et al, 2005). Different disposal sites
are available for different types of waste. The type of liner system required for each
landfill will be determined by the potential threat posed by the waste.
Landfill gas is a strong greenhouse gas formed by anaerobic degradation of
waste. Landfill gas has complex composition with the main components being methane,
carbon dioxide, nitrogen and oxygen. There are also trace amount of carbon monoxide,
hydrogen, hydrogen sulphide and other organic components.
37
Landfill gas can potentially cause explosions if it is located in urban areas. The
gas produced can penetrate through soil and existing underground pipeline or cable
systems into buildings nearby. A low atmospheric pressure will increase the risk of
explosion since the low pressure can‟t effectively balance the gas pressure in the
landfill. An example of this is the tragedy in Denmark on March 1991 where migrating
gas from landfill caused fatal explosion. Odour problems related to landfill is often the
result of inadequate topsoil cover and also indicate gas leak.
Extracting and burning of the landfill gas can be both environmentally and
economically beneficial. In some countries it is a necessity to have some form of gas
control as part of the management of landfills. The reasons behind it are to reduce risk
of explosions, to reduce odour, to decrease carbon dioxide emission, to prevent
groundwater pollution and to utilize the gas to generate fuel for revenue.
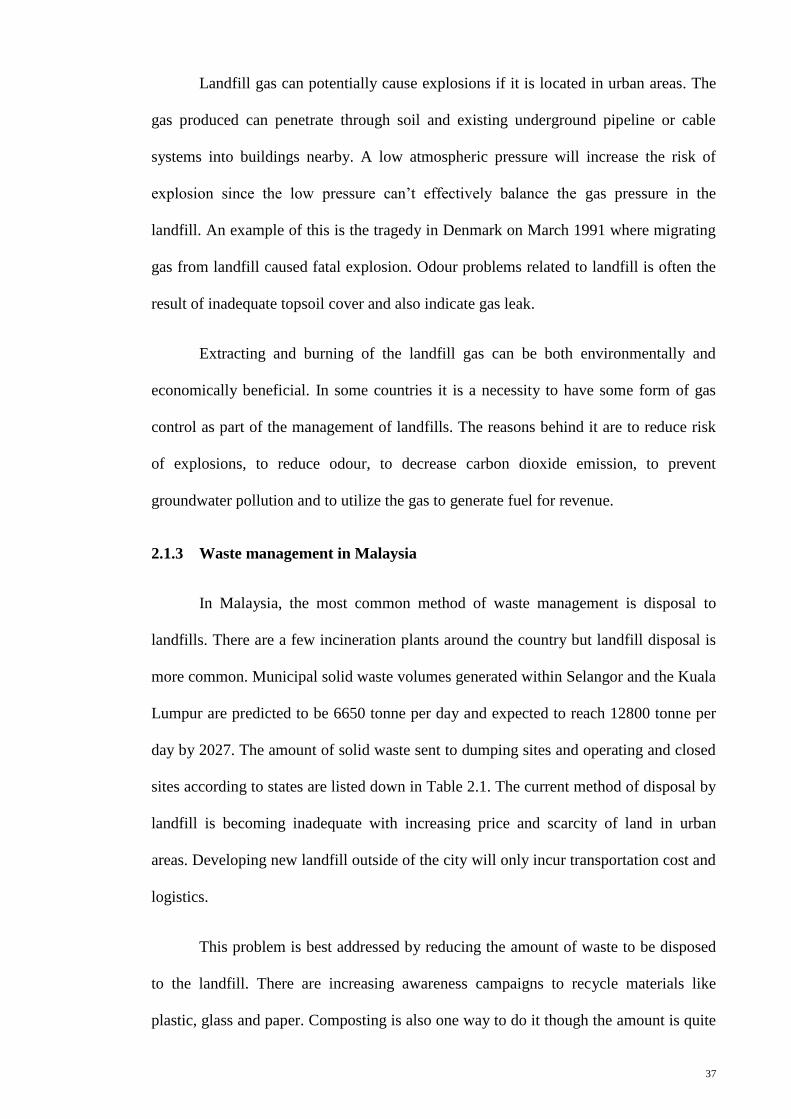
2.1.3 Waste management in Malaysia
In Malaysia, the most common method of waste management is disposal to
landfills. There are a few incineration plants around the country but landfill disposal is
more common. Municipal solid waste volumes generated within Selangor and the Kuala
Lumpur are predicted to be 6650 tonne per day and expected to reach 12800 tonne per
day by 2027. The amount of solid waste sent to dumping sites and operating and closed
sites according to states are listed down in Table 2.1. The current method of disposal by
landfill is becoming inadequate with increasing price and scarcity of land in urban
areas. Developing new landfill outside of the city will only incur transportation cost and
logistics.
This problem is best addressed by reducing the amount of waste to be disposed
to the landfill. There are increasing awareness campaigns to recycle materials like
plastic, glass and paper. Composting is also one way to do it though the amount is quite

38
small and seem less significant. Domestic waste can be incinerated for maximum
reduction of mass to be disposed into landfills. Plus, there many waste-to-energy
incineration plant being built around the world that can double-up as power supplier for
the plant or other industries. However, the public generally have negative perception
towards incineration due to its known air pollutant that may have adverse effect to
health.
Table 2.1: Comparison of all solid waste in Malaysia (Jabatan Sisa Pepejal, 2010)
State Waste collected
(Metric tons/ day)
Number of
operating sites
Number of closed
dumping sites
Perlis 120 1 1
Kedah 1504 12 3
Penang 1800 1 2
Perak 1864 21 9
Pahang 1094 20 12
Selangor 3240 7 11
WP Kuala Lumpur 1950 1 7
Negeri Sembilan 1162 8 10
Melaka 906 2 5
Johor 2439 13 21
Kelantan 729 13 5
Terengganu 651 9 12
Sabah 1174 20 1
Sarawak 2001 51 12
Total per day 20633 179 111

39
The promise of green and renewable energy is great in the sense that it can
utilize waste to be converted into energy. There have been a lot of studies done to
produce energy biologically from biomass. Energy can be harvested in the form of gas
such as methane and hydrogen. Food waste as a major contributor to municipal solid
waste can be reduced by using it as a substrate for energy production. This has been
done successfully on a lab scale by Ismail, Abdul Rahman, Abd Aziz, Ling & Hassan
(2009) to produce hydrogen. The challenge is to plan and develop a plant for big scale
waste to energy production. Feasibility studies need to be done since running a vast
plant will require big capital cost for operation and production.
2.2 Palm Oil Mill Effluent
2.2.1 Palm oil industry in Malaysia
After Indonesia, Malaysia is the second largest exporter of palm oil in the world.
The world‟s palm oil productions share is shown in Figure 2.4. In year 2010, the
number of palm oil products exportation rocketed to 16.5 million tonnes. The crude
palm oil production has increased from 7.8 million tonnes in 1995 to 17.56 million
tonnes in 2009 (Ujang et al, 2012). Palm oil is assumed as one of the most important
economic sources in the nation and contributed to the remarkable rise in the
Malaysian‟s Gross domestic product (GDP).

40
Figure 2.4: 2008 World palm oil productions‟ share (MPOB, 2008)
In Malaysia, the main product from oil palm plantation is palm oil and the
secondary product is palm kernel oil and cake. The Malaysian Palm Oil Board (MPOB)
long-term goals are to establish biodiesel plants and convert biomass from oil palm into
value-added products. MPOB has a lot of research in the pipeline to make use of wastes
generated from palm oil mill such as empty fruit bunch (EFB) and palm oil mill
effluent.
2.2.2 Palm Oil Mill Effluent (POME)
Wastes from palm oil mill production are in solid or liquid form. Solid wastes mainly
consist of palm kernel shells, mesocarp fruit fibres and empty fruit brunches. The wet
process from the extraction of palm oil generates liquid wastes. This liquid waste
combined with the waste from steriliser condensate and cooling water is called palm oil
mill effluent (POME). Figure 2.5 shows the sources of waste in palm oil milling.
Indonesia 45%
Malaysia 41%
Thailand 3%
Nigeria 2%
Columbia 2%
Others 7%

41
Figure 2.5: Sources of waste from palm oil milling (Ujang et al, 2012)
Fresh POME is thick, brownish, colloidal slurry of water, oil and fine cellulosic
fruit residues. POME is generated from mill operation at temperature between 80°C and
90°C, with acidic pH between 4 to 5. The high organic matter is caused by the presence
of sugars such as arabinose, xylose, glucose, galactose and mannose. The oil residue
was very much dependent on quality of raw material, process control and machine
efficiency. The suspended solids in the effluent are mostly oil-bearing cellulosic
materials from the palm fruits.
POME poses environmental issues due to its large oxygen depleting capability if
released in waterways due to its organic and nutrient contents, this can be seen in Table
2.2, where the BOD and COD is very high. However, POME is non-toxic since no
chemical is added during the oil extraction process, thus it can be a good source of
nutrients for microorganisms. Hence many studies have been done using POME as a
substrate for microbes to produce value-added product. In the field of biohydrogen
production, a study by Jamil, Mohamad Annuar, Ibrahim & Sabaratnam (2009) shown
promising result when anaerobic co-digestion of POME with sewage sludge produced
1.05 ml hydrogen per ml of POME.

42
Table 2.2: Characteristics of palm oil mill effluent (POME) from palm oil mill
(Ibrahim, 2012)
Parameter Units Concentration
Biochemical oxygen demand (BOD) mg/l 10197
Chemical oxygen demand (COD) mg/l 50500
Total solid (TS) mg/l 31533
Suspended solids (SS) mg/l 4007
Volatile suspended solids (VSS) mg/l 3657
Oil and grease mg/l 15800
Total nitrogen mg/l 613
Dissolve oxygen (DO) mg/l 0.47
Temperature °C 54
pH - 5.3
2.3 Biohydrogen production methods
Table 2.3 shows several methods for hydrogen production and their advantages
and disadvantages. Among various hydrogen production processes, biological method is
most ideal since it can utilise renewable energy sources such as biomass for the
production of hydrogen and less energy-intensive. The biological methods mainly make
use of photosynthetic hydrogen production and fermentative hydrogen production.
Major bioprocesses utilized for biological hydrogen production can be
categorized into
- Biophotolysis of water by algae;

43
- Dark-fermentative hydrogen production (in acidogenic phase in anaerobic digestion);
- Two stage dark/photofermentative production of hydrogen.

44
Table 2.3: Comparison of various hydrogen production processes (Pandu and Joseph,
2012).
Process Advantages Disadvantages
Solar gasification Good hydrogen (H2) yield Require effective solar
collector plates
Thermo-chemical
conversion
Higher conversion can be
achieved
Need gas conditioning and
tar removal
Pyrolysis The process gives out
carbonaceous material with oil,
chemicals and minerals
Catalyst deactivation will
occur
Supercritical
conversion
Sewage sludge can be used
easily, unlike in gasification
Selection of supercritical
medium
Direct bio-photolysis H2 can be produced directly
from water and sunlight
Requires high intensity of
light, low photochemical
efficiency and oxygen (O2)
is inhibitory
Indirect bio-photolysis Blue green algae can produce
hydrogen from water
Hydrogenates that algae
uptake have to be removed
Photo-fermentation A wide spectral of energy can
be used by photosynthetic
bacteria
O2 is inhibitory on
nitrogenase enzyme and
efficiency of light
conversion is low
Dark fermentation It can produce hydrogen
without light. No oxygen
limitations and can produce
several metabolites as by-
products. Various substrates
can be used in this process
Relatively lower H2 yield.
At higher H2 yield, process
becomes
thermodynamically
unfavourable
Two-stage
fermentation
Can produce relatively higher
H2 yield. By-products can be
efficiently converted to H2
Requires continuous light
source which is difficult for
large scale processes

45
2.3.1 Biophotolysis of water by algae
In photosynthesis, water molecules are splitted to hydrogen ion and oxygen. The
generated hydrogen ions are then converted into hydrogen gas by the enzyme
hydrogenase. Chlamydomonas reinhardtii is one of the well-known hydrogen producing
algae. There are two ways of hydrogen production with these method, either by direct or
indirect biophotolysis. Equation (2.1) is for direct biophotolysis that utilizes the
photosynthetic system of microalgae for the transformation of solar energy into the
chemical energy needed for the splitting of water molecule to yield hydrogen.
2H2O solar energy
2H2 + O2 (Equation 2.1)
Hydrogenase activity has been detected in the green algae, Scenedesmus
obliquus, in marine green algae Chlorococcum littorale and in Chlorella fusca.
Cyanobacterial hydrogen gas evolution involves nitrogen fixing cultures such as non-
marine Anabaena sp., marine cyanobacter Oscillatoria sp., Calothrix sp. and non-
nitrogen fixing organisms such as Synechococcus sp., Gloebacter sp. and it was
reported in literatures that Anabaena sp. have higher hydrogen evolution potential over
the other cyanobacter species.
The algal hydrogen production could be considered as an economical and
sustainable method in terms of wastewater utilization as a renewable resource and
carbon dioxide consumption. The alga can be grown using nutrient-rich wastewaters for
example from palm oil mill effluent (POME) or other non-toxic industrial wastewater.
The system uptake carbon dioxide from the atmosphere which in turn reduces the
pollutant level in the air thus reducing greenhouse gases effect.
However, strong inhibition effect of generated oxygen on hydrogenase enzyme
is the major limitation for the process (Benemann, 2000). Inhibition of the hydrogenase
enzyme by oxygen can be prevented by cultivation of algae under sulphur deprivation

46
for about 2 to 3 days; to provide anaerobic conditions in the light. Although biological
processes for hydrogen production have been well documented with cultured microalgal
biomass, these processes have to be integrated into a system to meet the overall
efficiency of converting solar energy into fuels (Pandu and Joseph, 2012). Another
disadvantage of hydrogen production by algae is low hydrogen production potential.
Therefore, dark and photo-fermentations are considered the better options due to
simultaneous waste treatment and biohydrogen gas production.
2.3.2 Dark-fermentation hydrogen production
Dark fermentation is conversion of organic substrate to hydrogen by
fermentation. It is a complex process by a diverse group of bacteria through a series of
biochemical reactions. Fermentative microorganisms hydrolyze complex organic
polymers to monomers and then converting it to a mixture of lower molecular weight
organic acids and alcohols. This is done by the hydrogen producing acidogenic bacteria.
Utilization of wastewater as a potential substrate for hydrogen production has
been of interest in recent years; especially in dark fermentation process. Industrial
wastewater as fermentative substrate for hydrogen production fulfil most of the criteria
required for substrate selection i.e availability, low cost and biodegradability.
The use mixed culture is extremely important and suitable in wastewater
treatment. This is due to the non-sterile, unstable and complex environment of
wastewater. Some anaerobic mixed cultures only produce a small amount of hydrogen;
as it is rapidly consumed by the methane-producing bacteria. Successful biological
hydrogen production requires inhibition of these hydrogen-consuming microorganisms,
such as methanogens by pre-treatment of the seed culture. This method is necessary for
selecting the required microflora.

47
The physiological differences between hydrogen producing bacteria and
hydrogen consuming bacteria are the fundamental basis to development of various pre-
treatmnet methods. When the inoculum was exposed to extreme environments such as
high temperature, extreme acidity and alkalinity, spore forming hydrogen producing
bacteria such as Clostridium will survive. However methanogens had no such capability
and will die off.
Many anaerobic organisms can produce hydrogen from carbohydrate-rich
organic wastes. The organisms belonging to genus Clostridium are obligate anaerobes
and spore forming organisms. Clostrida species produce hydrogen gas during the
exponential growth phase. In batch growth of Clostridia the metabolism shifts from a
hydrogen/acid production phase to a solvent production phase when the population
reaches to the stationary growth phase. The dominant culture of Clostridia can be easily
obtained by heat treatment of biological sludge. Im et al (2012) has done an analyses
on bacterial community in dark fermentation by pyrosequencing. The study showed that
at the start of fermentation, the microbes were very diverse with more than 10 phyla of
bacteria, with 50% of it being Proteobacteria. However this decreased after 6 hours and
members of the phylum Firmicutes were observed at more than 97%. The species in
this phylum are C. sordellii, C. perfringens and C. butyricum.
Hydrogen production capacity of anaerobic facultative bacterial culture has been
widely studied. Example of facultative anaerobes are Enterobacter aerogenes, E. coli
and Hafnia alvei.
Environmental conditions are the major parameters to be controlled in hydrogen
production. The pH of the medium affects hydrogen production yield, biogas content,
type of the organic acids produced and the specific hydrogen production rate. Gradual
decreases in pH inhibit hydrogen production since pH affects the activity of iron

48
containing hydrogenase enzyme. Therefore, pH control at the optimum level is required.
Initial pH also influences the extent of lag phase in batch hydrogen production (Guo,
Trably, Latrille, Carrere & Steyer, 2010). Composition of the substrate, media
composition, temperature and the type of microbial culture are also important
parameters affecting the duration of lag phase. Some studies reported that low initial pH
of 4.0–4.5 causes longer lag periods while high initial pH levels such as 9.0 decrease lag
time but then it lowers the yield of hydrogen production.
The major products in hydrogen production by anaerobic dark fermentation of
carbohydrates are acetic acid, butyric acid and propionic acid. Formation of lactic acid
was observed when lactose and molasses (sucrose) were used as the substrates. pH also
affects the type of organic acids produced. More butyric acid is produced at pH 4.0–6.0.
Concentration of acetate and butyrate could be almost equal at pH 6.5–7.0. Ethanol
production was observed depending on the environmental conditions.
Methane was not detected in most of the hydrogen production studies since
methane producers have been eliminated by pre-treatment. However, long retention
times may still cause methane formation by the mesophilic cultures. Since the
hydrogenase enzyme present in anaerobic organisms oxidizes reduced ferrodoxin to
produce molecular hydrogen, external iron addition is needed for hydrogen production.
Liu, Min & Angelidaki (2008) reported that high iron concentrations (100 mg /L)
increases lag phase in batch operations. The composition of volatile fatty acids (VFA)
may also vary as a result of metabolic shift in anaerobic digestion.
Nitrogen is an essential nutrient for hydrogen production by dark fermentation
under anaerobic conditions. Some of hydrogen producers are strict anaerobes.
Therefore, reducing agents gases such as argon, nitrogen and hydrogen are sparged into
the bioreactor to remove trace amounts of oxygen present in the medium. However, the

49
use of such reducing agents gases are a bit costly, making it uneconomical for
industrial-scale production of hydrogen gas.
Enterobacter aerogenes is a facultative anaerobe and the amount of hydrogen
produced by this culture is comparable to Clostridum sp. The culture has the ability to
survive in the presence of slight amount of oxygen generated during anaerobic
biodegradation. Therefore, utilization of E. aerogenes along with Clostridum was done
to eliminate use of reducing agents. This was proposed by Yokoi (2002) for effective
hydrogen gas production by dark fermentation process.
2.3.3 Two stage dark/ photofermentative production of hydrogen
Sequential dark and photo-fermentation is rather a new approach in biological
hydrogen gas production. There are not many literatures found on this sequential
hydrogen gas production system. The sequential production system has certain
advantages over single stage dark or photo-fermentation processes. The effluent of dark
fermentation in hydrogen production provides sufficient amount of organic acids for the
photo-fermentation. Hence there would not be any limitation of the organic acid
availability. Further utilization of organic acids by photo-fermentative bacteria could
provide better effluent quality with lower COD level.
However, the system should be well monitored and controlled to provide
optimum environmental conditions for the two microbial components of the process.
For instance, the ammonia concentration and C:N ratio in the effluent of anaerobic
fermentation should not be at the inhibitory level for the photosynthetic bacteria.
Dilution and neutralization of dark fermentation effluents are required before photo-
fermentation to adjust the organic acid concentration and the pH to around pH 7 for the
optimal performance of photosynthetic bacteria.

50
2.4 Microbiology of biohydrogen production from waste
Anaerobic digestion is a ubiquitous phenomenon found in anaerobic conditions.
The first stages in anaerobic digestion are hydrolysis and acidogenesis, in which dark
fermentation with hydrogen producers is involved. Afterwards, hydrogen as a key
intermediate can be rapidly consumed by other microorganisms in mixed culture,
mainly by homoacetogens, methanogens, and sulfate-reducing bacteria.
There are a lot of studies on the metabolic network of carbohydrate. Among the
large range of end products generated by the various microbial metabolisms, acetic acid
accumulates from acetic fermentation as the sole end product with a theoretical
production of 4 mol H2 /mol hexose (Equation 2.2). Meanwhile in the butyrate pathway,
a lower molar hydrogen yield is observed with 2 mol H2 /mol hexose (Equation 2.3).
C6H12O6 + 2H2O 2CH3COOH + 2CO2 + 4H2 (Equation 2.2)
C6H12O6 CH3CH2CH2COOH + 2CO2 + 2H2 (Equation 2.3)
Keep in mind that the accumulation of acetate in the medium does not
necessarily indicates a higher biohydrogen production since several microbial species
can convert hydrogen and carbon dioxide to acetate.
2CO2 + 4H2 CH3COOH + 2H2O (Equation 2.4)
Normally in mixed cultures, ratio of 3:2 of butyrate/acetate is usually observed,
resulting in a theoretical average hydrogen yield of 2.5mol H2 /mol hexose (Hawkes et
al, 2007). In mixed cultures, propionate, ethanol, and lactic acid may also accumulate.
Propionate is a metabolite of a hydrogen-consuming pathway, while ethanol and lactic
acid are involved in a zero-hydrogen balance pathway (Equations 2.5 – 2.7)
C6H12O6 + 2H2 2CH3CH2COOH + 2H2O (Equation 2.5)

51
C6H12O66 2CH3CH2OH + 2CO2 (Equation 2.6)
C6H12O6 2CH3CHOHCOOH + 2CO2 (Equation 2.7)
Nandi and Sengupta (1998) has listed the major hydrogen-producing bacteria
related to strict anaerobic genera (Clostridia, methylotrophs, rumen bacteria,
methanogenic bacteria, archaea), to facultative anaerobic genera (Escherichia coli,
Enterobacter, Citrobacter) and to aerobic genera (Alcaligenes, Bacillus).
Based on the biohydrogen production from agricultural waste, that is in mixed
cultures, three classes of microorganisms could be identified; hydrogen producers,
hydrogen consumers and metabolic competitors.
2.4.1 The biohydrogen producers
Eventhough pure cultures have been intensively studied in the past years, only a
few studies refer to the characterization of mixed cultures. A large range of microbial
sources has been used to obtain inocula for biohydrogen production. For example;
anaerobic sludge from municipal wastewater plants and cow dung composts, cattle or
dairy residue composts, palm oil mill effluent, soil, rice straw compost, fermented soy
bean meal as well as landfill lixiviates.
From hydrogen-producing mixed cultures, a wide range of species have been
isolated, more specifically from the genera Clostridium (C. pasteurianum, C.
saccharobutylicum, C. butyricum), Enterobacter (E. aerogenes) and Bacillus under
mesophilic conditions. Under thermophilic temperatures, there are microbes from the
genera Thermoanaerobacterium (T. thermosaccharolyticum), Caldicellulosiruptor (C.
saccharolyticus, C. thermocellum) and Bacillus thermozeamaize. Under mesophilic
conditions, mainly sporulating bacteria of the Clostridium genus have been found in

52
mixed mixtures due to the use of heat shock and other pre-treatment method on the
inoculums (Shin, Youn & Kim, 2004).
2.4.2 Hydrogen consumers and metabolic competitors
Three groups of bacteria are known to interfere, either directly or indirectly in
hydrogen production from carbohydrates, such as the sulfate-reducing bacteria (SRB),
the methane-producing bacteria (MPB) and the homoacetogenic bacteria (HAB). The
pathway is shown in Figure 2.6.
Figure 2.6: Microbial pathways in an ecosystem degrading agricultural waste. The bold
arrows indicate hydrogen producing pathways, and dotted-line arrows indicate
hydrogen-consuming pathways (Guo, Trably, Latrille, Carrere & Steyer, 2010)
2.4.2.1 Homoacetogenic bacteria
Homoacetogenic bacteria are strictly anaerobic microorganisms which catalyze
the formation of acetate from hydrogen and carbon dixide. They were first observed by
Fischer et al. (1932). Clostridium aceticum and Clostridium thermoaceticum were the

53
model species used to show the metabolic pathway. They have special enzymes that can
catalyze the formation of acetyl-CoA, which is later converted either to acetate in
catabolism, or to cell carbon in anabolism (Guo, Trably, Latrille, Carrere & Steyer,
2010).
The homoacetogens are versatile; they can convert a variety of different
substrates to acetate as the major end product. This means that the biohydrogen
production obtained may be lower than the expected value due to the accumulation of
acetate (Antonopoulou et al, 2008). It was shown that the biohydrogen produced from
butyrate oxidation reacted rapidly with carbon dioxide to form acetate by
homoacetogenesis.
Unfortunately, the pretreatment of the inoculum by heating; method to select
spore-forming bacteria, will not successfully inhibit homoacetogenic bacteria since
some of them belong to the same genus Clostridium.
2.4.2.2 Sulfate-reducing bacteria
According to theoretical thermodynamics, the most efficient biochemical
reaction using hydrogen involves the sulphate and nitrate-reducing microorganisms. It
has been shown that SRB have a thermodynamic advantage over MPB and HAB
(Valdez et al, 2009). Some waste especially from pulp and paper industry, sea-food
processing, distilleries, edible oil and wet corn milling, contains high concentrations of
sulfate which will disturb anaerobic digestion. It also produces sulfide gas which is
hazardous for fuel cells.
Short hydraulic retention times (HRT) are not sufficient to inhibit these
microorganisms. At longer HRT, hydrogen is converted either to methane or sulphuric
acid. Under sulphate-limited conditions, methane and carbon dioxide are produced by
the MPBs from hydrogen. In the event of abundance of sulphate, the SRB will convert

54
hydrogen to sulfidic acid. Along with the concentration of sulfate and HRT, pH is also a
key factor in sulfate reduction. At pH values lower than 6 the activity of SRB is
inhibited (Mizuno et al, 1998).
2.4.2.3 Methanogens
Methanogens are considered as the main hydrogen consuming microorganisms
in anaerobic environments. Many options exist to inhibit methanogenesis: chemical
inhibition, low pH control, heat treatment of the inoculums and short hydraulic retention
times.
The most commonly used chemical inhibitors are bromoethanesulfonate (BES),
acetylene and chloroform BES. These are specific against methanogens; it acts as an
analog of the coenzyme M in the respiratory chain. However, BES is not
environmentally friendly and it is too costly for industrial scale (Li and Fang, 2007).
Most methanogens can only grow at a narrow pH range from 6 to 8. In absence
of pH control during a batch process, an acidic initial pH is strongly recommended
(Chen, Chen, Khanal & Sung, 2006). The most common treatment of inoculum is by
heating to around 100°C to select spore-forming, hydrogen-producing bacteria.
Methanogens do not sporulate, hence will not survive such thermophilic conditions. A
short HRT of less than 8 hours will lead to a washout of methanogens from the reactor,
provided no biofilm is formed. To obtain stable hydrogen production in a methane-free
biogas, the optimal HRT observed were 48 hours for food waste (Shin, Youn & Kim,
2004).
2.4.2.4 Lactic acid bacteria
Lactic acid bacteria (LAB) growth could not be limited by temperature. The
accumulation of lactic acid led to the instability of the mixed culture processes. Indeed,

55
Wang & Wan (2009) showed that lactic acid inhibited hydrogen fermentation in a two
stage continuous system using food waste as substrate. The hydrogen yield dropped
from 71 to 49 ml hydrogen /g volatile solid (VS) when the lactic acid increased from
2.3 to 4.4 g/L.
2.5 Types of Waste Materials for Biohydrogen Production
The main things to look for in selecting waste materials to be used in biohydrogen
production are abundance, cost, carbohydrate content and biodegradability of it. Simple
sugars, for example glucose, sucrose and lactose are readily degradable and are the
preferred substrates for hydrogen production. However, the cost to obtain a pure
carbohydrate sources are very high, thus making it less economical for a production
system.
2.5.1 Food industry and agricultural waste
Food waste is a major solid waste in the world; it is problematic and abundant
everywhere. It is the major source of bad odour, vermin attraction, toxic gas emission
and groundwater contamination. Food waste and also waste from food industries
constitute a big fraction of the municipal food waste. Conventional approaches for solid
waste management, such as landfilling, composting and incineration for these wastes.
Seeing that these wastes have high content of carbohydrate in the form of simple sugars,
such as starch and cellulose, made it a potential feedstock for hydrogen production.
Production of clean and green energy source and utilization for minimization of
waste materials make hydrogen production from food waste a new and promising
approach to meet the increasing energy demands and a substitute for fossil fuels.

56
There are extensive studies on utilizing food waste as carbon source for
fermentative hydrogen production because it is rich in carbohydrate and also easily
hydrolysable in water. But the problem with the food waste is the variations in
carbohydrate and protein types, and their concentrations in the mixture. Each
component requires different environmental conditions for hydrogen gas production.
Table 2.4 below summarizes hydrogen gas production from a few types of wastewaters
and solid wastes.
Table 2.4: Yields and rates of biohydrogen production from different waste materials by
dark fermentation (Kapdan and Kargi, 2006).
Organism Carbon
Source
SHPR YP/S yield
coefficient
Percentage
of hydrogen
content (%)
References
Mesophilic
mixed culture
Food waste
(3% VS)
0.7ml/g
VSS h
0.05
mol/mol
hexose
1 Shin et al,
2004
Mixed culture Food waste
(3% VS)
111ml/g
VSS h
Kim et al,
2004
Mixed culture Potato
industry WW
(21g COD/L)
2.8 L/L
WW
Ginkel et
al, 2001
Mixed culture Rice winery 389ml/g
VSS h
2.14
mol/mol
hexose
53-61 Yu et al,
2002
C. butyricum and
E. aerogenes
Sweet potato
starch residue
(2%)
2.7mol/mol
glucose
Yokoi et al,
2002
SHPR, Specific Hydrogen Production Rate; WW, Wastewater.
2.5.2 Palm oil mill effluent (POME)
Palm oil is a major crop in tropical countries such as Malaysia itself. During
extraction of crude palm oil, palm oil mill effluent (POME) will be generated. The BOD

57
and COD of POME are way too high to be discharged into waterways. Pre-treatments
need to be done to reduce the harmful effect of POME when released in domestic water.
Conventionally POME is treated using pond system or open digestion tank. The
problems with these methods are that it has long hydraulic retention time (HRT), gives
out terrible odor and also the containment and collection of gas produced is
troublesome.
In recent years, more studies have been done to find other alternatives to value-
add POME. POME has been used as a substrate to produce compost and citric acid
production. POME has also been used to produce hydrogen and based on studies done
the hydrogen production is comparable to those produced using carbohydrate-rich
wastewater (Chong, Sabaratnam, Shirai & Hassan 2009). Most of these are still at
laboratory scale but all are showing promising results.
2.5.3 Dairy wastewater
Lactose rich wastewater from dairy and cheese industry also contains complex
organics such as polysaccharides, proteins, lipid which can form sugars, amino acids
and fatty acids through hydrolysis. These intermediate products are converted into
volatile fatty acids (VFA) and can be further degraded by acetogens to form acetate,
carbon dioxide and hydrogen (Mohan et al, 2007). Cheese whey contains about 5%
lactose which makes it eligible to be a substrate for fermentation process (Chong,
Sabaratnam, Shirai & Hassan 2009).
A study by Moreno-Davila, Rios-Gonzalez, Garza-Gracia, Garza & Rodriguez-
Martinez (2011) studied the fermentative hydrogen production in packed bed batch
reactors to assess the influence of environmental factors such as initial COD,
temperature and pH. Table 2.5 shows the dairy wastewater composition from this study.
The maximum yield obtained was 12.73 mM hydrogen per gram COD.

58

59
Table 2.5: Dairy wastewater composition (Moreno-Davila, Rios-Gonzalez, Garza-
Gracia, Garza & Rodriguez-Martinez, 2011)
Parameters Dairy Wastewater
pH 11.32 ± 0.240
COD 21.1 ± 0.381
Conductivity 2640 ± 52.8
TSS 21.9 ± 0.557
2.5.4 Lignocellulosic materials
Lignocellulosic materials, such as cellulose, hemicelluloses and lignin, form the
structural component of a plant cell wall. They are available in bulk as waste from the
wood and agricultural industries. These materials are the largest renewable sources of
hexose and pentose sugars for industrial fermentation and have good potential to be
resource for biohydrogen production too. However, the need for a pretreatment process
to degrade these polymers into simple sugar has limited its use.
Utilization of cellulose degrading bacteria is a great alternative to chemical
pretreatment. For efficient hydrolysis of cellulosic materials, the bacterial cell has to
adhere to the cellulose. A study by Levin, Islam, Cicek & Sparling (2006) utilizes
Clostridium thermocellum for biohydrogen production using cellulose-based medium,
reported that delignified wood fibers were good substrates and produces yield of 1.6
mol hydrogen per mol glucose.
2.6 Biological Reactor Operation
At industrial scale, the main concerns are the low productivity and the low conversion
yields of the fermentative biological processes. Based on the current hydrogen

60
productivity, industrial processes would require very large-volume reactors. The
productivity of hydrogen-producing bioreactors treating agricultural waste and food
waste is quite low. This is due to the use of complex and polymeric organic substrates,
and also the use of mixed cultures as inoculum.
The optimization of the operating conditions in biological reactors is the key for
the improvement of biohydrogen production. Specifically-optimized bioreactors could
help to determine whether the use of food waste would be feasible technically and
economically. In order to meet these requirements, some operating conditions must be
considered such as pH, temperature and hydrogen partial pressure.
2.6.1 pH
pH is one of the most important factors to be controlled in anaerobic digestion
system. pH can affect the hydrogen yield in mixed cultures and can also modify the by-
product which in turn affects the structure of microbial communities.
Different substrate has different optimal pH for hydrogen production. For
example, optimal hydrogen production appears to take place with a pH of 5.0 to 6.0 for
food wastes whereas a neutral pH is suitable for crop residues and animal manure. Li et
al (2007) investigated a large range of initial pHs, from 4 to 8, in batch tests. The results
showed that pH of 7.0 to 7.5 as optimal for the conversion of corn straw to
biohydrogen. The accumulation of acidic byproducts, such as acetate and butyrate, will
lower the pH of the medium.
It was concluded that a pH of 5.5 is optimal for hydrogen production. It can be
said that in general, the optimal pH in terms of biohydrogen production is within a
range of 5.0 to 7.0. This pH range probably favors the activity of the hydrogenases and
is suitable for microbial development in dark fermentation (Li and Fang, 2007). The
pattern of intermediate VFAs is different under various pH conditions. Butyrate and

61
acetate are the two main by-products of anaerobic digestion, but at low pHs butyrate is
preferentially produced. Hydrogen-producing butyrate-acetate pathways are favored at
pH 4.5 to 6.0 while at neutral or higher pH conditions, ethanol and propionate will
accumulate.
It should be taken into consideration that under both high and low pH
conditions, the fermentation pattern was clearly associated with the dominance of
Clostridium species. At intermediate pHs however, metabolic shifts involved higher
microbial diversity.
2.6.2 Temperature
Temperature is one of the most important parameters affecting both the
biohydrogen production and microbial metabolisms in mixed cultures. Due to the
complexity of the food waste and operating conditions, no optimal temperature for
hydrogen fermentation can be concluded from the data in literatures.
Most studies on fermentative hydrogen production have been based on
mesophilic temperatures. Li et al (2009) reported that out of 101 case studies, 73 were
carried out at mesophilic temperatures. As for food waste, thermophilic temperatures
seem more suitable for hydrogen production although some may disagree. These
differences probably due to the various type of inoculum used, the different amount of
readily-biodegradable compounds as well as the operating conditions. At 55°C, acetate
was the dominant by-product while a propionate production pathway was favored at
20°C (Karlsson, 2008).
Without pretreatment of the initial inoculum, temperatures higher than 60°C are
recommended in order to reduce hydrogen-consuming activity. However, the main
disadvantage of thermophilic anaerobic fermentation processes is the energy
requirement for heating and maintenance.

62
2.6.3 Hydrogen partial pressure
A few studies reported that partial pressure of hydrogen is a restrictive factor in
the fermentation of organic waste. The oxidation of reduced components to VFAs,
alongside hydrogen production, will results in a low biohydrogen concentration in the
medium. This is because reactions are thermodynamically unfavorable. The positive
Gibbs energy of long chain fatty acid (LCFA) degradation shows that the degradation of
fat through the β-oxidation pathway is thermodynamically unfavorable and therefore it
requires an extremely low level of hydrogen partial pressure (Equation 2.8) (Li, 2009).
n-LCFA (n-2)-LCFA + 2Acetate + 2H2 ΔG = +48 kJmol-1
(Equation 2.8)
CH3COOH + 2H2O 4H2 + CO2 ΔG = +104.6 kJ mol-1
(Equation 2.9)
Additional hydrogen could also be derived from the degradation of acetate
(Equation 2.9). This conversion is thermodynamically unfavorable at mesophilic
temperatures. The reaction is therefore extremely sensitive to hydrogen concentration.
The inverse reaction is called homoacetogenesis. It is favored in the fermentation
process and plays a part in reducing the performance of bioreactors through the
accumulation of acetate in the medium.
When the hydrogen concentration in the medium increases, not only
biohydrogen production may be affected but also a shift of metabolic pathways towards
solventogenesis has been observed such as the accumulation of lactate, ethanol, acetone
and butanol (Levin, Islam, Cicek & Sparling, 2006).
Agitation is most common method to decrease the hydrogen partial pressure in
the medium, especially in highly concentrated bioprocesses treating organic waste, as
reported by Chou (2003). Mizuno et al (1998) showed that sparging nitrogen gas into a
fermentor fed with simple sugars led to double the biohydrogen yield from 86.76 ml

63
H2/g VS to 187.86 mL H2/g VS. The main disadvantage of sparging techniques is that,
regardless of the significant pressure removal, the sparged gas dilutes the biohydrogen
content and creates a further reduction in separation efficiency. Also, the sparging
processes are highly costly on industrial scale and hydrogen purification would raise the
production costs.
Membrane absorption techniques offer an energy-effective alternative for
hydrogen removal. Despite the different techniques available for reducing the partial
hydrogen pressure, more research is still required to develop efficient and low cost gas
purification system.
2.7 Waste to Wealth: Potential of using wastes such as POME, food waste and
sewage sludge for biohydrogen production in Malaysia
Malaysia is steadily progressing towards green energy technologies. Figure 2.7
shows the overview of renewable energy sectors. The Malaysian government has made
a few policies and programmes to encourage development of green energy. The Green
Technology Policy was established in 2009 comprising of four main areas: Energy,
Environment, Economy and Social. Several incentives and special yearly budgets are
also devised for this purpose. Budget 2001 was the first time special treatment was
given to renewable energy and in Budget 2010, incentive was offered to companies that
comply with GBI.
A clean development mechanism (CDM) was developed based on two treaties;
UNFCCC Rio de Janeiro Earth Summit 1992 and Kyoto Protocol 1997. The Kyoto
protocol calls for greenhouse gases (GHG) reduction during 2008 to 2012. CDM allows
trading of certified emission reductions (CER) between developing and Annex I

64
countries. 1 CER is equivalent to 1 tonne of carbon dioxide (Dagoumas, Papagiannis &
Dokopoulos, 2006).
Figure 2.7: Overview of renewable energy sectors and green technology development.
Promoting renewable energy has been such a hassle throughout the world due to
the higher capital cost to develop and run it when compared to the conventional goal
and natural gas power. It was reported that Malaysia emits 187 million tonnes of carbon
dioxide per annum, which is 7.2 tonnes per capita. This is already exceeding the world
average of 4.3 tonnes per capita. Malaysia has pledged to reduce the emission 40% by
the year 2020 and that the annual energy consumption growth would reduce while still
maintaining gross domestic product (GDP) growth.
Five projects from Malaysia has been awarded and claiming CER worth total of
RM 12.3 million. The first Malaysian project to be registered is Biomass Energy Plant
in Lumut, Perak of the ENCO Energy and PGEO Energy companies. The Lafarge
Energy from renewable resources
Solar
Solar thermal
Solar photovoltaic
Biomass Solid agro-
wastes
Liquid agro-waste
Wind
Municipal solid waste
Incineration power plants
Landfill gases power plants

65
cement has the first large scale CDM project in Malaysia to be registered. The plant
replaced coal with palm kernel shell to generate power (Economic Planning Unit, 2009)
Table 2.6: Compare and contrast of different power options with the carbon dioxide
emitted and their costs. (Economic Planning Unit, 2009)
Power options CO2 emitted
(grams/ kilowatt/ hour)
Cost
(US cents/ kilowatt/ hour)
Coal 947 5.1
Natural gas 159 3.8
Solar 121 59.8
Small scale hydro 40 8.9
Nuclear 32 6.8
Wind 24 10.5
Municipal solid wastes (MSW) and palm oil mill solid wastes and effluents have
big potential to become a resource for renewable energy. MSW can produce energy by
two technologies; incineration and landfill gas such as methane. However there are still
some transactional economic barriers. On the other hand, for POME a few other
methods can be utilized for energy conversion; biomass energy through combustion or
gasification of empty fruit bunch (EFB), biogas (methane) from POME and bioethanol
from EFB by fermentation method.
2.8 RSM application for biohydrogen production
Response Surface Methodology (RSM) is a collection of statistical and mathematical
techniques useful for developing, improving, and optimizing processes. The most
common applications of RSM are in situations where several input variables potentially

66
influence some performance measure or quality characteristic of the process. So
performance measure or quality characteristic is called the response. The input variables
are sometimes called independent variables, and subjected to the control of the
experimenter. The field of RSM consists of the experimental strategy for exploring the
space of the process or independent variables, empirical statistical modeling to develop
an appropriate approximating relationship between the yield and the process variables,
and optimization methods for finding the values of the process variables that produce
desirable values of the response.
In this work, RSM using a full factorial design will be used to determine the
optimal conditions of temperature, inoculums size and pH for biohydrogen production
from food waste using a mixed culture from pre-treated sludge.

67
3.0 MATERIALS AND METHODS
3.1 Reagents
All the reagents were prepared in accordance to the Standard Methods 18th
edition (APHA, 1992)
3.1.1 COD Analysis (APHA,1992)
Potassium Hydrogen Phtalate (KHP) solution for standard curve
Potassium dichromate (K2Cr2O7 ) digestion solution 0.017 M
Sulphuric acid reagent
3.1.2 Total Kjeldahl Nitrogen (TKN) Analysis (APHA,1992)
TKN digestion reagent
Sodium Hydroxide- Sodium Thiosulfate reagent
Indicating boric acid solution
Mixed indicator solution
Sulphuric acid titrant 0.02 N
3.2 Sample Collection and Preparation
3.2.1 Preparation of substrate
Food waste was collected from various cafeterias around University of Malaya. It
consisted mainly of rice, vegetables and chicken. After removing the bones and
unnecessary waste, the food waste was grounded using an electrical blender. The food
waste was mixed with tap water to facilitate blending. After blending, the food waste is
filtered using domestic sieve with pore size 0.2 mm to remove excess water. The
blended waste was then packed into small plastic bags of 1 kg each and then kept in

68
freezer at -20°C. Before being used in experiment, the food waste was thawed for
overnight.
The chemical characteristics of food waste were analyzed. The pH was around
4.0 to 4.3, with total suspended solid (TSS) and volatile suspended solid (VSS) of 762.7
mg/l and 526.7 mg/l, respectively.
3.2.2 Sewage Sludge
The bacterial population used as inoculum in the production of H2 was from anaerobic
sludge obtained from Indah Water Konsurtium from the Pantai Dalam treatment plant.
The sludge was obtained from the gravity thickener part of the sludge holding tank,
before it enters the anaerobic digester.
The sludge is kept in cold room at 4°C and thawed before use. The sludge will
be heat treated prior use to kill off methanogens in a water bath at 100°C for an hour
(Mohammadi, Ibrahim, Mohamad Annuar & Law, 2011; Ginkel and Sung, 2001). The
pH of the sludge was 7.25, with total suspended solid (TSS) and volatile suspended
solid (VSS) of 284 mg/l and 244 mg/l, respectively.
3.2.3 Palm Oil Mill Effluent
The palm oil mill effluent (POME) was collected from a local palm oil in Selangor. The
collected POME was stored in cold room at 4⁰C. This is to minimize and slow down the
degradation of the effluent from microbial action. The characteristics of the POME
were analyzed. The pH is 4.2 to 4.55, with total suspended solid (TSS) and volatile
suspended solid (VSS) of 833.2 mg /l and 567.5 mg /l, respectively.

69
3.3 Experimental Design and Procedure
3.3.1 Inoculum Preparation
For inoculum preparation, the pre-heated sludge was cultivated in food waste and
incubated in a shaker for 24 hours (ratio of sludge to food waste is 1:4) before being
used as the inoculum in the experiment. The temperature and initial pH used were
according to the intended combination to be tested in the experimental design.
3.3.2 Comparison between Anaerobic and Facultative Anaerobic Bacteria for
Hydrogen Production
Anaerobic condition is established by sparging the serum bottles with oxygen-free
nitrogen gas for 3 minutes at 20 ml/ minute. Facultative anaerobic condition for the
experiment was obtained by sealing the serum bottles without any nitrogen gas
sparging. The parameters chosen are listed in Table 3.1 for both aerobic and anaerobic
conditions. The experiments were done in triplicates and the resulting cumulative
hydrogen production obtained was averaged.
Table 3.1: Experimental parameters for both anaerobic and facultative anaerobic
conditions
Parameters Levels Conditions
Initial pH 4.5 5.5 6.5 35°C, inoculum size 20%
Temperature (°C) 35 45 55 Initial pH 4.5, inoculum size 20%
Inoculum size
(% volume/ volume) (ml)
2 11 20 Initial pH 4.5, 35°C

70
3.3.3 Full Factorial Design
Full factorial design allow for simultaneous study of several factors and their
interactions‟ effects on resulting production. Varying the levels of the factors
simultaneously rather than one at a time is time and cost efficient.
The high and low levels defined for the full factorial design are shown in Table
3.2. The high and low levels were chosen based on literature review. The response
(cumulative hydrogen production and COD removal) was determined as an average of
three simultaneous experiments.
For each parameter studied, three points were set up; a minimum, middle and
maximum point viz temperatures of 35°C, 45°C and 55°C; inoculum sizes of 2%, 10%
and 20% volume/volume (ml); initial pH of 4.5, 5.5 and 6.5. Using Minitab Pro 16.1, a
full factorial design for RSM was developed as shown in Table 3.3. Standard order
shows what the order of the runs in the experiment would be if the experiment was done
in standard order. Run order shows what the order of the runs in the experiment would
be if the experiment was run in random order.
Table 3.2: Variables and levels used in the factorial design
Symbols Variables Levels
A Initial pH 4.5 5.5 6.5
B Temperature (°C) 35 45 55
C Inoculum size (% volume/ volume) (ml) 2 10 20
Table 3.3 is the RSM design by Minitab software. Each experimental condition
is a run. Run order is the randomized standard order in which each set of test conditions
is run. Randomization is the best practical technique to prevent confounding between
time and factor of interest though it doesn‟t give guarantee.
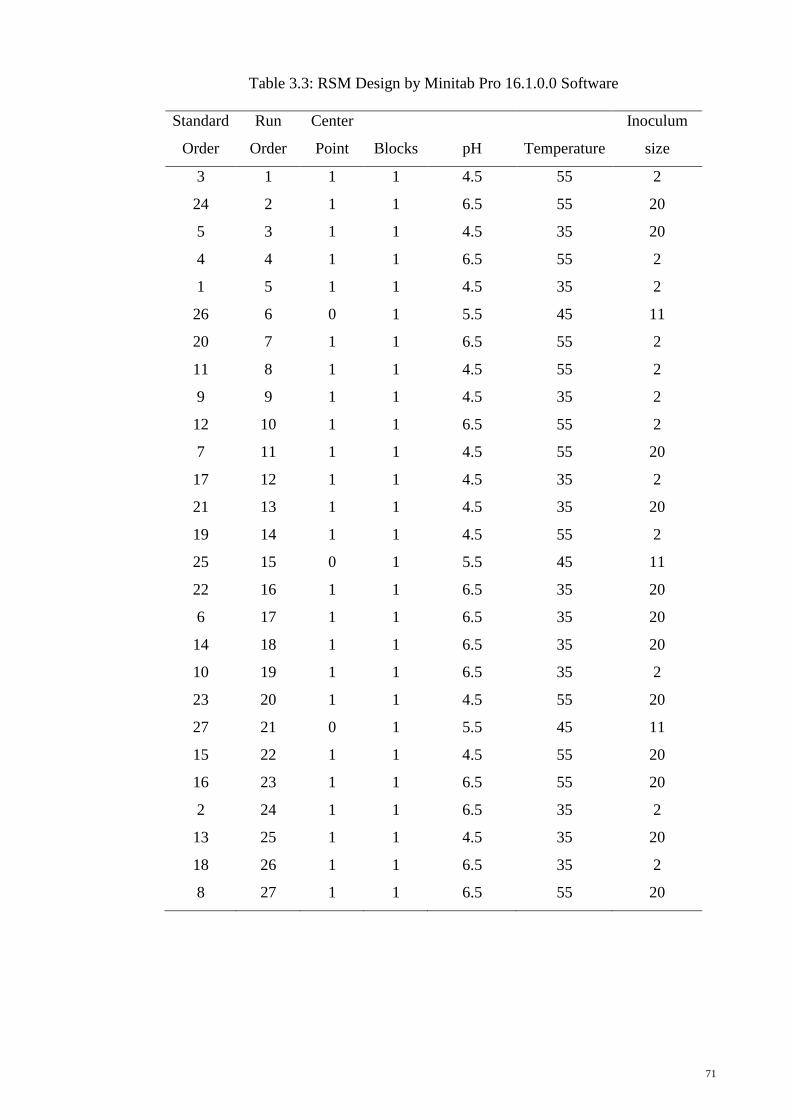
71
Table 3.3: RSM Design by Minitab Pro 16.1.0.0 Software
Standard
Order
Run
Order
Center
Point Blocks pH Temperature
Inoculum
size
3 1 1 1 4.5 55 2
24 2 1 1 6.5 55 20
5 3 1 1 4.5 35 20
4 4 1 1 6.5 55 2
1 5 1 1 4.5 35 2
26 6 0 1 5.5 45 11
20 7 1 1 6.5 55 2
11 8 1 1 4.5 55 2
9 9 1 1 4.5 35 2
12 10 1 1 6.5 55 2
7 11 1 1 4.5 55 20
17 12 1 1 4.5 35 2
21 13 1 1 4.5 35 20
19 14 1 1 4.5 55 2
25 15 0 1 5.5 45 11
22 16 1 1 6.5 35 20
6 17 1 1 6.5 35 20
14 18 1 1 6.5 35 20
10 19 1 1 6.5 35 2
23 20 1 1 4.5 55 20
27 21 0 1 5.5 45 11
15 22 1 1 4.5 55 20
16 23 1 1 6.5 55 20
2 24 1 1 6.5 35 2
13 25 1 1 4.5 35 20
18 26 1 1 6.5 35 2
8 27 1 1 6.5 55 20

72
3.3.4 Experimental Design
The batch experiment was conducted in 120 ml serum bottles with a working volume of
50 ml, with varying initial pH, inoculum size and temperature. Figure 3.1 shows the
experimental design of this study. There were 2 designs; Production 1, with food waste
as inoculum and Production 2, with food waste and POME as inoculum. The mixing
ratio for food waste and POME in Production 2 was 50:50 (v/v).
A control batch is also run with solely food waste without the sludge as
inoculum. The bottles were sealed with rubber stopper and aluminium cap. The pH is
controlled using 1M NaOH and 1M H2SO4. The serum bottles were sparged with
oxygen-free nitrogen gas for 3 minutes at 20 ml/minute to provide a fully anaerobic
condition.
Figure 3.1: Experimental design to study hydrogen production from food waste and
mixed culture (Production 1) food waste with POME and mixed culture (Production 2)
PARAMETERS
pH
4.5
5.5
6.5
Temperature
35°C
45°C
55°C
Inoculum Size
2% v/v
10% v/v
20% v/v

73
All experiment was conducted in an incubator shaker at 150 rpm for 72 hours.
Figure 3.2 shows the incubator shaker used for this experiment. Biogas sampling was
done at every 8 hours interval. The biogas collected using syringes are kept in acidic
water (around pH 2) in 20 ml serum bottles using water displacement method, as shown
in Figure 3.3. The acidic pH helps to prevent the gas from dissolving into the water. The
serum bottles were then covered with a rubber septa and aluminium caps as shown in
Figure 3.4.
The gas content was analyzed using a gas chromatography machine with
thermal conductivity detector (TCD). All treatments were done in 3 replicates.
Figure 3.2: The experiments were conducted in an incubator shaker for 72 hours

74
Figure 3.3: Biogas produced was stored in acidic water (pH 2) using water displacement
method
Figure 3.4: The serum bottle was sealed with a rubber septa and aluminum cap

75
3.4 Analytical methods
3.4.1 Hydrogen Analysis
The biogas composition was determined using a gas chromatograph (Perkin Elmer,
AutoSystem GC) equipped with thermal conductivity detectors (TCD) and digital data
acquisition system as shown in Figure 3.5. Hydrogen content was analyzed by GC-TCD
fitted with a 1.5m stainless steel column packed with a molecular sieve (80/100 mesh)
the temperatures of injection port, oven and detector were 80⁰C, 200⁰C and 200⁰C
respectively. The carrier gas used was Argon at a flow rate of 30 ml/min. A volume of 1
ml of gas sample was injected in triplicates.
Figure 3.5: Gas chromatography machine (Perkin Elmer Autosystem GC)

76
Hydrogen gas production was calculated from headspace measurement of gas
composition and the total volume of hydrogen produced using the mass balance
equation (Jamil, Mohamad Annuar, Ibrahim & Sabaratnam, 2009):
VHi = VHi – 1 + CHi (VGi – VGi - 1) + VH0 (CHi – CHi - 1) (Equation 3.1)
Where:
VHi is the cumulative hydrogen gas volumes at the current (i), VHi–1 is the
previous time interval (i-1)
VGi is the total biogas volume at the current time interval, VGi–1 is the
total bioghas volume at previous time interval
CHi is the fraction of hydrogen gas in the headspace at the current time
interval
VH is the volume of headspace of the serum bottle (70ml)
3.4.3 TSS and VSS analysis
Total suspended solids are materials that were retained on a standard glass fiber filter
paper when a sample of wastewater is filtered. The residue on the filter paper was dried
overnight in the oven at 105°C. The glass fiber filter paper used in this study was
Whatman filter paper, sized 47 mm with pore size of 0.75 µm.
The TSS and VSS analysis was done according to the standard method. For TSS
analysis, the filter paper was first dried in an oven at 105°C and cooled in dessicator.
The filter paper was then weighted. The filter paper was placed on the filtration
apparatus and filtered under vacuum condition. 50 ml of well-mixed sample is filtered
until all the water was removed. The filter paper was then transferred into a porcelain

77
crucible and dried in an oven overnight. The filter papers were then cooled in a
dessicator and weighed. These filter papers are then dried at 550°C for 15 minutes for
VSS analysis. The papers are dried in dessicator and then weighed.
Calculation for TSS and VSS analysis is shown in Equation 3.2:
Total Suspended Solids = [(A – B) / C] X 1000mg/L X Dilution factor (Equation
3.2)
where:
A = Weight of filter paper with residue (mg)
B = Weight of filter paper (mg)
C = ml of sample taken
3.4.4 Chemical Oxygen Demand Analysis
The chemical oxygen demand (COD) determination is a measure of the oxygen
equivalent of that portion of the organic matter in a sample that is susceptible to
oxidation by a strong chemical oxidant. The COD analysis is done using the closed
reflux colorimetric method.
A sample volume of 2.5 ml was measured into COD tube cell. Then, 1.5 ml of
potassium dichromate solution was added. After that, 3 ml of sulphuric acid reagent was
added slowly into the cells. All cells were then heated at 150ºC in heating blocks for
two hours. The cells were subsequently cooled down to room temperature. The
samples‟ absorbance values were read using a spectrophotometer at 600nm. The
absorbance value was read in triplicates, and deducted by the value of blank. The
absorbance value of the sample was then compared to the standard calibration (Figure
3.6) to determine the oxygen concentration as mg oxygen /liter.

78
A blank was prepared in a similar manner with the sample replaced by distilled
water. A standard calibration was prepared using potassium hydrogen phtalate solution,
using the same procedure as before, with varying concentrations from 0 to 500 mg/l.
Figure 3.6: Standard calibration curve for COD analysis
3.4.5 Total Kjeldahl Nitrogen (TKN) Analysis
Nitrogen exists in water in the form of nitrate, nitrite, ammonia and organic nitrogen.
All these forms of nitrogen, as well as nitrogen gas (N2) are biochemically inconvertible
and are components of the nitrogen cycle. Nitrate is an essential nutrient for many
photosynthetic autotrophs.
Kjeldahl nitrogen is the sum of organic nitrogen and ammonical nitrogen. The
macro-kjeldahl method used in this study is applicable for samples containing either
low or high concentrations of organic nitrogen, but requires a large sample volume for
low concentrations. Samples for TKN can be stored by acidifying it to pH 2 with
concentrated sulphuric acid and storing them at 4°C.
y = 0.0004x + 0.0495
R² = 0.9691
0
0.05
0.1
0.15
0.2
0.25
0.3
0 100 200 300 400 500 600
Ab
sorb
an
ce
Concentration (mg/L)

79
3.4.5.1 Digestion
A volume of 25 ml of digestion reagent and 25 ml of sample was added into the
distillation flask. Two glass beads are added to facilitate mixing. A blank was prepared
by replacing the sample with distilled water. The flasks were boiled slowly at 165ºC for
about 2 hours.
The flasks were left to cool down to room temperature before diluting it to 150
ml with distilled water and mixed. The flasks were tilted carefully and 25 ml of sodium
hydroxide thiosulfate reagent was added to form an alkaline layer at the bottom.
3.4.5.2 Distillation
The flask was connected to a distillation apparatus and the flask were swirled to ensure
complete mixing. After distillatiom, 100 ml of distillate was collected into 25 ml boric
acid indicator solution.
3.4.5.3 Titration
The distillate was titrated with standard 0.02 N sulphuric acid and mixed using
magnetic stirrer until the green colour solution turned pale lavender.
3.4.5.4 Calculation
mg NH3 – N/ L = [ (A-B) X 280 ] / ml sample X Dilution factor (Equation 3.3)
where,
A = volume of sulphuric acid titrated for the sample to turn to pale lavender color
B = volume sulphuric acid titrated for the blank to turn to pale lavender color

80
Figure 3.7 is a flow chart simplifying the experimental steps done. First step is sample
collection and preparation and then the preparation of mixed culture; food waste, sludge
and POME. Next step is experimental design and procedure using RSM method. After
running the experiment, analysis of physical properties and also biogas were done.
Figure 3.7: Flow chart of experimental steps
SAMPLE COLLECTION AND
PREPARATION
MIXED CULTURE PREPARATION
EXPERIMENTAL DESIGN &
PROCEDURE USING RSM
RUN EXPERIMENT
PHYSICAL PROPERTIES
ANALYSIS BIOGAS ANALYSIS

81
4.0 RESULTS AND DISCUSSIONS
4.1 Chemical Characterization
The chemical characteristics for food waste, sewage sludge and palm oil mill effluent
(POME) used in this study is presented in Table 4.1. POME has the highest TSS, VSS,
COD and TKN compared to food waste and sewage sludge. The pH for both food waste
and POME was in the range of 4.0 to 4.5, while the sewage sludge obtained from
anaerobic digester showed higher pH of 7.25 to 7.50. pH of food waste and POME are
both acidic due to the by-product of nutrient degrading microorganism present in those
source. Food waste has the lowest TKN because only a small amount of protein source
was present. Food waste collected in this study consists mainly of rice while the
remainder were vegetables, fish and meat.
Table 4.1: Chemical analysis of food waste, sewage sludge and POME
Analysis Food waste Sewage sludge POME
TSS 762.7 mg/L 284 mg/L 833.2 mg/L
VSS 526.7 mg/L 244 mg/L 567.5 mg/L
COD 194625 mg/L 242000 mg/L 320040 mg/L
TKN 260.4 mg/L 492.8 mg/L 554.4 mg/L
pH 4.0 - 4.3 7.25 - 7.50 4.2 – 4.5

82
4.2 Cumulative Hydrogen Production
The biogas composition was determined using a gas chromatograph (Perkin Elmer,
AutoSystem Gas Chromatography) equipped with thermal conductivity detectors (TCD)
and digital data acquisition system. Hydrogen content was analyzed by GC-TCD fitted
with a 1.5 m stainless steel column packed with a molecular sieve (80/100 mesh) the
temperatures of injection port, oven and detector were 80°C, 200°C and 200°C
respectively. The carrier gas used was Argon at a flow rate of 30 ml/ min. The gas
sample was injected 1ml in replicates.
Figure 4.1: An example of chromatogram obtained using Perkin Elmer GC with TCD
Hydrogen gas production was calculated from headspace measurement of gas
composition and the total volume of hydrogen produced using the mass balance
equation as in Equation 3.1:
VHi = VHi – 1 + CHi (VGi – VGi - 1) + VH0 (CHi – CHi - 1) (Equation 3.1)
This mass balance equation was modified for the purpose of this study. Since
cumulative hydrogen production is an increasing value, any sample reading (VHi) that
showed decrease was neglected. This way, the cumulative hydrogen production
remains a positive value.

83
4.3 Comparison between Anaerobic and Facultative Anaerobic Bacteria for
Hydrogen Production
Anaerobic condition is established by sparging the serum bottles with oxygen-free
nitrogen gas for 3 minutes at 20 ml/ minute. Facultative anaerobic condition for the
experiment was obtained by sealing the serum bottles without any nitrogen gas
sparging.
4.3.1 Effect of initial pH
The effect of initial pH was tested at 3 levels; pH 4.5, pH 5.5 and pH 6.5 while
the temperature and inoculum size was kept constant at 35°C and 20%, respectively. At
initial pH 4.5, aerobic system showed final cumulative hydrogen production of 7.21 ml
while anaerobic system showed an average of final cumulative hydrogen production of
11.21 ml (Figure 4.2). At initial pH 5.5 the anaerobic system produces 9.11 ml of
hydrogen and 4.38 ml of hydrogen was produced in the aerobic system (Figure 4.3). At
initial pH 6.5, 9.05 ml of hydrogen was produced in the anaerobic system and 4.56 ml
of hydrogen in the aerobic system (Figure 4.4).
Figure 4.2: Cumulative hydrogen production for aerobic and anaerobic condition at
initial pH 4.5
7.21
11.21
-2
0
2
4
6
8
10
12
14
-8 0 8 16 24 32 40 48 56 64 72 80
Cu
mu
lati
ve h
ydro
gen
pro
du
ctio
n (
ml)
Time (hours)
Aerobic
Anaerobic

84
Figure 4.3: Cumulative hydrogen production for aerobic and anaerobic condition at
initial pH 5.5
Figure 4.4: Cumulative hydrogen production for aerobic and anaerobic condition at
initial pH 6.5
In general, all three pH conditions showed a gradual increase and eventually the
production levelled off towards the end of fermentation for both anaerobic and aerobic
4.38
9.11
-2
0
2
4
6
8
10
12
-8 0 8 16 24 32 40 48 56 64 72 80Cu
mu
lati
ve h
ydro
gen
pro
du
ctio
n (
ml)
Time (hours)
Aerobic
Anaerobic
4.56
9.05
-2
0
2
4
6
8
10
12
-8 0 8 16 24 32 40 48 56 64 72 80Cu
mu
lati
ve h
ydro
gen
pro
du
ctio
n (
ml)
Time (hours)
Aerobic
Anaerobic

85
systems. However, the hydrogen gas production slope of anaerobic system was much
steeper i.e. the rate of production was higher than in aerobic system.
In this study, the anaerobic system showed higher cumulative hydrogen gas
production compared to aerobic system for all three initial pH tested. However, the
production level of these two systems was not significantly different at pH 4.5 and 5.5.
At initial pH 6.5, however, the production level in anaerobic system was almost 50%
higher than in aerobic system.
Within appropriate range, increase in pH is directly related to increased
hydrogen production. However, if pH is too high, microbial hydrogen production ability
will be decreased (Wang and Wan, 2009). A similar study done by Fang et al (2006)
investigates the effect of initial pH in the range of 4.0 to 7.0 using a batch reactor. The
optimal initial pH obtained was pH 4.5 with maximum hydrogen yield of 346 ml/ g
starch. In another study by Khanal et al (2004), in the range of 4.5 to 6.5 the optimal
initial pH was also found to be pH 4.5.These results agreed with the finding of this
study that showed initial pH 4.5 is optimum based on the highest cumulative hydrogen
obtained.
4.3.2 Effect of temperature
The effect of temperature on cumulative hydrogen production was tested at 3
levels viz. 35°C, 45°C and 55°C while the initial pH and inoculum size was kept
constant for all parameters at 4.5 and 20%, respectively. At 35°C, anaerobic system has
the cumulative hydrogen gas production of 8.52 ml while anaerobic system has an
average of cumulative hydrogen gas production of 7.91 ml (Figure 4.5). At 45°C the
anaerobic system produced 6.97 ml of hydrogen gas while 6.23 ml of hydrogen gas was
produced in the aerobic system (Figure 4.6). At 55°C, 7.30 ml of hydrogen gas was

86
produced in the anaerobic system while 5.42 ml of hydrogen was obtained in the
aerobic system (Figure 4.7).
Figure 4.5: Cumulative hydrogen production for aerobic and anaerobic condition at
35°C
Figure 4.6: Cumulative hydrogen production for aerobic and anaerobic condition at
45°C
7.91 8.52
-2
0
2
4
6
8
10
12
-8 0 8 16 24 32 40 48 56 64 72 80Cu
mu
lati
ve h
ydro
gen
po
rdu
ctio
n (
ml)
Time (hours)
Aerobic
Anaerobic
6.23 6.97
-2
-1
0
1
2
3
4
5
6
7
8
9
-8 0 8 16 24 32 40 48 56 64 72 80
Cu
mu
lati
ve h
ydro
gen
po
rdu
ctio
n (
ml)
Time (hours)
Aerobic
Anaerobic
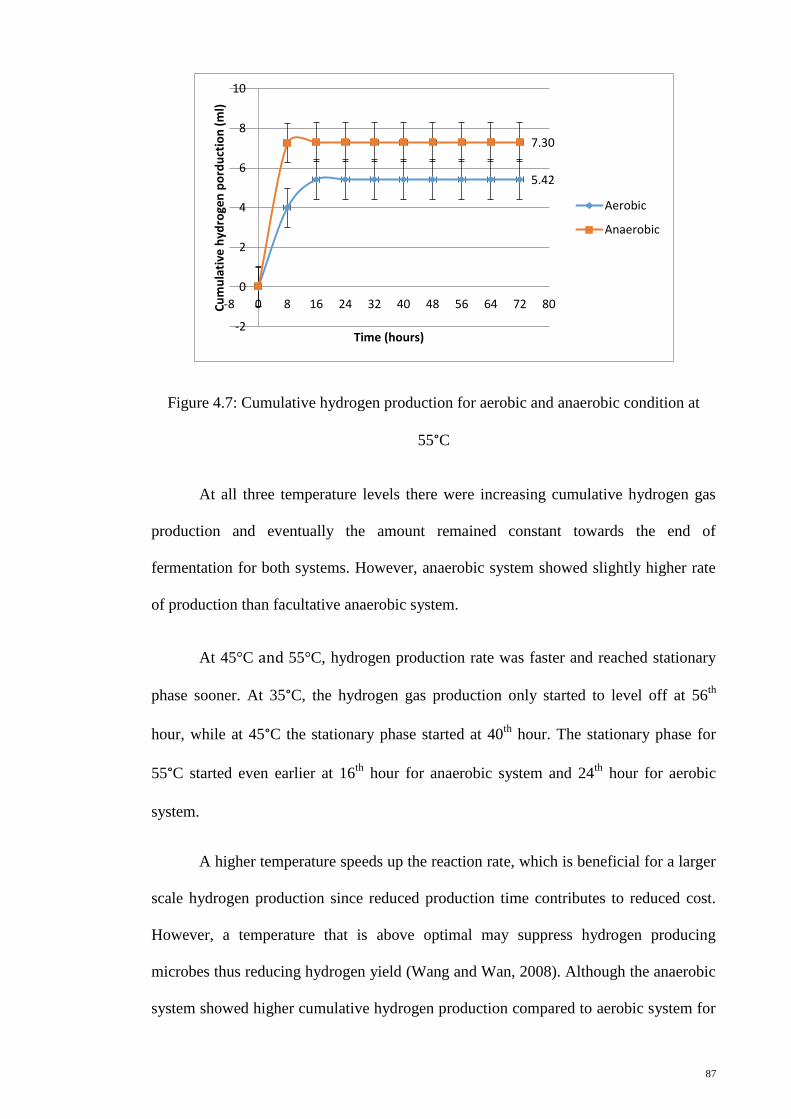
87
Figure 4.7: Cumulative hydrogen production for aerobic and anaerobic condition at
55°C
At all three temperature levels there were increasing cumulative hydrogen gas
production and eventually the amount remained constant towards the end of
fermentation for both systems. However, anaerobic system showed slightly higher rate
of production than facultative anaerobic system.
At 45°C and 55°C, hydrogen production rate was faster and reached stationary
phase sooner. At 35°C, the hydrogen gas production only started to level off at 56th
hour, while at 45°C the stationary phase started at 40th
hour. The stationary phase for
55°C started even earlier at 16th
hour for anaerobic system and 24th
hour for aerobic
system.
A higher temperature speeds up the reaction rate, which is beneficial for a larger
scale hydrogen production since reduced production time contributes to reduced cost.
However, a temperature that is above optimal may suppress hydrogen producing
microbes thus reducing hydrogen yield (Wang and Wan, 2008). Although the anaerobic
system showed higher cumulative hydrogen production compared to aerobic system for
5.42
7.30
-2
0
2
4
6
8
10
-8 0 8 16 24 32 40 48 56 64 72 80Cu
mu
lati
ve h
ydro
gen
po
rdu
ctio
n (
ml)
Time (hours)
Aerobic
Anaerobic

88
all the temperature conditions tested, the final hydrogen gas production of these two
systems were not much different.
Even though the optimal temperature reported for microbial hydrogen
production studies may differ, most fell into the range of mesophilic and thermophilic
range, depending on the type of substrate and inoculum used (Wang and Wan, 2009). Li
et al (2007) reported that 73 out of 101 case studies were carried out at mesophilic
temperatures. Studies done by Shin et al (2004) and Kim et al (2004) both showed
optimal temperature in mesophilic range for hydrogen gas production with specific
hydrogen production rate (SHPR) of 12 ml/ g VSS h and 0.7 ml/ g VSS h, respectively.
4.3.3 Effect of inoculum size
The effect of inoculum size was tested at three levels, 2%, 11% and 20%. When the
inoculum size was set at 2% volume/ volume (ml) the anaerobic system showed final
cumulative hydrogen gas production 5.02 ml while the aerobic system 4.32 ml as shown
in Figure 4.8. Similar observation was made for 11% inoculum size (Figure 4.9). At
inoculum 20%, both systems reached stationary phase at approximately 40th
hour.
However, the difference in cumulative hydrogen gas production for both the anaerobic
and aerobic system is small i.e. 6.97 ml and 5.42 ml respectively (Figure 4.10).

89
Figure 4.8: Cumulative hydrogen production for aerobic and anaerobic condition at
inoculum size 2%
Figure 4.9: Cumulative hydrogen production for aerobic and anaerobic condition at
inoculum size 11%
4.32
5.02
-2
-1
0
1
2
3
4
5
6
7
-8 0 8 16 24 32 40 48 56 64 72 80
Cu
mu
lati
ve h
ydro
gen
po
rdu
ctio
n (
ml)
Time (hours)
Aerobic
Anaerobic
4.38
5.12
-2
-1
0
1
2
3
4
5
6
7
-8 0 8 16 24 32 40 48 56 64 72 80
Cu
mu
lati
ve h
ydro
gen
po
rdu
ctio
n (
ml)
Time (hours)
Aerobic
Anaerobic

90
Figure 4.10: Cumulative hydrogen production for aerobic and anaerobic condition at
inoculum size 20%
The inoculum size showed significant effect on the cumulative hydrogen gas
production of the systems tested. Higher inoculum size produces higher cumulative
hydrogen production. A logical explanation behind this is that the production of
hydrogen gas was directly related to the number of hydrogen producing organisms that
exist in the system.
It is obvious that for all three conditions tested, higher hydrogen gas production
was shown by anaerobic system in relative to facultative anaerobic. This indicated that
majority of the microbial population in the mixed culture were obligate anaerobes. The
microbial DNA profiling data in study by Fang et al (2006) indicated that the mixed
culture microbes from sewage sludge were mainly made up of Clostridium sp; a Gram
negative rod shaped obligate anaerobes and spore forming bacteria.
Hydrogen production in the liquid phase can be strongly affected by the
hydrogen gas partial pressure. The key enzyme involved is hydrogenase; it reversibly
oxidizes and reduces ferrodoxin. When the hydrogen concentration is high in liquid
5.42
6.97
-2
-1
0
1
2
3
4
5
6
7
8
9
-8 0 8 16 24 32 40 48 56 64 72 80
Cu
mu
lati
ve h
ydro
gen
po
rdu
ctio
n (
ml)
Time (hours)
Aerobic
Anaerobic
91
phase, reduction of oxidized ferrodoxin will take place instead of oxidation of reduced
ferredoxin. In other word, hydrogen in liquid phase will oxidize to proton, therefore
reducing the yield of hydrogen (Chong et al, 2009).
Gas sparging with inert gasses such as nitrogen is normally done to create an
anaerobic condition. It is also as an alternative to reduce hydrogen partial pressure. The
main disadvantage of gas sparging is that it dilutes the hydrogen content and creates
further reduction in efficiency of separation. In larger scale, this technique will require
high energy consumption for sparging process and downstream processing of hydrogen
purification which in turn will increase the production cost. Sparging industrial size
reactors is feasible when the sparging gas is produced onsite. If the sparging gas is the
same composition as the headspace gas, this technique is simply another form of
mixing.
In a study by Kim et al (2006), there does not seem to be any relationship
between amount of sparging and increase in hydrogen yield when multiple sparging
rates were tested to compare hydrogen yield with increasing rate of sparging. However,
sparging did improve hydrogen yield than unsparged condition. Thus, it was concluded
that hydrogen production can be significantly improved by sparging gas into the system.
Clark et al (2012) in their study has shown that sparging with nitrogen and
carbon dioxide increased the specific hydrogen production rate and final yield. The
highest yield obtained was 1.68 mol hydrogen/ mol of hexose when sparged with
carbon dioxide at 300 ml/ minute. Normally higher hydrogen yields will be
accompanied by high acetate production. However, 16S rRNA analysis of the microbial
community showed that carbon dioxide sparging inhibits the homoacetogens causing
lower acetate production and hydrogen consumption.
92
Hussy et al (2003) examined the effect of nitrogen gas sparging on hydrogen
production in a continuously stirred tank reactor (CSTR) digesting wheat flour industry
byproducts. Sparged system showed an increase in hydrogen production from 1.3 to 1.9
mol hydrogen/ mole hexose. Mizuno et al (2000) used a mixed culture grown in glucose
in a CSTR that was also sparged with nitrogen gas. They reported increased yields from
0.85 to 1.43 mole hydrogen/ mole glucose with no major shift in fermentation products
occurred.
4.4 Response Surface Methodology (RSM)
In this work, RSM was used to determine the optimal points of temperature, inoculum
size and pH for biohydrogen production from 1) food waste with a mixed culture from
pre-treated sludge (Production 1) and 2) mixture of food waste and palm oil mill
effluent (POME) with a mixed culture from pre-treated sludge (Production 2).
For each parameter studied, three points were chosen; a minimum, middle and
maximum point. The parameters and their respective points were: Temperatures of
35°C, 45°C and 55°C; Inoculum sizes of 2%, 10% and 20% volume/volume (ml); pH of
4.5, 5.5 and 6.5. These parameters‟ levels and symbols are shown in Table 4.2.
Factors that influence the hydrogen gas production were evaluated using
factorial plots, main effects plots, interaction effects, normal probability plots and
contour plots. The ANOVA and p-value significant levels were used to check the
significance of the variables on hydrogen gas production.
Table 4.2: Symbols for variables and their levels
Symbols Variables Levels
A Initial pH 4.5 5.5 6.5
B Temperature (°C) 35 45 55

93
C Inoculum size
(% volume/ volume) (ml)
2 11 20
4.4.1 Analysis of Result for Cumulative Hydrogen Gas Production for Food
Waste as Sole Substrate (Production 1)
The multiple regression analysis done using Minitab 16.1 software showed the
importance of main and interaction effects of the three variables (Table 4.3).
Table 4.3: Estimated effects and coefficients for hydrogen production from food waste,
Production 1 (coded units)
Term Effect Coef SE Coef T P
Constant 6.5965 0.1902 34.68 0.000
Ph -0.1926 -0.0963 0.2018 -0.48 0.638
Temperature -1.9980 -0.9990 0.2018 -4.95 0.000
Inoculum 0.9458 0.4729 0.2018 2.34 0.030
pH*Temperature 1.3856 0.6928 0.2018 3.43 0.003
pH*Inoculum 0.1291 0.0645 0.2018 0.32 0.752
Temperature*Inoculum 0.2580 0.1290 0.2018 0.64 0.530
pH*Temperature*Inoculum -0.0274 -0.0137 0.2070 -0.07 0.948
S = 0.98843 PRESS = 35.3015
R2 = 68.03%
Table 4.4: Analysis of variance for hydrogen produced from food waste, Production 1
(Coded units)
Source DF Seq SS Adj SS Adj MS F P
Main Effects 3 29.5414 29.5414 9.8471 10.08 0.000
pH (A) 1 0.2225 0.2225 0.22 0.23 0.638
Temperature (B) 1 23.9518 23.9518 23.9518 24.52 0.000
Inoculum (C) 1 5.3671 5.3671 5.3671 5.49 0.030
2-Way Interactions 3 12.0181 12.0181 4.0060 4.10 0.020
pH*Temperature (AB) 1 11.5189 11.5189 11.5189 11.79 0.003
pH*Inoculum (AC) 1 0.1000 0.1000 0.1000 0.10 0.752
Temperature*Inoculum (BC) 1 0.3992 0.3992 0.3992 0.41 0.530
3-Way Interactions 1 0.0045 0.0045 0.0045 0.00 0.948
pH*Temperature*Inoculum
(ABC)
1 0.0045 0.0045 0.0045 0.00 0.948
Residual Error 20 19.5404 19.5404 0.9770
Curvature 1 3.7451 3.7451 3.7451 4.50 0.047
Lack of Fit 1 0.0045 0.0045 0.0045 0.01 0.944
Pure Error 18 15.7908 15.7908 0.8773

94
Total 26 61.0999
Both Table 4.3 and 4.4 are obtained directly from Minitab 16.1 software. The
multiple regression analysis done using the software showed the importance of main
and interaction effects of the three variables (Table 4.4). In order to simplify the
calculation, coded variables are used for describing independent variables in the (-1, 1)
interval; -1 represents the low settings while 1 are the high settings. Minitab uses coded
units to allow comparison of coefficients‟ sizes to determine which factor has the
largest impact on the response (Bradley, 2007).
The significance of the regression coefficients was determined by applying a t-
test. The temperature and inoculum size (volume/volume) (ml), showed significant
effect on the cumulative hydrogen production, where P ˂ 0.05. The initial pH chosen
for this study, ranging from 4.5 to 6.5 did not show any significance; probably due to
the small range tested. However, the two-way interaction effect between initial pH and
temperature was significant (P = 0.003).
The coefficient of multiple determinations, R2
shows how well the estimated
model fits the data. The closer R2
is to 1, the better the model fits the experimental data.
The value of R2
for this part is 0.6802. This means that the model could explain 68.02%
of the total variation in the system.
The predicted value of response was obtained from full quadratic model fitting
technique which includes the main effects and interaction effects. The regression
equation generated by Minitab software in coded unit is given in Equation (4.1):
Y = 6.5965 – 0.0963A – 0.9990B + 0.4729C + 0.6928AB + 0.0645AC + 0.1290BC –
0.0137ABC (Equation 4.1)

95
Where Y (yield) is the cumulative hydrogen in ml; A is initial pH, B is temperature (°C)
and C is inoculum size (% v/v). The ANOVA analysis for Equation 4.1 is shown in
Table 4.4.
The function in Equation (4.2) describes how the experimental variables and
their interactions influence the hydrogen production. The initial pH of the system (A)
had the greatest effect on hydrogen production, followed by temperature (B), inoculum
size (C) and initial pH-temperature interaction (AB). The positive values of these effects
showed that the increase in these parameters should result in the increase of response, in
this case hydrogen production. The negative values of the effects on the other hand will
result in decreased response. According to Equation (4.2), the initial pH and
temperature showed negative effect on cumulative hydrogen production while inoculum
size and all the interaction effects showed positive effect on hydrogen production.

96
The main effects of each parameter on cumulative hydrogen production are showed in
Figure 4.11. This main effect plot was generated to represent the results of the
regression analysis. It showed deviations of the average between the high and low levels
of each factor. When the effect of a factor to the response is positive, the response
increases from low level to high level of that factor. Conversely, when the factor gives
negative effect, the response will decrease from a high level to low level.
From Figure 4.11, the steeper the response line, the larger is the change in
response value (y) when changing from coded level -1 to level +1. The statistical
significance of a factor is directly related to the length of the line (Palanikumar and
Dawim, 2009). The initial pH and temperature both showed negative effects on
hydrogen production. However, temperature factor exerted larger effect which was
evident by longer line and steeper slope compared to that of initial pH. Inoculum size on
the other hand, showed a positive effect on hydrogen production.
6.55.54.5
7.5
7.0
6.5
6.0
5.5
554535
20112
7.5
7.0
6.5
6.0
5.5
pH
Me
an
Temperature
Inoculum
Corner
Center
Point Type
Figure 4.11: Main effects plot for hydrogen production for Production 1

97
Figure 4.12 represents the effectiveness of interaction between factors. The
change in response from low to high levels of those factors depends on the level of a
second factor, that is whether or not the lines run parallel to each other (Mathialagan
and Viraraghavan, 2005). It should be pointed out that this interaction effects plot was
also generated from ANOVA analysis and from the result in Table 4.5, only initial pH-
temperature interaction (AB) has significant effect on cumulative hydrogen gas
production. This is obvious from the crossing of the response line for both initial pH
and temperature. The interactions of initial pH-inoculum size and temperature-inoculum
were insignificant as shown by the lines running parallel to each other.
Figure 4.12: Interaction plot for hydrogen produced in Production 1 (Food waste only)
554535 20112
7.5
6.5
5.5
7.5
6.5
5.5
pH
T emperature
Inoculum
4.5 Corner
5.5 Center
6.5 Corner
pH Point Type
4.5 Corner
5.5 Center
6.5 Corner
pH Point Type
35 Corner
45 Center
55 Corner
Temperature Point Type

98
The standardized residual plots for hydrogen gas production in Production 1 is
shown in Figure 4.13. The normal probability plot showed that normality assumption
was satisfied for the experimental data. Most of the data points on the plot fell closely to
the normal line (Velickovic et al, 2013).
210-1-2
99
90
50
10
1
Standardized Residual
Pe
rce
nt
98765
2
1
0
-1
-2
Fitted Value
Sta
nd
ard
ize
d R
esid
ua
l
210-1-2
6.0
4.5
3.0
1.5
0.0
Standardized Residual
Fre
qu
en
cy
2624222018161412108642
2
1
0
-1
-2
Observation Order
Sta
nd
ard
ize
d R
esid
ua
l
Normal Probability Plot Versus Fits
Histogram Versus Order
Figure 4.13: Residual plots for hydrogen production in Production 1

99
Normal probability plots determine whether or not the results obtained are
reliable or just by chance. The points that are close to a line fitted to the middle group of
points represents factors that do not have significant effect on the response (Bingol et
al, 2010). In Figure 4.14, only the main factors temperature (B) and inoculum size (C)
were significant, so did interaction of initial pH and temperature (AB) (all marked with
red squares). The inoculum size (C) and initial pH-temperature (AB) lies on the right
side of the line means that they have positive effect on the response. The main factor
temperature (B) lies on the left side showing its negative effect upon the response that is
cumulative hydrogen ga production. The effects in decreasing manner is B > AB > C;
decided by looking at the distance of the points from the line.
43210-1-2-3-4-5
99
95
90
80
70
60
50
40
30
20
10
5
1
Standardized Effect
Pe
rce
nt
A pH
B Temperature
C Inoculum
Factor Name
Not Significant
Significant
Effect Type
AB
C
B
Figure 4.14: Normal plot of the standardized effects for Production 1

100
Contour plots are generated to better understand both the main and interaction
effects of the factors in an experiment. Contour plots have curved lines since this model
showed the interactions between the factors (AB, AC and BC), when one of the
parameters for each graph is at a constant value.
In Figure 4.15, the curvature showed the significance of the temperature and
initial pH interaction. This is supported by the result of ANOVA in Table 4.5, where AB
interaction has p value of 0.003. The arrow shows the trajectory of optimization, and in
this case it is towards lower initial pH and lower temperature.
pH
Te
mp
era
ture
6.56.05.55.04.5
55
50
45
40
35
Inoculum 2
Hold Values
>
–
–
< 5
5 6
6 7
7
(FW)
produced
H
Figure 4.15: Contour plot of hydrogen production versus temperature and initial pH
from food waste (Production 1)

101
Figure 4.16 showed the result of AB interaction in three dimensions. The highest
point of maximum response is at low levels of initial pH and temperature.
56
485
6
7
40
8
4.85.4
6.06.6
H produced (FW)
T emperature
pH
Inoculum 2
Hold Values
Figure 4.16: 3D surface plot of hydrogen production versus temperature (B) and initial
pH (A) from food waste (Production 1)
It can be concluded from Figure 4.17 and 4.18 that there were no significant
interaction between the other two factors i.e. time AC and BC, judging from the almost
linear contour. This was also verified from Table 4.5, where the interaction effects
showed P > 0.05.

102
pH
Ino
cu
lum
6.56.05.55.04.5
20
15
10
5
Temperature 35
Hold Values
>
–
–
–
–
< 6.5
6.5 7.0
7.0 7.5
7.5 8.0
8.0 8.5
8.5
(FW)
produced
H
Figure 4.17: Contour plot of hydrogen production versus inoculums size and initial pH
from food waste (Production 1).
Temperature
Ino
cu
lum
5550454035
20
15
10
5
pH 4.5
Hold Values
>
–
–
–
< 5
5 6
6 7
7 8
8
(FW)
produced
H
Figure 4.18: Contour plot of hydrogen production versus inoculum size and
temperature from food waste (Production 1).

103
Figure 4.19 is a cube plot that enables us to see the predicted responses based on
a three way interactions of the factors A, B and C. For Production 1, highest response
would be at lowest initial pH (A), lowest temperature (B) and highest inoculum size (C).
From the response optimizer function in Minitab, the maximum predicted
hydrogen production (MPHP) of 9.74 ml can be obtained with these parameters set;
initial pH of 4.5, inoculum size of 20% and temperature of 35°C. This parameters set
obtained was also in agreement with the finding presented in cube plot (Figure 4.18).
The composite desirability obtained from Minitab software was 0.9338 which indicates
that it is possible to obtain predicted results in 93 times out of 100 runs.
20
2
55
356.54.5
Inoculum
Temperature
pH
7.64993
6.71508
7.096918.51862
5.42037
5.40964
6.252637.98722
4.31833
Centerpoint
Factorial Point
Figure 4.19: Cube plot for hydrogen production from food waste (Production 1)

104
4.4.2 Analysis of Result for Cumulative Hydrogen Production for Food Waste
mixed with POME as substrate (Production 2)
Table 4.5: Estimated effects and coefficients for hydrogen production of substrate food
waste mixed with POME, Production 2 (Coded units)
Term Effect Coef SE Coef T P
Constant 7.951 0.1891 42.04 0.000
pH -2.505 -1.253 0.2006 -6.24 0.000
Temperature -1.369 -0.684 0.2006 -3.41 0.003
Inoculum 0.925 0.462 0.2006 2.30 0.033
pH*Temperature -0.278 -0.139 0.2006 -0.69 0.497
pH*Inoculum 0.837 0.419 0.2006 2.09 0.051
Temperature*Inoculum -0.787 -0.394 0.2006 -1.96 0.064
pH*Temperature*Inoculum -2.832 -1.416 0.2006 -7.06 0.000
S = 0.9826 PRESS = 27.0035
R2 = 85.76%
Table 4.6: Analysis of variance for hydrogen produced from food waste mixed with
POME, Production 2 (Coded units)
Source DF Seq SS Adj SS Adj MS F P
Main Effects 3 54.022 54.0220 18.0073 18.65 0.000
pH 1 37.651 37.6514 37.6514 38.99 0.000
Temperature 1 11.240 11.2401 11.2401 11.64 0.003
Inoculum 1 5.131 5.1305 5.1305 5.31 0.033
2-Way Interactions 3 8.391 8.3905 2.7968 2.90 0.062
pH*Temperature 1 0.463 0.4628 0.4628 0.48 0.497
pH*Inoculum 1 4.207 4.2074 4.2074 4.36 0.051
Temperature*Inoculum 1 3.720 3.7204 3.7204 3.85 0.064
3-Way Interactions 1 48.108 48.1077 48.1077 49.82 0.000
pH*Temperature*Inoculum 1 48.108 48.1077 48.1077 49.82 0.000
Residual Error 19 18.348 18.3481 0.9657
Curvature 1 12.384 12.3842 12.3842 37.38 0.000
Pure Error 18 5.964 5.9639 0.3313
Total 26 128.868

105
The multiple regression analysis using Minitab 16.1 software showed the
importance of main effects and interaction effects of 3 variables based on the responses
of maximum predicted cumulative hydrogen gas production from mixed substrate
(Production 2). Table 4.5 showed the important effects of the variables on the
cumulative hydrogen gas production.
The coefficient of multiple determinations, R2
is 0.8576. This means that the
model could explain 85.76% of the total variation in the system. PRESS and R2 are
essentially redundant. However the predicted R2 can be compared directly to the regular
R2 for the model, to judge whether the latter accurately reflects the predictive value of
the model or is inflated by over-fitting (Bradley,2007).
Based on Table 4.6, all three factors; initial pH, temperature and inoculum size
volume/volume (mL), showed significant effect to the cumulative hydrogen gas
production, where P ˂ 0.05. However, the interaction effects between the factors did not
show any significance. The three way interaction (ABC) somehow did show
significance at P = 0.000.
The predicted value of response was obtained from full quadratic model fitting
technique which includes the main effects and interaction effects. The regression
equation generated by Minitab software is given in Equation 4.2:
Y= 7.951 – 1.253A – 0.684B + 0.462C - 0.139AB + 0.419AC - 0.394BC
–1.416ABC (Equation 4.2)
Where Y (yield) is the cumulative hydrogen in ml; A is initial pH, B is temperature (°C)
and C is inoculum size (% v/v). The ANOVA analysis for Equation 4.2 is shown in
Table 4.6.

106
The function in Equation (4.3) explained the effects of the variables and their
interactions on the response. From the equation, initial pH (A) showed the greatest
effect on hydrogen production, followed by inoculum size (C) temperature (B) and then
the initial pH – inoculum size interaction. The main effects A, B and interaction effects
AB and BC have negative values which hence will decrease the cumulative hydrogen
gas production. The main effect C and interaction effect AC have positive values
indicating that these interactions positively affect the response.
Figure 4.20 showed the effects of each variable on cumulative hydrogen gas
production. Only the inoculum size (C) has positive effect on the response, while the
initial pH (A) and temperature (B) has negative effect. The initial pH (A) has the biggest
effect on the response looking at its long vertical line and steeper slope (Palanikumar
and Dawim, 2009).
6.55.54.5
10
9
8
7
6
554535
20112
10
9
8
7
6
pH
Me
an
Temperature
Inoculum
Corner
Center
Point Type
Figure 4.20: Main effects plot of hydrogen production from food waste mixed with
POME as substrate (Production 2).

107
The effectiveness of factor-factor interactions are represented in Figure 4.21.
This interaction effects plot was generated from ANOVA analysis as in Table 4.7.
Based on that table, none of the interactions showed significant effect at ɑ = 0.05.
Hence the resulting plots all having two lines running parallel to each other.
554535 20112
10.0
7.5
5.010.0
7.5
5.0
pH
T emperature
Inoculum
4.5 Corner
5.5 Center
6.5 Corner
pH Point Type
pH Point Type
35 Corner
45 Center
55 Corner
Temperature Point Type
Figure 4.21: Interaction plot for hydrogen produced in Production 2

108
Figure 4.22 is the standardized residual plots for cumulative hydrogen
production in Production 2. A normal distribution was suggested by experimental points
being reasonably aligned. Most of the data points in the normal probability plot of the
standardized residual all falls fairly close to the middle line (Gottipati and Mishra,
2010).
210-1-2
99
90
50
10
1
Standardized Residual
Pe
rce
nt
10864
2
1
0
-1
-2
Fitted ValueS
tan
da
rd
ize
d R
esid
ua
l
210-1
8
6
4
2
0
Standardized Residual
Fre
qu
en
cy
2624222018161412108642
2
1
0
-1
-2
Observation Order
Sta
nd
ard
ize
d R
esid
ua
l
Normal Probability Plot Versus Fits
Histogram Versus Order
Figure 4.22: Residual plots for hydrogen production in Production 2

109
The normal plot of standardized effect compares the observed values of the
variable to the observations expected for a normally distributed variable. Each value
obtained is paired with its theoretical normal distribution forming a linear pattern. If the
sample is from a normal distribution, then the observed value or scores fall more or less
in a straight line; the blue line as in Figure 4.23.
In Figure 4.23, all the main factors A, B and C and also the 3 way interactions of
ABC showed significance. Only the factor inoculum size, C, lies on the right side of the
line. This means that it showed positive effect on the cumulative hydrogen gas
production. The rest of the significance points lie on the left side of the line, indicating
their negative effect on the response. The strength of influence of the factors are in
ascending manner; C > B > A > ABC. This was concluded from the distance of the
points from the line.
210-1-2-3-4-5-6-7
99
95
90
80
70
60
50
40
30
20
10
5
1
Standardized Effect
Pe
rce
nt
A pH
B Temperature
C Inoculum
Factor Name
Not Significant
Significant
Effect Type
ABC
C
B
A
Figure 4.23: Normal plot of the standardized effects for Production 2

110
In Figure 4.24, 4.25 and 4.26, all these contour plots have circular contour that
explains the insignificance of the interactions of AB, BC and AC. The arrows show the
trajectory of optimization. In Figure 4.24, the optimization moved towards higher
inoculum size and lower initial pH, when temperature was kept constant at 35°C.
pH
Te
mp
era
ture
6.56.05.55.04.5
55
50
45
40
35
Inoculum 2
Hold Values
>
–
–
–
–
< 5
5 7
7 8
8 9
9 10
10
FW+P
production
H
Figure 4.24: Contour plot of hydrogen production from food waste and POME
(Production 2) versus temperature and initial pH
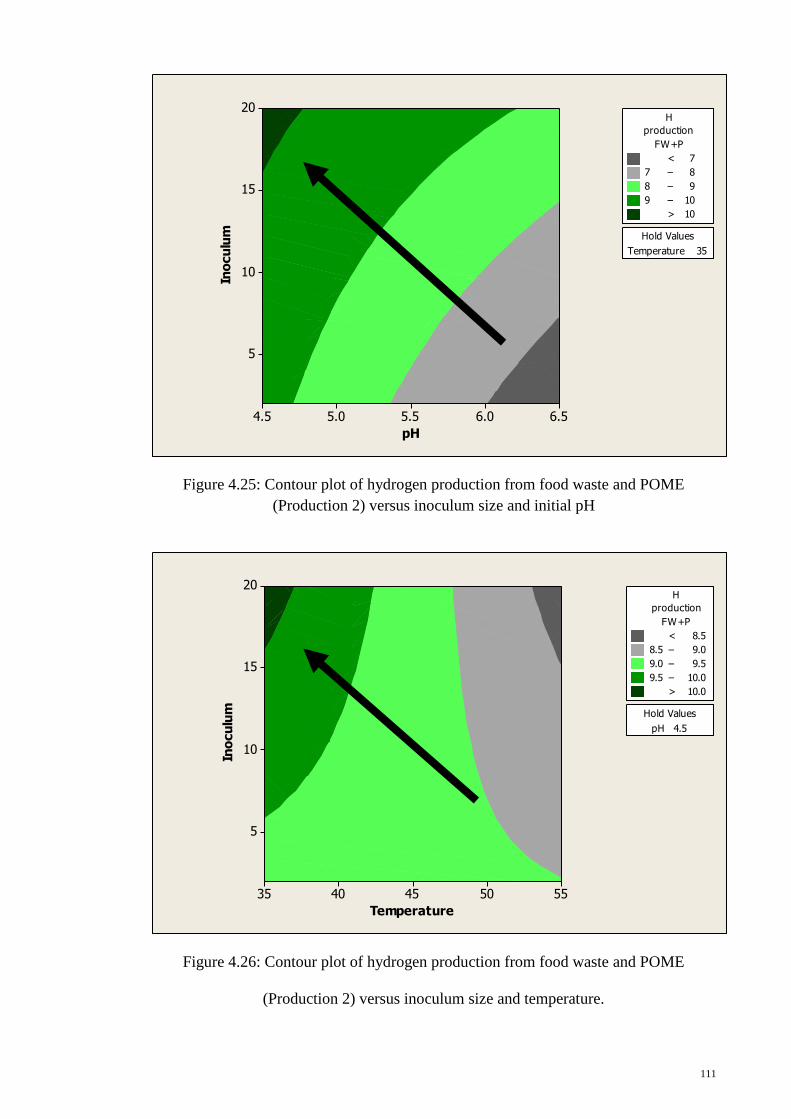
111
pH
Ino
cu
lum
6.56.05.55.04.5
20
15
10
5
Temperature 35
Hold Values
>
–
–
–
< 7
7 8
8 9
9 10
10
FW+P
production
H
Figure 4.25: Contour plot of hydrogen production from food waste and POME
(Production 2) versus inoculum size and initial pH
Temperature
Ino
cu
lum
5550454035
20
15
10
5
pH 4.5
Hold Values
>
–
–
–
< 8.5
8.5 9.0
9.0 9.5
9.5 10.0
10.0
FW+P
production
H
Figure 4.26: Contour plot of hydrogen production from food waste and POME
(Production 2) versus inoculum size and temperature.
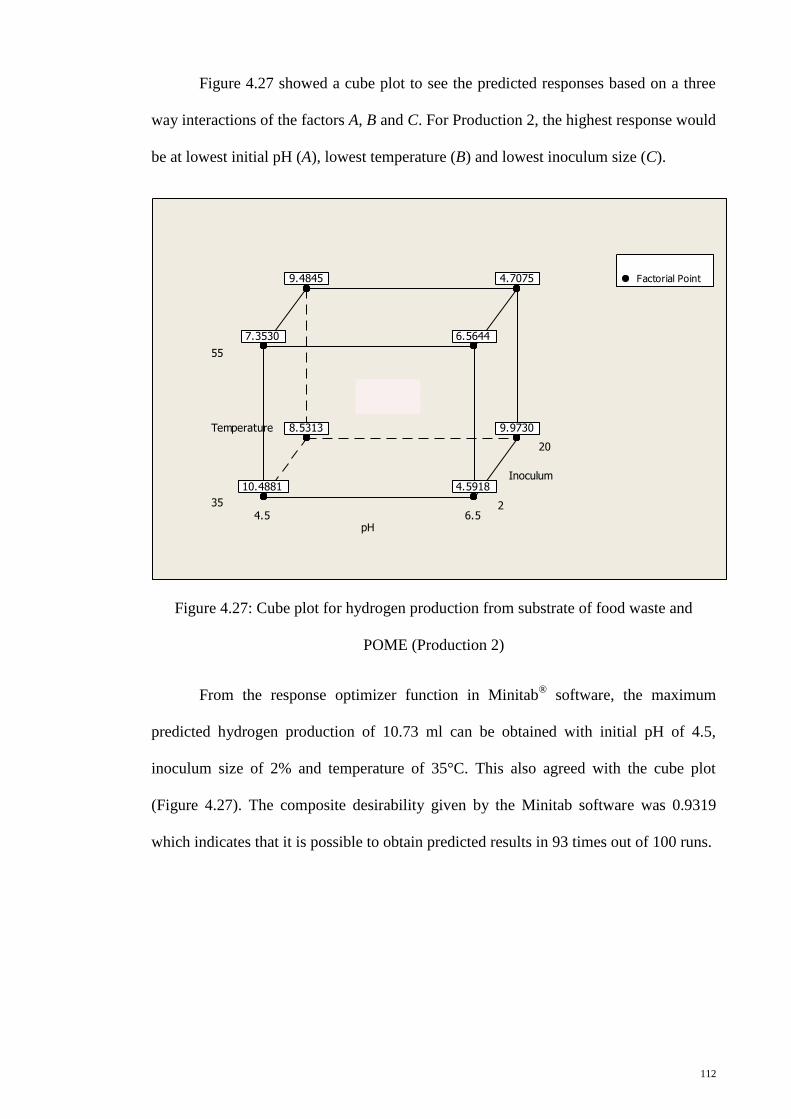
112
Figure 4.27 showed a cube plot to see the predicted responses based on a three
way interactions of the factors A, B and C. For Production 2, the highest response would
be at lowest initial pH (A), lowest temperature (B) and lowest inoculum size (C).
20
2
55
356.54.5
Inoculum
Temperature
pH
9.8667
4.7075
9.97308.5313
9.4845
6.5644
4.591810.4881
7.3530
Centerpoint
Factorial Point
Figure 4.27: Cube plot for hydrogen production from substrate of food waste and
POME (Production 2)
From the response optimizer function in Minitab® software, the maximum
predicted hydrogen production of 10.73 ml can be obtained with initial pH of 4.5,
inoculum size of 2% and temperature of 35°C. This also agreed with the cube plot
(Figure 4.27). The composite desirability given by the Minitab software was 0.9319
which indicates that it is possible to obtain predicted results in 93 times out of 100 runs.

113
4.5 Verification Experiment at Optimized Condition
Figure 4.28 and 4.29 are overlaid contour plots for both cumulative hydrogen
gas and COD removal. The white regions indicate the possible region for simultaneous
optimization of the responses. In Figure 4.28, at temperature range 35 to 38°C and
initial pH range 4.5 to 4.8, more than 8 ml of hydrogen can be produced with more than
65% COD removal for Production 1 when the inoculum size is hold at 20%. The
possible region for simultaneous optimization of initial pH and inoculum size for
Production 2 is shown in white area in Figure 4.29. When temperature is hold at 35°C
with inoculum range 10 - 20% and pH range 4.5 - 6.5, more than 8.3 ml of hydrogen
and 78% COD can be removed.
pH
Te
mp
era
ture
6.56.05.55.04.5
55
50
45
40
35
Inoculum 20
Hold Values
8
9
(FW)
H produced
65
88
for FW
removal
% COD
Figure 4.28: Overlaid contour plot for cumulative hydrogen production (ml) and COD
removal (%) versus pH and temperature for Production 1.

114
pH
Ino
cu
lum
6.56.05.55.04.5
20
15
10
5
Temperature 35
Hold Values
8.3
11.3
FW+P
H production
78
98
for FW+P
removal
% COD
Figure 4.29: Overlaid contour plot for cumulative hydrogen production (ml) and COD
removal (%) versus pH and inoculum for Production 2
Table 4.7 summarizes the expected cumulative hydrogen production as obtained
from the response optimizer on Minitab® software and also the actual result obtained
from verification experiment. At given optimum set of parameters, both Production 1
and 2 produced cumulative hydrogen slightly higher than expected value. The COD
removal for both Production 1 and 2 however were lower than expected. It is possible
that the increase in the value of one response may be achieved at the expense of the
other response i.e. in this case hydrogen production and COD removal, respectively.
Table 4.7: Summary of results for verification experiment
Optimum set of parameters Expected Observed
Productions Initial
pH
Temperature
(°C)
Inoculum
size
(% vol/vol)
Cumulative
Hydrogen
production
COD
removal
Cumulative
Hydrogen
production
COD
removal
Production 1
(food waste)
4.5 35 20 0.22 ml H2/
ml
substrate
68.79% 0.28 ml H2/
ml
substrate
41.73%
Production 2
(food waste
with POME)
4.5 35 2 0.26 ml H2/
ml
substrate
81.62% 0.33 ml H2/
ml
substrate
75.59%

115
The food waste mixed with POME (Production 2) produced more hydrogen than
food waste as the only substrate since POME itself contain a number of hydrogen
producing microbes. Ismail et al (2009) has demonstrated how POME can be used as
inoculum. Hence the addition of POME to microbe-rich sewage sludge will only
enhance the hydrogen producing capability. Lay et al (2000) studied the feasibility of
hydrogen production under mesophilic condition using mixed anaerobic bacteria. At
high F/M ratio (0.4 g solid waste/ g biomass) the pre-treated digested sludge had SHPR
of 43 ml hydrogen/ g VSS/ hour.
Hydrogen gas production occurs at acidogenic stage of anaerobic metabolism
hence a slightly acidic pH is considered optimal (Vasquez and Varaldo, 2009).
Normally the optimum pH for hydrogen production in dark fermentation process is
within the range of 5.0 to 7.0, with the common optimum pH at 5.5 as shown in the
study by Muralidhar et al (2001) and Van Ginkel et al (2001). In this study, pH 4.5 was
the most suitable pH for the simultaneous production of hydrogen and COD reduction.
A study by Fang et al (2006) showed that at low pH of 4.5, hydrogen production
process is most effective.
In another study by Khanal et al (2004), the optimal initial pH was also found to
be pH 4.5. At higher initial pH, rapid hydrogen production occurs alongside acid up to
an inhibitory level which simultaneously depletes the buffering capacity. Bacteria could
not adapt to this sudden change in environment and died. At lower initial pH, a longer
lag period is exhibited for adaptation with the hydrogen gas produced at a moderate
level. Ginkel et al (2001) explained that when the concentration of acid is high at high
initial pH, the ionic strength of the solution will increase resulting in hydrogen
production to switch to solvent production. The pattern of intermediate VFAs is
different under variable pH conditions. The main products are butyrate and acetate and

116
hydrogen-producing butyrate-acetate pathway is favoured at pH 4.5 to 6.0 (Pakarinen et
al, 2008).
Temperature has great influence on the activity of hydrogen producing bacteria.
Different studies showed different optimum temperature but fermentative hydrogen
production most commonly fell into the mesophilic range; around 37°C (Fang et al,
2007) which agreed well with the temperature obtained in the study. In the case of food
waste, mesophilic temperatures seems to be more suitable for hydrogen production
though there have been conflicting findings in literature. This may be due to the
different type of inoculum and pretreatment method used and also the complex nature
of food waste composition. Studies done by Li et al (2008) and Kim et al (2004) using
batch system at 35°C, reported production of 196 ml hydrogen/ g VSS and 60 ml
hydrogen/ g VSS, respectively.
The quantity of readily-degradable compounds and the operating conditions too
can influence hydrogen production activity too. Okamoto et al (2000) reported results
for hydrogen production in a batch reactor at 35°C using substrates from food wastes;
rice, cabbage and meat. Highest hydrogen yield was obtained with rice (96 ml
hydrogen/ g VSS) and lowest with meat (8 ml hydrogen/ g VSS). Since rice is more
readily degradable compared to cabbage and complex protein like meat, it produced
more hydrogen. The consumption of hydrogen gas to form ammonium using nitrogen
from biodegradation of protein rich solid waste could also explain the low hydrogen gas
yield when meat was used as a substrate (Lay et al, 2003).

117
5.0 CONCLUSIONS
The use of mixed culture for fermentative hydrogen production is more practical
than a pure culture as this method of hydrogen gas production is simpler to operate and
control. It also has more variety for source of substrate to be utilized. Heat pre-treatment
method applied has successfully suppressed hydrogen consuming methanogens based
on the absence of methane gas in GC analysis.
The operating conditions are indeed important to be considered when designing
a system. In this study, temperature, inoculum size and initial pH definitely affected the
microbial hydrogen production.
An anaerobic and facultative anaerobic system did not show much difference in
terms of hydrogen yield. The possibility of using facultative anaerobes for hydrogen
production will eliminate the need for gas sparging which in turn will reduce production
cost.
Response Surface Methodology (RSM) applied in this study has proven to be
effective in optimizing the system for microbial hydrogen production. It is feasible to
use food waste with or without further supplementation by POME as a substrate for
microbial hydrogen gas production. The system not only produces hydrogen as new
source of energy but also reduce the COD of the waste.
For future works, the optimized conditions can be scaled-up and replicated. A
batch system 3 litre stirred tank reactor should be sufficient as a first step to test the
optimized conditions at a larger scale. However, attention should be given to the ratio of
upscaling. The production of volatile fatty acids should also be studied since it can
affect the microbial hydrogen production.

118
In the long run, the development of bacterial strains that produces mainly acetic
and butyric acid with no lactic acids, propionic acids and alcohol through means of
genetic engineering can further improve microbial hydrogen production. A combined
photosynthetic and anaerobic bacterial system can also be applied to produce higher
yield of microbial hydrogen since the photosynthetic bacteria can convert the by-
products of anaerobic bacteria into hydrogen. Theoretically the system‟s microbial
hydrogen production will increase four-fold, from 6 mol to 24 mol of hydrogen.

119
REFERENCES
APHA (1992). Standard Methods for the Examination of Water and Wastewater (18th
ed.). Washington, DC: American Public Health Association.
Bradley, N. (2007). The response surface methodology (Master‟s thesis). Retrieved
from https://www-test.iusb.edu/
Chen, W., Chen, S., Khanal, S. K., & Sung, S. (2006). Kinetic study of biological
hydrogen production by anaerobic fermentation. International Journal of Hydrogen
Energy, 31, 2170-2178.
Chittibabu, G., Nath, K., & Das, D. (2006). Feasibility studies on the fermentative
hydrogen production by recombinant Escherichia coli BL-21. Process
Biochemistry, 41, 682-688.
Chong, M., Sabaratnam, V., Shirai, Y., & Hassan, M. A. (2009). Biohydrogen
production from biomass and industrial wastes by dark fermentation. International
Journal of Hydrogen Energy, 34, 3277-3287.
Chu, C., Ebie, Y., Xu, K. Q., Li, Y., & Inamori, Y. (2010). Characterization of
microbial community in the two-stage process for hydrogen and methane
production from food waste. International Journal of Hydrogen Energy, 35, 8253-
8261.
Chu, C., Li, Y., Xu, K. Q., Ebie, Y., Inamori, Y., & Kong, H. N. (2008). A pH and
temperature phased two-stage process for hydrogen and methane production from
food waste. International Journal of Hydrogen Energy, 33, 4739-4746.

120
Clark, I., C., Zhang, R., H., & Upadhyaya, S. K. (2012). The effect of low pressure and
mixing on biological hydrogen production via anaerobic fermentation.
International Journal of Hydrogen Energy, 37, 11504-11513.
Dagoumas, A. S., Papagiannis, G. K., & Dokopoulos, P. S. (2006). An economic
assessment of the Kyoto Protocol application. Energy Policy, 34(1), 26-39.
Doelle, H. W. (1994). Microbial process development. Singapore: World Scientific
Publishing.
Elbeshbishy, E., Hafez, H., Dhar, B. R., & Nakhla, G. (2011). Single and combined
effect of various pretreatment methods for biohydrogen production from food waste.
International Journal of Hydrogen Energy, 1-9.
Fang, H. H. P., Li, C. L., & Zhang, T. (2006). Acidophilic biohydrogen production from
rice slurry. International Journal of Hydrogen Energy, 31, 683-692.
Fang, H. H. P., & Li, C. L. (2007). Fermentative hydrogen production from wastewater
and solid wastes by mixed cultures. Environmental Science Technology, 37, 1-39.
Ginkel, S. V., Sung, S. W., & Lay, J. J. (2001). Biohydrogen production as a function of
pH and substrate concentration. Journal of Environmental Science and Technology,
35, 4726-4730.
Guo, X. M., Trably, E., Latrille, E., Carrere H., & Steyer, J. (2010). Hydrogen
production from agricultural waste by dark fermentation: a review. International
Journal of Hydrogen Energy, 35, 10660-10673.
Han, S., & Shin, H. (2004). Biohydrogen production by anaerobic fermentation of food
waste. International Journal of Hydrogen Energy, 29, 569-577.

121
Hughes, S., Qureshi, N., Maddox, I. S., Cotta, M. A. (2005). Energy-efficient recovery
of butanol from model solutions and fermentation broth by adsorption. Bioprocess
and Biosystem Engineering, 27 (4), 215-222.
Ibrahim, M. F., Abd-Aziz, S., Abdul Razak, M.N., Phang, L.Y., and Hassan, M.A.
(2012). Oil empty fruit bunch as alternative substrate for acetone-butanol-ethanol
production by Clostridium butyricum EB6. Applied Biochemical and Biotechnology,
166, 1615-1625.
Ismail, F., Abdul Rahman, N., Abd Aziz, S., Ling, C. M., & Hassan, M. A. (2009).
Statistical optimization of biohydrogen production using food waste under
thermophilic conditions The Open Renewable Energy Journal, 2, 124-131.
Jo, J. H., Lee, D. S., Park, D., & Park, J. M. (2008). Biological hydrogen production by
immobilized cells of Clostridium tyrobutyricum JM1 isolated from a food waste
treatment process. Bioresource Technology, 99, 6666-6672.
Kapdan, I. K., & Kargi, F. (2006). Bio-hydrogen production from waste materials.
Enzyme and Microbial Technology, 38, 569-582.
Kawagoshi, Y., Hino, N., Fujimoto, A., Nakao, M., Fujita, Y., & Sugimura, S. (2005).
Effect of inoculum conditioning on hydrogen fermentation and pH effect on
bacterial community relevant to hydrogen production. Journal of Biosciences and
Bioengineering, 100, 524-530.
Khanal, S. K., Chen, W., Li, L., & Sung, S. (2004). Biological hydrogen production:
effects of pH and intermediate products. International Journal of Hydrogen Energy,
29, 1123-1131.

122
Kim, S., Han, S., & Shin, H. (2004). Feasibility of biohydrogen production by anaerobic
co-digestion of food waste and sewage sludge. International Journal of Hydrogen
Energy, 29, 1607-1616.
Kim, D., Wu, J., Jeong, K., Kim, M., & Shin, H. (2011). Natural inducement of
hydrogen from food waste by temperature control. International Journal of
Hydrogen Energy, 36, 10666-10673.
Kumar, N., & Das, D. (2000). Enhancement of hydrogen production by Enterobacter
cloacae IIT-BT 08. Process Biochemistry, 35, 589-593.
Lay, J., Li, Y., & Noike, T. (1998). Mathematical model for methane production from
landfill bioreactor. Journal of environmental Engineering, 730-736.
Lee, Y., & Chung, J. (2010). Bioproduction of hydrogen from food waste by pilot-scale
combined hydrogen/methane fermentation. International Journal of Hydrogen
Energy, 35, 11746-11755.
Levin, D. B., Islam, R., Cicek, N., & Sparling, R. (2006). Hydrogen production by
Clostridium thermocellum 27405 for cellulosic biomass substrates. International
Journal of Hydrogen Energy, 31, 1496-1503.
Liu, D., Min, B., & Angelidaki, I. (2008). Biohydrogen production from household
solid waste (HSW) at extreme-thermophilic temperature (70°C) – influence of pH
and acetate concentration. International Journal of Hydrogen Energy, 33, 6985-
6992.
Luo, G., Zou, Z., Zhou, Q., & Wang, J. (2010). Fermentative hydrogen production from
cassava stillage by mixed anaerobic microflora: Effects of temperature and pH.
Applied energy, 87, 3710-3717.

123
Manni G., & Caron F. (1995). Calibration and determination of volatile fatty acids in
waste leachates by gas chromatography. Journal of Chromatography A, 690, 237.
Ming, L., Youcai, Z., Qiang, G., Xiaoqing, Q., & Dongjie, N. (2008). Bio-hydrogen
production from food waste and sewage sludge in the presence of aged refuse
excavated from refuse landfill. Renewable Energy, 33, 2573-2579.
Mohammadi, P., Shaliza Ibrahim, Mohamad Suffian Mohamad Annuar, & Law, S.
(2011). Effects of different pretreatment methods on anaerobic mixed microflora for
hydrogen production and COD reduction from palm oil mill effluent. Journal of
Cleaner Production, 19, 1654-1658.
Moreno-Davila, I. M. M., Rios-Gonzalez, L. J., Garza-Gracia, Y., Garza, J. A. R., &
Rodriguez-Martinez, J. (2011). Biohydrogen production from dairy processing
wastewater by anaerobic biofilm reactors. African Journal of Biotechnology, 10(27),
5320-5326.
Muralidhar, R. V., Chirumamila, R. R., Marchant, R., & Nigam, P. (2001). A response
surface approach for the comparison of lipase production by Candida cylindracea
using two different carbon sources. Biochemical Engineering Journal, 9, 17-23.
Nath, K., Kumar, A., & Das, D. (2005). Hydrogen production by Rhodobacter
sphaeroides strain O.U.001 using spent media of Enterobacter cloacae strain
DM11. Applied Microbial and Cell Physiology, 68, 533-541.
Nath, K., & Das, D. (2011). Modelling and optimization of fermentative hydrogen
production. Bioresource Technology, 102, 8569-8581.
Okamoto, M., Noike, T., Miyahara, T., & Mizuno, O. (2000). Biological hydrogen
potential of materials characteristics of the organic fraction of municipal solid
wastes. Water Sciencs and Technology, 41, 25-32.

124
Pakarinen, O., Lehtomaki, A., & Rintala, J. (2008). Batch dark fermentative hydrogen
production from grass silage: the effect of inoculum, pH, temperature and VS ratio.
International Journal of Hydrogen Energy, 33(2), 594-601.
Pan, J., Zhang, R., El-Mashad, H. M., Sun, H., & Ying, Y. (2008). Effect of food to
microorganism ratio on biohydrogen production from food waste via anaerobic
fermentation. International Journal of Hydrogen Energy, 33, 6968-6975.
Pandu, K., & Joseph, S. (2012). Comparisons and limitations of biohydrogen
production processes: a review. International Journal of Advances in Engineering
& Technology, 2, 342-356.
Porporato, P. E., Dhup, S., Dadhich, R. K., Copetti, T., Sonveaux, P. (2011). Anticancer
targets in the glycolytic metabolism of tumors: a comprehensive review. Frontiers
in Pharmacology. Retrieved from
http://journal.frontiersin.org/Journal/10.3389/fphar.2011.00049/full
Shin, H., Youn, J., & Kim, S. (2004). Hydrogen production from food waste in
anaerobic mesophilic and thermophilic acidogenesis. International Journal of
Hydrogen Energy, 29, 1355-1363.
Sinha, P., & Pandey, A. (2011). An evaluative report and challenges for fermentative
biohydrogen production. International Journal of Hydrogen Energy, 36, 7460-
7478.
Sen, D., & Das, D. (2005). Multiple parameter optimization for the maximazation of
hydrogen production by Enterobacter cloacae DM11. Journal of Scientific and
Industrial Research, 64, 984-990.

125
Siedlecka, E. M., Kumirska, J., Ossowski, T., Glamowski, P., Golebiowski, M., Gajdus,
J., Kaczynski, Z., & Stepnowski, P. (2008). Determination of volatile fatty acids in
environmental aqueous samples. Polish Journal of Environmental Studies, 17, 351-
356.
Song, C. (2003, Sep). Overview of hydrogen production options for hydrogen energy
development, fuel-cell fuel processing and mitigation of CO2 emissions. Paper
presented at the International Pittsburgh Coal Conference.
Sreela-or, C., Imai, T., Plangklang, P., & Reungsang, A. (2011). Optimization of key
factors affecting hydrogen production from food waste by anaerobic mixed
cultures. International Journal of Hydrogen Energy, 1-14.
Vasquez, I. V., & Varaldo, H. M. P. (2009). Hydrogen production by fermentative
consortia. Journal of Renewable and Sustainabale Energy, 13, 1000-1013.
Villanueva, A. (2007). Recycling, incineration or landfilling? A review of existing life
cycle assessments. Waste Management, 27, 29-46.
Wang, J., & Wan, W. (2008). Comparison of different pretreatment methods for
enriching hydrogen-producing bacteria from digested sludge. International Journal
of Hydrogen Energy, 33, 2934-2941.
Wang, J., & Wan, W. (2009). Factors influencing fermentative hydrogen production: a
review. International Journal of Hydrogen Energy, 34, 799-811.
Wang, J., & Wan, W. (2009). Experimental design methods for fermentative hydrogen
production: a review. International Journal of Hydrogen Energy, 34, 235-244.

126
Ward, A. J., Hobbs, P. J., Holliman, P. J., Jones, D. L. (2008). Optimisation of the
anaerobic digestion of agricultural resources. Bioresource Technology, 99 (17),
7928-7940.
World Energy Outlook. (2006). France: International Energy Agency.
Zadariana Jamil, Mohamad Suffian Mohamad Annuar, Shaliza Ibrahim, & Vikineswary
Sabaratnam. (2009). Optimizaton of phototrophic hydrogen production by
Rhodopseudomonas palustris PBUM001 via statistical experimental design.
International Journal of Hydrogen Energy, 34, 7502-7512.
Zheng, X., & Yu, H. (2005).Inhibitory effects of butyrate on biological hydrogen
production with mixed anaerobic cultures. Journal of Environmental Management,
74, 65-70.
Zhu, H., Parker, W., Basnar, R., Proracki, A., Falletta, P., Beland, M., & Seto, P.
(2009). Buffer requirements for enhanced hydrogen production in acidogenic
digestion of food wastes. Bioresource Technology, 100, 5097-5102.