optimization of the brake factor for an s-cam foundation
TRANSCRIPT

*Corr. Author’s Address: University of Ontario Institute of Technology, Department of Automotive, Mechanical and Manufacturing Engineering, L1H 7K4 Oshawa, ON, Canada, [email protected]
503
Strojniški vestnik - Journal of Mechanical Engineering 62(2016)9, 503-510 Received for review: 2016-01-28© 2016 Journal of Mechanical Engineering. All rights reserved. Received revised form: 2016-03-23DOI:10.5545/sv-jme.2016.3459 Original Scientific Paper Accepted for publication: 2016-04-25
0 INTRODUCTION
The brake system is usually considered to be a safety part of the vehicle system and plays important operational roles. Therefore, many countries have recently introduced regulations and operational requirements for brake systems [1] and [2]. Regulations define a controllable, stable, predictable, and repeatable brake system performance for every road, load, weather condition, or partial failure. All these expectations can be met if the brake performance remains stable during its operation.
The components of a brake subsystem, such as valves and actuators, are well-controlled, and they do not significantly contribute to the variations in performance. They mostly respond to driver inputs as prescribed in their specifications-outputs. However, the performance variation of foundation brake generally depends on previously unpredictable physical conditions, such as load, road, and weather conditions. In a brake system, these conditions can arise as heat and wet affect the entire brake system through variations in friction. Electronic subsystems may partially reduce such performance variations of brakes by preventing wheel locks or accommodating vertical load related force distribution by controlling line air pressure. However, such systems do not guarantee a fully stable brake operation. Therefore, in this study, the performance variation issue for
foundation brake is examined with regard to variation in the brake factor (BF).
The overall brake performance due to drum type foundation brake can be attributed to two criteria: 1) dimensional design parameters of foundation brake, and 2) friction between drum and lining [3]. The relation between both factors is formulized as brake factor (BF) [4]. Addressing issues related to BF variation is critical for quantifying performance variation in the overall vehicle brake system. Therefore, the foundation brake performance must be ensured before overall brake system performance is addressed [5] to [7].
In general, there are two types of air-actuated foundation brakes; disc and drum. For disc type, the BF exhibits a linear relation with friction coefficient however for drum type the BF generally grows exponentially [4]. Since disc BF does not involve any dimensional parameters, it will not be considered in analysis here.
In past decade, a tendency showed that the drum type foundation brakes were replaced by disc brakes however, recently, a skeptical approach exists for there has been increased scepticism towards using disc brakes in the heavy commercial vehicle market. Drum type brakes (S-cam, Wedge, etc.) are still greatly preferred by truck, bus, and axle manufacturers [8]. A common belief among vehicle makers is that the S-Cam type foundation brake has great potential if its
Optimization of the Brake Factor for an S-Cam Foundation Brake using RSM
Sayim, I. – Zhang, D.Irfan Sayim – Dan Zhang
University of Ontario, Institute of Technology, Department of Automotive, Mechanical and Manufacturing, Canada
The brake factor (BF) scales the vehicle’s braking force; therefore, the vehicle brake performance variation due to the foundation brake can be attributed to the BF variation. In this work, the BF reduction is considered in the design stage of an S-Cam foundation brake within dimensional properties in order to have stable, predictable and improved vehicle brake performance. First, brake lining wear types were defined and then actuation cam-roller position effects were formulated. Dimensional parameters were varied within certain design-possible ranges to quantify BF variation theoretically. The response surface method (RSM) was used to identify the BF-reduced combination of dimensions within theoretical results. In the meantime, a new testing procedure was introduced and then a new testbed was designed and built to validate relative improvement of BF experimentally without thermal effects on friction. It was investigated that a substantial improvement (22.93 %) on BF could be obtained if appropriate dimensions were selected in the design stage.Keywords: brake factor, lining wear, S-Cam foundation brake, response surface method
Highlights• Brake factor (BF) optimization was carried out to improve the brake performance.• A cost–effective testbed was built to measure BF in a temperature-free manner.• Cam-roller position effects and lining wear types were formulated in detail.• Response surface method (RSM) was used in the resizing process of dimensional design quantities.

Strojniški vestnik - Journal of Mechanical Engineering 62(2016)9, 503-510
504 Sayim, I. – Zhang, D.
performance is improved as a result of its reduced BF. Lessons learned from the experience that brake caused vehicle pull and vibration can also be attributed to high BF variation that usually occurs in drum-type foundation brakes [9]. In contrast, such problems are relatively small for disk type foundation brakes as a result of their low BF. In this context, the main competitor for disc brakes among drum types is the S-Cam brake in terms of BF quantity. Therefore, improving S-Cam foundation brakes, with comparable improved performance to disc brakes, may become an advantage for extensively using it on the market in the future.
In this study, the BF was optimized in the design level for an S-Cam foundation brake with the best combination of dimensional parameters. The response surface method (RSM) was used to identify the best selection option of dimensions within given ranges. Afterward, two samples were tested to validate the relative improvement. One sample was tested with nominal dimensions as assembled on the vehicles on the market. Another new sample was built based on the modified dimensions after RSM analysis. In the meantime, a new testbed was built to perform experimental measurements of BF without any thermal effects on friction. Whether a substantial reduction on BF could be obtained if appropriate dimensions were selected in the design stage was investigated.
1 S-CAM FOUNDATION BRAKE
An S-Cam foundation brake consists of a leading and a trailing shoe (Fig. 1). Both shoes are pivoted to on a foundation that is fixed on the vehicle’s axle. Shoes rotate around their pivots at one end while they are
mechanically actuated by an S-profiled cam, called S-Cam, at another end. The rotation of S-Cam for actuation is executed by a slack adjuster that is pushed by an air actuator from its tip.
Compressed air in the brake chamber generates a mechanical force that is transmitted to the brake shoes through the shoe roller and the S-Cam. The travel of the roller increases due to the wear of the brake linings and also due to the heat-related expansion of the brake drum as a consequence of braking operation [11] and [12]. Automatic slack adjusters, usually clearance-sensing, are used to compensate for this increase in roller travel because the force output from the brake chamber to the brake shoes decreases rapidly when the chamber stroke exceeds a certain limit. The mechanical subsystem of the schematic S-Cam air foundation brake system is illustrated in Fig 1. Depending on the rotation direction of the drum and shoes, the left side (CL) is a leading (i.e. drum and shoe rotate at same direction) and the right side (CT) is a trailing shoe (i.e. drum and shoe rotate at opposite direction) in Fig 1.
2 THE BRAKE FACTOR
The BF can be expressed as the ratio of drum-lining friction drag force and the shoe actuation force:
CFF
drum drag
shoe actuation
* ,_
_
= ∑∑
(1)
where, Σ Fdrum_drag is the summation of drum drag force and Σ Fshoe_actuationis the summation of total shoe actuation force. In order to compute the total BF (Eq. (1)), first, each shoe’s BF can be computed separately as follows [10].
Fig. 1. S-Cam foundation brake (from [10])

Strojniški vestnik - Journal of Mechanical Engineering 62(2016)9, 503-510
505Optimization of the Brake Factor for an S-Cam Foundation Brake using RSM
Here a L L= +( )1
2
4
21 2/
and μ is the friction coefficient. LL and LT are the brake shoe’s actuation lever arm lengths for leading and trailing shoes respectively and they can be calculated as:
LL
L LL
rr
L
T
s
s
=
−
+
+
cos sin
sin cos
ϕ ϕϕ ϕ
2 3
1
,, (4)
where, ϕ = ( ) + ( )arcsin arcsinb L r bs1 4 2. In this
equation, b R R L Li1
2
4
21 2
= − − −( )( )/
and b b L2 1
2
4
21 2
= +( ) / with R L L L Li= +( ) + +( )( )1
2
2 3
21 2/
. rs is the S-Cam evolving (i.e. S-Cam base) radius. In analysis, L2 is varied between Li (i.e. before lining wear - full lining thickness) and Lf (i.e. after lining wear - lowest lining thickness) depending the rotation position of cam (Li ≤ L2 ≤ Lf ). Sub-index L and T represent leading and trailing shoes respectively. Each shoe’s BF versus friction coefficient is plotted in Fig. 2.
CL
CT
Fig. 2. BF for leading and trailing shoes
3 TYPES OF LINING WEAR
In calculation of BF, the nominal values data in Table 1 were used [10]. Fig. 2 shows that the BF grows exponentially for the leading shoe (CL) as the friction coefficient increases. This occurrence is called “self-energized”, and it can only be seen in type foundation brakes [13]. Brake lining wear can be categorized into two types, as follows:
Type A: Linear wear (LW): in this case, the leading and trailing shoes have no floating mechanism
of actuation (i.e. actuation load transfer is prevented between both shoes). This case implies an unequal shoes actuation force or an equal lining wear. S-Cam foundation brake is a typical example.
Type B: Differential wear (DW): In this case, leading and trailing shoes have a floating mechanism of actuation (i.e. actuation load transfer is permitted between both shoes). This case implies an equal actuation force or an unequal lining wear. A simplex wedge foundation brake is a typical example. Conditions for shoe actuation force, contact pressure between drum and shoes, and resulting brake torque are summarized [10] in Table 2.
Table 1. Nominal values (from [10])
Variable QuantityL1 40 mm
Li ≤ L2 ≤ Lf 40.3 ≤ L2 ≤ 72 mmL3 143.15 mmL4 157 mmrs 12 mmrd 196.85 mm (ϕ 393.7 mm)θ1 28°θ2 145°
Table 2. Conditions for lining wear types (from [10])
TypeDrum/Lining
PressureTorque
Shoes Actuating
ForceTotal BF
A PL = PT TL = TT FL < FT CC CC CLW
L T
L T
∗ =( )+( )
2
B PL < PT TL < TT FL = FT C C CDW L T∗ = +
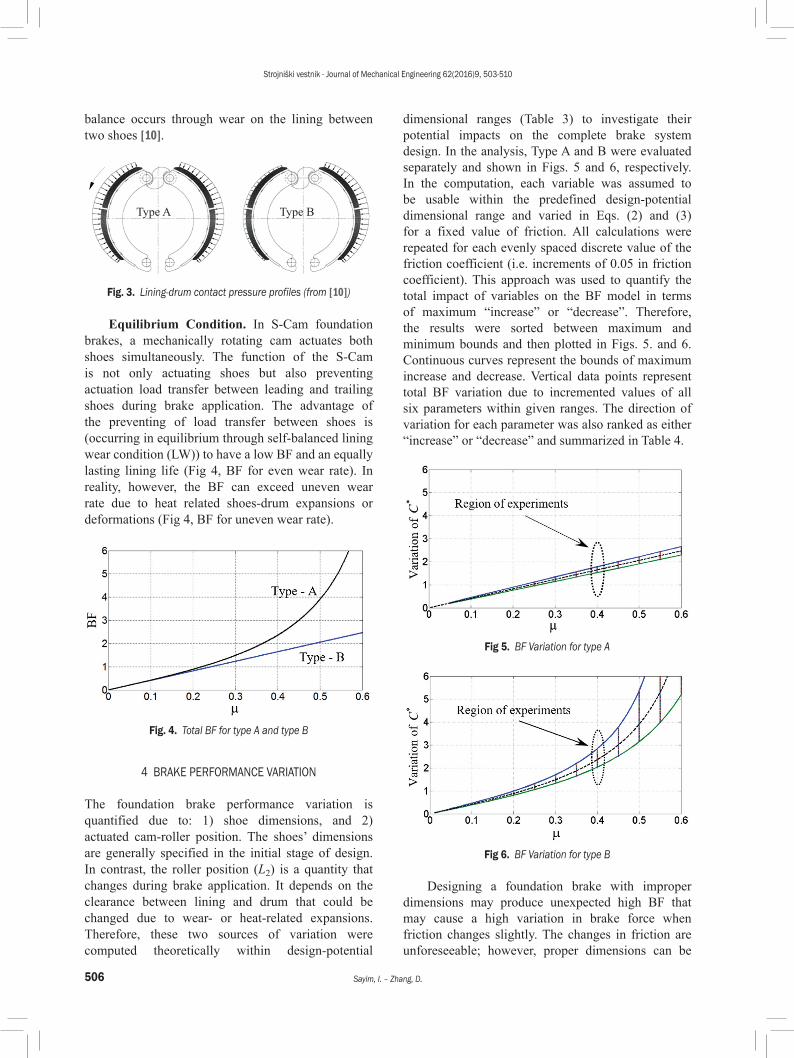
In Fig. 3, contact pressure profiles between drum and lining material are shown schematically for LW torque generated via lining and drum friction forces, FL and FT represent actuation forces applied to the shoes roller tips and DW. In Fig 3a, load transfer is permitted between the shoes, and equilibrium condition occurs through balanced contact pressure [10]. In Fig. 3b, load transfer is prevented via the aid of the S-Cam shaft and bushing. In this case, the pressure accumulates at trailing shoe, and the force
CL
a a a a rLL
d
=−( )
− + + − + −4
2 2 2 2 4 2
1 2
2 2 2 1 2
µ θ θθ θ θ θ µ θ
cos cos
sin sin cos µµ θ µ θ µ θa r adcos cos cos,
2 4 2 22 1 1− +( ) (2)
CL
a a a a rTT
d
=−( )
− − + − −4
2 2 2 2 4 2
2 1
2 2 1 1 2
µ θ θθ θ θ θ µ θ µ
cos cos
sin sin cos aa r adcos cos cos.
2 4 2 22 1 1θ µ θ µ θ− +( ) (3)
Strojniški vestnik - Journal of Mechanical Engineering 62(2016)9, 503-510
506 Sayim, I. – Zhang, D.
balance occurs through wear on the lining between two shoes [10].
Type A Type B
Fig. 3. Lining-drum contact pressure profiles (from [10])
Equilibrium Condition. In S-Cam foundation brakes, a mechanically rotating cam actuates both shoes simultaneously. The function of the S-Cam is not only actuating shoes but also preventing actuation load transfer between leading and trailing shoes during brake application. The advantage of the preventing of load transfer between shoes is (occurring in equilibrium through self-balanced lining wear condition (LW)) to have a low BF and an equally lasting lining life (Fig 4, BF for even wear rate). In reality, however, the BF can exceed uneven wear rate due to heat related shoes-drum expansions or deformations (Fig 4, BF for uneven wear rate).
Fig. 4. Total BF for type A and type B
4 BRAKE PERFORMANCE VARIATION
The foundation brake performance variation is quantified due to: 1) shoe dimensions, and 2) actuated cam-roller position. The shoes’ dimensions are generally specified in the initial stage of design. In contrast, the roller position (L2) is a quantity that changes during brake application. It depends on the clearance between lining and drum that could be changed due to wear- or heat-related expansions. Therefore, these two sources of variation were computed theoretically within design-potential
dimensional ranges (Table 3) to investigate their potential impacts on the complete brake system design. In the analysis, Type A and B were evaluated separately and shown in Figs. 5 and 6, respectively. In the computation, each variable was assumed to be usable within the predefined design-potential dimensional range and varied in Eqs. (2) and (3) for a fixed value of friction. All calculations were repeated for each evenly spaced discrete value of the friction coefficient (i.e. increments of 0.05 in friction coefficient). This approach was used to quantify the total impact of variables on the BF model in terms of maximum “increase” or “decrease”. Therefore, the results were sorted between maximum and minimum bounds and then plotted in Figs. 5. and 6. Continuous curves represent the bounds of maximum increase and decrease. Vertical data points represent total BF variation due to incremented values of all six parameters within given ranges. The direction of variation for each parameter was also ranked as either “increase” or “decrease” and summarized in Table 4.
Fig 5. BF Variation for type A
Fig 6. BF Variation for type B
Designing a foundation brake with improper dimensions may produce unexpected high BF that may cause a high variation in brake force when friction changes slightly. The changes in friction are unforeseeable; however, proper dimensions can be

Strojniški vestnik - Journal of Mechanical Engineering 62(2016)9, 503-510
507Optimization of the Brake Factor for an S-Cam Foundation Brake using RSM
well evaluated in the design stage of the foundation brake. In this work, the aim was set to lower the BF as much as possible within specified design-potential dimensional ranges during the design process. Therefore, the cam-roller position and shoe dimensions were carefully selected in the analysis to theoretically compute the potential of reduction on the BF. For example, in Fig. 6, a total variation of 31.92 % was observed relative to nominal value (dashed line) of BF at a friction of μ = 0.4. The 19.73 % of this variation was above the nominal value; therefore, it was treated as irrelevant to analysis because the target was set to obtain a lower BF. A value of 12.19 % was below the nominal value which indicated the availability of improvement on BF. That is our primary focus of intention. Similarly, in Fig 5, a total variation of 15.37 % was observed at the friction of μ = 0.4. The 8.08 % of total variation was above and 7.29 % was below the nominal.
5 THE RSM FOR THE BF MINIMIZATION
The RSM is a practical way to investigate relations between changes on the input variables and responses on the output variables in complex data systems. A wide variety of RSM engineering applications can be found in literature [14] to [16] such as aerospace, tribology, manufacturing, etc. In this analysis, the RSM is performed to minimize BF by using the values in Table 3 and at the friction coefficient of μ = 0.4. Full quadratic surface fit is applied in the RSM analysis. In Fig. 7, nominal values (Table 1) were set as targeted in RMS analysis.
In Fig. 8, the RSM is run for minimizing BF with the best option of dimensional input variables. The type of lining wear (LW and DW) was not known precisely; therefore, RSM analysis was performed on both cases simultaneously in order to the obtain changes of same variables to the response of both
Fig. 7. RSM results based nominal target value
Fig. 8. RSM results based nominal minimized target value

Strojniški vestnik - Journal of Mechanical Engineering 62(2016)9, 503-510
508 Sayim, I. – Zhang, D.
output variables. Both RSM runs perfectly fit to the target (green solid lines) with a tolerance of ±0.06 (red dashed lines). Results of RSM, Figs 7. and 8, are summarized in Table 6 for easy interpretation. The effects of parameters were converted to percentage change and then their ranks are numbered from one to six, as shown in Table 4.
The most responsive variables (θ2, L4, and θ1) are shown in shaded cells in Table 4. A new test sample of S-Cam foundation brake was built based on a modification of these three variables after RSM analysis (θ1 = 38.5, L4 = 162 and θ2 = 135). For testing purposes, a new brake testbed was designed and then built to measure BF in a practical, effective and inexpensive way, as shown in Fig. 9. Most importantly, this testbed was also capable of measuring BF without
thermal effects on friction (i.e. constant temperature or constant friction coefficient). With the modified test sample, one with nominal dimensions was also selected for testing to experimentally validate relative reduction on BF.
Table 3. Data values used in RSM
Design variables Response variables
IndexL1
(35≈45) [mm]
L2 (40.308≈70.308)
[mm]
L3 (138.15≈ 43.15)
[mm]
L4 (152≈162)
[mm]
θ1 (18≈38) [degree]
θ2 (135≈155)
[degree]CLW
* CDW*
1 35 40.308 138.15 152 18 135 1.6563 2.32862 35 40.308 138.15 154 18 135 1.6472 2.29093 35 40.308 138.15 156 18 135 1.6383 2.2551
⁞ ⁞ ⁞ ⁞ ⁞ ⁞ ⁞ ⁞ ⁞11662 45 70.308 158 38 155 1.6646 2.567911663 45 70.308 143.15 160 38 155 1.6565 2.525911664 45 70.308 143.15 162 38 155 1.6485 2.4860
Fig. 9. Testbed for foundation brakes (from [10])
Table 4. Effects of design parameters on BF
L1 L2 L3 L4 θ1 θ2
CLW* ↓ ↑ ↑ ↓ ↓ ↑
% change 1.7221 1.7260 0.8989 4.2874 0.9992 7.7086Rank 4 3 6 2 5 1
CDW* ↓ ↑ ↑ ↓ ↓ ↑
% change 0.5622 0.9914 0.8885 1.3540 2.2661 1.9888Rank 6 4 5 3 1 2

Strojniški vestnik - Journal of Mechanical Engineering 62(2016)9, 503-510
509Optimization of the Brake Factor for an S-Cam Foundation Brake using RSM
6 EXPERIMENTAL VALIDATION
6.1 Testbed
In the testbed, a Type-30 brake cylinder actuates both shoes. Cylinder input air pressure is controlled with a very precise pressure control and a check valve. In the meantime, the drum is forced to rotate via two hydraulic cylinders with an attached rotation flange, as shown in Fig. 9 [10]. These cylinders are also controlled by a very precise hydraulic pressure control valve. All three cylinders are plugged into a single control unit. The control unit performs the following jobs. First, it applies force to the shoe’s roller through S-Cam actuation and holds the pressure of brake chamber in the stable state. This action puts the foundation and drum together in the brake state. Then, the control unit applies hydraulic pressure to the cylinders gradually to force the drum to rotate from a very low to high pressure by very small increments until the drum starts to rotate against the braked state. Sensors were installed to capture the rotation of the drum. Upon any detected small rotation in a short time (i.e. 3 mm to 5 mm relative displacement of the drum to the lining in the direction tangential to the drum’s outer diameter), the sensor signals the control unit for recording all the pressures from all actuations including brake chamber and drum rotation cylinders. This pressure is an average value of measurements made by the control unit in very last short period and just before the rotation is captured. Finally, the measured force of rotation is assumed to be friction force generated by the foundation brake. The S-cam actuation force is calculated by considering the mechanical advantages (i.e. brake cylinder membrane surface, slack adjuster angles to pushrod). The ratio of these two forces is taken as BF as described in Eq. (1).
6.2 Experimental Work
Experiments were carried out by testing two samples in the testbed under the same conditions such as identical lining material (manufacturer-defined friction coefficient is μ = 0.4 ± 0.02), and same line air pressure (8.1 bar). First, the S-Cam foundation brake sample was tested with nominal design values, as given in Table 1, about fifty experimental runs.
A mean value of BF of * 3.467=C with a standard deviation of 0.1118 were recorded. Second, a modified sample was tested over approximately fifty additional experimental runs. A mean value of BF of * 2.672C =with a standard deviation of 0.1418 were recorded. The average of these two tests indicated that a
relatively significant improvement of 22.93 % (or 0.795 of decrease on BF) on BF was obtained. Therefore, it can be concluded that highly consistent theoretical (19.48 %) and experimental (22.93 %) results were obtained in this paper analysis and also verified experimentally.
7 CONCLUSIONS
Performance improvement of an S-Cam foundation brake has been carried out with respect to its dimensional design criteria. First, a detailed precise BF formulation is derived including cam-roller position effects. Second, the BF variation is quantified theoretically by varying all six variables within certain design-possible ranges. Then, the contribution of each parameter to BF is quantified and ranked via the use of RSM. Finally, the experimental validation was performed. In this regard, a new testbed designed to measure BF effectively without any thermal effects on friction. Based on the modification of the most responsive elements, a new foundation brake test sample was built. This sample was tested and its results were compared with the nominal sample. A significant improvement (reduction of 22.93 %) on BF was obtained. With this result, we conclude that an improved S-Cam foundation brake has been designed, tested, and validated with comparable performance to disc foundation brake.
8 ACKNOWLEDGEMENTS
The author gratefully acknowledges Huseyin Cekmer, Hasan Cekmer, Murat Mater, Sabri Akin, and Ali Soylu from Tafsan Fren A.S. (formerly Istanbul Fren San ve Tic A.S.) for supporting this research. However, the views expressed in this paper belong to the authors alone and do not necessarily represent the position of any other organization or person.
9 NOMENCLATURES
C* Brake Factor for foundation (Both shoes) [-]C∗ Mean value of measured brake factor for
foundation [-]CLW
* Brake Factor for linear wear (Type A) [-]CDW
* Brake Factor for differential wear (Type B) [-]μ Friction coefficient for lining and drum couple [-]CL Brake factor for leading shoe [-]CT Brake factor for trailing shoe [-]FT Force applied on the trailing shoe roller tip
through S-Cam [N]

Strojniški vestnik - Journal of Mechanical Engineering 62(2016)9, 503-510
510 Sayim, I. – Zhang, D.
FL Force applied on the leading shoe roller tip through S-Cam [N]
TT Torque developed about drum axis due to friction drag force (trailing shoe) [Nm]
TL Torque developed about drum axis due to friction drag force (leading shoe) [Nm]
PT Pressure between lining and drum (trailing shoe) [N/m2]
PL Pressure between lining and drum (leading shoe) [N/m2]
rd Radius of drum [mm]rs Effective radius of S-Cam [mm]rw Effective radius of wheel [mm]L1 Half-length between two shoes pivots [mm]L2 Length 2 [mm]L3 Length 3 [mm]L4 Length 4 [mm]Li Initial distance between S-cam and roller centre
–Full lining thickness [mm]Lf Final distance between S-cam and roller centre –
Lowest lining thickness [mm]θ1 Angle from reference line to tip of lining [rad]θ2 Angle from reference line to end of lining [rad]
10 REFERENCES
[1] United Nations (2014). E/ECE/324 and E/ECE/TRANS/505, Uniform Provisions Concerning the Approval of Vehicles of Categories M, N and O With Regard to Braking, from: https://www.unece.org/fileadmin/DAM/trans/main/wp29/wp29regs/updates/R013r8e.pdf, accessed on 2016-01-20.
[2] US Department of Transportation (2009). National Highway Traffic Safety Administration, 49 CRF Part 571 – RIN 2127-AK62, Federal Motor Vehicle Safety Standards; Air Brake Systems, from: http://www.regulations.gov/#!documentDetail;D=NHTSA-2009-0175-0006, accessed on 2016-01-20.
[3] Mac Adam, C., Gillespie, T.D. (1998). Determining the Mechanical Sensitivities of an S-cam Brake, University of Michigan, Highway Safety Research Institute, Report Number: UMTRI-98-55, from http://deepblue.lib.umich.edu/handle /2027.42/1265, accessed on 2016-01-20.
[4] Limpert, R. (2011). Brakes: Design and Safety, SAE International, Warrendale, DOI:10.4271/R-398.
[5] Winkler, C.B. (1976). Predicting the Braking Performance of Trucks and Tractor-Trailers, University of Michigan, Highway
Safety Research Institute, Report Number: UM-HSRI-76-26-2, from: http://deepblue.lib.umich.edu/handle/2027.42/738, accessed on 2016-01-20.
[6] Gillespie, T.D., Fancher, P.S., Johnson, L.K. (1978). An Empirical Model for the Prediction of the Torque Output of Commercial Vehicle Air Brakes, University of Michigan, Highway Safety Research Institute, Report Number: UM-HSRI-8-53, from: http://deepblue.lib.umich.edu/handle/2027.42/594, accessed on 2016-01-20.
[7] Day, A.J., Kim, S.Y. (1996). Noise and vibration analysis of an S-cam drum brake. Proceedings of the Institution of Mechanical Engineers, Part D: Journal of Automobile Engineering, vol. 210, p. 35-43, DOI:10.1243/PIME_PROC_1996_210_242_02.
[8] Krishnan, G. (2015). Future of Drum Brakes. EuroBrake 2015, Dresden.
[9] Bombek, G., Pevecm M., Vranesevic, D. (2013). Research into the possible causes of squealing brake-drums. Journal of Vibration and Control, vol. 20, no. 9, p. 1271-1278, DOI:10.1177/1077546312468924.
[10] Sayim, I. and Zhang, D. (2016). Experimental quantification of brake factor for S-Cam type foundation brake. Measurement, vol. 87, p. 117-125, DOI:10.1016/j.measurement.2016.02.067.
[11] Sonawane, D.B., Narayan, K., Ra,o V.S., Subramanian, S.C. (2011). Model-based analysis of the mechanical subsystem of an air brake system. International Journal of Automotive Technology, vol. 12, no. 5, p. 697-704, DOI:10.1007/s12239−011−0081−1.
[12] Subramanian, S.C., Darbha, S., Rajagopal, K.R., (2004). Modeling the pneumatic subsystem of an S-cam air brake system. Journal of Dynamic Systems. Measurement, and Control, vol. 126, no. 1, p. 36-46, DOI:10.1115/1.1666893.
[13] Budynas, R.G., Nisbett, J.K. (2011). Shigley’s Mechanical Engineering Design. McGraw-Hill Book Company Inc., New York.
[14] Thakre, A.A. (2015). Prediction of erosion of polyetherimide and its composites using response surface methodology. Journal of Tribology, vol. 137, no. 1, art. no. 011603, DOI:10.1115/1.4028267.
[15] Selçuk, B. (2014). Feasibility of utilizing response surface methodology for predicting wear of steels. Proceedings of the Institution of Mechanical Engineers, Part J: Journal of Engineering Tribology, vol. 225, no. 5, p. 277-287, DOI:10.1177/1350650111401534.
[16] Alaeddini, A., Yang, K., Murat, A. (2013), ASRSM: A sequential experimental design for response surface optimization. Quality Reliability Engineering International, vol. 29, no. 2, p. 241-358, p. 241-258, DOI:10.1002/qre.1306.