optimization of the cumulative risk pesticides and … optimization of the cumulative risk...
TRANSCRIPT

Optimization of the
cumulative risk assessment of pesticides and biocides using computational techniques: Pilot project Pestiocide Research No. 153, 2014
2 Optimization of the cumulative risk assessment of pesticides and biocides using computational techniques: Pilot project
Title:
Optimization of the cumulative risk assessment of pesticides and biocides using computational techniques: Pilot project
Authors and contributors:
Svava Ósk Jónsdóttir, Trine Klein Reffstrup, Annette Petersen, Elsa Nielsen and John Christian Larsen
National Food Institute The Technical University of Denmark
Published by:
The Danish Environmental Protection Agency Strandgade 29 DK-1401 Copenhagen K, Denmark www.mst.dk
Year:
2014
ISBN no.
978-87-93178-08-3
Disclaimer:
When the occasion arises, the Danish Environmental Protection Agency will publish reports and papers concerning research and development projects within the environmental sector, financed by study grants provided by the Danish Environmental Protection Agency. It should be noted that such publications do not necessarily reflect the position or opinion of the Danish Environmental Protection Agency. However, publication does indicate that, in the opinion of the Danish Environmental Protection Agency, the content represents an important contribution to the debate surrounding Danish environmental policy. Sources must be acknowledged.

Optimization of the cumulative risk assessment of pesticides and biocides using computational techniques: Pilot project 3
Contents
Preface ...................................................................................................................... 5
Sammenfatning ......................................................................................................... 6
Summary................................................................................................................... 7
Abbreviations and acronyms ..................................................................................... 8
Introduction and background .................................................................................... 9 1.1 Main objectives ...................................................................................................................... 9 1.2 Background ........................................................................................................................... 10 1.3 Project Plan ........................................................................................................................... 12
1.3.1 Selection of compounds for PBTK based cumulative risk assessment ................ 12 1.3.2 Literature search and data analysis for determining parameters for the
PBTK modeling ...................................................................................................... 14 1.3.3 PBTK modeling ...................................................................................................... 14
2. Materials and Methods ...................................................................................... 17 2.1 Pesticidal action, ADME and toxicology of tebuconazole and prochloraz ......................... 17
2.1.1 Tebuconazole .......................................................................................................... 17 2.1.2 Prochloraz............................................................................................................... 19
2.2 Computational techniques.................................................................................................... 21 2.2.1 Physiologically based toxicokinetic (PBTK) modelling, basic concepts .............. 21 2.2.2 Quantitative Structure-Activity Relationships (QSARs) ..................................... 25
3. The developed PBTK models ............................................................................. 29 3.1 The PBTK model for tebuconazole ...................................................................................... 30
3.1.1 Choice of compartments for the Tebuconazole Model ........................................ 30 3.2 PBTK model for prochloraz ................................................................................................. 32
3.2.1 Choice of compartments for the Prochloraz Model ............................................. 32 3.3 Parameters for the PBTK Models ........................................................................................ 33
3.3.1 Physiological parameters ...................................................................................... 33 3.3.2 Compound specific parameters ............................................................................ 35 3.3.3 Parameters for the dermal model for tebuconazole ............................................ 52
3.4 Binary PBTK model for prohloraz and tebuconazole ......................................................... 54 3.4.1 Model architecture and combination of the two individual models ................... 54 3.4.2 Parameters needed for the binary model ..............................................................55
4. Predictions of parameters for PBTK models by QSAR ....................................... 59 4.1 QSAR Modeling.................................................................................................................... 59
4.1.1 Prediction of CYP activity by QSAR ..................................................................... 59 4.1.2 New QSAR Models for Predicting Parameters for PBTK Models ........................ 61 4.1.3 Prediction of Renal Clearance .............................................................................. 70
5. Results from PBTK modelling ........................................................................... 72 5.1 Validation and analysis of PBTK model for tebuconazole ..................................................73
5.1.1 Validation of model by using rabbit data ..............................................................73 5.1.2 Validation and analysis based available data in rats ........................................... 82 5.1.3 Validation using rat data for female rats from the PestiMix project .................. 86

4 Optimization of the cumulative risk assessment of pesticides and biocides using computational techniques: Pilot project
5.1.4 Sensitivity of key parameters on blood concentration ........................................ 87 5.2 Validation and analysis of PBTK model for prochloraz ..................................................... 88
5.2.1 Validation using rat data for female rats from the PestiMix project .................. 92 5.3 Binary models ...................................................................................................................... 95
5.3.1 Simulations and validation for a binary mixture of R and S tebuconazole in rat ...................................................................................................................... 95
5.3.2 Simulations for a binary mixture prochloraz and tebuconazole in rat ............... 97 5.4 Predictions for specific exposure criteria in humans ....................................................... 103
5.4.1 Exposure scenarios ............................................................................................. 103 5.4.2 Results .................................................................................................................. 105
6. Discussion ....................................................................................................... 121 6.1 Quality of the PBTK models, strengths and weaknesses ................................................... 123 6.2 The sensitivity of the parameters on the simulation ......................................................... 124
6.2.1 The oral absorption rate constant and fractional absorption ............................ 125 6.2.2 Fraction unbound in plasma ............................................................................... 125 6.2.3 The metabolic constants ...................................................................................... 126 6.2.4 Tissue:blood partition coefficients and fraction unbound in tissue .................. 126 6.2.5 Elimination rate constants ..................................................................................128 6.2.6 Inhibition constants and induction .....................................................................128
6.3 Applicability of the developed PBTK model ...................................................................... 129 6.3.1 Evaluation of the models with respect to WHO IPCS guidance on PBTK
models to be used in risk assessment ................................................................. 130
7. Conclusion ..................................................................................................... 133
8. Perspectives ....................................................................................................135
References ............................................................................................................ 139
Appendix 1: Overview of studies used for toxicological evaluation in (JMPR, 2010). ................................................................................ 151
Appendix 2: Detailed mathematical description of the tebuconazole model ......153
Appendix 3: Detailed mathematical description of the prochloraz model ........ 159
Appendix 4: Detailed mathematical description of the binary models .............. 162
Appendix 5: List of the main variables used in the PBTK models ..................... 164
Appendix 6: Review on Metabolic Constants of Related Compounds ................ 166
Appendix 7: 2D structures of training set compounds for the developed QSAR models, showing ionizable atoms and predicted logD values at pH=7.0 and pH=7.4 (blood pH). ...................................... 169
Appendix 8: Overview over blood and tissue concentration and excretion data ................................................................................................ 171
Appendix 9: Supplementary information for dietary and dermal exposures scenarios ........................................................................................ 179

Optimization of the cumulative risk assessment of pesticides and biocides using computational techniques: Pilot project 5
Preface
This report presents a pilot project that investgates the feasibility of using computational methods for assessing the internal dose of pesticides and biocides within the human and rat body upon exposure. The work was carried out from February 2012 to November 2013, and the involved institutions were the Division of Toxicology and Risk Assessment and the Division of Food Chemistry at the National Food Institute, DTU. The project was financially supported by the Danish Environmetal Agency (Danish EPA), and administered by the Danish EPA’s Program for Pesticide Research. We wish to thank the Danish EPA for providing the funding and making this project possible. The project was monitored by the steering committee under the Research Program for Pesticide Research, chaired by Jørn Kirkegaard at the Danish EPA. The committee also consists of the following members. Christian Friis, University of Copenhagen Christian Ritz, University of Copenhagen Grete Østergaard, University of Copenhagen Henrik Leffers, University of Copenhagen Jesper Bælum, Odense University Hospital Karin Sørig Hougaard, National Research Centre for the Working Environment Marianne Schmidt, Danish EPA Martin Larsson, Bayer A/S Martin Tang Sørensen, Aarhus University Michael Nielsen, Knowledge Centre for Agriculture Rikke Donchil Holmberg, Danish EPA Susanne Hougaard, Danish EPA We would like to thank the members of the steering committee for their involment throughout the project period. We would especially like thank the referees of the report, Jesper Bælum, Martin Larson, Rikke Donchil Holmberg, Susanne Hougaard and Marianne Schmidt for their good and helpful comments on the report. Special thanks to Anne Marie Vinggaard and Ilona Kryspin Sørensen for their help and comments on this report. Ulla Hass, Sofie Christiansen and my colleagues in the Molecular Toxicology group are thanked for good discussions about the work, and Anette Schnipper and Christine Nellemann for their help with administrative issues.

6 Optimization of the cumulative risk assessment of pesticides and biocides using computational techniques: Pilot project
Sammenfatning
Denne rapport præsenterer fysiologisk baserede toksikokinetiske (PBTK) modeller for tebuconazol og prochloraz. Modellerne blev konstrueret med det formål at udvikle et PBTK modelleringsværktøj til brug i risikovurdering af individuelle kemikalier og binære blandinger. Eksponeringsscenarier konstrueret baseret på observationer af pesticidrester i fødevarer og vurdering af hudeksponering ved professionelt brug blev anvendt. Den videnskabelige litteratur blev gennemgået for at udvikle PBTK modeller for disse stoffer, og for at fastlægge parametrene, der indgår i modellerne. Modellerne er derefter blevet udviklet og implementeret. PBTK modeller er afhængige af, at der er tilgængelige parametre som beskriver arternes fysiologi samt kemikaliernes ADME karakteristika (absorption, distribution, metabolisme og elimination). Modeller baseret på kvantitative struktur-aktivitets-relationer (QSAR) blev med succes anvendt til at forudsige to parametre, som ikke var tilgængelige for tebuconazole og prochloraz, men som var tilgængelige for strukturelt lignende stoffer. Dette pilotprojekt er tænkt som det første skridt på vej mod at udvikle en beregningsbaseret strategi, som skal hjælpe med at forbedre metoder til kumulativ risikovurdering af eksponering til blandinger af pesticider og biocider, samt risikovurdering af aggregat eksponering af forskellige veje. Vores mål er at, undersøge hvorvidt PBTK modellering kan bidrage til at forbedre kumulativ risikovurdering ved lave eksponeringsniveauer, og kan hjælpe med at identificere ved hvilke doser metaboliseringsvejene overbelastes. PBTK modeller kan benyttes til at estimere koncentrationer (interne doser) af kemiske stoffer og deres metabolitter i udvalgte væv og organer. Ved en tilstrækkeligt god beskrivelse af ADME for de individuelle stoffer og blandinger i organismer, kan interne doser estimeres for forskellige eksponeringsscenarier i såvel rotter som mennesker. Til validering af PBTK modellerne, anvendtes koncentrationer af tebuconazol i blod og væv målt i kanin og simple målinger af koncentrationen i blod for begge stoffer fra et blandingsstudie på rotter. Valideringer og analyser af tebuconazol i kanin indikerer at koncentrationsniveauet blev forudsagt inden for faktor på to i blod og i de fleste væv, men desværre ikke i leveren. Forskellen på QSAR forudsigelsen af fraktionen af ikke bundet prochloraz i plasma og en in vitro måling af den samme egenskab var 5%. Disse observationer forventes undersøgt nærmere i det videre arbejde. Vores simulering for en binær blanding af tebuconazol og prochloraz indikerer at det ikke er nødvendigt at medtage inhibering af de metaboliske enzymer ved relativt lave eksponeringsniveauer som i de valgte scenarier. Simuleringerne viste at koncentrationsniveauer af det aktive stof i forhold til eksponering var omkring ti gange højere for dermal eksponering end ved eksponering via maden. Simuleringerne viste at det var vigtigt med dage uden eksponering for at kroppen kunne rense sig for de sidste rester af især de dannede metabolitter. Vi har udviklet en pilotversion af et værktøj til at beregne interne doser for to stoffer og en blanding af disse. Fremgangsmådens styrker og begrænsninger er blevet evalueret og analyseret som en del af dette arbejde, anbefalinger til videre udvikling af værktøjerne er diskuteret. På basis af vores undersøgelser, vurderer vi at de udviklede modeller kan bidrage med kvalitativ information til brug for risikovurdering ved de relevante eksponeringssituationer, som er langt under NOAEL (nuleffektniveauet).

Optimization of the cumulative risk assessment of pesticides and biocides using computational techniques: Pilot project 7
Summary
This report presents physiologically based toxicokinetic (PBTK) models for tebuconazole and prochloraz. These models were constructed with the aim of developing a PBTK modelling tool for use in the risk assessment of individual chemicals and binary mixture of the compounds. Exposure scenarios were constructed based on findings of pesticide residues in food, and assessment of dermal exposure during professional use. The scientific literature has been investigated in order to develop PBTK models for these compounds and to determine parameters to be used in the models, the models have been developed and implemented. PBTK modeling relies on the availability of parameters describing species physiology and the ADME (absorption, distribution, metabolism and elimination) characteristics of the chemicals. Quantitative Structure-Activity Relationship (QSAR) models were successfully used to predict two parameters, where experimental data were not available for tebuconazole and prochloraz, but where the corresponding data were available for structurally similar compounds. This pilot project is intended as the first step in developing a computational strategy to assist in refining methods for cumulative risk assessment of exposure to mixture of pesticides and biocides, as well as risk assessment of aggregate exposure by different routes. The projects aim is to investigate, if PBTK modeling can contribute to improving the cumulative risk assessment in the low dose exposure range, and help to identify at which dose levels overload of metabolic pathways may occur. PBTK models can be used to estimate the concentrations (internal doses) of toxic substances and their metabolites in target organs. By adequately describing the ADME of individual compounds and mixtures in the organism, internal doses can be estimated at various exposure scenarios in both rats and humans. The PBTK models were validated on plasma and tissue concentration level data for tebuconazole in rabbit, and simple blood concentration measurements for both compounds from a mixture study in rat. The validations and analysis of tebuconazole in rabbit indicate that the blood and tissue levels were generally predicted within a factor of two from the experimental data, but unfortunately not for the liver. The difference between fraction unbound predicted for prochloraz by QSAR differed from an experimental value measured in vitro by 5%. These observations will be investigated further in future work. The simulations for a binary mixture of tebuconazole and prochloraz indicate that it is not necessary to include inhibition at low exposure levels like the exposure scenarios chosen in this project. The simulated internal dose levels of the active compound relative to exposure were ten times higher for exposure via the dermal route compared to the dietary one. The simulations indicated that it is important with exposure free day to clear the body for metabolites formed. We have developed a pilot version of a toolbox for calculating internal doses for two compounds and a mixture of those. The strengths and limitations of the approach are evaluated and analysed as a part of this work, and recommendations are given for the further development of these tools. We evaluate based on our studies that the models can in their present form provide qualitative input to assist in risk assessment at relevant exposure levels, which are well below the no observed adverse effect level (NOAEL).

8 Optimization of the cumulative risk assessment of pesticides and biocides using computational techniques: Pilot project
Abbreviations and acronyms
ADI Acceptable Daily Intake ADME Absorption, Distribution, Metabolism and Elimination BMD Benchs Mark Dose CYP Cytochrome P450 CV Cross-validation HI Hazard Index LOO Leave One Out (cross validation method in QSAR) NOAEL No Adverse Effect Level PBTK Physiologically Based Toxicokinetic PBPK Physiologically Based Pharmacokinetic, same as PBTK in pharmacokinetics PLS Partial Least Square regression RMSD Root mean square deviation SVM Support Vector Machine QSAR Quantitative Structure-Activity Relationship The different variables and parameterise used in the PBTK models are explained in Appendix 5.

Optimization of the cumulative risk assessment of pesticides and biocides using computational techniques: Pilot project 9
Introduction and background
This report presents results from the project “Optimization of the cumulative risk assessment of pesticides and biocides using computational techniques: Pilot project”. Content of this report: The basic information on pesticidal action, absorption, distribution, metabolism and elimination (ADME) and toxicology of tebuconazole and prochloraz, as well as short introduction to the theory of PBTK and QSAR is found in chapter 2. The outline of the PBTK models and the parameters used in the models are presented in chapter 3, and detailed mathematical description of the developed models is given in Appendix 2-4. QSAR predictions and the QSAR models developed for predicting missing parameters for the PBTK simulation are presented in chapter 4. Results from the PBTK modelling, validation results for the developed models, simulations with single compound and binary models, including simulations for the chosen exposure scenarios, are shown in chapter 5. Discussion, conclusion and perspectives are written in chapters 6, 7 and 8 respectively. 1.1 Main objectives The long term objective of this project is to integrate the computer modelling tools physiologically based toxicokinetic (PBTK) and quantitative structure-activity relationship (QSAR) modelling in the assessment of human health risks from exposure to active compounds in pesticides and biocides. The project is intended to provide methods that can contribute to the risk assessment of chronic effects in the liver caused by low dose exposures. Low dose exposures are defined as the quantities of pesticides and biocides ordinary citizens may be exposed to via the food, as well as via non-occupational or occupational use, typically well below health based guidance values based on NOAELs (no observed adverse effect levels). We have developed a pilot version of a tool for PBTK simulations of a binary mixture, intended at a later stage to be further developed into a tool for PBTK based cumulative risk assessment of chemicals. For this purpose separate PBTK models were developed for two individual compounds, tebuconazole and prochloraz, as well as a model of a binary mixture of the two compounds. The concentration levels (internal doses) of toxic substances can be very different from the exposed dose, and a series of more or less toxic metabolites can be formed in the liver. PBTK modelling can help us to evaluate internal doses of toxicants and their metabolites in target organs, given that appropriate physiological, physico-chemical and toxicokinetic parameters are available. The PBTK based tool box was developed to calculate the internal doses of the active compounds (pesticides or biocides) and their relevant toxic metabolites in the blood, liver and other tissues. The tool box was designed to generate information to evaluate human health risks due to exposure to individual compounds, and particularly cumulative effects by binary mixtures of the compounds on rats and humans. The models cover both oral exposures (for pesticide residues in food) and dermal exposures (for biocides absorbed through the skin). The necessary parameters for the PBTK modeling were taken from the scientific literature and databases, predicted by QSAR models developed in this project, and adjusted to experimental elimination data.
10 Optimization of the cumulative risk assessment of pesticides and biocides using computational techniques: Pilot project
We focus on exploring the effects in the low dose regime, where the exposed doses fed into the model are based on realistic exposure scenarios. By carrying out separate PBTK simulations at high exposed doses as well, modeling results are compared to available data from animal studies, when possible, and to explore at which doses overload in metabolic pathways are seen in rats and humans.
1.2 Background At present, health risk assessments of pesticides and biocides, and subsequent establishment of reference values, are generally based upon data from studies on the individual compounds. However, during the last two decades increasing focus has been put on the fact that humans are concurrently exposed to a large number of chemicals via the food and the environment. These compounds may act additively or may interact and potentially cause higher (synergism), or in some cases lower (antagonism) toxic effect compared to the individual compounds. The current understanding is that chemicals that share similar mode of action or mechanisms of action typically act by dose addition. Whereas mode of action refers to functional or anatomic changes on a cellular level resulting from exposure to chemicals, mechanism of action refers to the specific biochemical interaction that leads to the chemically induced adverse effect. Recent works demonstrate that compounds that have the same adverse effect through dissimilar mode or mechanism of action can also be modelled by dose addition. Therefore, one of the present challenges is to adequately group such chemicals for evaluation of mixture effects (Nielsen et al., 2012; Kortenkamp et al., 2012; EFSA Panel on Plant Protection Products and their Residues (PPR), 2013; EFSA, 2013). In recent years, increased focus has been devoted to the use of PBTK methods in risk assessment (WHO, 2010d; EFSA, 2013; Reffstrup et al., 2010; Meek et al., 2013; U.S.EPA, 2012), as well as the development of methods for risk assessment of chemical mixtures (Hadrup et al., 2013). These papers and reports recommend the use of PBTK modelling for higher tier cumulative risk assessment of pesticides (EFSA, 2007; Kortenkamp et al., 2012), and a checklists and specifications for selecting PPTK models for risk assessment have been proposed (WHO, 2010c; Meek et al., 2013; Clewell and Clewell, III, 2008). Another important area for the use of PBTK, is risk assessment aggregate exposure via different routes (Beamer et al., 2012). Several research groups work with methods for PBTK based risk assessment. Judson et al. (Judson et al., 2011) did propose an interesting high throughput approach, and the Acropolis EU project also work with research in this area. Probabilistic methods have also been used for cumulative risk assessments of chemicals in the food, for example as a part of the SafeFood EU project (Bos et al., 2009; Muller et al., 2009). Much interest is presently devoted to PBTK modelling of mixtures of pesticides, and mixture models have been used extensively for example volatile compounds (Haddad et al., 2000; Price and Krishnan, 2011). Also any model that includes both an active compound and an active metabolite can be considered as a mixture model. Several PBTK models for pesticides have been published during the last decade (for example (Crowell et al., 2011; Timchalk et al., 2002; Mirfazaelian et al., 2006; Lowe et al., 2009; Poet et al., 2004; Pelekis and Emond, 2009; Tornero-Velez et al., 2012; Kim et al., 2008)), with only a few studies on cumulative effects (Timchalk and Poet, 2008; El-Masri et al., 2004; Weijs et al., 2013). PBTK has been used for many for the risk assessment of various types of organic chemicals and drugs (Clewell and Andersen, 2004c; Clewell and Clewell, III, 2008; Kirman et al., 2010; Sweeney et al., 2012; Sweeney et al., 2009; Sweeney et al., 2001; van den Berg et al., 2012). In a PBTK model the animal or human is described as a set of tissue compartments. The models seek to describe the relationship between exposure and the internal tissue dose (concentration)

Optimization of the cumulative risk assessment of pesticides and biocides using computational techniques: Pilot project 11
level using a description of mammalian physiology and biochemistry, especially ADME, as realistic as possible (U.S.EPA, 2006; Clewell and Andersen, 2004b; Campbell, Jr. et al., 2012; Rietjens et al., 2011; Reffstrup, 2012). The PBTK modeling can be made for relevant routes of exposure, i.e. dietary, inhalation and dermal, and for different species, for example rats and humans. It is also possible to do high-dose to low-dose extrapolations and to predict overload of toxicokinetic pathways which may lead to toxicity (Conolly, 2001; Klaassen, 1996; Krishnan et al., 1994). PBTK modelling can provide information not otherwise available by performing low-dose computational simulations in humans. Inter-species differences can be simulated by developing models for the same chemical in different spcecies and use inter-species extrapolation of parameters from one species to another when necessary and feasible (Campbell, Jr. et al., 2012). Simulations for different age group can be conducted, given that sufficient data are available (Clewell et al., 2007), and inter-individual variability can be incorporated by use of appropriate data, supplemented by probabilistic methods (Bois et al., 2010). Therefore, there is increased interest in using PBTK models as an assisting tool in risk assessment of pesticides and biocides. Exposure to multiple chemicals may cause alterations in the toxicokinetics of the individual chemicals resulting in a change in the predicted toxicity based on the summation of the effects of the individual compounds. Toxicokinetic interactions occur as a result of one compound altering the absorption, distribution, metabolism or elimination of other compounds, for example by competitive inhibition of metabolic pathways in the liver or induction of hepatic metabolism. Such interactions may affect the relationship between the exposed dose and the dose delivered to the target site (Krishnan et al., 1994; Krishnan et al., 2002). The PBTK model can be used to investigate interaction between chemicals and to define the doses at which interactions become significant (the interaction threshold) (ATSDR, 2001). In cases where no experimental data is available for specific physico-chemical and kinetic parameters for a compound, and the corresponding data for other structurally similar compounds are available, QSAR modeling can in some cases be used for predicting the missing parameters (Zvinavashe et al., 2008; Peyret and Krishnan, 2011). QSARs are correlative equations/ models that are developed by statistically adjusting a given property to structural features and properties of the molecules used to build the model. Subsequently, the model can be used to predict the same property for other compounds, given that they are sufficiently similar to the chemicals used to build the model. In this work we have developed QSAR models for predicting plasma protein binding (fraction unbound) and volume of distribution based on data for triazoles and imidazoles used as drugs, and used these models for predicting the corresponding parameters for tebuconazole and prochloraz. The QSAR group at National Food Institute, DTU has recently developed a new battery of QSAR models that can predict if a compound acts as a substrate (undergoes metabolic reaction) or as an inhibitor (blocks metabolic enzymes and hinder them in mediating metabolic reactions) to major Cytochrome P450 (CYP) metabolic enzymes (Jonsdottir et al., 2012; Ringsted et al., 2009). These models are of particular relevance for identifying which CYP enzymes pesticides and biocides interact with, for example to explore which compounds are competing for the same enzymes, and can thereby potentially interact. We have used models for identifying substrates and inhibitors to CYP3A4, 2C9 and 2D6, based on human clinical data. These are all important CYPs for xenobiotic metabolism. Exposure data for pesticide residues in food are available via reports from the Danish monitoring programs (Petersen et al., 2013; Jensen et al., 2010; Jensen et al., 2011; Jensen et al., 2012), and corresponding data for Europe are available from EFSA and other monitoring programs. For

12 Optimization of the cumulative risk assessment of pesticides and biocides using computational techniques: Pilot project
biocides, which we are primarily exposed to via the skin, dermal exposure, corresponding monitoring data are not available. 1.3 Project Plan The PBTK modelling part of this project is focused on combined action of compounds with similar mode of action. The previously developed PBTK modelling tool for chlorpyrifos, was extended to model two new individual compounds and generalized to be used for cumulative effects of binary mixtures of compounds. PBTK models were established for the individual compounds (oral and dermal exposure) and subsequently for a binary mixture of the same compounds. PBTK modeling requires much work with model architecture, analysis of available data for determining the compound specific parameters, and evaluation of the predictivity of the resulting models. Therefore, two compounds with similar mode of action were selected for the purpose of developing a pilot version PBTK based method for assessing cumulative effects. 1.3.1 Selection of compounds for PBTK based cumulative risk assessment Criteria used for selecting pesticides / biocides for evaluation of cumulative effects based on PBTK modeling.
1. The compounds are evaluated to have similar mode of action. 2. The compounds have documented chronic adverse effects on the liver after repeated
exposure. 3. The compounds are approved for use as pesticides in EU. 4. The compounds are preferably also used as biocides in EU. 5. The compounds are found as pesticide residues in food by the Danish pesticide control
(FVST, 2010). 6. Information about active metabolites formed, and data for estimating the necessary
parameters needed for the PBTK simulation are available.
As mentioned above, scientific opinion from EFSAs PPR panel (Panel on Plant Protection Products and their Residues) (EFSA, 2009) has classified 11 triazoles as a CAG group of compounds with documented chronic liver toxic effects, also discussed in (EFSA, 2009). Two of these triazoles match the six above mentioned criteria, namely propiconazole and tebuconazole. Difenoconazole, epoxiconazole, myclobutanil and triadimenol met all the same but the fourth criteria, see Table 1.1. Some of these compounds have available data from high dose experiments in rats, which can provide help for testing the predictive performance of the PBTK models. The compounds are chosen irrespective of their residue levels in food. The PPR panel members supported the grouping of these 11 triazoles into a single CAG group by the following observations. The fungicidal activity of triazoles is associated with their direct inhibition of the CYP51 enzyme. Trizoles are also reported to inhibit several other CYP enzymes, and to act as ligands for nuclear receptors and thereby to induce the activity of a number of CYP enzymes. It was shown in a study for myclobutanil, propiconazole and triadimefon that altered metabolism in the liver was a common response to all three triazoles. The same three triazole fungicides and the drug fluconazole were found to increase liver weights and exhibit centrilobular hypertrophy in a repeated dose in vivo study. The four triazoles were seen to affect the expression of multiple CYP3A and CYP2C genes in rat liver, and to have similar toxicogenomic responses to CAR (Constitutive androstane receptor) / PXR (pregnane X receptor) regulated genes in rat liver. Furthermore, these triazoles affected the expression of gene involved in steroid hormone metabolism (EFSA, 2009) and references therein.

Optimization of the cumulative risk assessment of pesticides and biocides using computational techniques: Pilot project 13
TABLE 1.1
LIST OF TRIAZOLES SELECTED FOR A CAG FOR CHRONIC ASSESMENT OF HEPATOTOXIC EFFECTS AND THE
IMIDAZOLE PROCHLORAS, WITH THEIR STATUS WITH REGARDS TO APPROVAL AND PESTICIDES AND BIOCIDES.
Approval as pesticides December 2011
Approval as biocides
CAG: chronic liver toxicitya
Agreed reference value ADI (mg/ kg bw/d) UF 100b
Hepato-toxic effect ADI (mg/ kg bw/d) UF 100a
Approved under Reg. (EC) No 1107/2009b
Expi-ration dateb
Ap-pro-ved in DKc
In-clud-ed in ap-pen- dix Id
Sub-mit-ted dos-sierf
Resi-dues in food 2009g
Bitertanol 0.003 0.01 No Yes No Yes
Cyproconazole
0.02 0.02 Yes 31-05-21 No No Yes No
Difenoconazole
0.01 0.01 Yes 31-12-18 Yes No Yes
Diniconazole 0.05 No No No No
Epoxiconazole
0.008 0.008 Yes 30-4-19 Yes No Yes
Flusilazole 0.002 0.005 Yes 30-08-08 No No No
Myclobutanyl 0.025 0.39 Yes 31-05-21 No No Yes
Propiconazole
0.04 0.036 Yes 31-05-14 Yes Yese Yes Yes
Tebuconazole 0.03 0.16 Yes 31-05-14 Yes Yese Yes Yes
Triadimefon 0.03 0.16 No No No Yes
Triademenol 0.05 0.05 Yes 31-08-19 No No Yes
Prochloraz 0.01 0.01h Yes 31-12-21 No No Yes
a EFSA Scientific Opinion (EFSA, 2009).
b According to EU Pesticide Database, Active substance updated on 13/10/2011
http://ec.europa.eu/sanco_pesticides/public/index.cfm
c According to Danish EPA list over approved active substances in pesticides and biocides,. URLs
http://www.mst.dk/Virksomhed_og_myndighed/Bekaempelsesmidler/TestBek%C3%A6mpelsesmidler/Regulering/Godkendte
bekaempelsesmidler.htm (last updated 29/06/2010d According list over active substances EU has included in appendix I under
the biocide directive URLs
http://www.mst.dk/Virksomhed_og_myndighed/Bekaempelsesmidler/biocider/Hvornår+ansøger+du/aktivstoffer+og+ansøgn
ingsfrister/produkttype8.htm and (last updated 15/7/2011) and
https://www.retsinformation.dk/Forms/R0710.aspx?id=135670#B14
e Expiration of the right to import, sell, use or possess without approval according to the principles of the biocide directive is on
31/3/2012 for these two active compounds.
f According List of participants and of applicants having submitted a dossier in accordance with Article 5(3) of Regulation (EC)
No 2032/2003 (by product-types). URL http://ec.europa.eu/environment/biocides/pdf/list_participants_applicants_prod.pdf
(Updated 20/5/11)
g Found as pesticide residues in food on the Danish market, results from the Danish pesticide control in 2009 (FVST, 2009).
URL http://www.fodevarestyrelsen.dk/fdir/pub/2010003/rapport.pdf, h According to JMPR (JMPR, 2001).

14 Optimization of the cumulative risk assessment of pesticides and biocides using computational techniques: Pilot project
Effects on sex and thyroid hormones for epoxiconazole, prochloraz, propiconazole and tebuconazole were investigated by in vitro and in vivo methods. Generally these four compounds showed similar effects, indicating that the imidazole prochloraz also can be considered to have similar mode of action as the 11 triazoles. Dose-response effect on liver weight was measured for two of the compounds, propiconazole and tebuconazole, showing increase in liver weights in both cases (Kjaerstad et al., 2007). These results add further support to the grouping made by the PPR panel. After consulting with the Danish EPA, tebuconazole and prochloraz were selected for the PBTK work. Prochloraz meets five of required criteria listed above, and tebuconazole is also used as biocide and meets all six criteria.
1.3.2 Literature search and data analysis for determining parameters for the
PBTK modeling A PBTK model uses many physiological, physico-chemical and toxicokinetic parameters. The parameters are used in this project are listed in Table 3.1 in section 3. Good estimates for the physiological parameters for both rats and humans, respectively, are generally available in the literature. The different tissue:blood partition coefficients can be estimated based on the octanol-water partition coefficient (lipophilicity) for each compound. Fractional intestinal absorption is also generally available for pesticides. QSAR models for predicting parameters needed for the PBTK modeling were developed in our licensed QSAR modeling software. Due to the lack of experimental data for tebuconazole and prochoraz, we have developed new QSAR models for three properties, namely plasma protein binding (fraction unbound in plasma), volume of distribution and percent renal clearance. We developed so-called local QSAR models, i.e. models that are based on experimental data for structurally similar compounds, in this case, azoles and related compounds. We have chosen this approach to be able to predict as accurate parameters as possible for these compounds. A preliminary literature search revealed that for this compound class sufficient amount of experimental data are available in the scientific literature and in the freely available PK/DB database of Pharmacokinetic Properties that contains experimental data for around 1400 compounds (http://miro.ifsc.usp.br/pkdb) (Moda et al., 2008). Such QSAR models can be used to predict the same parameters for other similar compounds, and the developed models can thus be applicable for providing parameters for PBTK modelling outside this project. Information on which metabolites can be formed, are generally available for pesticides. However, a limiting factor in PBTK modelling is the lack of experimental data on metabolic enzyme kinetics, which is necessary for determining the internal dose of the parent compound and any critical metabolite (Peyret and Krishnan, 2011). These parameters can in some cases be derived from in vivo or in vitro data, and as a first attempt we search for the availability of such data. In cases where experimental data on metabolic constants (Michaelis-Menten constants and maximum velocities of metabolic reactions) are not available for a given compound, a viable option is to adapt corresponding constants for similar compounds that undergo comparable metabolic reactions (reduction, oxidation, etc.) from the literature. We used our battery of QSAR models to identify to which CYPs a given compound is a substrate, and adapt metabolic constants for other substrate compounds metabolized by the same CYPs. We used our models to identify substrates and inhibitors to three major enzymes for xenobiotic metabolism, CYP3A4, CYP2D6 and CYP2C9 (6 models based on human clinical data), as supporting evidence in the read-a-cross work.
1.3.3 PBTK modeling In order to develop a PBTK model for a binary mixture of chemicals, PBTK models for the individual compounds have to be developed and validated first. Development of a PBTK model is comprised of several steps.
1. Design of appropriate model architecture for the problem studied (which compartments are relevant to include in the model, which routes of exposures are needed).
2. Find or estimate appropriate parameters, as described above. 3. Develop the model and write the model code.
Optimization of the cumulative risk assessment of pesticides and biocides using computational techniques: Pilot project 15
4. Carrying out simulations and validate the model by comparing with experimental in vivo and in vitro data, when possible.
5. Carry out the PBTK simulations in accordance with the chosen exposure criteria. In this project we consider both oral and dermal exposure, thus we develop an oral exposure model first and add the dermal part afterwards.
Individual PBTK models were developed for each of the model compounds, tebuconazole and prochloraz, as described above. Simulations were carried out for both rats and humans, using the chosen exposure criteria. When the PBTK models for the individual compounds had been appropriately tested and validated, a binary PBTK model was developed for tebuconazole and prochloraz according to the steps described above. In order to optimally evaluate the impact of PBTK modeling on risk assessment, the PBTK simulation has to be made for several theoretical examples of exposure scenarios. The project is primarily focused on low-dose exposures based on realistic exposure scenarios.
1. A set of realistic exposure levels were estimated from values for pesticide residues from food according to the pesticide monitoring program.
2. Similarly, dermal exposure levels were estimated from available data. Before carrying out the low-dose simulations, high-dose simulations were be made in order to validate the models against experimental data from studies in rats, when possible, and to explore overload in metabolic pathways in both humans and rats. Although, humans are normally exposed to relatively low doses of individual pesticides and biocides, overload of specific CYPs may occur due to combined exposure to similar compounds, potentially leading to toxic effects. It was investigated if and when such effects are seen in the PBTK modelling for the binary mixture.

16 Optimization of the cumulative risk assessment of pesticides and biocides using computational techniques: Pilot project

Optimization of the cumulative risk assessment of pesticides and biocides using computational techniques: Pilot project 17
2. Materials and Methods
2.1 Pesticidal action, ADME and toxicology of tebuconazole and prochloraz
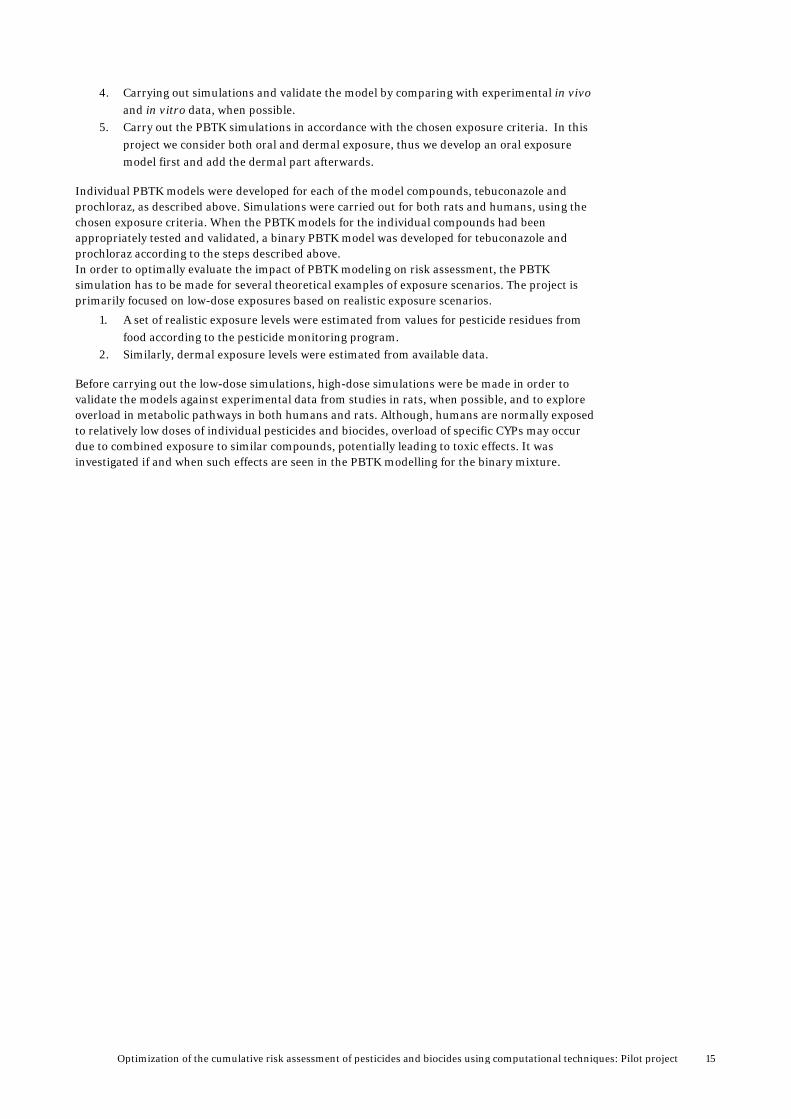
2.1.1 Tebuconazole 2.1.1.1 Pesticidal action Tebuconazole ((RS)-1-p-chlorophenyl-4,4-dimethyl-3-(1H-1,2,4-triazol-1-ylmethyl)pentan-3-ol) (as well as other triazoles) acts by binding to the haeme iron in the cytochrome P450 CYP51 and thereby inhibiting its activity (inhibiting lanosterol-alpha-demethylase activity of CYP51) which is damaging to fungal growth (EFSA, 2009). Lanosterol-alpha-demethylase acitivty is the enzyme that converts lanosterol to cholesterol. 2.1.1.2 ADME Tebuconazole is rapidly and almost completely absorbed from the gastrointestinal tract (GIT) in rats and rapidly distributed (within 1 hour) in the body (EFSA, 2008; JMPR, 2010). Tebuconazole-derived radioactivity was measured in almost all tissues and organs (except compact bone substance) one hour after administration. Very high concentrations were found in the contents of the stomach and some portions of the small intestine, in the preputial gland, areas of the mucosa of nose and tongue and epithelium of the oesophagus. High concentrations were detected in the liver, the cortex of the adrenal gland, the infraorbital gland and the hair follicles of the dorsal skin (JMPR, 2010). Less than 1 % of the administered dose was recovered in tissues and organs 72 hr after exposure, indicating that no accumulation occurs. The terminal half-lives were calculated to 31.9-52.5 hr (JMPR, 2010). In rats tebuconazole is oxidized to simple oxidation products such as tebuconazole-1-hydroxy (M 03) and betuconazole-carboxyl acid (M 06) which are the major metabolites accounting for 15.7-28.2 % and 14.1-36.2 %, respectively, see Figure 2.1. These products can be conjugated to glucuronide and sulphate. Only minor cleavage of the triazole moiety occurs. In males 5.4 % of the administered dose of tebuconazole were metabolised to the free triazole and 1.5 % in that of females (JMPR, 2010). It has been reported that in male rats the primary oxidation products can be further oxidized to triol (M 04) and keto acid (M 07) derivatives and that cleavage for triazole occurred to a higher extent. But these metabolites accounted for less than 10 % of the total 14C in the excreta (JMPR, 2010). Tebuconazole-1-hydroxy (M 03) and its conjugated product (M 11) are also the primary metabolites in lactating goats. In laying hens the primary metabolites are the same as in rats, namely M 03 and M 06 (FAO, 1994). As the same metabolic reactions occur in different animals for which studies are available, it is assumed that tebuconazole undergoes similar metabolic reactions in humans.
18 Optimization of the cumulative risk assessment of pesticides and biocides using computational techniques: Pilot project
Between 72 and 82 % of the administered dose was excreted via faeces in males and about 62 % in female rats 72 hour after oral administration of tebuconazole ([phenyl-UL-14C]-tebuconazole). Urinary excretion was 14-17 % in males and about 29-33 % in females. Male rats with biliary fistulae (bile duct-cannulated) excreted about 91 % of the recovered radioactivity with the bile, about 7 % in urine and 1.5 % in the faeces within 48 hr. The large quantities in the faeces of the intact rats compared to the bile duct-cannulated rats indicate that radioactivity is excreted into the intestinal lumen with the bile under normal circumstances. Within 48 hours after administration the animals with biliary fistulae excreted about half of the quantity of tebuconazole-derived radioactivity in the urine (e.g. 7.4 % at 2 mg/kg BW), compared with the corresponding males of the intact rats (14-15 % at 2 mg/kg BW), which indicate an enterohepatic recirculation of the radioactivity. Further, a high biliary excretion combined with a long-lasting enterohepatic circulation and a relatively low renal elimination rate was also shown by autoradiography (JMPR, 2010).
FIGURE 2.1 METABOLISM OF TEBUCONAZOLE IN RATS. FIGURE FROM (JMPR, 2010).

Optimization of the cumulative risk assessment of pesticides and biocides using computational techniques: Pilot project 19
2.1.1.3 Toxicology Target organs in rats are liver, adrenals and blood system. In dogs the target organs are adrenals/hypertrophy of zona fasciculate cells (JMPR, 2010). An overview of the studies JMPR (JMPR, 2010) used for their toxicological evaluation is given in Appendix 1. An ADI of 0.03 mg/kg BW/day was established based on a NOAEL of 2.9 mg/kg BW/day for histopathological alterations in the adrenal gland in two 52 week toxicity studies in dogs. Tebuconazole is non-irritating to eyes and skin in rabbits and was not found to be a skin sensitizer in guinea-pigs. The lowest relevant dermal NOAEL was 1000 mg/kg BW/day in rabbits (JMPR, 2010). Several endocrine disrupting properties are associated tebuconazole, and have been studied extensively by colleges in our department, among others (Taxvig et al., 2007; Kjaerstad et al., 2010; Kjaerstad et al., 2007; Dreisig et al., 2013; Kongsbak et al., 2013). 1,2,4-triazole is a minor metabolite of tebuconazole. It is well known that some triazoles including 1,2,4-triazole can cause specific cranio-facial malformations. However these malformations for 1,2,4-triazole were found at doses higher than those of the parent compounds (EFSA, 2009). Tebuconazole is, however, not found to cause cranio-facial malformations (JMPR, 2010). As mentioned before only 1.5 % of the administered dose of tebuconazole is metabolized to 1,2,4-triazole in females and 5.4 % in males. Due to the small amount formed in females and the fact that this endpoint is not relevant for males it is concluded, that it is not necessary to describe the risk for these malformations in the PBTK model. 2.1.2 Prochloraz 2.1.2.1 Pesticidal action Prochloraz acts by blocking the fungi ergosterole-biosynthesis by inhibition of steroid demethylation (C14-demethylation). (http://planteapp.dlbr.dk/middeldatabasen/Chemical.asp?ChemicalID=1073#Virkningsmekanisme). 2.1.2.2 ADME
Prochloraz is rapidly absorbed from the gastrointestinal tract and rapidly distributed in the body. It is excreted within 72 hr as metabolites and there is no evidence of accumulation. Faecal excretion is predominating in females (70% in females and 59% in males at low dose) whereas urinary excretion is predominating in males (65% in males, 41% in females at high dose) (JMPR, 2001).
A study with bile duct-cannulated rats showed that [14C]prochloraz was well absorbed, a mean of 74% of the dose (range, 60–96%) being detected in bile, urine, cage washings and carcass. The major route of elimination was biliary excretion (JMPR, 2001). Poor dermal absorption is reported: <2% in pigs.
The biotransformation of prochloraz was studied by giving [14C-phenyl-U]prochloraz (radiochemical purity, > 99%) at a single oral dose of 5 or 100 mg /kg BW” to male and female rats. Prochloraz was seen to be extensively metabolized in rats, where no unchanged compound was detectable in the urine. The main metabolites found were 2,4,6-trichlorophenoxyacetic acid (metabolite 3) and 2-(2,4,6-trichlorophenoxy)ethanol glucuronide conjugate (metabolite 7). These two metabolites accounted for up to 80% of the urinary radiolabel (JMPR, 2001).
20 Optimization of the cumulative risk assessment of pesticides and biocides using computational techniques: Pilot project
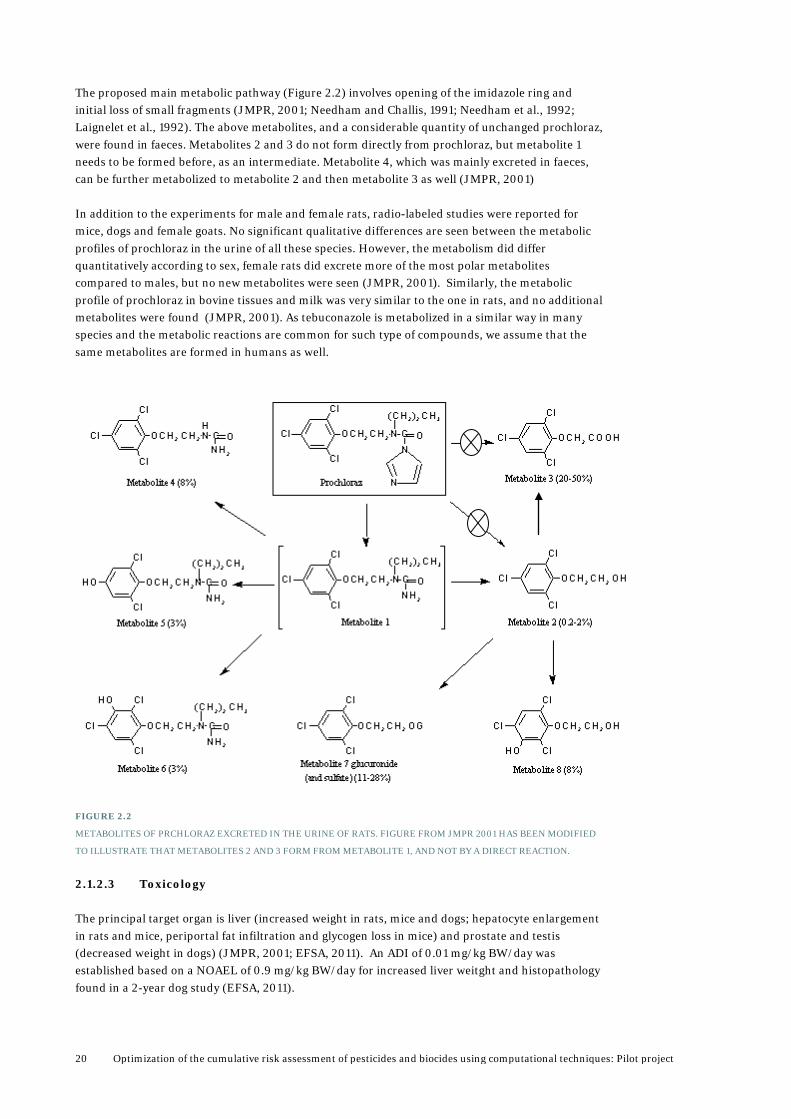
The proposed main metabolic pathway (Figure 2.2) involves opening of the imidazole ring and initial loss of small fragments (JMPR, 2001; Needham and Challis, 1991; Needham et al., 1992; Laignelet et al., 1992). The above metabolites, and a considerable quantity of unchanged prochloraz, were found in faeces. Metabolites 2 and 3 do not form directly from prochloraz, but metabolite 1 needs to be formed before, as an intermediate. Metabolite 4, which was mainly excreted in faeces, can be further metabolized to metabolite 2 and then metabolite 3 as well (JMPR, 2001) In addition to the experiments for male and female rats, radio-labeled studies were reported for mice, dogs and female goats. No significant qualitative differences are seen between the metabolic profiles of prochloraz in the urine of all these species. However, the metabolism did differ quantitatively according to sex, female rats did excrete more of the most polar metabolites compared to males, but no new metabolites were seen (JMPR, 2001). Similarly, the metabolic profile of prochloraz in bovine tissues and milk was very similar to the one in rats, and no additional metabolites were found (JMPR, 2001). As tebuconazole is metabolized in a similar way in many species and the metabolic reactions are common for such type of compounds, we assume that the same metabolites are formed in humans as well.
FIGURE 2.2
METABOLITES OF PRCHLORAZ EXCRETED IN THE URINE OF RATS. FIGURE FROM JMPR 2001 HAS BEEN MODIFIED
TO ILLUSTRATE THAT METABOLITES 2 AND 3 FORM FROM METABOLITE 1, AND NOT BY A DIRECT REACTION.
2.1.2.3 Toxicology The principal target organ is liver (increased weight in rats, mice and dogs; hepatocyte enlargement in rats and mice, periportal fat infiltration and glycogen loss in mice) and prostate and testis (decreased weight in dogs) (JMPR, 2001; EFSA, 2011). An ADI of 0.01 mg/kg BW/day was established based on a NOAEL of 0.9 mg/kg BW/day for increased liver weitght and histopathology found in a 2-year dog study (EFSA, 2011).

Optimization of the cumulative risk assessment of pesticides and biocides using computational techniques: Pilot project 21
Prochloraz is known to have a wide range of toxicological problems, including endocrine disrupting properties (Kjaerstad et al., 2010; Kjaerstad et al., 2007). Fetal toxicity was seen at doses higher than for maternal toxicity. Prochloraz is carcinogenic in mice but not in rats, and EFSA has categorised it as “limited evidence of a cancinogenic effect”. ” It was also concluded that prochloraz is unlikely to be genotoxic (JMPR, 2001). Prochloraz was not seen to affect plasma or erythrocyte cholinesterase activity in rats or dogs (JMPR, 2001; EFSA, 2011). We investigated if some serious toxicological problems were associated with the formed metabolites, especially the 2,4,6-trichlorophenoxyacetic acid (metabolite 3), as it is one of the two metabolites formed in significant quantities. The other metabolites are either formed in relatively small quantities or have conjugated to form a glucoronide or a sulphate, indicating less toxicity. No toxicological information on metabolite 3 was available to us. Toxicological evaluations have been published on the related compounds 2,4-dichlorophenoxyacetic acid (JMPR, 1996) and 2.4,5-trichlorophenoxyacetic acid (JMPR, 1979). Despite that the chlorophenoxyacetic acids has been associated with toxicological problems, mainly due to trace contamination with polychlorinated dibenzo-p-dioxins, this type of compounds are by themselves not generally associated with serious toxicological issues with respect to the liver. Thus, to best of our ability, we do not have evidence for toxicological concerns with respect to metabolite 3, although those can’t be ruled out." Prochloraz is a potent inducer of the hepatic microsomal mixed-function oxidase system, at dose of 100 mg/kg bw and higher. Marginal effect was seen at 10 mg/kg bw. In studies on prochloraz in mice and rats a post-mitochondiral supernatant containing microsomal enzymes was isolated from each liver and analysed for protein and cytochromes P450 and b5 content. Cytochrome P450 enzymes will absorb light at wavelengths of 450 nm which is called the Soret peak. The Soret peak of cytochrome P450 difference spectrum in the present studies was 450 nm. That is, the spectrum of induction was similar to that caused by phenobarbital with an increased content and activity of cytochrome P450 enzymes (JMPR, 2001). Prochloraz is considered as mixed inducer of hepatic CYPs, especially CYP 1A (Rudzok et al., 2009; Laignelet et al., 1989). Prochloraz has been identified as a potent aryl hydrocarbon receptor (AhR) agonist in a human, rat and mouse receptor gene assays (Takeuchi et al., 2008; Kojima et al., 2010; Long et al., 2003), and as pregnane X receptor (PXR) agonist in both mouse and human in vitro receptor gene assays (Kojima et al., 2011; Kojima et al., 2010). Both these receptors are known to induce CYP activity upon activation, PXR induces CYP 3A and CYP 2C (Chen and Nie, 2009; Dvorak, 2011) and AhR is linked to CYP 1A induction (Ma, 2001). Week induction of CYP 2E1 has been reported as well (JMPR, 2001). 2.2 Computational techniques 2.2.1 Physiologically based toxicokinetic (PBTK) modelling, basic concepts PBTK modelling is as a technique for calculating the internal doses (tissue and blood concentrations) after exposure to one or more chemical compounds. This technique, which has found extensive uses in pharmacology, toxicology and for studying volatile organic substances, divides the body into so-called tissue compartment for different part of the body. The underlying biological processes are described by a mathematical description (differential equations) that describe the absorption, distribution, metabolism and elimination (ADME) process the compound undergoes in the human or the animal body. A set a parameters need to be provided to the model, both species specific physiological parameters like tissue weights and blood flows, and a variety of compound specific parameters.

22 Optimization of the cumulative risk assessment of pesticides and biocides using computational techniques: Pilot project
Conceptual representation of a PBTK models in shown in Figures 2.3 and 2.4, which also illustrate that the same model architecture can in principle be used to represent both human and rat. The mathematical formulation would often be the same or similar, but the parameters would differ.
FIGURE 2.3
CONCEPTUAL REPRESENTATION OF A PBTK MODEL WITH BOTH DERMAL AND ORAL EXPOSURE ROUTES FOR A
HUMAN. IN THIS MODEL, LIVER, SKIN AND FAT ARE TREATED AS SEPARATE COMPARTMENT, AND THE REMAINING
TISSUE AND ORGANS ARE LUMPES TOGETHER IN TWO COMPARTMENTS, NAMELY TISSUES WITH SLOW BLOOD
PERFUSIONS (MUSCLE AND BONE), AND TISSUES WITH RAPID BLOOD PERFUSION (KIDNY, BRAIN, LUNGS, HEART
AND SIMILAR).
FIGURE 2.4
CONCEPTUAL REPRESENTATION OF A PBTK MODEL WITH BOTH DERMAL AND ORAL EXPOSURE ROUTES FOR A
RAT. THIS MODEL CORRESPONDS TO THE HUMAN MODEL (FIGURE 2.3, WHERE DIFFERENT SET OF PARAMETERS
NEEDS TO BE USED.
2.2.1.1 Basic mathematical description Basically, each compartment is described by a set of differential equations. For compartments like fat, rapidly and slowly perfused tissues in the example in Figures 2.3 and 2.4, a simple equation for the change in tissue concentration over time (dCt/dt) is used. It is calculated as the difference between the free concentration in the arterial blood entering the tissue (CA) and the free concentration in venous blood leaving the tissue (CV.t), multiplied by the blood flow rate in the tissue (Qt) and divided by the tissue volume (Vt) (Figure 2.5). The free concentration in the venous blood leaving the tissue is calculated as the ratio between the free tissue concentration (Ct) and the blood:tissue partition coefficient (Pt). Simply speaking, the difference between the mass of the compound entering and leaving the tissue is left in the tissue, so mass is preserved.

Optimization of the cumulative risk assessment of pesticides and biocides using computational techniques: Pilot project 23
𝑑𝐶𝑡𝑑𝑡 =
𝑄𝑡𝑉𝑡� 𝐶𝐴 − 𝐶𝑉,𝑡� =
𝑄𝑡𝑉𝑡� 𝐶𝐴 −
𝐶𝑡𝑃𝑡
�
Figure 2.5
REPRESENTATION OF INPUT AND OUTPUT TO A SIMPLE TISSUE COMPARTMENT, WHERE THE COMPOUND IS
DISTRIBUTED VIA THE BLOOD FLOW.
It is a flow based, well-strirred, model assuming that the distribution to the differently tissue compartments occours as an instant equilibrium between the tissue and the blood compartments. The equilibrium above occurs between the unbound (free) blood and tissue concentrations of the compounds, and not between the parts bound to plasma or tissue proteins. This is illustrated in Figure 2.6.
FIGURE 2.6
ILLUSTRATION OF EQUILIBRIUM BETWEEN UNBOUND AND BOUND CHEMICAL IN BLOOD AND TISSUE.
FIGURE 2.7. REPRESENTATION OF INPUT AND OUTPUT TO THE LIVER (T=LIVER) COMPARTMENT, WHERE INPUT FROM THE GIT AND OUTPUT DUE TO METABOLISM NEED TO BE CONSIDERED IN ADDITION TO THE BLOOD FLOWS.
The description of c0mpartments like the liver, where input to the body is provided from the GIT via the portal vein and a part of the compound is removed by metabolism, becomes more complicated (Figure 2.7). The input due to single or repeated oral bolus dose (-dAOL/dt) is often delivered to the liver by a pulse function representing the absorption rate, but the dietary input (A’Dietexp) is normally approximated by a continuous input over a period of time.
𝑑𝐶𝑡𝑑𝑡 =
𝑄𝑡𝑉𝑡� 𝐶𝐴 − 𝐶𝑉,𝑡� −
1𝑉𝑡�−
𝑑𝐴𝑀𝐿𝑑𝑡 –
𝑑𝐴𝑂𝐿
𝑑𝑡 + 𝐴𝐷𝑖𝑒𝑡𝑒𝑥𝑝′ �
The metabolism rate (-dAML/dt) is generally described by Michaelis-Menten kintetics, see the mathematical equation below. Vmax is the maximum velocity of the metabolic reaction, KM is the Michaelis-Menten constant and [S] is the substrate concentration.

24 Optimization of the cumulative risk assessment of pesticides and biocides using computational techniques: Pilot project
𝑑𝐴𝑀𝐿𝑑𝑡 =
𝑉max [S]𝐾𝑀 + [𝑆]
In some cases first and second order kinetics can be used instead. For example when information on the metabolic stability (intrinsic clearance, CLint) of the parent compound is available, the following first order equation can be used at low substrate concentrations. This simple equation does, however, not render accurate results at higher concentrations when the Michaelis-Menten curve becomes non-linear, and especially when saturation of the metabolic enzymes is reached.
𝑑𝐴𝑀𝐿𝑑𝑡 = 𝐶𝐿𝑖𝑛𝑡 [S]
In cases where reversible competitive inhibition occurs, the Michaelis-Menten is modified as follows, where [I] is the inhibitor concentration and KI is the inhibition constant. (Non-competitive and uncompetitive inhibition is not relevant in this report, and thus not presented here.)
𝑑𝐴𝑀𝐿𝑑𝑡 =
𝑉max [S]
𝐾𝑀 �1 + [𝐼]𝐾𝐼� + [𝑆]
As liver is in most cases the main metabolic organ, it is the basic concept in PBTK modelling that all metabolism occurs there. In fact metabolism can occur in other compartments too, and metabolism in other organs would only be implemented in cases where it is substantial and of importance to the problem at hand. Induction can also be included in PBTK models, given that sufficient data are available. Similarly, the concentration changes in the skin compartment (t=skin) is described by,
𝑑𝐶𝑡𝑑𝑡 =
𝑄𝑡𝑉𝑡� 𝐶𝐴 − 𝐶𝑉,𝑡� +
1𝑉𝑡
𝑑𝐴𝐷𝑆𝑑𝑡
where dADS/dt is the amount of compound that is absorbed from the skin surface to the skin at each time point, i.e. the rate of dermal absorption. ADS is the total dermally absorbed dose. Excretion is normally treated by a first order kinetics reaction. The excretion covers both the part of the dose that is not absorbed and is excreted in the faeces and the part of the dose that is absorbed from the GIT. The absorbed dose can both be excreted as mother compound and/or as metabolites in the urine and in some cases also in the faeces via the bile as a result of enterohepatic recirculation. For the compounds studied in this work, the part that enters systemic circulation is practically fully metabolised. The elimination rate (dAE/dt) the sum of all metabolites is described with the following differential equation, which in each specific case can be divided into subparts for urinary and faceal excretion for the metabolites.
𝑑𝐴𝐸𝑑𝑡 = 𝐴𝑀𝑒𝑡𝑎𝑏𝑜𝑙𝑖𝑡𝑒𝑠 𝑘𝑒
AMetabolites, is the total amount metabolites in the body at each time point and ke is the elimination rate constant. This is described in greater detailed in the mathematical description of the individual models, including equations for the blood compartment in Appendix 2 -4.

Optimization of the cumulative risk assessment of pesticides and biocides using computational techniques: Pilot project 25
The mathematical description above is valid for flow based models, that assumes that the compound is distributed and eliminated rapidly, and it does not accumulate in tissue. In cases where accumulation occurs, for example in adipose tissue or liver, it can be necessary to include a deep compartment (a reservoir) in the model (Campbell, Jr. et al., 2012). 2.2.1.2 Modeling tool
The PBTK models were developed in a tool called Berkeley Madonna (http://www.berkeleymadonna.com/), which is a flexible and computationally robust differential equation solver for dynamic modelling of biological systems. This software is widely used, and is provided with a graphical interface that makes it easy to visualize and analyse results from PBTK models. Exposure data and parameters can be changed in a specific window, the simulation results and experimental data can be visualized in a flexible graphical window, and it is possible to overlay several simulations on top of one another. The program has a curve fitting option for adjusting parameters to experimental data, and many more options. The PBTK models were developed by listing parameters and writing the collection of equations in the format required by Berkeley Madonna, see detailed description of the developed models in Appendix 2-5. We used Rosenbrock (stiff) algorithm for all the dynamic simulations presented in this report. 2.2.2 Quantitative Structure-Activity Relationships (QSARs) 2.2.2.1 Basic information on QSAR A QSAR model links information on the chemical structure of compounds with a specific property, and can subsequently be used for predicting the same property for structurally similar compounds, that have not available experimental data for the same properties. This is done by calculating so-called descriptors based on the compounds molecular structure, and then use a statistical method to find correlations between the structural descriptors and the property to be modelled (the target variable). The QSAR model is the mathematical equation resulting from this analysis. There are many types of descriptors used in QSAR. In this work we use generic descriptors, which is a mixture of indices describing connectivity of the atoms and electronic topology of the molecules, as well as a range of molecular property descriptors. The latter are properties like molecular weight, number of hydrogen bond donor or acceptor atoms in the molecule, and the calculated octanol-water partition coefficient (logPow), among others. To measure the quality of the model, we use the correlation coefficient (r2) and the root mean square deviation (rmsd) between the experimental and the calculated target variables in the data set. This is called training performance, and is a measure of how well the regression equation fits the data used to train/ develop the model. In addition we have calculated the performance of the model by using the leave one out (LOO) cross-validation method. In the LOO method, a series of models are developed for all but one molecule in the data set, and the model is then used to predict the target variable for the compound left out. This is done for every compound in the data set, and the cross-validated (CV) correlation coefficient (r2CV) is then calculated between the observed and predicted target variables, the cross validated rmsdCV is calculated as well. In addition, we have left a few data points out and not included them in the model development. These data points are used for so-called external validation, which test how well a model predicts the property for at prediction set not used to develop the model. When the model has been

26 Optimization of the cumulative risk assessment of pesticides and biocides using computational techniques: Pilot project
developed and adequately validated, it can be used for predicting the property for tebuconazole, prochloraz and other similar compounds. 2.2.2.2 Modelling method, Technical Description The experimental data, compound name and identifier, as well as the molecular structures in SMILES (Simplified Molecular-Input Line-Entry System) format, were retrieved from the PK/DB database (Moda et al., 2008) (http://www.pkdb.ifsc.usp.br/pkdb/). In addition we searched for other available data sets in the scientific literature by the use of literature search engines like ISIS Web of Science and SciFinder (chemical abstracts). The data set (id, compound name, SMILES code for the molecular structure and the target variable (the property to be modelled) for each chemical was imported into the SciQSAR software (version 2.3.0.0.12, SciMatics, Inc., http://www.scimatics.com), a set of 208 descriptors were generated, and exported with the rest of the data set to a sdf-file (a file format used to host both molecular structures and data). The sdf-file was imported into the Molegro Data Modeller (MDM) software (version 2.6.0, CLC bio, http://www.clcbio.com/products/molegro/) and the QSAR models were developed and validated. SciQSAR uses generic descriptors like molecular connectivity indices, electrotopological (E-state and HE-state) indices and molecular properties, among others (Contrera et al., 2005). Two additional descriptors were calculated with ACD-labs logD tool-box in ACD/ToxSuite (version 2.95, ACD/Labs, http://www.acdlabs.com/products/pc_admet/tox/tox/). These tw0 descriptors, namely the distribution coefficients (logD) at pH=7.0 and pH=7.4 (pH of blood), were added to the descriptor matrix (table) in MDM, together with the descriptors generated by SciQSAR. logD has been reported as a descriptor that correlates well with properties like VdSS, and therefore we added it to the pool of descriptors used for the QSAR modeling. The calculated logD values are listed in Table 3.4 and Appendix 7. Before developing a QSAR model, a correlation matrix, listing the correlation coefficients between the different descriptors in the given data set was calculated. For descriptors with 95% internal correlation or higher, only one of the descriptors were kept and the others were removed from the data set. In such a way, redundancy and interdependency between the descriptors is largely reduced. Also descriptors with no variance in the given data set (descriptors with identical values for all data points) were removed. Two different statistical methods (Partial Least Square (PLS) regression (Hasegawa and Funatsu, 2010; Stanton, 2012) and Support Machine Vector (SVM) regression) (Byvatov and Schneider, 2003) were used for the model development. The volume of distribution and renal clearance QSARs were developed using PLS. In each case the best descriptors were selected by a forward selection (heuristic) method. This was done by minimizing the rmsd between the predicted and the experimental values, while training the model in a 10-fold cross-validation. In each case the number of PLS-factors (latent variables) and descriptors was varied and optimized by developing a series of QSAR models. The criteria was to use as few PLS-factors and descriptors as possible, to ensure good predictivity of the model and to avoid over-fitting. PLS, like other linear regression methods, is sensitive to the number of variables used in the model. The protein plasma binding QSAR was developed with the SVM method. Simply speaking, this method transforms data (target variables) which are non-linear with respect to the descriptors used, by so-called kernel function, such that a linear relationship can be obtained between the descriptors and the target variable. The SVM method requires optimization of some model specific constants.

Optimization of the cumulative risk assessment of pesticides and biocides using computational techniques: Pilot project 27
The two most important constants are the γ parameter of the radial distribution function, which we use as a kernel, and the cost function, which is simply speaking a tolerance for the fit. The resulting QSAR model were validated on data not used in the given model and finally used for predicting the same property for tebuconazole, prochloraz, and in some cases for their most important metabolites as well.

28 Optimization of the cumulative risk assessment of pesticides and biocides using computational techniques: Pilot project

Optimization of the cumulative risk assessment of pesticides and biocides using computational techniques: Pilot project 29
3. The developed PBTK models
PBTK models were developed for tebuconazole and prochloraz as single compounds. Discussion on the choice of compartments and detailed mathematical formulation of the model is given below, as well as the selection of parameters for both models. Finally, the binary model for these two compounds is described, along with the additional parameters needed for the binary model. Overview of PBTK models developed in this project is given in Figure 3.1. (An additional binary model was developed, where the two enantiomers of tebuconazole, R- and S-, were treated as separate compounds.)
FIGURE 3.1. OVERVIEW OF PBTK MODELS DEVELOPED IN THIS PILOT PROJECT. EXTRA MODELS FOR RHESUS MONKEY AND RABBIT WERE DEVELOPED FOR TEBUCONAZOLE, AS THESE WERE NEEDED FOR MODEL VALIDATION PURPOSES.
We set up a simple modular approach to ease the development of binary models from the single compound models, and it is intended to be extended to multi-component mixtures at a later stage. It was also used for developing new single compound models by using features from other models (Figure 3.2). The Berkeley Madonna model code was divided into three sections:
1. List of species specific physiological parameters for each species (rat and human). 2. List of chemical and species specific parameters for each compound. 3. The equation section for specific sub-models for the specific compounds (list of equations).
Also the equation part was divided into subsections associated with each tissue/ organ. In addition, a name system was defined, ensuring that each compound is assigned a unique name, and that all the parameters and variables for this compound are labelled with this name.
1. In a single compound model the mother compound is labelled C1M0 (compound 1, metabolite 0) and the metabolites are labelled C1M1 (compound 1, metabolite 1). (If more than one metabolite is considered separately in the model, the different metabolites are assigned running numbers).
2. When a binary model is constructed, all parameters and variables for one of the compounds assigned a new name, C2M0 for the mother compound, and C2M1 for the metabolites, by word replacement.
It should be mentioned that a PBTK model for each individual compound is always unique, and that a number of compound specific issues have to be considered. This is especially important in the case of the metabolism, where the set of equations is specific for the metabolic pathway of the compound considered, and for the elimination as well. Thus in our approach we use a collection of basic equations similar to many compounds and equations tailored to specific compounds. The modular

30 Optimization of the cumulative risk assessment of pesticides and biocides using computational techniques: Pilot project
approach should thus be suitable to accommodate a broad variety of compounds, and also to accommodate PBTK simulations of other biological processes than those included in the present PBTK models.
FIGURE 3.2. SCHEMATIC VIEW OF THE MODULAR APPROACH USED FOR COMBINING SINGLE COMPOUND MODELS TO MODELS FOR BINARY MIXTURES IN BERKELEY MADONNA.
3.1 The PBTK model for tebuconazole 3.1.1 Choice of compartments for the Tebuconazole Model In a PBTK model target organs have to be described as separate compartments. The target organs for tebuconazole are liver, adrenals and blood. As liver is the main target of interest to this project, and due to lack of data on adrenals (e.g. on the tissue composition of neutral and phospholipids necessary for calculating the adrenal:blood partition coefficient), it was decided not to make a specific adrenal compartment in the model. In the PBTK model for tebuconazole we also want to simulate dermal exposure and therefore, a skin compartment is also included. The rest of the body is described by two compartments: rapidly perfused and slowly perfused tissues. The rapidly perfused tissue includes tissues like kidney, brain, heart, lung, thyroid, testis and hepatoportal system, and the slowly perfused tissues includes muscle, skin, adipose (fat) (Brown et al., 1997; Renwick, 2001). Excretion of tebuconazole metabolites, both in faeces via the bile and in the urine, is described by a separate excretion compartment. This is a commonly used method in PBTK modelling, to avoid developing complicated models. A schematic presentation of the PBTK model for tebuconazole is shown in Figure 3.3.
As described earlier, tebuconazole administered orally is rapidly absorbed and excreted within 72 hr. Therefore in the model a 100 % instant absorption (Fa=1) and 100 % excretion within 72 hr is assumed. The molecular weight (MW) of tebuconazole is 0.3078 mg/µmol.
Optimization of the cumulative risk assessment of pesticides and biocides using computational techniques: Pilot project 31
FIGURE 3.3. PBTK MODEL FOR TEBUCONAZOLE. THE BLACK PART IS INPUT TO THE MODEL, THE GREEN PART DESCRIBES THE DISTRIBUTION IN THE COMPARTMENTS AND METABOLISM (IN LIVER) AND THE BLUE PART DESCRIBES THE EXCRETION OF METABOLITES IN EITHER URINE OR FAECES.
The ADME studies described in a previous section indicated an enterohepatic recirculation. In general higher molecular weight compounds can be found in the bile. They enter the intestine after storage in the gallbladder and they may be reabsorbed in the intestine to complete an enterohepatic cycle, see Figure 3.4 (Tozer et al., 2006).

32 Optimization of the cumulative risk assessment of pesticides and biocides using computational techniques: Pilot project
FIGURE 3.4 WHEN A CHEMICAL IS EXCRETED FROM THE LIVER INTO THE BILE IT IS STORED IN THE GALLBLADDER. WHEN THE GALLBLADDER IS EMPTYING (ESPECIALLY WHEN INDUCED BY FOOD) THE CHEMICAL ALSO PASSES INTO THE LUMEN OF THE SMALL INTESTINE. IF IT AFTERWARDS IS ABSORBED FROM THE SMALL OR LARGE INTESTINE INTO THE PORTAL BLOOD SYSTEM AND TRANSPORTED INTO THE LIVER, IT IS SAID TO HAVE COMPLETED THE ENTEROHEPATIC CYCLE, SHOWN AS DASHED LINES IN THE FIGURE. FIGURE IS FROM (TOZER ET AL., 2006).
It was considered whether the enterohepatic recirculation should be included in the present model or not. Enterohepatic recirculation is relevant in rats for anionic compounds with a molecular weight above 325 +/- 50 g/mol and for humans at 500 +/- 50 g/mol (Millburn et al., 1967; Yang et al., 2009). Above this threshold it is expected that the compound will undergo substantial biliary excretion (Yang et al., 2009). The molecular weight of tebuconazole is 307.8 g/mol and that of glucoronide (M11 in Figure 1) is 497.9 g/mol. The molecular weight for tebuconazole is below the threshold for enterohepatic recirculation in humans but for the glucoronide metabolite it is within the range. In rats it may be relevant especially for the glucoronide. However, it was decided to omit a description of enterohepatic recirculation in the model due to lack of parameters to describe this. It is important to keep a PBTK model as simple as possible but still biological plausible. For every new compartment or feature, additional parameters are needed, and thus more data are needed for determining the parameters. Such increased complexity is not necessarily equal to accuracy and usefulness of the model but may instead create greater uncertainty in the model description. By using a technical excretion compartment, we can develop a relatively simple PBTK model that is focused on the main target organ of the studied compounds, namely the liver. 3.2 PBTK model for prochloraz 3.2.1 Choice of compartments for the Prochloraz Model The PBTK model for prochloraz is similar to the model for tebuconazole, with the change that the skin compartment is omitted, see Figure 3.5. Prochloraz is only used as pesticide and not as a biocide. Dermal exposure has not been included in the prochloraz model, and therefore there is no need for a skin compartment. Instead the skin is included in slowly perfused tissue compartment together with muscle and bone. A special compartment was made for adipose tissue, due to the

Optimization of the cumulative risk assessment of pesticides and biocides using computational techniques: Pilot project 33
special properties of fat, and the rapidly perfused compartment for prochloraz consists of the same tissue as the corresponding compartment for tebuconazole (Figure 3.5). (It is easy add a skin compartment and dermal exposure to the model if need arises). Liver is a separate compartment, as the main target organ and the main site of metabolism. The main focus of this project is the toxicity in the liver, and since we do not have sufficient parameters to describe the other target organs, prostate and testis, these are not included in the model as separate compartments. As described earlier, on average 74% of prochloraz administered orally is rapidly absorbed, and the remaining prochloraz is excreted in faeces. The fraction of prochloraz that is absorbed into the blood stream is fully metabolised and excreted. In the model 74 % instant absorption (Fa=0.74) and 100 % excretion within 72 hr is assumed. The molecular weight (MW) of prochloraz is 0.3767 mg/µmol.
FIGURE 3.5. PBTK MODEL FOR PROCHLORAZ. THE BLACK PART IS INPUT TO THE MODEL, THE GREEN PART DESCRIBES THE DISTRIBUTION IN THE COMPARTMENTS AND METABOLISM (IN LIVER) AND THE BLUE PART DESCRIBES THE EXCRETION OF METABOLITES IN EITHER URINE OR FAECES.
3.3 Parameters for the PBTK Models A PBTK model is a set of differential equations that model the absorption, distribution, metabolism and elimination (ADME) processes of a compound in the in body. They are used to calculate concentrations of compounds, for example environmental contaminants, in the blood, tissues and organs up on exposure. The model relays on a good mathematical description of these processes, and good parameters that describe the physiology of the species and properties of the chemical substances. The parameters needed for the models developed in this project are listed in Table 3.1. The different parameters are discussed in this section, with the exception of parameters determined on the basis of quantitative structure-activity relationships (QSARs), presented in section 3.2.1. 3.3.1 Physiological parameters No international accepted set of reference values of physiological parameters have been compiled. Several groups of scientists have created compendia of reference values of physiological parameters for adult as well as for young animals and humans for use in PBTK modelling e.g. (Brown et al., 1997; Davies and Morris, 1993; Thompson et al., 2009; U.S.EPA, 2009; U.S.EPA, 1988). It was

34 Optimization of the cumulative risk assessment of pesticides and biocides using computational techniques: Pilot project
decided to use the very comprehensive paper from Brown and co-workers (Brown et al., 1997). This paper provides a valuable overview of the physiological parameters for both rats and humans to be used in PBTK models and it has previously been used in several PBTK models (e.g. (Belfiore et al., 2007; Brightman et al., 2006; Chan et al., 2006; Chen et al., 2009; Clewell, III et al., 2001; Dennison et al., 2004; Fisher et al., 2004; Godin et al., 2010; Jonsson and Johanson, 2002; Kim et al., 2007; Lee et al., 2002; Lowe et al., 2009; McMullin et al., 2003; Mirfazaelian et al., 2006; Nong et al., 2008; Poet et al., 2004; Reddy et al., 2003; Timchalk and Poet, 2008; Zhang et al., 2007)). Volumes of arterial and venous blood were taken from Igari et al. (Igari et al., 1983), see Table 3.2. Table 3.3 shows the physiological parameters to be used in the PBTK models in this project. TABLE 3.1. PHYSIOLOGICAL, PHYSICO-CHEMICAL AND TOXICOKINETIC PARAMETERS USED FOR THE PBTK MODELS. THE SECTIONS, WHERE THE DIFFERENT PARAMETERS ARE DISCUSSED, ARE LISTED IN PARENTHESIS.
Physiological parameters (species specific)
Physico-chemical & toxicokinetic parameters (compound and species specific)
• Body weight (BW) (section 3.3.1.1 )
• Tissue volumes (Vt) (section 3.3.1.1)
• Cardiac output (QC) (section 3.3.1.2)
• Blood flow rate in tissues (Qt) (section 3.3.1.2)
• Surface area of skin (SA) (section 3.3.3.1)
• Molecular weight (MW) (sections 3.1.1, 3.2.1)
• Fractional intestinal absorption (Fa) (sections 3.1.1, 3.2.1) Tissue:blood partition coefficients (Pt) (section 3.3.2.1)
• Michaelis-Menten constant ( KM) (section 3.3.2.2 )
• Maximum velocity of metabolic reaction (Vmax) (section 3.3.2.2)
• First order elimination rate constants (ke) (section 3.3.2.3 )
• Volume of distribution (VdSS) (section 4.1.2.1)
• % Plasma-protein binding (%PPB) (section 4.1.2.2)
• Skin:surface partion coefficient (Pskin:surface) (sections 3.3.2.1, 3.3.3.2 )
• Skin permeability (Kp) (sections 3.3.3.2 )
3.3.1.1 Body weight (BW) and Tissue volumes as percentage of BW The values for tissue volumes as percentage of BW in Table 3.3 is summed up to 86.1 % for rat and up to 86.6 % for human. The tissue volumes as percentage of body weight is supposed to sum up to 100 %, however this will seldom be fulfilled. For practical reasons, the gastrointestinal tract (2.7 % in rat and 1.7 % in human) was excluded from the model, and the bone marrow (2.3 % in rat and 7.2 % in human) was not considered relevant. Another reason for not summing up to 100 % is that the values are means derived from multiple studies (Brown et al., 1997). The volume of arterial and venous blood was calculated from data in (Igari et al., 1983). Tissue volumes (Vt) in [l] were calculated by (Vt = BW Vp,t/100), where Vp,t are the tissue volumes as percent of BW.

Optimization of the cumulative risk assessment of pesticides and biocides using computational techniques: Pilot project 35
TABLE 3.2 MEAN VALUES FOR BLOOD VOLUME AND % OF BW OF 0.25 KG RAT AND 70 KG HUMAN (BROWN ET AL., 1997).
Volume [ml] from (Igari et al., 1983)
% of BW
Blood Rat Human Rat (0.250 kg) Human (70 kg)
Artery 6.8 1800 2.72 2.57
Vein 13.6 3600 5.44 5.14
Artery+vein - - 8.16 7.71 3.3.1.2 Cardiac output, Organ blood flows as percentage of cardiac output The cardiac output were found in unanesthetized rats and humans to be 110.4 ml/min and 5200 ml/min (Brown et al., 1997). These values are recalculated to the unit l/hr:
𝑄𝑐(𝑟𝑎𝑡) = 110.4 𝑚𝑙/𝑚𝑖𝑛 60 𝑚𝑖𝑛/ℎ𝑟1000 𝑚𝑙/𝑙 = 6.6 𝑙/ℎ
𝑄𝑐(𝑟𝑎𝑡) = 5200 𝑚𝑙/𝑚𝑖𝑛 60 𝑚𝑖𝑛/ℎ𝑟1000 𝑚𝑙/𝑙 = 312 𝑙/ℎ
Andersen and co-workers (Andersen et al., 1987) have calculated the cardiac output (QC) by the following equation:
𝑄𝑐(𝑟𝑎𝑡) = 15𝑙
ℎ𝑟 𝑘𝑔0.74 𝐵𝑊0.74 = 15
𝑙ℎ𝑟 𝑘𝑔0.74 (0.25 𝑘𝑔)0.74 = 5.4
𝑙ℎ𝑟
𝑄𝑐(𝑟𝑎𝑡) = 15𝑙
ℎ𝑟 𝑘𝑔0.74 𝐵𝑊0.74 = 15
𝑙ℎ𝑟 𝑘𝑔0.74 (70 𝑘𝑔)0.74 = 310
𝑙ℎ𝑟
There is good agreement between the measured values of cardiac output and the calculated values. The values for organ blood flows as percentage of cardiac output for rat in Table 3.3 are summed up to 94.7 % and for human 92.7 %. Organ blood flows (Qt in [l/hr]) were calculated by (Qt = QC Qp,t/100), where Cp,t are the tissue volumes as percent of QC. 3.3.2 Compound specific parameters 3.3.2.1 Partition Coefficients The tissue.blood partition coefficients were determined based on the volume fractional content of water (Fw), neutral lipids (Fnl) and phospholipids (Fph) in wet tissue and the compounds octanol:water partition coefficient (Pow). For orally administrated compounds, the tissue:blood partition coefficient (Ptb also labelled Pt) is calculated as the ratio between the solubility of the compound in tissue and blood (Pt:b), respectively, multiplied the ratio between fraction of unbound compound in blood (fu,b also labelled fu) and tissue (fu,t).
𝑃𝑡 = 𝑃𝑡𝑏 = 𝑃𝑡:𝑏 × 𝑓𝑢,𝑏
𝑓𝑢,𝑡=
�𝑃𝑜𝑤 �𝐹𝑛𝑙,𝑡 + 0.3 𝐹𝑝ℎ,𝑡� + �𝐹𝑤,𝑡 + 0.7𝐹𝑝ℎ,𝑡��
�𝑃𝑜𝑤 �𝐹𝑛𝑙,𝑏 + 0.3 𝐹𝑝ℎ,𝑏� + �𝐹𝑤,𝑏 + 0.7𝐹𝑝ℎ,𝑏�� ×
𝑓𝑢,𝑏
𝑓𝑢,𝑡
The volume fractional contents for the majority of tissue were taken from the paper by Poulin and Theil (Poulin and Theil, 2002) , who have made a comprehensive analysis and a revised list of values based available handbooks and scientific papers. Values for human whole blood and rat

36 Optimization of the cumulative risk assessment of pesticides and biocides using computational techniques: Pilot project
erythrocytes were taken from Poulin and Krishnan (Poulin and Krishnan, 1996; Poulin and Krishnan, 2001) . There are some differences are among volume fractional contents used in different studies (Rodgers et al., 2005; Rodgers and Rowland, 2006; Peyret et al., 2010; Fenneteau et al., 2010), and the work by Poulin and Theil (Poulin and Theil, 2002) was the most comprehensive and up to date work. (Pt:p is calculated in the same way, where blood values are replaced by the corresponding volume fractional contents for plasma.) As tebuconazole undergoes relatively fast excretion from the body we find it unlikely that it binds to proteins in tissue interstitial space, thus we have set fu,t=1. Thus we consider that tebuconazole only binds to plasma proteins. The fraction unbound in blood (plasma) has been predicted by QSAR, based on corresponding values for similar compounds, see below. TABLE 3.3. PHYSIOLOGICAL PARAMETERS FOR THE PBTK MODELS. DATA FROM (BROWN ET AL., 1997) IF NOT OTHERWISE STATED.
Parameter Rat Human Rabbit
BW (kg) 0.250 70 2.12 (mean value from (Zhu et al., 2007))
Tissue volume as percentage of body weight [l/kg BW]
Vp,liver 3.66 (± 0.65) 2.57 2.87
Vp,skin 19.0 (± 2.62) 3.71
Vp,rperfused
(=brain+heart+kidney+lung+pancreas+ spleen+thyroid+adrenal)
0.57+0.33+0.73+ 0.50+0.32+0.20+ 0.005+0.019=2.67
2.0+0.47+0.44+ 0.76+0.14+0.26+ 0.03+0.02=4.12
Vp,sperfused (=muscle+bone) 40.43+5.0+= 45.43 40.00+7.1= 47.1
Vp,fat (=adipose) 7.21 21.42
Vp,venous (Igari et al., 1983) 5.44 5.14
Vp,arterial (Igari et al., 1983) 2.72 2.57
Vp_blood (venous+arterial) 8.16 7.71
Cardiac output [l/hr]
QC 6.6 312 33 (calculated from rat value)
Organ blood flows as percentage of cardiac output
Qp,liver 18.3 22.7
Qp,skin 5.8 5.8
Qp,rperfused
(=brain+heart+kidney+lung+adrenal) 2.0+5.1+14.1+2.1+0.3=23.6
11.4+4.0+17.5+2.5+0.3=35.7 (bronchial flow for lungs, rat values for adrenals)
Qp,sperfused (=muscle+bone) 27.8+12.2=40.0 19.1+4.2+=23.3
Qp,fat (=adipose) 7.0 5.2

Optimization of the cumulative risk assessment of pesticides and biocides using computational techniques: Pilot project 37
Experimentally determined Pow values at 25ºC were used for the two compounds: logPow for tebuconazole is 3.7 (Chimuka et al., 2009; Baugros et al., 2009; Coscolla et al., 2009) The corresponding value for prochloraz is 4.10-4.12 (Giordano et al., 2009; Coscolla et al., 2009). logPow=4.12 was used. Due to the special properties of adipose tissue (fat), which is particularly rich in neutral lipids, it is recommend to use the vegetable oil water partition coefficient (logPwow) rather than logPow for evaluating Pt. Pwow was calculated with the following correlation from (Poulin and Haddad, 2012).
𝑙𝑜𝑔𝑃𝑤𝑜𝑤 = 1.099 𝑙𝑜𝑔𝑃𝑜𝑤 − 1.31 Table 3.4 shows the used composition of blood and tissue, and the estimated partition coefficients are listed in Table 3.5.

38 Optimization of the cumulative risk assessment of pesticides and biocides using computational techniques: Pilot project
TABLE 3.4. THE COMPOSITION OF BLOOD AND TISSUE. VALUES FOR RAPIDLY AND SLOWLY PERFUSED TISSUE WERE CALCULATED FROM THE COMPOSITION OF THE INDIVIDUAL TISSUES (POULIN AND THEIL, 2002; POULIN AND KRISHNAN, 1996), WEIGHTED BY THE FRACTION OF BW (BROWN ET AL., 1997; POULIN AND THEIL, 2002).
Tissue volume Tissue composition
(Fraction of BW) (Volume fractional content of wet tissue weight)
[l/kg])
Water (Fw) Neutral lipids (Fnl) Phospholipids (Fph)
Rat Human Rat Human Rat Human Rat Human
Adipose 0.072 0.214 0.120 0.180 0.853 0.790 0.0020 0.0020
Bone 0.050 0.071 0.446 0.439 0.027 0.074 0.0027 0.0011
Brain 0.006 0.020 0.788 0.770 0.039 0.051 0.0533 0.0565
Gut 0.027 0.017 0.749 0.718 0.029 0.049 0.0138 0.0163
Heart 0.0033 0.0047 0.779 0.758 0.014 0.012 0.0118 0.0166
Kidney 0.0073 0.0044 0.771 0.783 0.012 0.021 0.0284 0.0162
Liver 0.037 0.026 0.705 0.751 0.014 0.035 0.0303 0.0252
Lung 0.005 0.008 0.790 0.811 0.022 0.003 0.0140 0.0090
Muscle 0.404 0.400 0.756 0.760 0.010 0.024 0.0090 0.0072
Skin 0.200 0.037 0.651 0.718 0.024 0.028 0.0180 0.0111
Spleen 0.0020 0.0026 0.771 0.788 0.008 0.020 0.0136 0.0198
Blood 0.082 0.077 0.812 0.820 0.0013 0.0033 0.0022 0.0024
Plasma 0.045 0.042 0.960 0.945 0.0015 0.0035 0.0008 0.0023
Erythrocytes 0.037 0.035 0.630 0.640 0.0012 0.0039
Rapidly perfused tissues:
Brain+heart+kidney+lung+spleen 0.780 0.779 0.021 0.032 0.028 0.036
Slowly perfused tissues:
Bone+muscle 0.722 0.712 0.012 0.031 0.008 0.006
The bone partition coefficient for human in Table 3.5 is, surprisingly, equally large as the different tissue partition coefficients, which is odd. Pesticides like tebuconazole and prochloraz are not considered to distribute much in bone tissue. As the equation used for estimating the partition coefficients only considers lipid and water content in tissues, only half of the bone material is taken into account when calculating Pbone (see Table 3.4). This might introduce inaccuracies, resulting in the relatively high value obtained for bone. We decided to use the partition coefficient for muscles for both for muscle and bone tissue instead. The calculated partition coefficient for lung is strangely low compared to those of other tissue for human. Lung is less that 1% of human BW, but is ca. one fifth of the rapidly perfused compartment.

Optimization of the cumulative risk assessment of pesticides and biocides using computational techniques: Pilot project 39
As lung is not a target organ for neither tebuconazole nor prochloraz, the accuracy of this partition coefficient is of less importance than for example the corresponding coefficient for the liver. We might, however use the rat value for human in this case, because we find the calculated value unlikely to provide realistic partitioning between lung and blood in human. TABLE 3.5. THE ESTIMATED TISSUE:BLOOD AND TISSUE:PLASMA PARTITION COEFFICIENT FOR TEBUCONAZOLE AND PROCHLORAZ. FOR ADIPOSE TISSUE, PARTITION COEFFICIENTS HAVE BOTH BEEN CALCULATED BASED ON BOTH PWOW AND POW, WITH THE TISSUE COMPOSITION GIVEN IN TABLE 3.4.
Tebuconazole Prochloraz
Partition coefficients Partition coefficients
Pt:b Pt:p Pt:b Pt:p
Rat Human Rat Human Rat Human Rat Human
Adipose (Pwow)
45 22 51 21 52 24 60 23
Adipose (Pow) 394 189 447 181 413 194 480 186
Bone 13.0 17.8 14.8 17.1 13.6 18.2 15.8 17.5
Brain 25.6 16.3 29.0 15.6 26.7 16.7 31.0 16.0
Gut 15.5 12.8 17.5 12.3 16.2 13.1 18.8 12.6
Heart 8.2 4.0 9.3 3.8 8.5 4.1 9.9 3.9
Kidney 9.7 6.1 11.0 5.9 10.1 6.3 11.7 6.0
Liver 10.6 10.2 12.1 9.7 11.1 10.4 12.9 10.0
Lung 12.1 1.4 13.7 1.3 12.7 1.4 14.7 1.4
Muscle 5.9 6.2 6.7 6.0 6.2 6.4 7.2 6.1
Skin 13.6 7.6 15.4 7.3 14.2 7.8 16.5 7.5
Spleen 5.5 6.3 6.2 6.0 5.7 6.4 6.6 6.1
Blood 1.0 1.0 1.0 1.0
Plasma 1.0 1.0 1.0 1.0
Erythrocytes 1.3 1.3
Rapidly perfused
13.5 10.1 15.3 9.7 14.1 10.4 16.3 10.0
Slowly perf. 6.7 8.0 7.6 7.7 7.0 8.2 8.1 7.8
Pskin:surface 0.0294 0.0319 0.0294 0.0318

40 Optimization of the cumulative risk assessment of pesticides and biocides using computational techniques: Pilot project
3.3.2.2 Parameters for Metabolism Tebuconazole: Metabolic constants for tebuconazole depletion measured in male rat microzomes are available in the literature (Shen et al., 2012). This study assessed the metabolic constants for the S- and the R- enantiomer separately, without and with the presence of the other enantiomer as an inhibitor (Table 3.6). Competitive inhibition was revealed between the two enantiomers in interaction studies, with the R-form being five times more potent inhibitor than the S-form (IC50R/S/IC50S/R = 4.98). Rac-tebuconazole was found to degrade by first-order kinetics, with the S-form degrading faster than the R-form (t1/2 = 22.31 min vs. t1/2 = 48.76 min). TABLE 3.6. VMAX AND KM PARAMETERS OF TEBUCONAZOLE (TEB) DEPLETION, ESTIMATED BY KINETIC CURVE-FIT EQUATION TO MALE RAT LIVER MICROSOME IN VITRO DATA. THE VMAX VALUE HAS BEEN CONVERTED TO ACCOUNT FOR THE METABOLIC CAPACITY OF ALL LIVER PROTEINS (SHEN ET AL., 2012).
Sample Vmax KM R2 Vmax VmaxC
[µM min-1 mg-1 protein]
[µM] [µmol hr-1] [µmol hr-1
kg-0.75]
R-TEB 1.27 ± 0.06 14.83 ± 2.19 0.992 67.8 192
R-TEB with S-TEB (inhibitor) 1.27 ± 0.19 55.76 ± 15.18 0.985 67.8 192
S-TEB 0.83 ± 0.07 12.23 ± 2.72 0.984 44.3 125
S-TEB with R-TEB (inhibitor) 0.88 ± 0.11 31.70 ± 8.97 0.974 47.0 133
Racemic R-TEB and R-TEB 1.05 13.53 56.1 159
The experimentally in vitro determined Vmax needs to be converted to the corresponding value for the whole liver. The authors have reported Vmax in the unit [µM min-1 mg-1 protein] instead of [µmol min-1 mg-1 protein], they also report that 1 ml of solution contains 0.5 mg protein, e.g. 1 mg of protein is contained in 2 ml of solution. Thus we have to calculate how much tebuconazole there is in 2 ml of solution, because that is the amount that corresponds to 1 mg of protein.
1.0 𝜇𝑀
min ∙ 𝑚𝑔 𝑝𝑟𝑜𝑡𝑒𝑖𝑛 ≡ 1 𝜇𝑚𝑜𝑙1000𝑚𝑙
∗1𝑚𝑖𝑛
∗2 𝑚𝑙 𝑠𝑜𝑙𝑢𝑡𝑖𝑜𝑛𝑚𝑔 𝑝𝑟𝑜𝑡𝑒𝑖𝑛
= 0.002 𝜇𝑚𝑜𝑙
min ∙ 𝑚𝑔 𝑝𝑟𝑜𝑡𝑒𝑖𝑛
𝑤𝑒𝑡 𝑤ℎ𝑜𝑙𝑒 𝑙𝑖𝑣𝑒𝑟 𝑤𝑒𝑖𝑔ℎ𝑡 =𝑙𝑖𝑣𝑒𝑟, 𝑝𝑒𝑟𝑐𝑒𝑛𝑡 𝑜𝑓 𝐵𝑊
100∗ 𝐵𝑊 =
3.66100 ∗ 250 𝑔 = 9.15 𝑔
𝑓 = 𝑚𝑔 𝑚𝑖𝑐𝑟𝑜𝑠𝑜𝑚𝑎𝑙 𝑝𝑟𝑜𝑡𝑒𝑖𝑛
0.695 𝑛𝑚𝑜𝑙 𝑃450 ∗ 33.8 𝑛𝑚𝑜𝑙 𝑃450𝑔 𝑤𝑒𝑡 𝑙𝑖𝑣𝑒𝑟 ∗ 9.15 𝑔 𝑤𝑒𝑡 𝑙𝑖𝑣𝑒𝑟 = 445 𝑚𝑔 𝑝𝑟𝑜𝑡𝑒𝑖𝑛
Thus, as an example, Vmax of a racemic mixture of R- and S- tebuconazole is:
𝑉max = 1.05 𝜇𝑀
min ∙ 𝑚𝑔 𝑝𝑟𝑜𝑡𝑒𝑖𝑛 ∗ 0.002 𝜇𝑚𝑜𝑙 𝜇𝑀 ∗ 445 𝑚𝑔 𝑝𝑟𝑜𝑡𝑒𝑖𝑛 ∗ 60
𝑚𝑖𝑛ℎ𝑟 = 56.1
𝜇𝑚𝑜𝑙ℎ𝑟
VmaxC is then calculated as follows:
𝑉𝑚𝑎𝑥𝐶 =𝑉𝑚𝑎𝑥
𝐵𝑊0.75 = 56.1 𝜇𝑚𝑜𝑙ℎ𝑟
0.250 𝑘𝑔0.75 = 159 𝜇𝑚𝑜𝑙
ℎ𝑟 ∙ 𝑘𝑔0.75

Optimization of the cumulative risk assessment of pesticides and biocides using computational techniques: Pilot project 41
As a racemic mixture of tebuconazole is used as a fungicide, it was decided to use the mean of the Vmax and KM values for the R- and S-forms in their pure form for the PBTK modeling in this project. Also simulations for each of the enantiomers will be carried out. The corresponding values for the R- and S-forms in the presence of the other form as an inhibitor, reflects the metabolism of one of the enantiomer as affected by the inhibition caused by the other enantiomer. No information on the corresponding metabolic constants in human cells was found. By examining metabolic constants for similar compounds available in the literature (see Appendix 6), it is seen that there are significant species, gender and individual differences that need to be considered when deciding parameters for use in the PBTK simulations. In such cases, the traditional method is to use to use the same KM value and to use allometric scaling for Vmax (Campbell, Jr. et al., 2012).
𝑉max(ℎ𝑢𝑚𝑎𝑛) = 𝑉𝑚𝑎𝑥𝐶(𝑟𝑎𝑡) 𝐵𝑊ℎ𝑢𝑚𝑎𝑛0.75
In addition, we will use information for other similar compounds and the data for male rat above to define plausible intervals for the metabolic constants for humans, and thus we will base our evaluation on simulations for upper and lower levels defined by these intervals, rather than only using one defined set of values for Vmax or KM. For example, as described in the section on review of metabolic constants for related compounds (Appendix 6), the KM value for triadimefon is larger in human than in rat, and this we will take into consideration. Prochloraz: Data on metabolic stability (intrinsic clearance) of prochloraz has been published in Supplementary Table 8 in Wetmore et al. (Wetmore et al., 2012), but no information on metabolic constants (Vmax and KM) for prochloraz depletion was found. Amble literature on prochloraz metabolic pathways, inhibition, induction, as well as on various toxic effects is available, see the section 2.1.2 .1 on prochloraz above. As discussed previously, prochloraz is known to be a potent CYP 1A inducer, and possible also a CYP 2E1 inducer. In the QSAR modeling section below, we have predicted prochloraz to be a CYP 2C9 substrate, but the prediction on whether it is an inhibitor to CYP 2C9 or not, was inconclusive. Prochloraz can therefore according to our QSAR predictions potentially interact with tebuconazole through CYP 2C9, as tebuconazole was predicted to be CYP 2C9 inhibitor, but not substrate (see section 4.1.1 for details). Prochloraz undergoes ring opening of the imidazole ring, which is likely to be either CYP 1A or CYP 2E1 mediated. After the ring opening, metabolite 1 undergoes hydroxylation to form an alcohol and oxidation to form a carboxyl acid. These are common metabolic reactions among azole type compounds. At low prochloraz concentrations we used a first order implementation for the depletion rate and the measured intrinsic clearance from Wetmore et al. (Wetmore et al., 2012), see Table 3.7. These data were measured using an ensemple of different in vitro assays for metabolic stability at two different conscntrations of prochloraz (1 and 10 µM).

42 Optimization of the cumulative risk assessment of pesticides and biocides using computational techniques: Pilot project
TABLE 3.7.
CLIN FOR PROCHLORAZ DEPLETION MEASURED IN HUMAN IN VITRO HEPATOCYTES, USING 1 AND 10 µM
PROCHLORAZ SOLUTION (WETMORE ET AL., 2012).
Sample Cprocloraz CLint(human),exp r2 CLint(human) CLint(rat)
[µM] [µl min-1 10-6 cells] [l hr-1] [l hr-1]
Ensemple of in vitro assays
1 16.3995 0.88 242.51 3.543
Ensemple of in vitro assays
10 3.9782 0.37 58.83 0.859
𝐶𝐿int(human) �𝑙ℎ𝑟� = 𝐶𝐿int(human) �
µ𝑙𝑚𝑖𝑛 106𝑐𝑒𝑙𝑙𝑠� ∗
137 106 ℎ𝑒𝑝𝑎𝑡𝑜𝑐𝑖𝑡𝑒𝑠𝑔 𝑤𝑒𝑡 𝑙𝑖𝑣𝑒𝑟
∗1799 𝑔 𝑤𝑒𝑡 𝑙𝑖𝑣𝑒𝑟
106 𝜇𝑙𝑙∗ 60
𝑚𝑖𝑛ℎ𝑟
𝑤𝑒𝑡 𝑤ℎ𝑜𝑙𝑒 𝑙𝑖𝑣𝑒𝑟 𝑤𝑒𝑖𝑔ℎ𝑡 (ℎ𝑢𝑚𝑎𝑛) =𝑙𝑖𝑣𝑒𝑟, 𝑝𝑒𝑟𝑐𝑒𝑛𝑡 𝑜𝑓 𝐵𝑊
100∗ 𝐵𝑊 =
2.57100 ∗ 70000 𝑔 = 1799 𝑔
𝐶𝐿int(𝑟𝑎𝑡), = 𝐶𝐿𝑖𝑛𝑡(ℎ𝑢𝑚𝑎𝑛) �𝐵𝑊𝑟𝑎𝑡
𝐵𝑊ℎ𝑢𝑚𝑎𝑛�0.75
At higher prochloraz concentrations, we tried to adapt metabolic constants values for similar reactions to the PBTK model for prochloraz as the first option in the absence of experimental Vmax and KM data. To approximate the first part of the reaction (metabolic pathway), the ring opening for form metabolite 1 (see Figure 2.2), our working theory was to use the metabolic constants of furan, which undergoes CYP 2E1 mediated ring opening (Kedderis et al., 1993; Kedderis and Held, 1996). See the values for furan (human and rat data) in Table 3.8 The best option among the available metabolic constants could be to use the CYP 2C19 mediated hydroxylation of omeprazole, human data (Yamazaki et al., 1997), for the depletion of metabolite 1. See Table 3.9 and Appendix 6 for details on the metabolic constants for omeprazole. TABLE 3.8. VMAX AND KM PARAMETERS FOR RING OPENING OF FURAN, FROM HUMAN AND RAT IN VITRO HEPATOCYTE DATA (KEDDERIS ET AL., 1993; KEDDERIS AND HELD, 1996). THE VMAX VALUE HAS BEEN CONVERTED TO ACCOUNT FOR THE METABOLIC CAPACITY OF ALL LIVER PROTEINS.
Sample Vmax KM Vmax VmaxC
[nmol hr-1 10-6 cells] [µM] [µmol hr-1] [µmol hr-1 kg-0.75]
Human 1, male, 53 years 19.0 2.1 4683 193
Human 3, male, 34 years 43.9 3.3 10820 447
Mean (human 1 and 3) 31.4 2.7 7751 320
F-344 rat 18.0 0.4 21.1 59.6
Vmax for whole human and rat livers were calculated with the following scaling factors for hepatocites and VmaxC was then calculated as described above.
𝑉max(human) �𝜇𝑚𝑜𝑙ℎ𝑟 � = 𝑉max (human) �
𝑛𝑚𝑜𝑙ℎ𝑟 106𝑐𝑒𝑙𝑙𝑠� ∗
137 106 ℎ𝑒𝑝𝑎𝑡𝑜𝑐𝑖𝑡𝑒𝑠𝑔 𝑤𝑒𝑡 𝑙𝑖𝑣𝑒𝑟 ∗
1799 𝑔 𝑤𝑒𝑡 𝑙𝑖𝑣𝑒𝑟1000 𝑛𝑚𝑜𝑙/𝜇𝑚𝑜𝑙
𝑤𝑒𝑡 𝑤ℎ𝑜𝑙𝑒 𝑙𝑖𝑣𝑒𝑟 𝑤𝑒𝑖𝑔ℎ𝑡 (ℎ𝑢𝑚𝑎𝑛) =𝑙𝑖𝑣𝑒𝑟, 𝑝𝑒𝑟𝑐𝑒𝑛𝑡 𝑜𝑓 𝐵𝑊
100 ∗ 𝐵𝑊 =2.57100 ∗ 70000 𝑔 = 1799 𝑔

Optimization of the cumulative risk assessment of pesticides and biocides using computational techniques: Pilot project 43
𝑉max(rat) �𝜇𝑚𝑜𝑙ℎ𝑟 � = 𝑉max (rat) �
𝑛𝑚𝑜𝑙ℎ𝑟 106𝑐𝑒𝑙𝑙𝑠� ∗
128 106 ℎ𝑒𝑝𝑎𝑡𝑜𝑐𝑖𝑡𝑒𝑠𝑔 𝑤𝑒𝑡 𝑙𝑖𝑣𝑒𝑟 ∗
9.15 𝑔 𝑤𝑒𝑡 𝑙𝑖𝑣𝑒𝑟1000 𝑛𝑚𝑜𝑙/𝜇𝑚𝑜𝑙
𝑤𝑒𝑡 𝑤ℎ𝑜𝑙𝑒 𝑙𝑖𝑣𝑒𝑟 𝑤𝑒𝑖𝑔ℎ𝑡 (𝑟𝑎𝑡) =𝑙𝑖𝑣𝑒𝑟, 𝑝𝑒𝑟𝑐𝑒𝑛𝑡 𝑜𝑓 𝐵𝑊
100∗ 𝐵𝑊 =
3.66100 ∗ 250 𝑔 = 9.15 𝑔
TABLE 3.9. VMAX AND KM PARAMETERS FOR 5-HYDROLIZATION OF OMEPREZOLE IN CYP 2C19 FROM HUMAN IN VITRO RECOMBINANT ASSAY DATA (YAMAZAKI ET AL., 1997). THE VMAX VALUE HAS BEEN CONVERTED TO ACCOUNT FOR THE METABOLIC CAPACITY OF ALL LIVER PROTEINS.
Sample Vmax KM Vmax VmaxC
[nmol min-1 nmol-1 P450]
[µM] [µmol hr-1] [µmol hr-1
kg-0.75]
Human CYP 2C19 in insect liver microsomes
8.3
6.6
134
5.53
Rat by inter-species scaling 6.6 1.95
Vmax for human was then calculated with the following scaling factor for recombinant assay, where ISEF=0.4 was taken form (Proctor et al., 2004). CYP 2C19 abundance was calculated as a mean of experimental values for three individuals taken from (Table 1 in (Yamazaki et al., 1997)).
𝑉max(human) �𝜇𝑚𝑜𝑙ℎ𝑟 � = 𝑉max(human) �
𝑛𝑚𝑜𝑙min 𝑛𝑚𝑜𝑙 𝑃450� ∗ 0.4 ∗
9.33 10−3 𝑛𝑚𝑜𝑙 2𝐶19 𝑃450𝑚𝑔 𝑝𝑟𝑜𝑡𝑒𝑖𝑛
∗40 𝑚𝑔 𝑝𝑟𝑜𝑡𝑒𝑖𝑛𝑔 𝑤𝑒𝑡 𝑙𝑖𝑣𝑒𝑟 ∗
1799 𝑔 𝑤𝑒𝑡 𝑙𝑖𝑣𝑒𝑟
1000𝑛𝑚𝑜𝑙𝜇𝑚𝑜𝑙∗
60 𝑚𝑖𝑛ℎ𝑟
The corresponding rat value was then calculated by inter-species scaling.
𝑉max(𝑟𝑎𝑡) = 𝑉𝑚𝑎𝑥𝐶(ℎ𝑢𝑚𝑎𝑛) 𝐵𝑊𝑟𝑎𝑡0.75
3.3.2.3 Parameters for elimination Tebuconazole: Volumes of distribution were determined based on a QSAR model developed based on similar compounds with available data. See section 3.1.2.1 on predictions of volume of distribution at steady state for details. First order elimination rate constants for excretion through the urine and faeces were determined based on available data on excretion of tebuconazole in the rat. Data on cumulative excretion of radioactivity in urine and faeces in rat collected up to 72 hours after oral administration of [phenyl-UL-14C]tebuconazole as cited by Joint FAO/WHO Meeting on Pesticide Residues (JMPR, 2010) was used to estimate the 1. order elimination constant for urine and faeces, respectively. The two elimination constants were determined in two ways: 1) by curve fit to data on male rats given a dose of 2 mg/kg BW and 2) given a dose of 20 mg/kg BW. The values determined by curve fit to 2 mg/kg BW were then used to simulate the elimination at 20 mg/kg BW and the values determined by curve fit to 20 mg/kg were used to simulate the elimination at 2 mg/kg BW. By visual inspection of the plots it was determined that the values for the two elimination constants established by curve fit to the dataset at 20 mg/kg BW gave better simulation of the dataset for 2 mg/kg BW than the opposite way.

44 Optimization of the cumulative risk assessment of pesticides and biocides using computational techniques: Pilot project
Further, it seems as the curve fit at 2 mg/kg BW overestimates the excreted amount when simulating at a dose of 20 mg/kg BW. This tendency means that the model with the two elimination constants determined at 2 mg/kg BW will underestimate the risk due to a too fast elimination and this is very undesirable. Therefore it was decided to use the elimination constants determined by curve fit to the 20 mg/kg BW dataset in the present model. The final parameter values for the elimination rate constants were obtained by a curve fit to the final model for tebuconazole, where all other parameters for the model had been selected. The fit was based on the data obtained for a given dose of 20 mg/kg BW. Thus the obtained rate constants for urinary (keu) and faecal (kef) excretion were as follow.
𝑘𝑒𝑢(𝑟𝑎𝑡) = 0.0078 ℎ𝑟−1
𝑘𝑒𝑓(𝑟𝑎𝑡) = 0.039 ℎ𝑟−1
𝑘𝑒(𝑟𝑎𝑡) = 𝑘𝑒𝑢(𝑟𝑎𝑡) + 𝑘𝑒𝑓(𝑟𝑎𝑡) = 0.0468 ℎ𝑟−1 Figure 3.6, shows a plot showing the fitted curve at 20 mg/kg BW oral dose and a predicted curve at 2 mg/kg BW oral dose (ka set t0 1 hr-1).
FIGURE 3.6. CURVE FIT TO DATA ON MALE RATS GIVEN A DOSE OF TEBUCONAZOLE OF 20 MG/KG BW AND SIMULATION AT 2 MG/KG BW. THE CYAN AND VIOLET CURVES ARE THE FAECAL AND URINARY EXCRETION FOR THE 20 MG/KG BW DOSE, RESPECTIVELY AND THE CORRESPONDING CURVES FOR 2 MG/KG BW DOSE ARE YELLOW AND BLUE. THE DATA LABELLED WITH A # ARE THE EXPERIMENTAL DATA FROM JMPR (ALSO AVAILABLE IN DAR) AND ARE SHOWN WITH CIRCLES AND THE SIMULATED CURVES ARE SHOWN WITH LINES. THE Y-AXIS IS THE AMOUNT EXCRETED IN µMOL AND X-AXIS IS THE TIME AFTER ORAL ADMINISTRATION OF DOSE IN HR.
For human values, we use interspecies extrapolation as described by Campbell et al. (Campbell, Jr. et al., 2012), with the difference that the elimination rate constant was scaled proportionally to the body weight ratio in the power of 0.25, and not invers proportionally in the power of 0.25 as proposed in the paper. This change was made based on the empirical observations for rats, rhesus monkeys and humans shown below. As discussed before, compounds need to have significantly larger molecular weight for biliary excretion to occur in humans that rats. Therefore, we calculated the combined elimination rate

Optimization of the cumulative risk assessment of pesticides and biocides using computational techniques: Pilot project 45
constant for humans (ke(C1M1) = keu(C1M1) + kef(C1M1)) based on the corresponding rat data. We thus assumed that the total excretion rate can estimated by interspecies scaling, but not the rate by specific route of excretion.
𝑘𝑒(ℎ𝑢𝑚𝑎𝑛) = 𝑘𝑒(𝑟𝑎𝑡) �𝐵𝑊ℎ𝑢𝑚𝑎𝑛
𝐵𝑊𝑟𝑎𝑡�0.25
= 0.0468 ℎ𝑟−1 �70 𝑘𝑔
0.25 𝑘𝑔�0.25
= 0.19 ℎ𝑟−1
The ratio between amount of metabolites excreted in the urine and faeces are not necessarily the same in humans and rats. As discussed above, rats excrete lower molecular weight in faeces via the bile, than humans. The above elimination rate constants for human should thus be seen as parameters for the total excretion in urine and faeces, and not as exact measures of the excretion for each of these routes separately. The corresponding value for rabbit and monkey is
𝑘𝑒(𝑟𝑎𝑏𝑏𝑖𝑡) = 𝑘𝑒(𝑟𝑎𝑡) �𝐵𝑊𝑟𝑎𝑏𝑏𝑖𝑡
𝐵𝑊𝑟𝑎𝑡�0.25
= 0.0468 ℎ𝑟−1 �2.12 𝑘𝑔0.25 𝑘𝑔�
0.25
= 0.080 ℎ𝑟−1 = 0.0013 𝑚𝑖𝑛−1
𝑘𝑒(𝑚𝑜𝑛𝑘𝑒𝑦) = 𝑘𝑒(𝑟𝑎𝑡) �𝐵𝑊𝑚𝑜𝑛𝑘𝑒𝑦
𝐵𝑊𝑟𝑎𝑡�0.25
= 0.0468 ℎ𝑟−1 �6.19 𝑘𝑔0.25 𝑘𝑔�
0.25
= 0.10 ℎ𝑟−1
Three data sets for excretion in rhesus monkeys were available from DAR were used for validating the adjusted elimination rate constants for rat and the accuracy of the interspecies interpolation from rat to monkey. Two of these data sets used dermal exposure (one and five animals, respectively) and in the third experiment iv exposure was used (one animal) (European Commission, 2007b). In the dermal experiment using one animal, all the administrated compound was collected again, either from urine and faeces or by rinsing the unabsorbed compounds from the skin. The same method was applied to five animals in the other dermal experiment, but 12% of the administered compound was not recovered. (We assumed that the uncovered compound was not absorbed.) In order to do calculations for rhesus monkey, we adapted the human PBTK model for tebuconazole (the version with human parameters) to implement a model for male rhesus monkey. BW of 6.2 kg was taken from Brown (Brown et al., 1997) and the cardiac output (QC) was calculated by interspecies interpolation based on rat data (QCmonkey = 73 l/hr). The mean of experimental values for control rhesus monkey listed by Forsyth (Forsyth, 1970) is 77 l/hr and corresponds well with the interpolated value. For percent tissue volumes and organ blood flows, the human values were used and the same is the case for partition coefficients, fraction unbound in plasma. Like in all other cases the metabolic constants where based on the corresponding experimental constants for male rat, where the maximum velocity is scaled by interspecies interpolation and the KM value was used unchanged. It was assumed that the whole dermal dose was absorbed within an hour, with the absorbed dose equally distributed over this hour. The simulated curves are shown on Figure 3.7. The excretion curve for the iv dose is predicted were well with the model and good predictions are also obtained for the dermal curves. This validation result indeed shows that interspecies interpolation is a valuable option for estimating elimination rate constants in other species.

46 Optimization of the cumulative risk assessment of pesticides and biocides using computational techniques: Pilot project
FIGURE 3.7. SIMULATED (VALIDATED) EXCRETION FOR MALE RHESUS MONKEY GIVEN 240 MG OF TEBUCONAZOLE BY IV BOLUS DOSE (RED LINE AND RED DOTS), EXPOSED TO 0.261 MG BY DERMAL ADMINISTRATION (0.0175 MG ABSORBED AND EXCRETED) (BLUE LINE AND GREEN DOTS) AND TO 0.132 MG DERMAL DOSE (0.0152 MG ABSORBED) (VIOLET CURVE AND BLACK DOTS). THE DATA LABELLED WITH A # ARE THE EXPERIMENTAL DATA FROM DAR AND ARE SHOWN WITH CIRCLES AND THE SIMULATED CURVES ARE SHOWN WITH LINES.
In fact if we would have adjusted to ke(monkey) to the iv curve above, it would practically render the same value as the one calculated by interspecies scaling. In addition we tried to fit the elimination rate constant to the dermal data set for one animal, and obtained ke(monkey),adj = 0.0774 hr-1, and by carrying out interspecies interpolation from monkey to human, we obtained a slightly lower value than above.
𝑘𝑒(ℎ𝑢𝑚𝑎𝑛),;𝑥𝑚𝑜𝑛𝑘𝑒𝑦 = 𝑘𝑒(𝑚𝑜𝑛𝑘𝑒𝑦),𝑎𝑑𝑗 �𝐵𝑊ℎ𝑢𝑚𝑎𝑛
𝐵𝑊𝑚𝑜𝑛𝑘𝑒𝑦�0.25
= 0.0774 ℎ𝑟−1 �70 𝑘𝑔
6.19 𝑘𝑔�0.25
= 0.14 ℎ𝑟−1
If we extrapolate this value from monkey to rat in the same way, ke(rat),xmonkey = 0.035 hr-1, which is slightly lowe than the corresponding value (sum of the two values) adjusted to rat data. As seen on Figure 3.8, the accuracy of both the simulated dermal curves is improved, and poorer agreement is seen between the simulated iv curve and the corresponding data points. We thus use the values adjusted to rat data for simulations in all the species with ke(human) = 0.19 hr-1.

Optimization of the cumulative risk assessment of pesticides and biocides using computational techniques: Pilot project 47
FIGURE 3.8. CURVE FIT TO EXCRETION DATA MEASURED FOR MALE RHESUS MONKEY GIVEN A DOSE OF 0.261 MG TEBUCONAZOLE BY DERMAL ADMINISTRATION (0.0175 MG ABSORBED AND EXCRETED), THE BLUE LINE IS THE ADJUSTED CURVE AND THE GREEN DOTS ARE THE EXPERIMENTAL DATA POINTS. SIMULATIONS (VALIDATIONS) FOR A DATA OBTAINED FROM DERMAL ADMINISTRATION OF 0.132 MG (0.0152 MG ABSORBED) (VIOLET CURVE AND BLACK DOTS) AND DATA FROM AND AN IV EXPERIMENT (240 MG DOSE) (RED LINE AND RED CIRCLES). THE DATA LABELLED WITH A # ARE THE EXPERIMENTAL DATA FROM DAR AND ARE SHOWN WITH CIRCLES AND THE SIMULATED CURVES ARE SHOWN WITH LINES.
Prochloraz: The parameters for prochloraz will be accessed in a similar way, using radio labelled data. Data sets were 100 mg/kg BW of 14C-BAS 590 F (Prochloraz) was administered as a oral bolus dose to 4 male and 4 female Wistar rats on day 15, after 14 days repeated oral dosing of 100 mg/kg BW/day of unlabeled 12C-BAS 590 F (Prochloraz) are available in DAR ( European Commission, 2010e). The total recovery for the male group was 97.2% Excretion data collected from five groups of Sprague-Dawley rats that received a single oral gavage doses as also available in DAR ( European Commission, 2010e): 1) One dose of 2 male rats, one dose with 10 mg/kg BW and another with 100 mg/kg BW and excretion measured 48 hr post dose. 2) One dose group of 5 males and 5 females that received 10 mg/kg BW and excretion measure 24 hrs post dose. 3) Three groups of 5 males and 5 females that dose with 10 mg/kg BW (1 single dose group and 1 repeated dose group) and 100 mg/kg BW (1 group) and excretion measured 168 hr post dose. The male groups measured after a single dose of 10 mg/kg BW provided excretion data at three time points, which we fused together into one data set for validation purpose. The total recovery was 90-94% for lower dose male groups, and 84% and 100% for the higher dose male groups. As the first attempt, we did choose to use the data set from the multiple dose experiment at 100 mg/kg BW for adjusting the elimination rate constant. It was the most complete set at hand and the two data points measured for the single 100 mg/kg BW dose groups were in same range. 57.6 µmol were excreted at 48 hrs according to the multiple dose set, and for the one animal in the corresponding single dose set, 53 µmol were excreted at 48 hrs post administration (84% total recovery). If we scale the experiment to total of 98% recovery (excretion + tissue content) the number would change to 62 µmol. Especially the data point at 24 hrs post administration might however be slightly underestimated, as it is likely that the rat is also excreting remains from previous doses.
48 Optimization of the cumulative risk assessment of pesticides and biocides using computational techniques: Pilot project
The elimination rate constant was obtained by a curve fit to the final model for prochloraz, where all other parameters for the model had been selected. The following rate constants (ke) for excretion (urine and faecal) was obtained, ke(rat) = 0.35 hr-1. It was seen that the prochloraz was excreted with 168 hrs post administration, and not 72 hrs as stated in JMPR. Data for the total amount of prochloraz in all tissues is available for a few time points as a part of excretion data set in DAR, and those data have been used to analyse the tissue levels simulated by the PBTK model. The amount of prochloraz in blood and all tissue compartments of the model was summed together, i.e. liver, fat, rapidly and slowly perfused tissue. This analysis showed that the elimination rate constant fitted to excretion data from a multiple dose experiment did underestimate the elimination rate constant, and this parameter was therefore adjusted to match the experimental data points more accurately (Figure 3.9).
𝑘𝑒(𝑟𝑎𝑡) = 0.070 ℎ𝑟−1

Optimization of the cumulative risk assessment of pesticides and biocides using computational techniques: Pilot project 49
(a)
(b) FIGURE 3.9. TOTAL MASS OF PROCHLORAZ AND METABOLITES IN BODY (BLOOD, LIVER, FAT, RAPIDLY AND SLOWLY PERFUSED TISSUE) FOR (A) 10 MG/KG BW AND (B) 100 MG/KG BW DOSE GROUPS. THE CYAN CURVE IS MASS OF PROCHLORAZ, GREEN CURVE IS THE MASS OF METABOLITES USING THE ADJUSTED ELIMINATION CONSTANT 0.035 HR-1 AND THE BLACK CURVE SHOWS WHEN THIS PARAMETER IS ADJUSTED TO 0.070 HR-1. EXPERIMENTAL DATA ARE SHOWN AS DOTS ARE FROM DAR.
The excretion curves were then simulated both with elimination rate constant obtained by curve fitting to data multiple dose data, as well as the total mass data (Figure 3.10). Three data points from three different experiments at 10 mg/kg BW from DAR are shown. The 24 hrs data point in Figure 3.10(a) was obtained based on test on five animals, where the 48 hrs data point is only based on one rat. These data and the data point for total mass, indicate that the elimination rate constant of 0.070 hr-a is the optimal value. The total excretion curve contains contributions from absorbed portion of the dose excreted as metabolites and unabsorbed portion excreted in faeces as prochloraz. The different contributions to the total excretion are shown for the 10 mg/kg BW dose groups on Figure 3.11.

50 Optimization of the cumulative risk assessment of pesticides and biocides using computational techniques: Pilot project
(a)
(b) FIGURE 3.10. EXCRETION OF PROCHLORAZ AND METABOLITES USING ELIMINATION RATE CONSTANT OBTAINED BY CURVE FIT TO DATA FOR MALE RATS GIVEN A DOSE OF 100 MG/KG BW OF PROCHLORAZ IN AN MULTIPLE DOSE EXPERIMENT (DOTTED LINE) OR ADJUSTMENT TO TOTAL MASS DATA (SOLID LINE). SIMULATIONS FOR THE DATA FROM THE 10 MG/KG BW DOSE GROUP (A) AND 100 MG/KG BW MULTIPLE DOSE GROUP (B) ARE SHOWN, WHERE THE CURVE FIT IS SHOWN AS THE DOTTED LINE IN (B). THE Y-AXIS IS THE AMOUNT EXCRETED IN µMOL AND X-AXIS IS THE TIME AFTER ORAL ADMINISTRATION OF DOSE IN HR. THE DATA LABELLED WITH A # ARE THE EXPERIMENTAL DATA FROM DAR AND ARE SHOWN WITH CIRCLES.

Optimization of the cumulative risk assessment of pesticides and biocides using computational techniques: Pilot project 51
FIGURE 3.11. DIFFERENT CONTRIBUTIONS TO THE EXCRETION TERM FOR MALE RATS GIVEN A DOSE OF 10 MG/KG BW, THE TOTAL EXCRETION IS THE SOLID LINE. THE EXCRETION OF THE NON-METABOLIZED PROCHLORAZ (26% OF THE DOSE NOT ABSORBED) IS ASSUMED AS LINEAR EXCRETION OVER 24 HRS (LONG DASHED CURVE). THE ABSORBED AND COMPLETELY METABOLISED PORTION OF PROCHLORAZ IS SHOWN AS DASHED LINE. THE DATA LABELLED WITH A # ARE THE EXPERIMENTAL DATA FROM DAR AND ARE SHOWN WITH CIRCLES.
The corresponding value for prochloraz in human was calculated in the same way as before.
𝑘𝑒(ℎ𝑢𝑚𝑎𝑛) = 𝑘𝑒(𝑟𝑎𝑡) �𝐵𝑊ℎ𝑢𝑚𝑎𝑛
𝐵𝑊𝑟𝑎𝑡�0.25
= 0.070 ℎ𝑟−1 �70 𝑘𝑔
0.25 𝑘𝑔�0.25
= 0.29 ℎ𝑟−1
3.3.2.4 Fraction unbound and volume of distribution predicted by QSAR As discussed in 4.1.2.1, the volume of distribution at steady state (VdSS) was predicted by QSAR the the most important metabolite of each compound, and used for evaluating the body concentration of the metabolites. Vd(human)SS = 0.77 l/kg and Vd(rat)SS = 1.2 l/kg for tebuconazole metabolites. Vd(human)SS = 0.58 l/kg and Vd(rat)SS = 0.85 l/kg for prochloraz metabolites. Likewise, the fraction unbound was calculated from QSAR predictions for the plasma protein bidning given in section 4.1.2.2 (fu = (100-%PPB)/100). fu(human) = 0.34 and fu(rat) = 0.53 for tebuconazole. fu(human) = 0.07 and fu(rat) = 0.13 for prochloraz. Recently, we found an experimental value for prochloraz in Supplementary Table 8 to Wetmore et al. (Wetmore et al., 2012). The data were measured in vitro in human cells, and the rat value is calculated using interspecies extrapolation, as described in section 4.1.2.2. fu,exp(human) = 0.0224 and fu,extrapolated(rat) = 0.041 for prochloraz.

52 Optimization of the cumulative risk assessment of pesticides and biocides using computational techniques: Pilot project
Taken the uncentainity of the developed QSAR model into account, the prediction is quite close to the experimental data. This illustrates the value of user QSAR methods to predict this propertiy in the absence of experimental data. We used the QSAR predicted values for tebuconazole and the experimental ones for prochloraz in the simulations. 3.3.3 Parameters for the dermal model for tebuconazole Additional parameters are needed to describe the dermal part of the model. These parameters describe the absorption of a fluid on the skin surface into the skin. 3.3.3.1 Physiological parameters and estimates of penetration through clothing
and gloves In addition to the volume and blood flow rate of the skin, presented in section 3.3.1, one additional physiological parameter is needed in case of dermal exposure, namely area of the exposed skin (SA). This parameter is needed when the Ficks law based equation for dermal exposure, which is the traditional method used in the literature. Daniell et al. (Daniell et al., 2012) reviewed several methods proposed for determining the total surface area of a human (SAhuman), among those the following equation by Reading and Freeman (Reading and Freeman, 2005), which we have chosen to use
𝑆𝐴ℎ𝑢𝑚𝑎𝑛(𝑚2) = 𝐵𝑊(𝑘𝑔)0.5 ∗ ℎ𝑒𝑖𝑔ℎ𝑡 (𝑐𝑚) 0.5/ 60 Poet et al. (Poet et al., 2000) have published a comprehensive overview on weight and height of various human subjects with SA in the range 1.57-2.24 m2.. For a 70 kg and 168 cm human: SAhuman
= 1.81 m2 = 181 dm2. A simple equation for calculating the total body surface area for rats was used with a new value of Meeh’s constant (KMeeh) recently determined for 30 Wistar rats, weighing 195-240 g.
𝑆𝐴𝑟𝑎𝑡(𝑑𝑚2) = 𝑘𝑀𝑒𝑒ℎ ∗ 𝐵𝑊(𝑔)23 ∗ 100 = 9.83 ∗ 250
23 ∗ 100 = 3.9
In cases where only part of the skin surface is exposed, the surface area of the exposed skin should be used. The Fick’s law based equation is well suited for experiments where a defined portion of the surface area is exposed to a solution applied directly on the skin surface. In this report, we attempt to evaluate exposure due to material spilled on clothing and skin/gloves during work situations, which substantially different from a situation where the whole body of a human or an animal would be intentionally exposed the active compound solution by applying it directly on the body surface. When considering whole body exposure of human, one has to account for reduced exposure due to clothing and gloves. Thus estimates for penetration through clothing and gloves were built in the exposure assessments were used in our simulation, and the alternative dermal implementation in section 3.1.2.2 was applied. The Danish EPA recommended to use 10% clothing penetration for coated overalls used for industrial pre-treatment of wood (reduction in exposure by 90%) and 50% clothing penetration for light clothing used for professional brush application. In both cases migration by gloves was assumed to be 100%, i.e. no protection is applied.
Optimization of the cumulative risk assessment of pesticides and biocides using computational techniques: Pilot project 53
For the pesticide product, the assessment was calculated with a more complicated model that account for hand exposure during mixing and filling the concentrated product on the spraying equipment, and face, hand and body dermal exposure while spraying. The penetration through protective gloves is estimated to be 90% during mixing and filling, and 60% while spraying. Exposure estimates for specific products is presented together with the underlying assumptions in Appendix 9.
3.3.3.2 Compound Specific Parameters for Tebuconazole The skin:surface partition coefficient (Pskin:surface) has been calculated for exposure to a solution of polar organic compounds by the following equation.
𝑃𝑠𝑘𝑖𝑛:𝑠𝑢𝑟𝑓𝑎𝑐𝑒 =�𝑃𝑜𝑤�𝐹𝑛𝑙,𝑠𝑘𝑖𝑛 + 0.3 𝐹𝑝ℎ,𝑠𝑘𝑖𝑛� + �𝐹𝑤.𝑠𝑘𝑖𝑛 + 0.7 𝐹𝑝ℎ,𝑠𝑘𝑖𝑛��
𝑃𝑜𝑤
Our calculated values are Pskin:surface (human) = 0.0319, Pskin:surface (rat) = 0.0294 The skin permeability coefficient rate constant for tebuconazole was taken from Buist et al.(Buist et al., 2005), and is used for both species. Kp = 0.017 dm/hr Concentration of the liquid one is exposed to, which is used to calculate the concentration gradient across the skin (µmol/l). According to the Danish EPA, the typical concentration of tebuconazole in wood preserving paints around 0.5 % w/w, with density set to 1.0 kg/l.
𝐶𝑠𝑢𝑟𝑓𝑎𝑐𝑒 = 0.5 % 𝑤𝑤 =
0.5 𝑔 𝑡𝑒𝑏𝑢𝑐𝑜𝑛𝑧𝑜𝑙𝑒100 𝑔 𝑠𝑜𝑙𝑢𝑡𝑖𝑜𝑛 ∗
1000𝑔𝑙307.8 𝑔
𝑚𝑜𝑙∗
106𝜇𝑚𝑜𝑙𝑚𝑜𝑙 = 1.6 ∙ 104
𝜇𝑚𝑜𝑙𝑙
The dermal absorption is highly dependent on the type of formulation and the concentration of the product. According to DAR the absorption percentage of tebuconazole was observed to be approximately 55 % in rats and 13 % in rhesus monkeys in specific experiments (European Commission, 2007a). As discussed in section 5.1.2.1, DAR reports an older study for rats that Danish EPA has evaluated to be erroneous. According to information provided by the Danish EPA, the dermal absorption in human is estimated to be 15.7 % for solvent based solution and 4.1 % for water based solution for a product with concentration of 0.6 % w/w. These numbers can be extrapolated to 0.5 % w/w. In the absence of corresponding information for rat, the dermal absorption in rat was assumed to be the same as in humans. For the pesticide formulation, the dermal absorption of a specific formulation was used. The dermal absorption of the specific formulation used as model product in this study, is 20 % for the concentrate and 12 % for the diluted solution (Table A9.4 Appendix 9). For another product, the corresponding numbers were 0.5 % and 13.5 % respectively. These two concentrates have the same active compound concentration of 1.0 g/l (3.2 mol/l), and thus the difference has to be due to different properties of the two oil-water emulsion formulations. In cases where no information on the dermal absorption is provided, dermal absorption of 25% is assumed for concentrated pesticide formulation and 75 % for the diluted solution, as the worst case scenario.
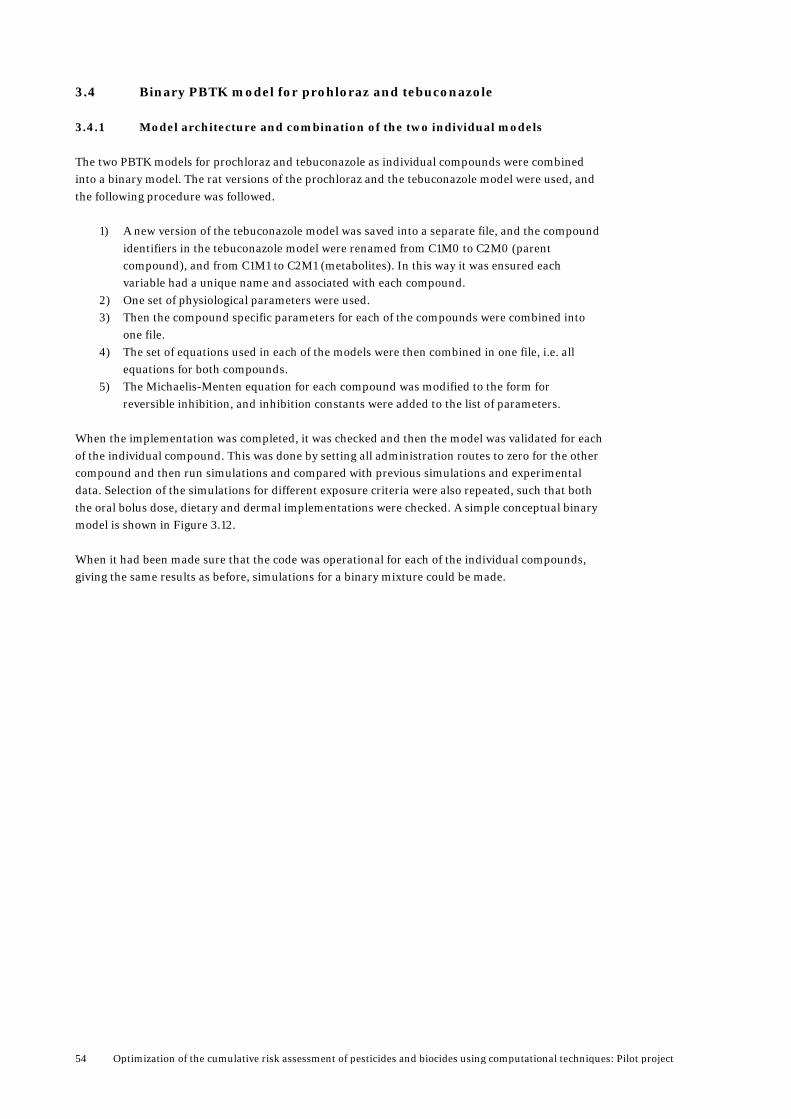
54 Optimization of the cumulative risk assessment of pesticides and biocides using computational techniques: Pilot project
3.4 Binary PBTK model for prohloraz and tebuconazole 3.4.1 Model architecture and combination of the two individual models The two PBTK models for prochloraz and tebuconazole as individual compounds were combined into a binary model. The rat versions of the prochloraz and the tebuconazole model were used, and the following procedure was followed.
1) A new version of the tebuconazole model was saved into a separate file, and the compound identifiers in the tebuconazole model were renamed from C1M0 to C2M0 (parent compound), and from C1M1 to C2M1 (metabolites). In this way it was ensured each variable had a unique name and associated with each compound.
2) One set of physiological parameters were used. 3) Then the compound specific parameters for each of the compounds were combined into
one file. 4) The set of equations used in each of the models were then combined in one file, i.e. all
equations for both compounds. 5) The Michaelis-Menten equation for each compound was modified to the form for
reversible inhibition, and inhibition constants were added to the list of parameters. When the implementation was completed, it was checked and then the model was validated for each of the individual compound. This was done by setting all administration routes to zero for the other compound and then run simulations and compared with previous simulations and experimental data. Selection of the simulations for different exposure criteria were also repeated, such that both the oral bolus dose, dietary and dermal implementations were checked. A simple conceptual binary model is shown in Figure 3.12. When it had been made sure that the code was operational for each of the individual compounds, giving the same results as before, simulations for a binary mixture could be made.
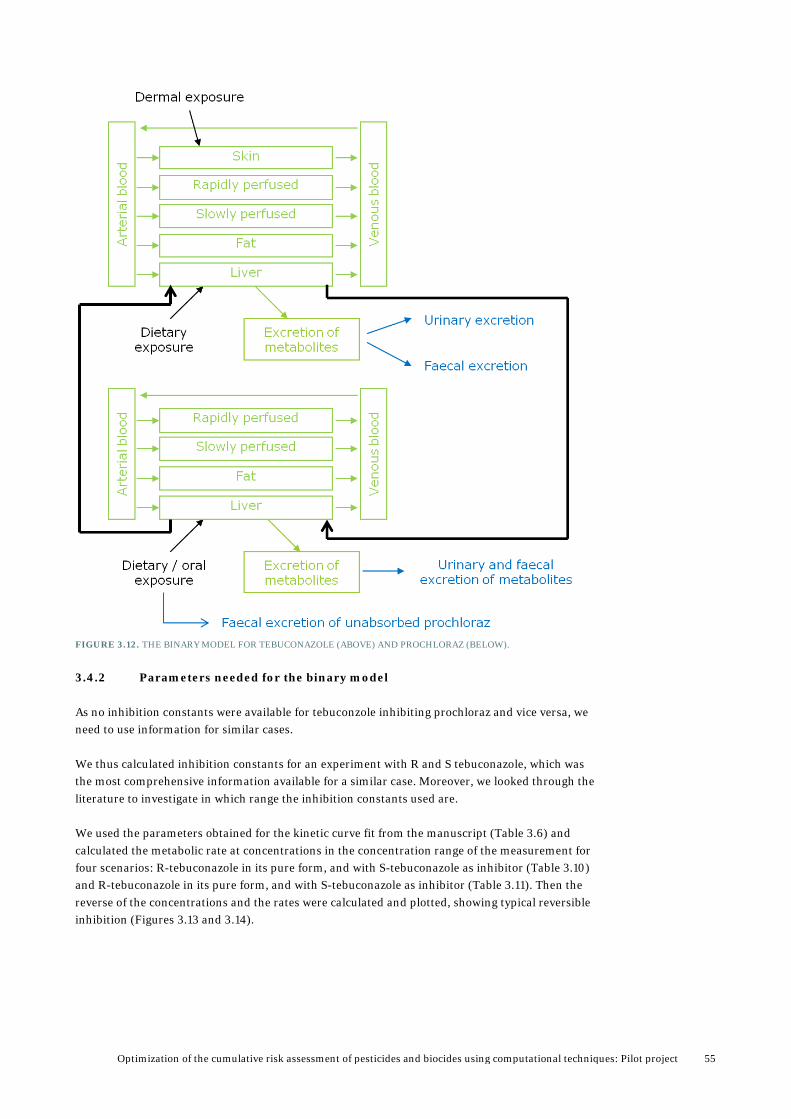
Optimization of the cumulative risk assessment of pesticides and biocides using computational techniques: Pilot project 55
FIGURE 3.12. THE BINARY MODEL FOR TEBUCONAZOLE (ABOVE) AND PROCHLORAZ (BELOW).
3.4.2 Parameters needed for the binary model As no inhibition constants were available for tebuconzole inhibiting prochloraz and vice versa, we need to use information for similar cases. We thus calculated inhibition constants for an experiment with R and S tebuconazole, which was the most comprehensive information available for a similar case. Moreover, we looked through the literature to investigate in which range the inhibition constants used are. We used the parameters obtained for the kinetic curve fit from the manuscript (Table 3.6) and calculated the metabolic rate at concentrations in the concentration range of the measurement for four scenarios: R-tebuconazole in its pure form, and with S-tebuconazole as inhibitor (Table 3.10) and R-tebuconazole in its pure form, and with S-tebuconazole as inhibitor (Table 3.11). Then the reverse of the concentrations and the rates were calculated and plotted, showing typical reversible inhibition (Figures 3.13 and 3.14).

56 Optimization of the cumulative risk assessment of pesticides and biocides using computational techniques: Pilot project
TABLE 3.10. METABOLIC RATES FOR PURE R-TEBUCONAZOLE (R-TEB) AND FOR AND R-TEBUCONAZOLE WITH S-TEBUCONAZOLE (S-TEB) AS INHIBITOR CALCULATED FROM THE VMAX AND KM VALUES OBTAINED FROM THE CURVE FIT TO THE EXPERIMENTAL DATA.
R-TEB R-TEB / Inh. S-TEB R-TEB R-TEB / Inh. S-TEB
CV,liver dAML(R-
TEB)/dt dAML(R-TEB,inh)/dt 1/CV,liver (dAML(R-TEB)/dt)-
1 (dAML(R-TEB,inh)/dt)-1
[µM] [µM/min/ [µM/min/ [µM] -1 [µM/min/ [µM/min/
mg protein] mg protein] mg protein] -1 mg protein] -1
5 0,32 0,10 0,20 3,12 9,57
10 0,51 0,19 0,10 1,96 5,18
20 0,73 0,34 0,05 1,37 2,98
40 0,93 0,53 0,03 1,08 1,89
80 1,07 0,75 0,01 0,93 1,34
1000 1,27 1,27 0,00 0,79 0,79
FIGURE 3.13 REVERSE METABOLIC RATES (Y-AXIS) FOR PURE R-TEBUCONAZOLE (R-TEB) AND FOR AND R-TEBUCONAZOLE WITH S-TEBUCONAZOLE (S-TEB) AS INHIBITOR PLOTTED AGAINST THE REVERSE CONCENTRATION IN THE VENOUS BLOOD LEAVING THE LIVER (X-AXIS), SEE TABLE 3.10 FOR DETAILS.

Optimization of the cumulative risk assessment of pesticides and biocides using computational techniques: Pilot project 57
TABLE 3.11. METABOLIC RATES FOR PURE R-TEBUCONAZOLE (R-TEB) AND FOR AND R-TEBUCONAZOLE WITH S-TEBUCONAZOLE (S-TEB) AS INHIBITOR CALCULATED FROM THE VMAX AND KM VALUES OBTAINED FROM THE CURVE FIT TO THE EXPERIMENTAL DATA.
S-TEB S-TEB / Inh. R-TEB S-TEB S-TEB / Inh. R-TEB
CV,liver dAML(R-TEB)/dt dAML(R-TEB,inh)/dt 1/CV,liver (dAML(R-TEB)/dt)-
1 (dAML(R-TEB,inh)/dt)-1
[µM] [µM/min/ [µM/min/ [µM] -1 [µM/min/ [µM/min/
mg protein] mg protein] mg protein] -1 mg protein] -1
5 0,24 0,12 0,20 4,15 8,34
10 0,37 0,21 0,10 2,68 4,74
20 0,52 0,34 0,05 1,94 2,94
40 0,64 0,49 0,03 1,57 2,04
80 0,72 0,63 0,01 1,39 1,59
10000 0,83 0,88 0,00 1,21 1,14
FIGURE 3.14 REVERSE METABOLIC RATES (Y-AXIS) FOR PURE S-TEBUCONAZOLE (S-TEB) AND FOR AND S-TEBUCONAZOLE WITH R-TEBUCONAZOLE (R-TEB) AS INHIBITOR PLOTTED AGAINST THE REVERSE CONCENTRATION IN THE VENOUS BLOOD LEAVING THE LIVER (X-AXIS), SEE TABLE 3.11 FOR DETAILS.
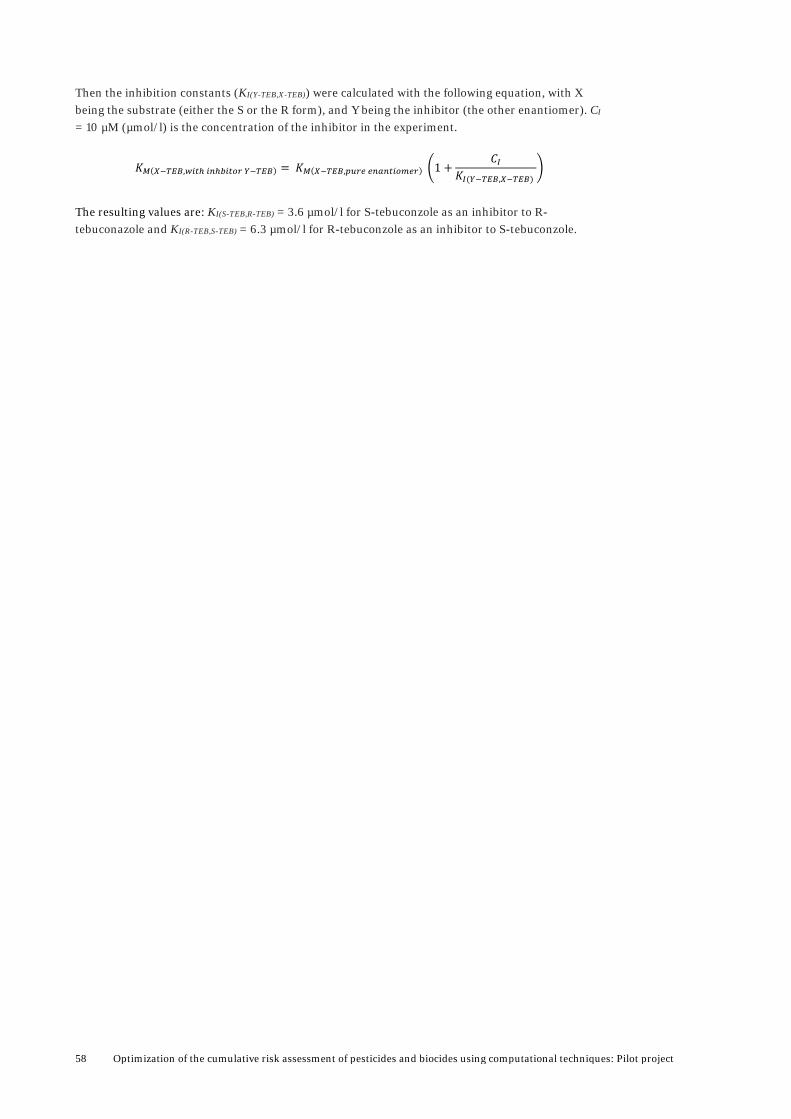
58 Optimization of the cumulative risk assessment of pesticides and biocides using computational techniques: Pilot project
Then the inhibition constants (KI(Y-TEB,X-TEB)) were calculated with the following equation, with X being the substrate (either the S or the R form), and Y being the inhibitor (the other enantiomer). CI
= 10 µM (µmol/l) is the concentration of the inhibitor in the experiment.
𝐾𝑀(𝑋−𝑇𝐸𝐵,𝑤𝑖𝑡ℎ 𝑖𝑛ℎ𝑏𝑖𝑡𝑜𝑟 𝑌−𝑇𝐸𝐵) = 𝐾𝑀(𝑋−𝑇𝐸𝐵,𝑝𝑢𝑟𝑒 𝑒𝑛𝑎𝑛𝑡𝑖𝑜𝑚𝑒𝑟) �1 +𝐶𝐼
𝐾𝐼(𝑌−𝑇𝐸𝐵,𝑋−𝑇𝐸𝐵) �
The resulting values are: KI(S-TEB,R-TEB) = 3.6 µmol/l for S-tebuconzole as an inhibitor to R-tebuconazole and KI(R-TEB,S-TEB) = 6.3 µmol/l for R-tebuconzole as an inhibitor to S-tebuconzole.

Optimization of the cumulative risk assessment of pesticides and biocides using computational techniques: Pilot project 59
4. Predictions of parameters for PBTK models by QSAR
4.1 QSAR Modeling 4.1.1 Prediction of CYP activity by QSAR We have used our battery of QSAR models for predicting CYP substrate recognition and inhibitor identification to tebuconazole and prochloraz, and their most important metabolites (Tables 4.1-4.3). These models were developed prior to the project presented here, and can provide important information with regards to PBTK modelling by identifying which CYPs tebuconazole and prochloraz interact with. The CYP 2C9 and CYP 2D6 substrate and inhibitor models are described in detail in a recent publication (Jonsdottir et al., 2012), including model performances. A manuscript over the CYP 3A4 substrate and inhibitor models is in preparation. The data sets used to train these models, contain many drug compounds. Among those are several triazoles and imidazoles used as drugs. Thus we use information for drugs to make predictions for related pesticides and biocides. Tebuconazole is predicted as a CYP 3A4 substrate and inhibitor, and as a CYP 2C9 inhibitor, but not as a substrate. Prochloraz is predicted as CYP 2C9 substrate. Most of the other predictions for prochloraz are inconclusive. CYP 3A4 and CYP 2C9 are common metabolic enzymes for this type of compounds. Both compounds are predicted not to be CYP 2D6 substrates, tebuconazole is predicted as non-inhibitor to CYP 2D6, and the corresponding prediction for prochloraz is inconclusive. This is not surprising, as the 2D6 isoform is not a common metabolizing enzyme for triazole and imidazole compounds. The metabolites of tebuconazole (2 3, 4 and 6), which are structurally similar to the parent compound, are generally predicted to interact with the same CYPs as tebuconazole. The same is the case for metabolite 1 of prochloraz, but not for metabolites 2 and 3, which are structurally quite distinct form prochloraz. For prochloraz we did the prediction for the glucoronide (metabolite 7) as well, a conjugated product not supposed to be metabolized by CYP enzymes, and it is predicted negative in all models. We have used this analysis to provide possible CYP interactions, in addition to those known before for these compounds. We have also provided a hypothesis on how tebuconazole and prochloraz might interact, namely through substrate activity and inhibition of CYP 2C9.

60 Optimization of the cumulative risk assessment of pesticides and biocides using computational techniques: Pilot project
TABLE 4.1. PREDICTED CYP 2C9 ACTIVITY OF TEBUCONAZOLE, PROCHLORAZ AND THEIR METABOLITES.
Compound CYP 2C9 substrate CYP 2C9 inhibitor
Probability Prediction Probability Prediction
Tebuconazole 0.12 Negative 0.75 Positive
Tebuconazole: Metabolite 3
0.09 Negative 0.75 Positive
Tebuconazole: Metabolite 6
0.23 Negative 0.97 Positive
Tebuconazole: Metabolite 4
0.03 Negative 0.82 Positive
Tebuconazole: Metabolite 2
0.10 Negative 0.75 Positive
Prochloraz 0.74 Positive 0.46 Inconclusive
Prochloraz: Metabolite 1 Prochloraz: Metabolite 2
0.72 0.20
Positive Negative
0.36 0.09
Inconclusive Negative
Prochloraz: Metabolite 3 0.62 Inconclusive 0.53 Inconclusive
Prochloraz: Metabolite 7 0.04 Negative 0.12 Negative
TABLE 4.2. PREDICTED CYP 3A4 ACTIVITY OF TEBUCONAZOLE, PROCHLORAZ AND THEIR METABOLITES.
Compound CYP 3A4 substrate CYP 3A4 inhibitor
Probability Prediction Probability Prediction
Tebuconazole 0.79 Positive 0.82 Positive
Tebuconazole: Metabolite 3
0.74 Positive 0.85 Positive
Tebuconazole: Metabolite 6
0.58 Inconclusive 0.80 Positive
Tebuconazole: Metabolite 4
0.64 Inconclusive 0.92 Positive
Tebuconazole: Metabolite 2
0.82 Positive 0.84 Positive
Prochloraz 0.35 Inconclusive 0.63 Inconclusive
Prochloraz: Metabolite 1 Prochloraz: Metabolite 2
0.33 0.22
Inconclusive Negative
0.55 0.08
Inconclusive Negative
Prochloraz: Metabolite 3 0.21 Negative 0.05 Negative
Prochloraz: Metabolite 7 0.21 Negative 0.21 Negative

Optimization of the cumulative risk assessment of pesticides and biocides using computational techniques: Pilot project 61
TABLE 4.3. PREDICTED CYP 2D6 ACTIVITY OF TEBUCONAZOLE, PROCHLORAZ AND THEIR METABOLITES.
Compound CYP 2D6 substrate CYP 2D6 inhibitor
Probability Prediction Probability Prediction
Tebuconazole 0.14 Negative 0.34 Negative
Tebuconazole: Metabolite 3
0.10 Negative 0.31 Inconclusive
Tebuconazole: Metabolite 6
0.03 Negative 0.38 Inconclusive
Tebuconazole: Metabolite 4
0.08 Negative 0.55 Inconclusive
Tebuconazole: Metabolite 2
0.13 Negative 0.33 Inconclusive
Prochloraz 0.15 Negative 0.64 Inconclusive
Prochloraz: Metabolite 1 Prochloraz: Metabolite 2
0.21 0.48
Negative Inconclusive
0.63 0.49
Inconclusive Inconclusive
Prochloraz: Metabolite 3 0.02 Negative 0.13 Negative
Prochloraz: Metabolite 7 0.01 Negative 0.05 Negative
4.1.2 New QSAR Models for Predicting Parameters for PBTK Models New Quantitative Structure-Activity Relationship (QSAR) models were developed for three properties, volume of distribution at steady state (VdSS), plasma protein binding (%PPB) and %renal clearance. In all cases the models were based on human data for triazole and imidazole compounds with available experimental data. 2D drawings of all the compounds in the training sets for these properties are found in Appendix 7 and corresponding 2D drawings of tebuconazole and prochloraz are shown in Table 4.4.
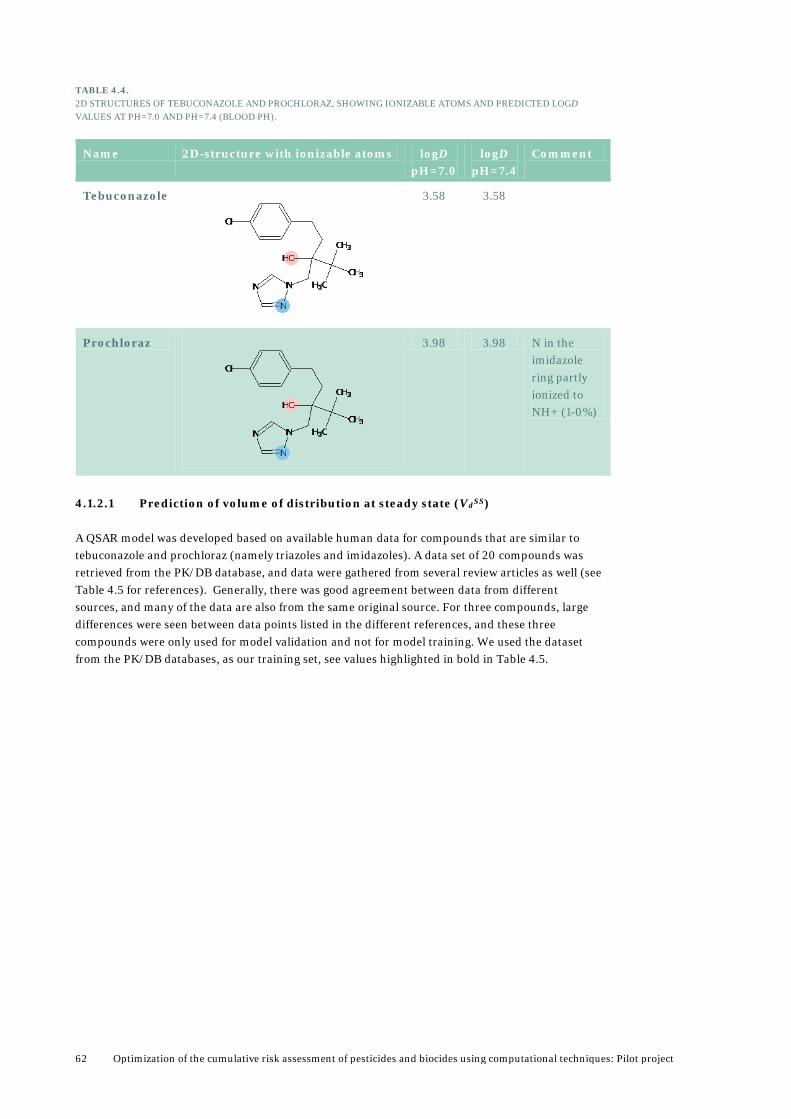
62 Optimization of the cumulative risk assessment of pesticides and biocides using computational techniques: Pilot project
TABLE 4.4. 2D STRUCTURES OF TEBUCONAZOLE AND PROCHLORAZ, SHOWING IONIZABLE ATOMS AND PREDICTED LOGD VALUES AT PH=7.0 AND PH=7.4 (BLOOD PH).
Name 2D-structure with ionizable atoms logD pH=7.0
logD pH=7.4
Comment
Tebuconazole
3.58 3.58
Prochloraz
3.98 3.98 N in the imidazole ring partly ionized to NH+ (1-0%)
4.1.2.1 Prediction of volume of distribution at steady state (VdSS) A QSAR model was developed based on available human data for compounds that are similar to tebuconazole and prochloraz (namely triazoles and imidazoles). A data set of 20 compounds was retrieved from the PK/DB database, and data were gathered from several review articles as well (see Table 4.5 for references). Generally, there was good agreement between data from different sources, and many of the data are also from the same original source. For three compounds, large differences were seen between data points listed in the different references, and these three compounds were only used for model validation and not for model training. We used the dataset from the PK/DB databases, as our training set, see values highlighted in bold in Table 4.5.

Optimization of the cumulative risk assessment of pesticides and biocides using computational techniques: Pilot project 63
TABLE 4.5. TRAINING SET FOR DEVELOPING A QSAR MODEL FOR HUMAN VDSS. DATA SET RETRIEVED FROM THE PK/DB DATABASE WAS USED AS TRAINING SET (NUMBERS IN BOLD), AND DATA COLLECTIONS FROM OTHER SOURCES ARE SHOWN FOR COMPARISON. THREE COMPOUNDS WITH LARGE DIFFERENCES IN AVAILABLE DATA WERE ONLY USED FOR MODEL VALIDATION. COMPOUNDS USED FOR EXTERNAL VALIDATION OF THE SECOND MODEL ARE MARKED WITH *.
Compound Volume of Distribution (VdSS [l/kg])
PK/DB Gleeson Obach Lombardo Lombardo
Database (Moda et
al., 2008)
2006 (Gleeson
et al., 2006)
2008 (Obach et al., 2008)
2004 (Lombardo
et al., 2004)
2002 (Lombardo et al., 2002)
Training set
Aripiprazole 4.9 4.9
Cefmetazole 0.13 0.13
Clomethiazole 6.6 6.6
Fluconazole 0.6 0.6 0.75 0.6 0.6.
Fosfluconazole* 0.15 0.15
Genaconazole 0.62 0.62
Lansoprazole 0.425 0.28
Letrozole 1.87 1.9
Mebendazole 1.23 1.2
Methimazole 0.86 0.86
Metronidazole 0.74 0.74 0.40 0.74 0.74
Omeprazole 0.34 0.34 0.24 0.34 0.34
Rabeprazole 0.22 0.22
Sulfisoxazole 0.15 0.15 0.17
Sulfamethoxazole 0.26 0.29 0.30
Tinidazole* 0.59 0.59
Voriconazole* 2.2 2.2 4.6
Validation set
Itraconazole 14. 14. 7.4 3.9 3.9
Ketoconazole 2.4 0.15
Pantoprazole 23.6 0.17
The following model was developed on all 17 training set data points (model 1), see Figure 4.1.
VdSS [l/kg] = 2.76658 * SaaS + 304.336 * xch10 - 10.2636 * MaxHp + 2.92685

64 Optimization of the cumulative risk assessment of pesticides and biocides using computational techniques: Pilot project
• No. PLS-factors=3, no. descriptors=3 (see equation) • Training performances: r2=0.94, q2=0.94, rmsd=0.43 l/kg • Cross validated performances by LOO: r2CV=0.93, q2CV=0.93, rmsdCV=0.45 l/kg
FIGURE 4.1. OBSERVED (X-AXIS) VERSUS PREDICTED (Y-AXIS) VDSS VALUES [L/KG] FROM THE CROSS-VALIDATED VERSION OF THE MODEL USING THE LEAVE ONE OUT (LOO) METHOD. THE FULL TRAINING SET OF 17 COMPOUNDS WAS USED IN MODEL 1.
An additional model was developed on 14 data points from the training set, leaving the three data points corresponding with three compounds marked with * out, giving the following model (model 2), see Figure 4.2.
VdSS [l/kg] = 2.83666 * SaaS + 313.478 * xch10 - 10.3384 * MaxHp + 2.8163
• No. PLS-factors=3, no. descriptors=3 • Training performances: r2=0.98, q2=0.98, rmsd=0.24 l/kg • Cross validated performances by LOO: r2CV=0.98, q2CV=0.98, rmsdCV=0.29 l/kg • External validation of model 2 for the three compounds marked with *, see Table 4.6, showed
that voriconazole was not described as well by the regression equation for the full data set, as the other compounds (Figure 4.1). Similarly the predicted value is significantly underestimated, when used for external validation.
TABLE 4.6. EXTERNAL VALIDATION OF MODEL 2, USING THE THREE COMPOUND MARKED WITH * IN TABLE 4.5. THE COMPOUNDS WERE LEFT OUT FROM MODEL 2, BUT USED FOR TRAINING MODEL 1.
Compound VdSS [l/kg]
Exp. Pred.
Fosfluconzole 0.15 0.20
Trinidazole 0.59 0.20
Voriconazole 2.2 0.63

Optimization of the cumulative risk assessment of pesticides and biocides using computational techniques: Pilot project 65
FIGURE 4.2. OBSERVED (X-AXIS) VERSUS PREDICTED (Y-AXIS) VDSS VALUES FROM THE CROSS-VALIDATED VERSION OF THE MODEL USING THE LEAVE ONE OUT (LOO) METHOD. A SUB-SET OF 14 COMPOUNDS FROM THE TRAINING SET (MODEL 2).
Both models were then validated by using the validation set in Table 4.5, the three compounds that were not included in any of the of two models (Table 4.7). These are the compounds with different experimental data from different sources, and thus we can’t be certain what the correct experimental values are for these compounds. The predicted values for both ketoconazole and pantroprazole agree well with one of the listed experimental data points. For itraconazole, which is a considerably larger molecule than any of the compounds in the training set, the predicted value does not agree with any of the proposed experimental values. TABLE 4.7. EXTERNAL VALIDATION OF MODELS 1 AND 2, USING THE VALIDATION SET TABLE 4.5. SEE THE EXPERIMENTAL VALUES IN TABLE 4.5.
Compound VdSS ([l/kg]
model 1 model 2
Itraconazole 1.5 1.4
Ketoconazole 2.0 1.8
Pantoprazole 0.67 0.54
The developed QSAR models are thus considered to be reliable for carrying out predictions for tebuconazole, prochloraz and their metabolites (Tabel 4.8). Whereas the metabolites formed for tebuconazole are similar to the parent compound, and have similar molecular structures to the training compounds, the metabolites of prochloraz are somewhat structurally different from the compounds in the data set. The predicted VdSS for tebuconazole and its metabolites are either identical, or very similar. It is a fair approximation to use the VdSS value of metabolite 3, which is one of the two most common metabolites, for the metabolites as a whole. The metabolites for prochloraz are somewhat more structurally distinct from the training set compounds, and thus the predictions for these metabolites might be less reliable, than those for the metabolites for tebuconazole. We have chosen the predicted value for metabolite 3 of prochloraz, as it is the most common of the metabolites.

66 Optimization of the cumulative risk assessment of pesticides and biocides using computational techniques: Pilot project
The predictions for use in the human PBTK models are thus as follows: For tebuconazole metabolites Vd(human)SS = 0.77 l/kg and for prochloraz metabolites Vd(human)SS = 0.58 l/kg. TABLE 4.8. HUMAN VDSS VALUES OF TEBUCONAZOLE, PROCHLORAZ AND THEIR MOST IMPORTANT METABOLITES, PREDICTED USING MODEL 1, DEVELOPED ON THE FULL TRAINING SET. THE VALUE FOR THE METABOLITE OF EACH COMPOUND WHICH HAS THE LARGEST RELATIVE CONCENTRATION WAS USED (MARKED IN BOLD).
Compound VdSS [l/kg]
model 1
Tebuconazole 0.77
Tebuconazole-met2 0.77
Tebuconazole-met3 0.77
Tebuconazole-met4 0.77
Tebuconazole-met6 0.58
Prochloraz 2.0
Prochloraz-met2 0.78
Prochloraz-met3 0.58
We also tried to develop a QSAR model for the volume of distribution, based on a more structurally diverse data set. We retrieved all compounds that contained either an imidazole or a triazole ring from the PK/DB database, 55 compounds in total. The resulting model showed to be significantly less accurate, than the QSAR models developed for a smaller group of more similar compounds, see the models presented above. The same trend is seen for models published in the literature for this property. As volume of distribution data for triazoles and imidazoles in rats were scarce, we used a correlation between human and rat data from the literature to estimate rat VdSS from the predicted human VdSS
values. We used the following relationship Caldwell et al. (Caldwell et al., 2004; Fagerholm, 2007) for a data set of 144 compounds.
log�𝑉𝑑(𝑟𝑎𝑡)𝑆𝑆 � = (log �𝑉𝑑(ℎ𝑢𝑚𝑎𝑛)
𝑆𝑆 + 0.18𝑙𝑘𝑔� 0.83�
The predicted values in rat are therefore according to this correlation, Vd(rat)SS = 1.2 l/kg for tebuconzole metabolites and Vd(rat)SS = 0.85 l/kg for prochloraz metabolites. 4.1.2.2 Prediction of Plasma Protein Binding (%PPB) A QSAR model was developed based on available human data for similar compounds (trizoles and imidazoles). A data set of 19 compounds was retrieved from the PK/DB database, and data were gathered from several review articles as well. Generally, there was good agreement between data from different sources, and many of the data are also from the same original source. For one compound, large difference was seen between data points listed in the different references, and this compound, sulfamethoxazole, was only used for model validation and not for model training. We used the data set from the PK/DB databases, as our training set, see values highlighted in bold in Tabel 4.9.

Optimization of the cumulative risk assessment of pesticides and biocides using computational techniques: Pilot project 67
TABLE 4.9. TRAINING SET FOR DEVELOPING QSAR MODEL FOR HUMAN PPB. DATA SET RETRIEVED FROM THE PK/DB DATABASE WAS USED AS A TRAINING SET (NUMBERS IN BOLD), WITH THE VALUE FOR SULFISOXAZOLE TAKEN FROM OBACH ET AL. DATA COLLECTIONS FROM OTHER SOURCES ARE SHOWN FOR COMPARISON. THREE COMPOUNDS FROM OTHER PAPERS, AND ONE COMPOUND WITH LARGE DIFFERENCES IN AVAILABLE DATA, WERE ONLY USED FOR MODEL VALIDATION. COMPOUNDS USED FOR EXTERNAL VALIDATION OF MODEL 3 AND 4 ARE MARKED WITH *.
Compound Plasma Protein Binding (PPB [%])1)
PK/DB Goodmann Obach Lombardo Lombardo Wan Kochansky
Database (Moda et
al., 2008)
1985
2008 (Obach et al., 2008)
2004 (Lombardo
et al., 2004)
2002 (Lombardo
et al., 2002)
2006 (Wan and Rehngren,
2006)
2008 (Kochansky
et al., 2008)
Training set
Albendazole* 70
Anastrozole* 40
Aripiprazole* 99 99
Cefmetazole 85 85
Clomethiazole 64 64
Fluconazole 11.5 11 11 11 11
Fosfluconazole 95.8 95.8
Itraconazole 99.8 99.8 87.2 87.2
Lansoprazole 97 97.9
Letrozole 60 59
Mebendazole 91.4 91.4 92.5
Metronidazole 11 10 4 11 11
Omeprazole 95 95 95 95
Pantoprazole 98 98
Rabeprazole 96.15 96.3
Sulfisoxazole 88.2 91.4 92.1
Tinidazole 12 20
Voriconazole 58 58 58
Validation set
Sulfamethoxazole
53 62 77
Astemizole 98.5
Clotrimizole 99.65
Ketoconzole 98.9 98.2
1) In many of the cited papers, the unbound (free) fraction in plasma (fu) was given. These values were converted to PPB (%PPB =(1-fu)*100).

68 Optimization of the cumulative risk assessment of pesticides and biocides using computational techniques: Pilot project
The SVM model described below was developed using all 18 training set data points (model 3) • SVM model type: epsilon-SVR, with radial distribution function kernel • SVM parameters: Cost=2, γ=0.5, termination criterion tolerance=0.1, epsilon=0.1 • Model: No. Support vectors=10, no. descriptors=7 • Descriptors selected: SsssCH, SsNH2, SssO, SdssS, SHBint3_Acnt, ABSQ, SpcPolarizability • Training performances: r2=0.99, q2=0.98, rmsd=3.9% • Cross validated performances by LOO: r2CV=0.93, q2CV=0.90, rmsdCV=10%
(a)
(b) FIGURE 4.3. OBSERVED (X-AXIS) VERSUS PREDICTED (Y-AXIS) %PPB VALUES FROM MODEL TRAINING (A) AND THE CROSS-VALIDATED VERSION OF THE MODEL USING THE LEAVE ONE OUT (LOO) METHOD (B). THE FULL TRAINING SET OF 18 COMPOUNDS (MODEL 3).
An additional SVM model was developed on 15 data points from the training set, leaving the three data points marked with * out, giving the following model (model 4). • SVM model type: epsilon-SVR, with radial distribution function kernel • SVM parameters: Cost=2, γ=0.5, termination criterion tolerance=0.1, epsilon=0.1 • Model: No. Support vectors=8, no. descriptors=5 • Descriptors selected: SssO, SdsssP, SaasC_acnt, numHBd, SpcPolarizability • Training performances: r2=0.98, q2=0.98, rmsd=5.0% • Cross validated performances by LOO: r2CV=0.96, q2CV=0.94, rmsdCV=8.1% • External validation for the three compounds marked with *, see Table 4.10. Very good
agreement is seen between experimental and predicted values.
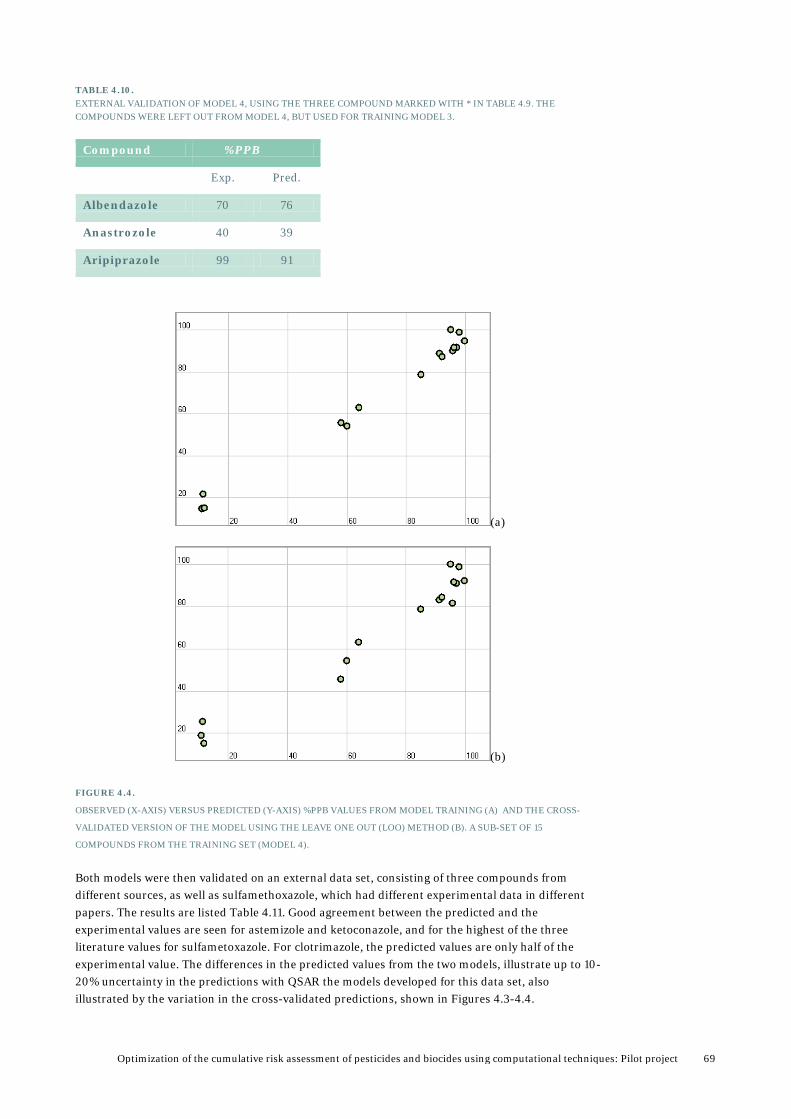
Optimization of the cumulative risk assessment of pesticides and biocides using computational techniques: Pilot project 69
TABLE 4.10. EXTERNAL VALIDATION OF MODEL 4, USING THE THREE COMPOUND MARKED WITH * IN TABLE 4.9. THE COMPOUNDS WERE LEFT OUT FROM MODEL 4, BUT USED FOR TRAINING MODEL 3.
Compound %PPB
Exp. Pred.
Albendazole 70 76
Anastrozole 40 39
Aripiprazole 99 91
(a)
(b)
FIGURE 4.4.
OBSERVED (X-AXIS) VERSUS PREDICTED (Y-AXIS) %PPB VALUES FROM MODEL TRAINING (A) AND THE CROSS-
VALIDATED VERSION OF THE MODEL USING THE LEAVE ONE OUT (LOO) METHOD (B). A SUB-SET OF 15
COMPOUNDS FROM THE TRAINING SET (MODEL 4). Both models were then validated on an external data set, consisting of three compounds from different sources, as well as sulfamethoxazole, which had different experimental data in different papers. The results are listed Table 4.11. Good agreement between the predicted and the experimental values are seen for astemizole and ketoconazole, and for the highest of the three literature values for sulfametoxazole. For clotrimazole, the predicted values are only half of the experimental value. The differences in the predicted values from the two models, illustrate up to 10-20% uncertainty in the predictions with QSAR the models developed for this data set, also illustrated by the variation in the cross-validated predictions, shown in Figures 4.3-4.4.

70 Optimization of the cumulative risk assessment of pesticides and biocides using computational techniques: Pilot project
TABLE 4.11. EXTERNAL VALIDATION OF MODELS 3 AND 6, USING THE VALIDATION SET TABLE 4.9.
Compound %PPB
exp. model 3 model 4
Astemizole 98 96 76
Clotrimazole 99.7 50 55
Ketoconazole Sulfamethoxazole
98-99 53-77
99 90
96 82
The developed QSAR models are thus considered to be reliable for carrying out predictions for tebuconazole and prochloraz, predictions for their metabolites are not needed for this properties. The predicted human values are shown in Table 4.12. The human values predicted with model 3 (the model developed on the largest number of data points) were used for the PBTK modelling.
Table 4.12. Human PPB values of tebuconazole, prochloraz, predicted using model 3, developed on the full
training set, and model 4. Predictions by model 3, are used in the PBTK model, as this model was developed
using more data points and harbours thus the most information (values marked in bold).
Compound %PPBhuman
model 3 model 4
Tebuconazole 66 63
Prochloraz 93 83
Available PPB values for triazoles and imidazoles in rats, were scarce, and therefore we used a correlation between human and rat data from the literature to estimate rat PPB based on the predicted human PPB values. Gleeson and coworkers (Gleeson et al., 2006) developed the following relationship from rat and human data for 548 in house compounds at Astra Zeneca. The rat and the human data were seen to be highly correlated (r2=0.78), where the protein binding was generally higher in humans than in rats.
log𝐾𝑃𝑃𝐵(𝑟𝑎𝑡) = (log𝐾𝑃𝑃𝐵(ℎ𝑢𝑚𝑎𝑛) − 0.34 ) / 0.95
log𝐾𝑃𝑃𝐵 = 𝑙𝑜𝑔 �1 − 𝑓𝑢𝑓𝑢
� = log �%𝑃𝑃𝐵
100− %𝑃𝑃𝐵�
The predicted values in rat are therefore according to this correlation and the human values predicted with model 3, PPBrat=47% for tebuconzole and PPBrat=87% for prochloraz.
4.1.3 Prediction of Renal Clearance We have a small data set with information on the percentage of parent compound that is excreted with renal clearance, human data, from the PK/DB database (Moda et al., 2008). Including the compounds with high clearance in the model, made the model less accurate at lower clearance, and thus we only used the data points for %Cl between 0 and 14, ten compounds in total (Table 4.12). The following PLS model was developed on all 10 training set data points (model 5), see Figure 4.5.
%Cl = 1.37741 * StsC + 2.37578 * SsNH2 - 17.4202 * SddsN + 0.972942 • No. PLS-factors=3, no. descriptors=3
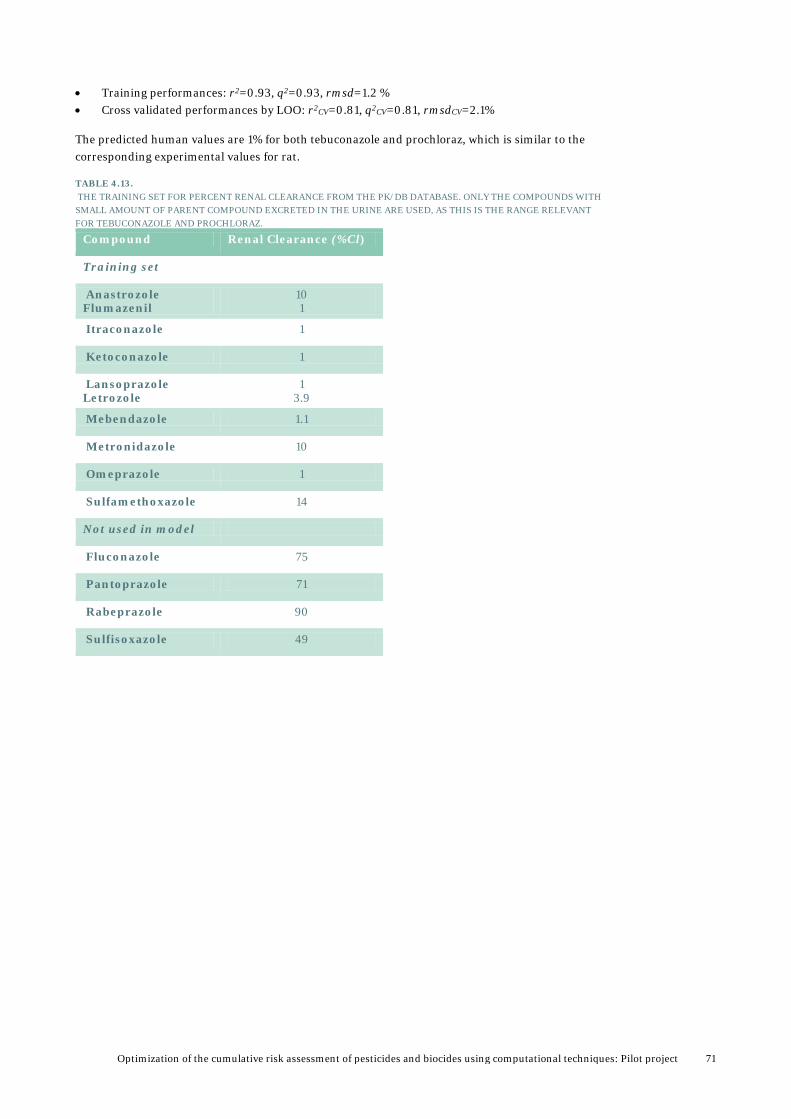
Optimization of the cumulative risk assessment of pesticides and biocides using computational techniques: Pilot project 71
• Training performances: r2=0.93, q2=0.93, rmsd=1.2 % • Cross validated performances by LOO: r2CV=0.81, q2CV=0.81, rmsdCV=2.1%
The predicted human values are 1% for both tebuconazole and prochloraz, which is similar to the corresponding experimental values for rat. TABLE 4.13. THE TRAINING SET FOR PERCENT RENAL CLEARANCE FROM THE PK/DB DATABASE. ONLY THE COMPOUNDS WITH SMALL AMOUNT OF PARENT COMPOUND EXCRETED IN THE URINE ARE USED, AS THIS IS THE RANGE RELEVANT FOR TEBUCONAZOLE AND PROCHLORAZ.
Compound Renal Clearance (%Cl)
Training set
Anastrozole Flumazenil
10 1
Itraconazole 1
Ketoconazole 1
Lansoprazole Letrozole
1 3.9
Mebendazole 1.1
Metronidazole 10
Omeprazole 1
Sulfamethoxazole 14
Not used in model
Fluconazole 75
Pantoprazole 71
Rabeprazole 90
Sulfisoxazole 49

72 Optimization of the cumulative risk assessment of pesticides and biocides using computational techniques: Pilot project
(a)
(b)
Figure 4.5. Observed (x-axis) versus predicted (y-axis) %Cl values from model training (a) and the cross-
validated version of the model using the leave one out (LOO) method (b). The full training set of 10 compounds
(model 5).

Optimization of the cumulative risk assessment of pesticides and biocides using computational techniques: Pilot project 73
5. Results from PBTK modelling
This section presents results for PBTK simulations carried out with the models developed in this project and described above. Simulations have been carried out in rat, rabbit and rhesus monkey for validating the models, and simulations on specific exposure criteria were then made using the human models. Validation of the elimination part of the models is discussed in section 3.3.2.3.
5.1 Validation and analysis of PBTK model for tebuconazole The availability of good validation data in rat was rather limited. Plasma concentration data for the total radioactivity (tebuconazole and metabolites) measured in rats at different time points after administration as oral bolus dose have been published (JMPR, 2010; European Commission, 2007b). These data are for two dose groups (2 and 20 mg/kg BW) in male and female rats, respectively. Concentrations in tissues were only measured 72 hrs after administration. These data confirm that almost the entire dose has been excreted at this time points. We have information on tebuconazole levels in rat, as tebuconazole and not as the sum of tebuconazole and metabolites, from a report by Hass and co-workers (Hass and et al., 2012). Data were available on both concentrations in plasma and in several tissues at various time points after intra-venous (iv) administration to male rabbit (Zhu et al., 2007), which was the most complete validation data set available to us. 5.1.1 Validation of model by using rabbit data A good data set with plasma and tissue concentrations at various time points in rabbits, after administration of tebuconazole by intra venous (iv) dose (30 mg/kg BW) was available (Zhu et al., 2007). This data set was used for validating the model, and the rat model was extended and modified for the purpose of modelling rabbits, see section 5.1.1.2. Thus a special version of the model was made for simulation in rabbit, as described below. 5.1.1.1 Adaptation of the rat model to a rabbit model Several changes and modifications of the model equations and parameters had to be made. • First, the model was extended to cover brain, heart, kidney, liver, lung, muscle and fat as
separate compartments. The remaining tissue (skin and bone) were put to a separate compartment, called “rest of body”. The additional compartments were implemented in the same way as the compartments discussed in Appendix 2.
• Second, we had to calculate tissue volumes and blood flows separately for all these compartments as described in section 3.3.1, using the values given in Table 3.3. We used tissue volume of liver (Vp,liver) given for rabbit, and for the other organs it was assumed that tissue volumes and blood flows were the same percentage of the body weight and cardiac output,

74 Optimization of the cumulative risk assessment of pesticides and biocides using computational techniques: Pilot project
respectively, as in rat. Thus Vp,t and Qp,t values as for rat, were multiplied by BW and QC for rabbit, respectively. QC for rabbit was estimated by interspecies scaling based on the corresponding value for rat, and BW was set to the mean body weight of the test animals used. We used the same tissue:blood partition coefficients and fraction unbound in plasma (fu) as used for rat. Vmax and elimination constants for rat were converted by interspecies scaling to be used for rabbit, as described by Campbell et al. (Campbell, Jr. et al., 2012).
• Third, the equations were changed such that the time was calculated in minutes and not hours. This was done because an iv dose is administered and distributed within minutes. Thus, appropriate parameters and rates of administration of tebuconazole via the different routes had to be modified accordingly.
• Fourth, the iv dose implementation was adjusted by modifying the following equation in the blood compartments. As discussed in Appendix 2, the iv dose is added to the venous blood. The equation has also been modified to cover all the compartment used in the rabbit model.
𝐶𝑉(𝐶1𝑀0) = �𝑄𝑏𝑟𝑎𝑖𝑛 𝐶𝑉,𝑏𝑟𝑎𝑖𝑛(𝐶1𝑀0) + 𝑄ℎ𝑒𝑎𝑟𝑡 𝐶𝑉,ℎ𝑒𝑎𝑟𝑡(𝐶1𝑀0) + 𝑄𝑘𝑖𝑑𝑛𝑒𝑦 𝐶𝑉,𝑘𝑖𝑑𝑛𝑒𝑦(𝐶1𝑀0)
+ 𝑄𝑙𝑖𝑣𝑒𝑟 𝐶𝑉,𝑙𝑖𝑣𝑒𝑟(𝐶1𝑀0) + 𝑄𝑙𝑢𝑛𝑔 𝐶𝑉,𝑙𝑢𝑛𝑔(𝐶1𝑀0)
+ 𝑄𝑚𝑢𝑠𝑐𝑙𝑒 𝐶𝑉,𝑚𝑢𝑐𝑙𝑒(𝐶1𝑀0)
+ 𝑄𝑓𝑎𝑡 𝐶𝑉,𝑓𝑎𝑡(𝐶1𝑀0) + 𝐴𝐼𝑉𝑒𝑥𝑝(𝐶1𝑀0)′ � / (𝑄𝑏𝑟𝑎𝑖𝑛 + 𝑄ℎ𝑒𝑎𝑟𝑡 + 𝑄𝑘𝑖𝑑𝑛𝑒𝑦 + 𝑄𝑙𝑖𝑣𝑒𝑟 + 𝑄𝑙𝑢𝑛𝑔
+ 𝑄𝑚𝑢𝑠𝑐𝑙𝑒 + 𝑄𝑓𝑎𝑡)
Where A´IVexp was calculated with the following equation, where AIVdose is the iv dose in [mg/kg BW] and A´IVexp and A´kiv have the unit [µmol/min]. It is assumed that the iv dose is administered and distributed in the blood in two minutes. (We could have used one minute as well, both values secure fast distribution of the compound in the body).
𝐴𝐼𝑉𝑒𝑥𝑝(𝐶1𝑀0)′ = 𝐼𝐹 𝑇𝐼𝑀𝐸 ≤ 2 𝑇𝐻𝐸𝑁 𝐴𝑘𝑖𝑣(𝐶1𝑀0)
′ 𝐸𝐿𝑆𝐸 0
𝐴′𝑘𝑖𝑣(𝐶1𝑀0) = 𝐴𝐼𝑉𝑑𝑜𝑠𝑒(𝐶1𝑀0) 𝐵𝑊𝑟𝑎𝑏𝑏𝑖𝑡
𝑀𝑊𝐶1𝑀0
12 𝑚𝑖𝑛
5.1.1.2 Validation results Half of the administered tebuconazole in the model was metabolized after 94 min, which is the predicted half-life. Zhu et al. (Zhu et al., 2007) estimated the half-life of the R(-) and the S(+) enantiomers to 123 min and 88 min, respectively, from in vivo data measured in rabbits. The mean of these values is 104 min, and thus the predicted value is in good agreement with this value. This indicates that the rate of metabolism is correctly simulated with the model. The calculated blood concentrations and the measured plasma concentrations are shown in Figure 5.1, showing good agreement between the simulated curve and the experimental data. The simulated curve underestimates the blood concentration levels slightly at 15, 30 and 60 min after iv administration, the simulated values are around 60% of the experimental ones at 15 and 30 min post administration. The results are thus within the accuracy one can expect for such a fully predictive model. It is seen for this data that the elimination time in rabbit is about eight hours, and this is simulated excellently by the model. As the predicted partition coefficient between plasma and erythrocytes is estimated to be close to one, it is assumed that the plasma and blood concentration are similar, and thus plasma level data were used for validating blood concentrations simulated by the model.
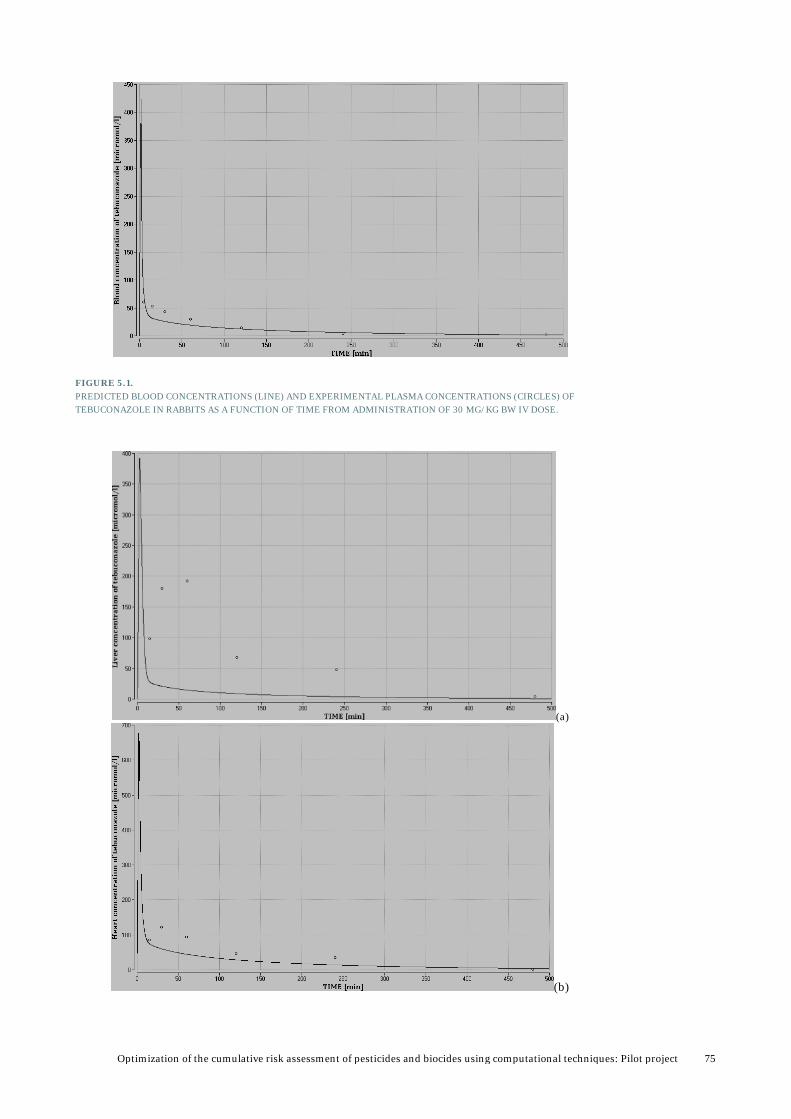
Optimization of the cumulative risk assessment of pesticides and biocides using computational techniques: Pilot project 75
FIGURE 5.1. PREDICTED BLOOD CONCENTRATIONS (LINE) AND EXPERIMENTAL PLASMA CONCENTRATIONS (CIRCLES) OF TEBUCONAZOLE IN RABBITS AS A FUNCTION OF TIME FROM ADMINISTRATION OF 30 MG/KG BW IV DOSE.
(a)
(b)

76 Optimization of the cumulative risk assessment of pesticides and biocides using computational techniques: Pilot project
(c)
(d)
FIGURE 5.2. PREDICTED AND EXPERIMENTAL LIVER (A), HEART (B), KIDNEY (C) AND BRAIN (D) CONCENTRATIONS OF TEBUCONAZOLE IN RABBITS AS A FUNCTION OF TIME FROM ADMINISTRATION OF 30 MG/KG BW IV DOSE. THE LINE IS THE CURVE SIMULATED BY PBTK AND THE CIRCLES ARE THE EXPERIMENTAL DATA.
As seen on Figures 5.2 and 5.3, fairly good agreement is seen between predicted and experimental tissue concentrations for heart, kidney, brain and muscle, and within the levels on can expect from a simulation entirely based on other types of experimental data. The simulation curves for the heart and the kidney underestimate some of the experimental data points by a factor of two and the simulated curve for the brain overestimates the concentration by one third. The first data point at 15 min post administration is significantly lower than the subsequent data points in all these data sets, indicating a long lag time for the tebuconazole to distribute to the different tissues. A flow regulated PBTK model would not capture such lag time, as it assumes instantaneous distribution within the body, where thermodynamic equilibrium is simulated by the tissue:blood partition coefficients implemented in the model. It is possible that it takes some time to establish equilibrium in a living system, although the data show surprisingly long lag time. The flow regulated well stirred model approach can be considered appropriate on slightly longer time-scale,

Optimization of the cumulative risk assessment of pesticides and biocides using computational techniques: Pilot project 77
and thereby at time scale relevant for this project. It should be mentioned that each data point is based on one animal only. The liver concentrations are significantly underestimated by the model. In the simulation it is assumed that all the tebuconazole is metabolised in the liver, but in the absence of the first pass effect of oral administration, metabolism in other organs like lung might be of importance too. It can be seen that the experimental levels in liver and kidney are similar, as the partition to these organs is similar in the model, but it seems that the metabolism simulation in the liver lowers the liver levels significantly. As the liver is the main target organ, the model has to be improved with respect to partition to the liver. It is seen in Figure 5.3, that the concentrations in the lung are largely underestimated by the model. The experimental manuscript discusses that the tebuconazole was stockpiled in the lung due to lung first-pass effect (Zhu et al., 2007). It is assumed that tebuconazole does not bind to tissue proteins, with the fraction unbound in the tissue term in the partition coefficient equation set to one. In fact, this assumption might not be correct for all the tissues, and thus the high experimental concentration in lung might be due to binding. The biological evidence is not sufficient to implement this in the model in this work, and thus we have to conclude that the present model does not capture the specific behaviour of the lung compartment. The lung compartment is considered of low importance with respect to the overall aims of the particular project, as it is normally lumped into the rapid tissues compartment, and thus we will not seek to improve the present model for this compartment. The simulated curve for fat matches three data points fairly well. It is often necessary to implement somewhat more complicated model to simulate adipose tissue adequately, where the fat compartment is modified by adding a deep compartment (reservoir) to account for accumulation of the compound in fat tissue. Although the data indicate slight accumulation in fat over a short period of time, this would require fitting of two additional rate constants between the two fat compartments. As fat is not a target tissue and tebuconazole is not a persistent chemical, it was not considered necessary to implement such extension in this model. The simulation for the fat compartment might, however, be less accurate because of the simple implementation used in this model. The overall conclusion is that the model predicts the concentration in plasma and in most of the tissues within acceptable accuracy. An exception to this, are the predictions for the liver and lung compartments. We need to use a larger partition coefficient Pliver:b value in the simulations, in order to simulate better partitioning to the liver, because it is a target organ.

78 Optimization of the cumulative risk assessment of pesticides and biocides using computational techniques: Pilot project
(a)
(b)
(c) FIGURE 5.3. PREDICTED AND EXPERIMENTAL LUNG (A), MUSCLE (B) AND FAT (C) CONCENTRATIONS OF TEBUCONZOLE IN RABBITS AS A FUNCTION OF TIME FROM ADMINISTRATION OF 30 MG/KG BW IV DOSE. THE LINE IS THE CURVE SIMULATED BY PBTK AND THE CIRCLES ARE THE EXPERIMENTAL DATA.
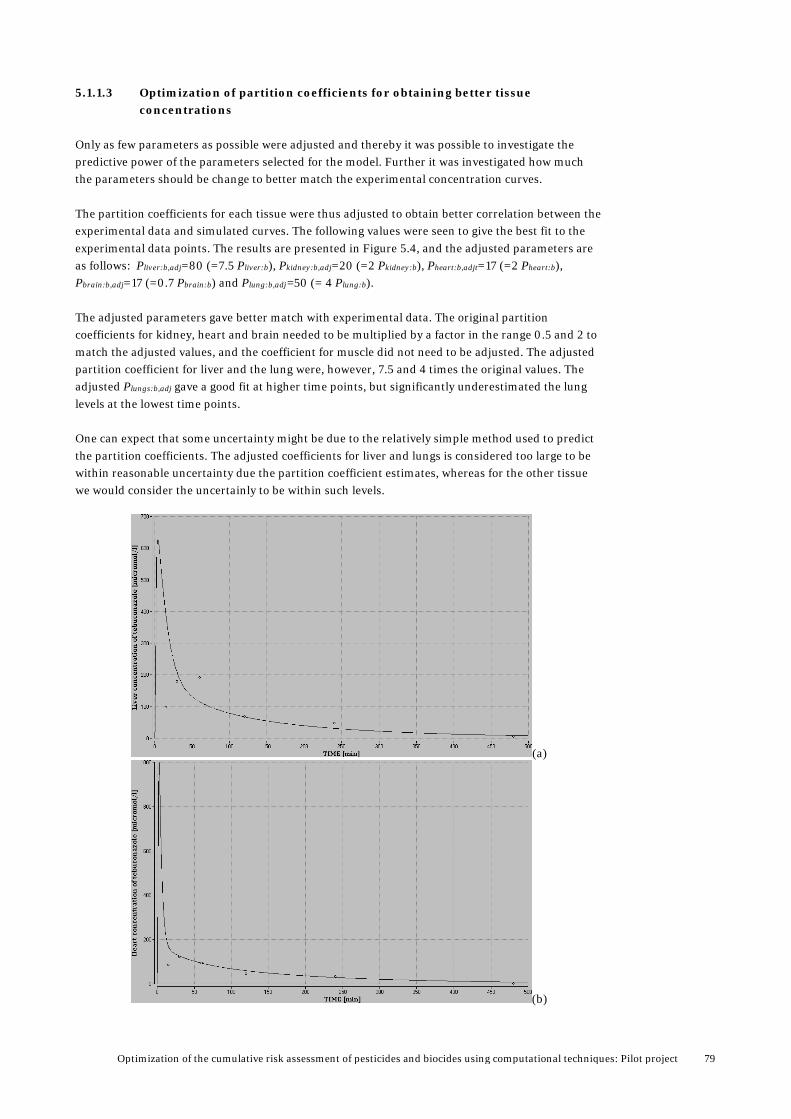
Optimization of the cumulative risk assessment of pesticides and biocides using computational techniques: Pilot project 79
5.1.1.3 Optimization of partition coefficients for obtaining better tissue concentrations
Only as few parameters as possible were adjusted and thereby it was possible to investigate the predictive power of the parameters selected for the model. Further it was investigated how much the parameters should be change to better match the experimental concentration curves. The partition coefficients for each tissue were thus adjusted to obtain better correlation between the experimental data and simulated curves. The following values were seen to give the best fit to the experimental data points. The results are presented in Figure 5.4, and the adjusted parameters are as follows: Pliver:b,adj=80 (=7.5 Pliver:b), Pkidney:b,adj=20 (=2 Pkidney:b), Pheart:b,adjt=17 (=2 Pheart:b), Pbrain:b,adj=17 (=0.7 Pbrain:b) and Plung:b,adj=50 (= 4 Plung:b). The adjusted parameters gave better match with experimental data. The original partition coefficients for kidney, heart and brain needed to be multiplied by a factor in the range 0.5 and 2 to match the adjusted values, and the coefficient for muscle did not need to be adjusted. The adjusted partition coefficient for liver and the lung were, however, 7.5 and 4 times the original values. The adjusted Plungs:b,adj gave a good fit at higher time points, but significantly underestimated the lung levels at the lowest time points. One can expect that some uncertainty might be due to the relatively simple method used to predict the partition coefficients. The adjusted coefficients for liver and lungs is considered too large to be within reasonable uncertainty due the partition coefficient estimates, whereas for the other tissue we would consider the uncertainly to be within such levels.
(a)
(b)

80 Optimization of the cumulative risk assessment of pesticides and biocides using computational techniques: Pilot project
(c)
(d)
FIGURE 5.4. SIMULATED AND EXPERIMENTAL LIVER (A), HEART (B), KIDNEY (C), BRAIN (D) AND LUNG (E) CONCENTRATIONS OF TEBUCONAZOLE IN RABBITS AFTER ADMINISTRATION BY AN ORAL DOSE OF 30 MG/KG BW. THE LINE IS THE CURVE SIMULATED BY PBTK AND THE CIRCLES ARE THE EXPERIMENTAL DATA. IN EACH CASE THE PARTITION COEFFICIENT FOR THE GIVEN TISSUE WAS ADJUSTED TO OBTAIN BETTER MATCH BETWEEN THE EXPERIMENTAL DATA AND THE SIMULATED CURVE, PLIVER:B,ADJ=80. PKIDNEY:B,ADJ=20, PHEART:B,ADJ=17, PBRAIM:B,ADJ=17 AND PLUNG:B,ADJ=50.
5.1.1.4 Sensitivity key parameters on blood concentration It is important to have an idea about how sensitive the predictions are with respect to key parameters in the model. Above the influence of partition coefficients on tissue concentration was investigated. We also explored the effect of variation in fraction unbound in plasma and the metabolic constants (KM and Vmax) on plasma/blood concentration as well. The fraction unbound was predicted based on a QSAR model and in fact the value predicted for rat in the rabbit simulation. The metabolic constants were experimentally determined in rat liver microsomes and the corresponding parameters have been predicted for rabbit using interspecies extrapolation.

Optimization of the cumulative risk assessment of pesticides and biocides using computational techniques: Pilot project 81
FIGURE 5.5. THE INFLUENCE OF VARIATION IN THE FRACTION UNBOUND IN PLASMA ON THE SIMULATED BLOOD CONCENTRATION OF TEBUCONAZOLE IN RABBITS, AFTER ADMINISTRATION OF A 30 MG/KG BW IV DOSE. EXPERIMENTAL DATA ARE SHOWN AS CIRCLES AND SIMULATED CURVES: FU=0.25 YELLOW, FU=0.40 RED, FU=0.53 BLUE (VALUE FROM QSAR PREDICTION), FU=0.70 CYAN, FU=1.0 GREEN. THE SCALE OF THE Y-AXIS HAS BEEN CHANGED AND HALF OF THE IV PEAK CUT OFF.
The fraction unbound in plasma has significant influence on the blood concentration curve as expected, and it is seen that a value of 0.40 gives a perfect match to the experimental data (Figure 5.5). The value used in the PBTK model for rabbit has been calculated for rat by interspecies extrapolation based on a prediction made by a human QSAR model. Significant uncertainties are introduced by the interspecies extrapolation, as well as in the original QSAR prediction. Thus a fu value of 0.40 is within the uncertainty that might have been introduced by these operations. (We used the original predicted rat value in our analysis, but one can choose an adjusted value for rabbit instead.) The variation in the simulated tebuconazole levels introduced by multiplying or dividing the experimentally determined metabolic constants by a factor of two, is around 7 µmol/l for the maximum velocity and 4 µmol/l for KM (Figure 5.6). The simulation is very sensitive to two-fold variation in these parameters. Multiplying and dividing by factor of 10 does introduces much more significant variation with respect to the experimental concentration, prolonging the time period until all the tebuconazole has been metabolised.

82 Optimization of the cumulative risk assessment of pesticides and biocides using computational techniques: Pilot project
(a)
(b) FIGURE 5.6. THE INFLUENCE OF VARIATION IN VMAX (A) AND KM (B) ON THE SIMULATED BLOOD CONCENTRATION OF TEBUCONAZOLE IN RABBITS, AFTER ADMINISTRATION OF A 30 MG/KG BW IV DOSE. EXPERIMENTAL DATA ARE SHOWN AS CIRCLES AND SIMULATED CURVES USING METABOLIC CONSTANTS OBTAINED BY INTER-SPECIES EXTRAPOLATION BASED ON EXPERIMENTAL DATA FROM RAT ARE BLUE. SIMULATIONS WITH 10 X SMALLER VMAX AND KM (YELLOW CURVES), 2 X SMALLER (RED), 2 X LARGER (CYAN), 10 X LARGER (GREEN).
5.1.2 Validation and analysis based available data in rats A data set of plasma concentrations up to 72 hours after oral administration of tebuconazole to rats [phenyl-UL-14C]tebuconazole cited by Joint FAO/WHO Meeting on Pesticide Residues has been published (JMPR, 2010). The plasma concentration of the whole radioactivity (tebuconzole + metabolites) was measured after giving an oral dose of tebuconazole, 2 mg/kg BW and 20 mg/kg BW, respectively. Both data from male and female rats were collected at each dose, and five test animals were used for each data point.

Optimization of the cumulative risk assessment of pesticides and biocides using computational techniques: Pilot project 83
As these data measured the whole radioactivity and not the part which is unmetabolized tebuconazole, these data are only of limited value for validation purposes. What is worse is that the levels of total radioactivity were a very low fraction of the administered dose, indicating that most of the metabolites were eliminated instantaneously. According to the available excretion data, this is not likely to be the case, and thus it seems that something is wrong with these data (The same data set was given in Draft Assessment Report for tebuconazole as well (European Commission, 2007b)). The input of the administered dose from the GIT tract to the liver is simulated by a pulse function, using an absorption rate constant (ka) which controls how fast the tebuconazole is delivered to the liver. As discussed before, practically all the tebuconazole is absorbed in rat, and thus the fractional absorption was set to 1.0. Detailed information on the absorption rate was not available. The Joint FAO/WHO Meeting on Pesticide Residues (JMPR, 2010) estimated that all the tebuconazole was absorbed within an hour in rat. However, no detailed observations were provided to support this information. Setting a realistic value for the absorption rate constant is therefore a challenge. As discussed in section 3.3.2.2, half-lives of the two enanti0mers were measured to be 22 min. and 49 min in male rat microsomes, respectively. An average for a racemic mixture is thus 36 min., according to these measurements. These experiments are, however, made in a well stirred in vitro system, where the whole applied dose of tebuconazole was available to the metabolic enzymes from the beginning. In an in vivo experiment using oral administration, the dose is administrated reaches the liver over a period of time, and it would be oversimplification to assume that the metabolism can occur as fast in a rat liver, as in a well stirred cell model for a rat liver. The simulated amount of tebuconazole absorbed from the GIT to the liver and the total amount metabolites formed is shown on Figure 5.7. As we do not know the exact value of the absorption rate, we have carried out simulations at different ka values. According to a simulation where ka is set to 0.5 hr-1, half of the tebuconazole has been metabolized approximately. 1 hr and 40 min. after administration, which corresponds to the half-life obtained from these simulations. Changing the absorption constant, ka, to 1 and 2 hr-1 gives half lives of 50 min and 30 min, respectively, which is close to the half live measured in vitro in rat liver microsomes. Based on the analysis of half-lives and the JMPR estimate of one hour absorption time, the absorption rate constant, ka = 1 hr-1, was used for simulating absorption of an oral bolus dose. It is worth noticing that the experimental metabolic constants for tebuconazole do model the fast conversion of tebuconazole, which is experimentally observed. Thus according to this simple investigation of half-lives, the experimental metabolic constants seem to be reliable. Figure 5.8. shows the same data as Figure 5.7 (b) for the full simulation time, and the total masses of tebuconazole (AC1M0, total_massCiM0) and metabolites (AC1M1, total_massC1M1) in the rats body according to the simulation. These data illustrate the fast metabolism of tebuconazole, and that around 99% of the metabolites have been excreted from the rats body 72 hr after administration. The simulation at oral dose of 2 mg/kg BW is practically the same, but the amounts are lower by a factor of ten. By looking closer at Figure 5.8, it can be seen that according the simulation less than 1 µmol of tebuconazole is distributed in the different tissues and organs in the time period from one to seven hrs after administration of 20 mg/kg BW (16 µmol) tebuconazole (i.e. the difference between the total mass of C1M0 curve and the curve for the remaining tebuconazole in the GIT). In the same time period there are 12-14 µmol of different tebuconazole metabolites in the rat body. If we make an experiment where all the tissue blood partition coefficients are changed to 1, which means that the compound is equally distributed between blood and tissue, less than one µmol of tebuconazole is distributed in the rat body in the first one and a half hour of the simulation, and after that practically no tebuconazole is found. According to this, only the partitioning to tissue and organs

84 Optimization of the cumulative risk assessment of pesticides and biocides using computational techniques: Pilot project
causes the tebuconazole to be distributed in low concentrations in the rat body, hindering that all the tebuconazole would be metabolized as soon as it enters the body.
(a)
(b) FIGURE 5.7. SIMULATED AMOUNT OF TEBUCONAZOLE IN THE GIT (AOL) (THE DECREASE IN AOL IS THE INPUT TO THE LIVER) AS A RESULT OF AN ADMINISTERED ORAL BOLUS DOSE OF 2 MG/KG BW (A) AND 20 MG/KG BW (B), AND THE CORRESPONDING AMOUNT OF METABOLITES FORMED IN THE LIVER (AML). THE Y-AXIS IS THE AMOUNT OF TEBUCONAZOLE OR METABOLITES IN [µMOL] AND THE X-AXIS IS THE TIME FROM ADMINISTRATION IN [HR]. THE BLACK AOL CURVE AND THE CYAN AML CURVE RESULT FROM A SIMULATION WITH THE ABSORPTION RATE CONSTANT KA SET TO 2 HR-1, THE CORRESPONDING CURVES FOR KA SET TO 1 HR-1 ARE MAGENTA AND YELLOW, AND THE FOR KA SET TO 0.5 HR-1 BLUE AND GREEN. IT IS SEEN THAT ACCORDING TO THE SIMULATION, HALF OF THE ADMINISTERED DOSE HAS BEEN METABOLIZED AFTER CA. 30 MIN FOR KA=2 HR-1, CA. 50 MIN FOR KA=1 HR-1 AND CA. 1 HR AND 40 MIN FOR KA=0.5HR-1 .
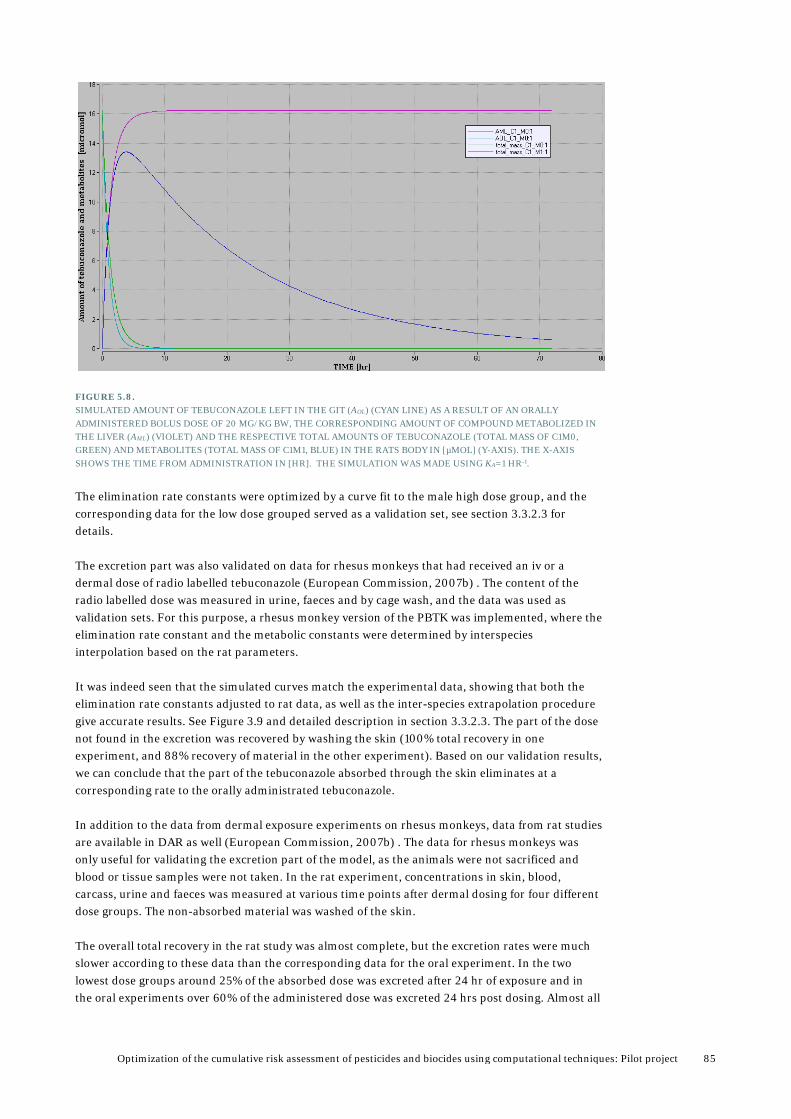
Optimization of the cumulative risk assessment of pesticides and biocides using computational techniques: Pilot project 85
FIGURE 5.8. SIMULATED AMOUNT OF TEBUCONAZOLE LEFT IN THE GIT (AOL) (CYAN LINE) AS A RESULT OF AN ORALLY ADMINISTERED BOLUS DOSE OF 20 MG/KG BW, THE CORRESPONDING AMOUNT OF COMPOUND METABOLIZED IN THE LIVER (AML) (VIOLET) AND THE RESPECTIVE TOTAL AMOUNTS OF TEBUCONAZOLE (TOTAL MASS OF C1M0, GREEN) AND METABOLITES (TOTAL MASS OF C1M1, BLUE) IN THE RATS BODY IN [µMOL] (Y-AXIS). THE X-AXIS SHOWS THE TIME FROM ADMINISTRATION IN [HR]. THE SIMULATION WAS MADE USING KA=1 HR-1.
The elimination rate constants were optimized by a curve fit to the male high dose group, and the corresponding data for the low dose grouped served as a validation set, see section 3.3.2.3 for details. The excretion part was also validated on data for rhesus monkeys that had received an iv or a dermal dose of radio labelled tebuconazole (European Commission, 2007b) . The content of the radio labelled dose was measured in urine, faeces and by cage wash, and the data was used as validation sets. For this purpose, a rhesus monkey version of the PBTK was implemented, where the elimination rate constant and the metabolic constants were determined by interspecies interpolation based on the rat parameters. It was indeed seen that the simulated curves match the experimental data, showing that both the elimination rate constants adjusted to rat data, as well as the inter-species extrapolation procedure give accurate results. See Figure 3.9 and detailed description in section 3.3.2.3. The part of the dose not found in the excretion was recovered by washing the skin (100% total recovery in one experiment, and 88% recovery of material in the other experiment). Based on our validation results, we can conclude that the part of the tebuconazole absorbed through the skin eliminates at a corresponding rate to the orally administrated tebuconazole. In addition to the data from dermal exposure experiments on rhesus monkeys, data from rat studies are available in DAR as well (European Commission, 2007b) . The data for rhesus monkeys was only useful for validating the excretion part of the model, as the animals were not sacrificed and blood or tissue samples were not taken. In the rat experiment, concentrations in skin, blood, carcass, urine and faeces was measured at various time points after dermal dosing for four different dose groups. The non-absorbed material was washed of the skin. The overall total recovery in the rat study was almost complete, but the excretion rates were much slower according to these data than the corresponding data for the oral experiment. In the two lowest dose groups around 25% of the absorbed dose was excreted after 24 hr of exposure and in the oral experiments over 60% of the administered dose was excreted 24 hrs post dosing. Almost all

86 Optimization of the cumulative risk assessment of pesticides and biocides using computational techniques: Pilot project
the tebuconazole was absorbed after 30 min of exposure (the first time point), indicating that the dermal absorption of tebuconazole dissolved in ethanol is rapid. This relatively slow elimination rate and high skin content of radio labelled material found in the rat study indicates two possibilities. One is that tebuconazole behaves differently in rat skin than rhesus monkey skin and another is that the washing procedure did not remove all the non-absorbed material, and that some non-absorbed material were measured as part of the skin content. Danish EPA has referred to this study as an erroneous study that overestimated the dermal absorption in rat, and our results support this evaluation. 5.1.3 Validation using rat data for female rats from the PestiMix project In a report be Hass and co-workers (Hass and et al., 2012), blood samples were taken from two-three female rats after treatment with tebuconazole in a mixture with other compounds. This was a repeated dose experiment where the animals were given a daily dose of 12.5 and 25 mg tebuconzole/ kg BW, and sacrificed on day 13 after birth. Blood sample was taken between 1-5 hrs. after the last oral dose was given. The two dams in the lower dose group had blood concentrations between 1.7 and 2.7 µmol/l and the three dams from the higher dose group had blood concentrations in the range 3.7-25 µmol/l, with a median of 6.6 µmol/l. These results illustrate relatively large variation between the three test animals. Our simulation (ka=1 hr-1) at the lower dose gave blood concentration of 1.6-0.25 µmol/l 1-5 hrs. after administration, and at the higher dose values 3.5-0.50 µmol/l in the same time range. (The results using oral absorption rate constants of ka=0.5 and ka=2 hr-1 were similar, illustrating that this result is not significantly influence by uncertainties in the absorption rate.) The simulated and the experimental result can be considered to be of the same order of magnitude, especially for the low dose group. These are obviously not optimal data for validation of a PBTK model, as it is a repeated dose mixture experiment in female rats and the blood concentration is not measured at a well defined time point. As this is a mixture experiment, there might be issues with limited metabolic capacity of the liver enzymes, especially if the compounds in the mixture are using the same cytochrome P450 (CYP) enzymes. To get an idea if the chemical mixture would reach the maximum metabolic capacity of the actual CYPs in the liver, we run a simulation with up to five-fold portion of the administered dose. We thus assume that all the pesticides are competing for the same CYP enzymes and that they have depletion rates corresponding to tebuconazole. This is not correct of course, but it gives us an indication on if the mixture could be affecting the results above. The rate of metabolism was not significantly reduced in the simulations carried out for the lower dose group up to a five-fold dose. For the high dose group the metabolic rate was significantly lower for three-fold portion of tebuconazole, and saturation was clearly reached. Saturation of the metabolic capacity leads to blood concentrations that are relatively higher fraction of the administered dose, compared to situations were the full metabolic capacity is available. As a result the measured blood concentrations would be higher than it would be the case if the compound was given in the dose as a single compound. This is likely to be the case for the higher dose group, but not necessarily problem for the lower dose group. Thus one should use these validation results with caution, as they can of course not give accurate estimates of the model performance. They give us, however, a rough estimate that the blood concentrations simulated with our model, seem to be within appropriate range of the experiment.
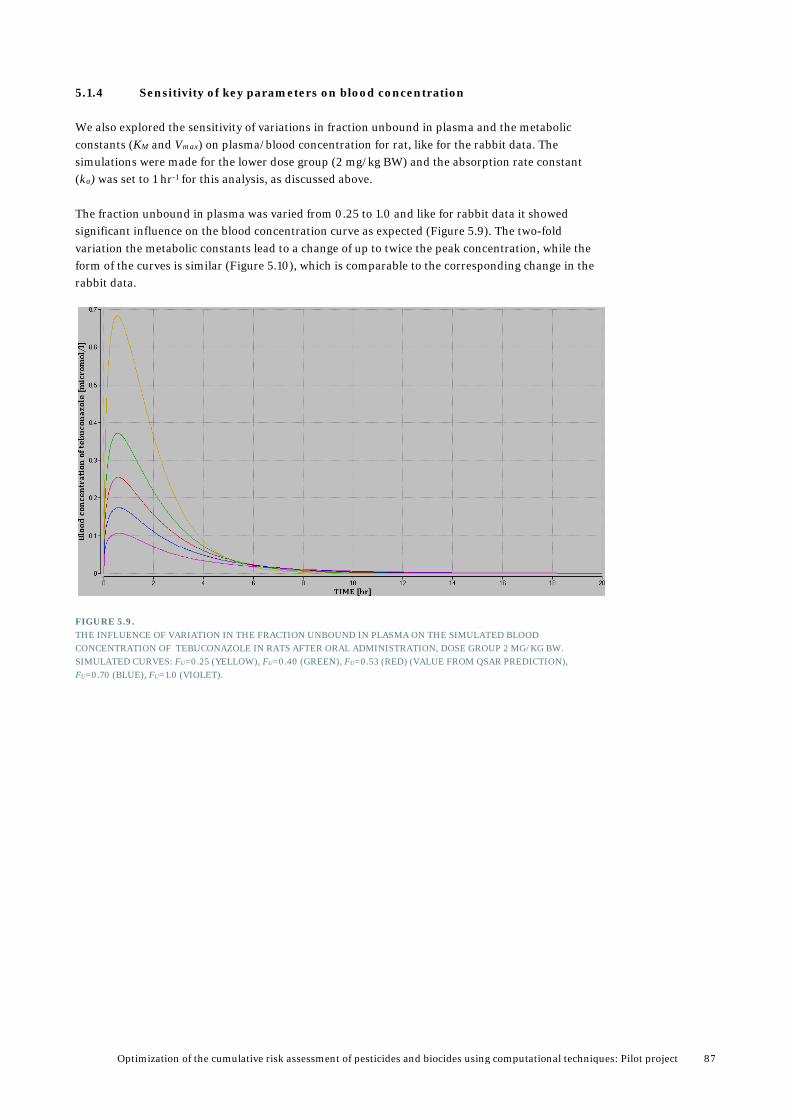
Optimization of the cumulative risk assessment of pesticides and biocides using computational techniques: Pilot project 87
5.1.4 Sensitivity of key parameters on blood concentration We also explored the sensitivity of variations in fraction unbound in plasma and the metabolic constants (KM and Vmax) on plasma/blood concentration for rat, like for the rabbit data. The simulations were made for the lower dose group (2 mg/kg BW) and the absorption rate constant (ka) was set to 1 hr-1 for this analysis, as discussed above. The fraction unbound in plasma was varied from 0.25 to 1.0 and like for rabbit data it showed significant influence on the blood concentration curve as expected (Figure 5.9). The two-fold variation the metabolic constants lead to a change of up to twice the peak concentration, while the form of the curves is similar (Figure 5.10), which is comparable to the corresponding change in the rabbit data.
FIGURE 5.9. THE INFLUENCE OF VARIATION IN THE FRACTION UNBOUND IN PLASMA ON THE SIMULATED BLOOD CONCENTRATION OF TEBUCONAZOLE IN RATS AFTER ORAL ADMINISTRATION, DOSE GROUP 2 MG/KG BW. SIMULATED CURVES: FU=0.25 (YELLOW), FU=0.40 (GREEN), FU=0.53 (RED) (VALUE FROM QSAR PREDICTION), FU=0.70 (BLUE), FU=1.0 (VIOLET).

88 Optimization of the cumulative risk assessment of pesticides and biocides using computational techniques: Pilot project
(a)
(b) FIGURE 5.10. THE INFLUENCE OF VARIATION IN VMAX (A) AND KM (B) ON THE SIMULATED BLOOD CONCENTRATION OF TEBUCONAZOLE IN RATS AFTER ORAL ADMINISTRATION, DOSE GROUP 2 MG/KG BW (RED). SIMULATED CURVES: 2 X SMALLER (GREEN), EXPERIMENTAL VALUE FROM RAT (RED), 2 X LARGER (BLUE).
5.2 Validation and analysis of PBTK model for prochloraz Like for tebuconazole, the data set published in DAR ( European Commission, 2010e), shows the blood concentration of the total radioactivity (prochloraz + metabolites) at different time points after administration by oral bolus dose. Data from two dose groups, 10 and 100 mg/kg BW, each measured in male and female found in DAR. This data set is not particularly useful for use for model validation, as the fraction of prochloraz in the total radioactivity is not specified. We have not been able to find data on the concentration of prochloraz only in blood and tissues. Therefore we have very limited data for model validation. We calculated the amount of prochloraz left in the GIT, the amount metabolized and the total amount of prochloraz and metabolites in the rat body after administration of 20 mg/kg BW prochloraz by an oral bolus dose, Figure 5.11. Simulation was both carried out by calculating the depletion rate of prochloraz with the experimental intrinsic clearance value from Wetmore et al.

Optimization of the cumulative risk assessment of pesticides and biocides using computational techniques: Pilot project 89
(Wetmore et al., 2012), as well as using the metabolic constants from similar reactions. The resulting curves are practically identical, indicating that the last mentioned implementation can be used to estimate the metabolic rate at doses where saturation of the metabolic enzymes has been reached. That the match is so exact is of course a mere coincidence.
(a)
(b) FIGURE 5.11. SIMULATED AMOUNT OF PROCHLORAZ LEFT IN THE GIT (AOL) (BLUE LINE) AND THE CORRESPONDING AMOUNT OF COMPOUND METABOLIZED IN THE LIVER (AML) (GREEN) IN RAT AS A RESULT OF ORALLY ADMINISTERED BOLUS DOSE OF 20 MG/KG BW USING EXPERIMENTAL CLINT FOR PROCHLORAZ (A) OR VMAS OG KM FOR SIMILAR METABOLIC REACTIONS (B) (KA=1 HR-1). THE GRAPH ALSO SHOWS THE RESPECTIVE TOTAL AMOUNTS OF PROCHLORAZ (TOTAL MASS OF C1M0, CYAN) AND METABOLITES (TOTAL MASS OF C1M1, BLACK) IN THE RATS BODY. IT IS SEEN THAT THE DIFFERENT PARAMETERS FOR DESCRIBING THE METABOLISM BASICALLY GIVE IDENTICAL RESULT, AND THAT PROCHLORAZ UNDERGOES FAST METABOLISM IN THE LIVER AFTER ADMINISTRATION (DIFFERENCE BETWEEN THE CYAN AND THE BLUE CURVES) ACCORDING TO THESE RESULTS.

90 Optimization of the cumulative risk assessment of pesticides and biocides using computational techniques: Pilot project
The calculated half-life is around 50 min. in both cases, with the oral absorption rate constant (ka) set to 1 hr-1 (Figure 5.11). In another simulations using ka=0.3 hr-1, rendered half-life of two and a half hours (Figure 5.12). We made simulations of the concentration of prochloraz in blood after 10 and 100 mg/kg BW oral dose and compared with the experimental data for the total radioactivity (prochloraz + metabolites). We did the simulation using two different values for the fraction unbound for rat, obtained by inter-species extrapolation of the experimental human in vitro value and the value predicted by QSAR. The absorption rate constant was set to 0.3 hr-1, such that the prochloraz did not have higher concentration alone than the combined concentration of prochloraz and metabolites. The accuracy of these predictions cannot be validated based on these data, but the curves are presented here for illustration (Figure 5.13).
FIGURE 5.12 SIMULATED AMOUNT OF PROCHLORAZ LEFT IN THE GIT (AOL) (BLUE LINE) AND THE CORRESPONDING AMOUNT OF COMPOUND METABOLIZED IN THE LIVER (AML) (GREEN) IN RAT AS A RESULT OF ORALLY ADMINISTERED BOLUS DOSE OF 20 MG/KG BW USING EXPERIMENTAL CLINT FOR PROCHLORAZ AND KA=0.3 HR-1 THE GRAPH ALSO SHOWS THE RESPECTIVE TOTAL AMOUNTS OF PROCHLORAZ (TOTAL MASS OF C1M0, CYAN) AND METABOLITES (TOTAL MASS OF C1M1, BLACK) IN THE RATS BODY.

Optimization of the cumulative risk assessment of pesticides and biocides using computational techniques: Pilot project 91
(a)
(b) FIGURE 5.13. SIMULATED BLOOD CONCENTRATIONS OF PROCHLORAZ AND THE EXPERIMENTAL DATA (CIRCLES) FOR THE TOTAL RADIOACTIVITY (PROCHLORAZ + METABOLITES) IN RAT AFTER ADMINISTRATION BY ORAL BOLUS DOSE OF 10 MG/KG BW (A) AND 100 MG/KG BW (B). THE BLACK CURVE IS THE SIMULATION RESULT WITH FU=0.13 (EXTRAPOLATED BASED ON THE QSAR PREDICTION FOR HUMAN) AND THE CYAN CURVE IS MADE WITH FU=0.041 (EXTRAPOLATED BASED ON THE EXPERIMENTAL VALUE IN HUMAN. THE YELLOW AND RED CURVE IS THE MEAN BODY CONCENTRATION OF THE METABOLITES.

92 Optimization of the cumulative risk assessment of pesticides and biocides using computational techniques: Pilot project
FIGURE 14. BLOOD CONCENTRATIONS OF PROCHLORAZ AFTER ORAL ADMINISTRATION I RAT, WHERE METABOLISM IS SIMULATED USING INTRINSIC CLEARANCE, THE BLUE CURVE FOR 100 MG/KG BW DOSE AND MAGENTA CURVE FOR 200 MG/KG BW DOSE, OR METABOLIC CONSTANTS FOR SIMILAR REACTIONS, THE GREEN CURVE FOR 100 MG/KG BW DOSE AND RED CURVE FOR 200 MG/KG BW DOSE. SATURATION OF THE METABOLIC PATHWAY IS SIMULATED AT THE HIGHER DOSE. THE SIMULATION WAS MADE WITH KA=0.3 HR-A AND FU=0.041.
Figure 5.14 illustrates that the metabolic enzyme capacity is saturated at higher dose, and thus one cannot accurately simulate the metabolism at higher doses using the first order kinetics and intrinsic clearance. Such high exposures are not relevant considering realistic exposures to prochloraz in daily live, and thus for any practical purpose the first order kinetic implementation should be considered sufficient. The adjustment and validation of the elimination rates is shown in section 3.3.2.3. 5.2.1 Validation using rat data for female rats from the PestiMix project The mixture study by Hass and co-workers (Hass and et al., 2012) also contained prochloraz, the blood samples data taken from two-three female rats after treatment with a mixture were used for validating the prochloraz model as well. This was a repeated dose experiment where the animals were given a daily dose of 8.75 and 17.5 mg prochloraz/ kg BW, and sacrificed on day 13 after birth. Blood sample was taken between 1-5 hrs. after the last oral dose was given. The two dams in the lower dose group had blood concentrations between 0.08 and 0.16 µmol/l and the three dams from the higher dose group had blood concentrations in the range 0.14-0.74 µmol/l, with a median of 0.20 µmol/l. These results illustrate relatively large variation between the three test animals. Our simulation (ka=0.3 hr-1 and fu=0.041) at the lower dose gave blood concentration of 5.9-2.4 µmol/l 1-5 hrs. after administration, and at the higher dose groups values 12-4.8 µmol/l in the same time range. We rerun the simulations using the fraction unbound based on a QSAR prediction (ka=0.3 hr-1 and fu=0.13). At the lower dose the resulting blood concentration was 1.9-0.7 µmol/l 1-5 hrs. after administration, and at the higher dose 3.8-1.5 µmol/l in the same time range. The simulated result was at least 10 times higher than the experimental result. (ka was set to 0.3 hr-1 in these simulation, and this parameters also influence the predicted values.) One should use these validation results with caution, and consider this as a rough estimate that the blood concentrations simulated with our model seem to be somewhat overestimated compared to the experimental data.

Optimization of the cumulative risk assessment of pesticides and biocides using computational techniques: Pilot project 93
5.2.1.1 Sensitivity of key parameters on simulated blood concentration We explored the sensitivity of variations in the absorption rate constant, the fraction unbound in plasma and the intrinsic clearance (CLint) on blood concentration for rat. The simulations were made for the lower dose group (10 mg/kg BW). The absorption rate constant controls the form of the pulse function by which the oral dose is administered to the liver, primarily influences the blood concentration curve in the first hours of the simulation, and has significant impact to the peek concentration (Figure 5.15). The higher the ka value, the faster the oral bolus dose is administered to the liver, the higher peak concentration and the faster the depletion of prochloraz is done. The fraction unbound in plasma was varied from 0.02 to 0.13 showing significant influence on the blood concentration curve as expected (Figure 5.16a). Two-fold decrease in the intrinsic clearance caused the peak blood concentration to become twice as large, and vice versa (Figure 5.16b).
FIGURE 5.15. THE INFLUENCE OF VARIATION IN ABSORPTION RATE CONSTANT ON THE SIMULATED BLOOD CONCENTRATION OF PROCHLORAZ IN RAT, DOSE GROUP 10 MG/KG BW. SIMULATED CURVES: KA=0.30 HR-1 BLACK (VALUE USED IN SIMULATIONS), KA=0.5 HR-1 CYAN, KA=1.0 HR-1 VIOLET.

94 Optimization of the cumulative risk assessment of pesticides and biocides using computational techniques: Pilot project
(a)
(b) FIGURE 5.16. (A) THE INFLUENCE OF VARIATION IN THE FRACTION UNBOUND IN PLASMA ON THE SIMULATED BLOOD CONCENTRATION OF PROCHLORAZ IN RATS, DOSE GROUP 10 MG/KG BW. EXPERIMENTAL DATA AS CIRCLES AND SIMULATED CURVES: FU=0.02 CYAN, FU=0.042 (VALUE EXTRAPOLATED FROM THE HUMAN IN VITRO EXPERIMENT) BLACK AND FU=0.13 CYAN (VALUE BASED ON THE QSAR PREDICTION) VIOLET. (B) THE INFLUENCE OF VARIATION IN CLINT (A) ON THE SIMULATED BLOOD CONCENTRATION OF PROCHLORAZ IN RATS, DOSE GROUP 10 MG/KG BW. SIMULATED CURVES USING 2 X SMALLER THAN THE EXPERIMENTAL VALUE (CYAN), THE EXPERIMENTALLY DERIVED VALUE (BLACK), AND 2 X LARGER VALUE (VIOLET).

Optimization of the cumulative risk assessment of pesticides and biocides using computational techniques: Pilot project 95
5.3 Binary models 5.3.1 Simulations and validation for a binary mixture of R and S tebuconazole in
rat Simulations were carried out with the binary model for the R- and S-tebuconazole treated as two different compounds. The main model for tebuconazole uses the mean metabolic constants measured for the R and the S form and treats tebuconazole as one compound, whereas the binary model uses the measured metabolic constants for each of the two forms (Table 3.6), and takes inhibition of the other enantiomer into account. It is seen in Figure 5.17 that the R form has the fastest metabolism (lowest blood concentration) and the S form the slowest. The intrinsic clearance of the R form was 1.26 times greater than the one of the S form according to the measurements by Shen et al. (Shen et al., 2012). Their interaction study shows that IC50 for R-tebuconazole inhibiting S-tebuconazole is five times larger than the corresponding value for S-tebuconazole inhibiting R-tebuconazole. Yet the inhibition constant (KI value) of the latter reaction is slightly lower than for the first one. The blood concentration of the racemic mixture is in between the curves for R and S in the low dose simulations, but only slightly lower than the S form curve in the higher dose mixture. The effect of the inhibition is significant in the simulation for the 20 mg/kg dose group, and only slight effect is seen in the simulation for the 2 mg/kg BW dose group (the yellow and the cyan curves almost overlap one another). Thus, it is seen that the capacity of the metabolic enzymes is reduced for the higher dose group, and thus competitive inhibition takes place, whereas for the low dose group inhibition has not started to show any effect.

96 Optimization of the cumulative risk assessment of pesticides and biocides using computational techniques: Pilot project
(a)
(b) FIGURE 5.17.
(A) SIMULATIONS OF THE TOTAL BLOOD CONCENTRATION OF TEBUCONAZOLE IN RAT RESULTING FROM AN ORAL
DOSE OF 2 MG/KG BW PURE R- (BLUE CURVE) AND S- (RED CURVE) TEBUCONAZOLE, AND A RACEMIC MIXTURE OF
R AND S, 1 MG/KG BW OF EACH ENANTIOMER (CYAN CURVE). (B) THE CORRESPONDING SIMULATION FOR A TOTAL
DOSE OF 20 MG/KG BW. THE YELLOW CURVES ARE SIMULATIONS FOR THE RACEMIC MIXTURES IN EACH DOSE
GROUP, WITH NO INHIBITION CONSIDERED, ILLUSTRATING THE IMPACT INHIBITION HAS ON THE BLOOD
CONCENTRATION.
Figure 5.18 illustrates the increased effect of the competitive inhibition at a dose of 100 mg/kg BW. The effect of the inhibition is very significant at this dose, and the peak blood concentration of the racemic mixture is now significantly larger than the level for the respective enantiomers, indicating that the racemic mixture metabolises slower than the pure enantiomers.

Optimization of the cumulative risk assessment of pesticides and biocides using computational techniques: Pilot project 97
FIGURE 5.18. SIMULATIONS OF THE TOTAL BLOOD CONCENTRATION OF TEBUCONAZOLE IN RAT RESULTING FROM AN ORAL DOSE OF 100 MG/KG BW PURE R (BLUE CURVE) AND S (RED CURVE) TEBUCONAZOLE, AND A RACEMIC MIXTURE OF R AND S, 50 MG/KG BW OF EACH ENANTIOMER (CYAN CURVE). IT IS SEEN THAT EFFECT OF INHIBITION HAS BECOME SO LARGE THAT THE RACEMIC MIXTURE METABOLISES SLOWER THAN THE PURE ENANTIOMERS. THE YELLOW CURVE SHOWS SIMULATION FOR THE RACEMIC MIXTURE WITH NO INHIBITION CONSIDERED.
5.3.2 Simulations for a binary mixture prochloraz and tebuconazole in rat As we do not have experimental data for the inhibition constants between prochloraz and tebuconazole, we have used values for the R- and S- tebuconazole a worst case possibility, and then used inhibition constants found in the literature for a range of compounds as an inspiration too. The two tebuconazole enantiomers are metabolised by the same CYPs and thus one can expect those to inhibit one another rather strongly, which is also seen in the high dose simulations above. Prochoraz and tebuconazole only partly use the same CYPs according to available information from our QSAR predictions (section 4.1.1). Thus according to the QSAR models prochloraz was predicted to be a CYP2C9 substrate, and the prediction on whether it is also an inhibitor was inconclusive. Tebuconazole was predicted to be a CYP2C9 inhibitor, and not a CYP2C9 substrate. Tebuconazole is predicted to be both a substrate and an inhibitor to CYP3A4, whereas for prochloraz the corresponding predictions were inconclusive. In order to explore the potential effect of inhibition, we made a series of simulation where we set up theoretical criteria, and used the results to draw conclusion on effects that could be caused by inhibition. Simulations were made at relatively low doses, up to extremely high doses, in order to explore the effect of inhibition for broad range of exposures. We made a series of simulation were the inhibition constant (KI) was set to 1, 5, 50 and 500 µmol/l (µM) for both compounds, respectively. KI =5 µM is the mean of the values determined for R- and S-tebuconazole, KI =50 µM is in the range of values seen for many compounds in the literature (Timchalk and Poet, 2008; El-Masri et al., 2004), 1 µM to visualize the effect of very strong inhibition and 500 µM for low or no inhibition at the dose levels considered (Figure 5.19). It is seen that the blood levels are fairly different for pure prochloraz and tebuconazole, respectively, mostly because significantly larger portion of the prochloraz is bound the plasma proteins. The depletion rates for these compounds were seen to be rather similar, only giving a minor contribution to the different blood levels of these two compounds. For the 10 mg/kg BW dose group

98 Optimization of the cumulative risk assessment of pesticides and biocides using computational techniques: Pilot project
(for the mixture 5 mg/kg BW were administered for each of the two compounds in the simulation), only significant inhibition was seen for KI =1 µM. This is not a likely scenario, as this would require stronger inhibition between the two compounds, than between R- and S-tebuconazole. For the 100 mg/kg BW dose group inhibition is seen for KI =5 µM as well, and at KI =1 µM an overload of the metabolic pathways seems to occur, causing a different form of the curve.
(a)
(b) FIGURE 5.19. SIMULATIONS OF THE COMBINED BLOOD LEVELS (C1M0+C2M1) MADE FOR A BINARY MIXTURE OF PROCHLORAZ AND TEBUCONAZOLE IN RAT AT (A) 10 MG/KG BW OF PURE COMPOUNDS AND 5 MG/KG BW FOR EACH COMPOUND IN A MIXTURE AND (B) 100 MG/KG BW OF PURE COMPOUNDS AND 50 MG/KG BW FOR THE COMPOUNDS IN A MIXTURE. PURE TEBUCONAZOLE (VIOLET), PURE PROCHLORAZ (GREEN), MIXTURE OF PROCHLORAZ AND TEBUCONAZOLE KI = 1 µM (BLACK), KI = 5 µM (RED), KI = 50 µM (YELLOW), KI = 500 µM (BLUE). THE SAME KI VALUE WAS USED FOR BOTH COMPOUNDS IN THIS SIMULATION.

Optimization of the cumulative risk assessment of pesticides and biocides using computational techniques: Pilot project 99
(a)
(b)
(c) FIGURE 5.20. THE BLOOD CONCENTRATIONS OF PROCHLORAZ (C1M0) AND TEBUCONAZOLE (C2M0) IN RAT, WITH EACH COMPOUND ADMINISTERED BYAN ORAL BOLUS DOSE OF (A) 1, (B) 10 AND (C) 50 MG/KG BW. SIMULATION WITHOUT INHIBITION (C1M0 CYAN CURVE, C2M0 RED CURVE), WITH TEBUCONAZOLE INHIBITING PROCHLORAZ KI(C2M0,C1M0) = 5 µM (C1MO BLUE, C2MO VIOLET), AND WITH BOTH COMPOUNDS INHIBITING ONE ANOTHER KI(C2M0,C1M0) = KI(C1M0,C2M0) = 5 µM (C1M0 BLACK, C2M0 GREEN).

100 Optimization of the cumulative risk assessment of pesticides and biocides using computational techniques: Pilot project
In another series of simulation we calculated the blood concentration levels of prochloraz and tebuconazole, respectively, where no inhibition took place, where tebuconazole inhibited prochloraz with KI =5 µM, and where both compounds inhibited one another with KI =5 µM (Figure 5.20). At the lowest dose where the compounds were administered by 1 mg/kg BW each, no inhibition effect was seen. At the higher doses increased effects on the inhibition are seen as increased blood levels. At dose level of 50 mg/kg BW of each compound and higher, significant influence of inhibition is seen. We also explored the liver concentrations for the same series of simulations (Figure 5.21). Like for the blood concentration no inhibition effects were seen at the lowest dose, 1 mg/kg BW of each compound. At the higher doses increased effects on the inhibition are seen as increased blood levels. At dose level of 50 mg/kg BW of each compound and higher significant influence of inhibition is seen for both compounds. Due to the different concentration levels, the inhibition of prochloraz is not very clear on the figure, but it does happen. Prochloraz is only distributed to the liver in low concentrations, caused by the low fraction unbound. This is strange, as there are documented liver toxic effects associated with prochloraz. For one of these dose groups, namely 10 mg/kg BW of each compound, an additional simulation was made where the predicted Pliver:b (the liver:blood partition coefficient) was multiplied by two for each compound (Figure 5.22). This was done to illustrate the influence uncertainty in this parameter has on the resulting liver concentrations. It is seen that the liver levels are around twice as high as the liver levels simulated with the original prediction Pliver:b. The peak concentration in the liver is thus doubled when the liver: blood partition coefficient is multiplied by a factor of two. If this parameter is multiplied by four the peak concentration become four time as high. We do not have sufficient data at present to adequately evaluate the uncertainty of this parameter.

Optimization of the cumulative risk assessment of pesticides and biocides using computational techniques: Pilot project 101
(a)
(b)
(c) FIGURE 5.21. THE SIMULATED LIVER CONCENTRATIONS OF PROCHLORAZ (C1M0) AND TEBUCONAZOLE (C2M0) IN RAT, WHERE EACH COMPOUND WAS ADMINISTERED BY ORAL BOLUS DOSE OF (A) 1, (B) 10 AND (C) 50 MG/KG BW. SIMULATION WITHOUT INHIBITION (C1M0 YELLOW CURVE, C2M0 GREEN CURVE), WITH TEBUCONAZOLE INHIBITING PROCHLORAZ KI(C2M0,C1M0) = 5 µM (C1MO RED, C2MO CYAN), AND WITH BOTH COMPOUNDS INHIBITING ONE ANOTHER KI(C2M0,C1M0) = KI(C1M0,C2M0) = 5 µM (C1M0 VIOLET, C1M0 BLUE). THE LIVER:BLOOD PARTITION COEFFICIENTS WERE USED.

102 Optimization of the cumulative risk assessment of pesticides and biocides using computational techniques: Pilot project
(a)
(b) FIGURE 5.22. (A) THE SIMULATED LIVER CONCENTRATIONS OF PROCHLORAZ (C1M0) AND TEBUCONAZOLE (C2M0) IN RAT, WHERE EACH COMPOUND WAS ADMINISTERED BY ORAL BOLUS DOSE OF 10 MG/KG BW. IN THIS SIMULATION, BOTH COMPOUNDS INHIBITED ONE ANOTHER KI(C2M0,C1M0) = KI(C1M0,C2M0) = 5 µM AND THE SIMULATION WAS CARRIED WITH THE PLIVER:B AS PREDICTED (TABLE 3.5) (C1M0 YELLOW, C2M0 GREEN), AND THE PREDICTED VALUE MULTIPLIED BY TWO (C1M0 RED, C2M0 CYAN). THIS WAS DONE TO ILLUSTRATE THE INFLUENCE OF EVENTUAL UNCERTAINTIES IT THIS PARAMETER ON THE SIMULATED LIVER LEVELS. (B) THE CURVES FOR PROCHLORAZ SHOWED ON A SMALLER SCALE.

Optimization of the cumulative risk assessment of pesticides and biocides using computational techniques: Pilot project 103
5.4 Predictions for specific exposure criteria in humans 5.4.1 Exposure scenarios 5.4.1.1 Dietary exposure The oral exposure criteria are based on detected pesticide residues in food for human nutrition, sold on the Danish market. It was decided in collaboration with the Danish EPA to use evaluations on oral consumption of tebuconazole and prochloraz from a recent report over pesticide residues found in samples from commodities of food (fruit, vegetables, cereals, etc.) on the Danish market from 2004 and 2011 (Petersen et al., 2013). The samples were collected by the pesticide monitoring program under The Danish Veterinary and Food Administration, and the report was prepared by the National Food Institute at DTU. The mean daily consumption of a group a pesticides has been evaluated based on pesticide residues found in food in 2004-2011. According to the report, the mean consumption is 0.0064 µg/ kg BW/day for prochloraz and 0.013 µg/ kg BW/day for tebuconazole (Table 5.1) (Petersen et al., 2013). These values are used as the daily exposure of an average consumer, and are thereby the primary oral exposure criteria used in this work. A consumer that eats more than 550 g/day of fruit and vegetable is assumed to be exposed to twice the amount of an average consumer is exposed to, according to the report. This constitutes a second exposure criteria used in the report, were the mean exposures are multiplied by two. For making an estimate of the combined effect of the 13 different triazoles and two imidazoles, one pyrazole and two benzimidazoles detected in samples from fruit and vegetables sold in Denmark, the daily exposure to all the pesticides were added together. Following, simulations were made where the combined exposure to these 18 compounds was treated as it all came from either tebuconazole or prochloraz. In such a way we made an estimate of a combined exposure by providing a third exposure criteria to illustrate an example with large exposure. When implemented in the model, the daily dose is divided equally over 12 hours (7-19 hrs), with the remaining 12 hrs as resting time with no exposure. It should be mentioned that according to the yearly reports on pesticides residues found in the monitoring program, residues of tebuconazole and prochloraz were only found in fruit and vegetables, and not in other products like cereals (Jensen et al., 2010; Jensen et al., 2011; Jensen et al., 2012).

104 Optimization of the cumulative risk assessment of pesticides and biocides using computational techniques: Pilot project
TABLE 5.1. THE ESTIMATED MEAN DAILY CONSUMPTION AND CALCULATED HAZARD QUOTIENTS (EXPOSURE/ADI) OF TRIAZOLE, IMIDAZOLE, PYRAZOLE AND BENZIMIDAZOL PESTICIDES FROM RESIDUES IN FRUIT AND VEGETABLES ON THE DANISH MARKED BETWEEN 2004 AND 2011 (PETERSEN ET AL., 2013). THESE ESTIMATES ARE BASED PESTICIDE RESIDUES FOUND IN FOOD SAMPLES, AND AN ESTIMATE OF THE VOLUME OF FRUIT AND VEGETABLES EATEN BY AN AVERAGE CONSUMER ACCORDING DIETARY SURVEYS. CORRECTIONS HAVE BEEN MADE FOR PEELING, AND TO ACCOUNT FOR SAMPLES WITH NON-DETECTED RESIDUES.
Active compound Class Exposure Hazard
Quotient
[µg/kg BW/day] [%]
Bitertanol Triazole 0.009 0.3
Difenoconazole Triazole 0.0066 0.066
Diniconazole Triazole 0.0009 0.0045
Epoxiconazole Triazole 0.000077 0.00097
Fenbuconazole Triazole 0.00036 0.0059
Flusilazole Triazole 0.00039 0.02
Hexaconazole Triazole 0.00037 0.0075
Imazalil
(eniconazole)
Imidazole 0.072 0.29
Myclobutanil Triazole 0.006 0.024
Penconazole Triazole 0.0019 0.0064
Prochloraz Imidazole 0.0064 0.064
Propiconazole Triazole 0.00035 0.00087
Tebuconazole Triazole 0.013 0.042
Tetraconazole Triazole 0.00037 0.0092
Triadimefon (sum) Triazole 0.028 0.055
Tebufenpyrad Pyrazole 0.0064 0.064
Thiabendazole Benzimidazole 0.11 0.11
Thiophanate-methyl Benzimidazole 0.031 0.039
Sum / Hazard Index All compounds 0.293 1.11
Sum / Hazard Index Triazoles/imidazoles 0.146 0.896
5.4.1.2 Dermal exposure The Danish EPA has chosen that we primarily focus on dermal exposure criteria for tebuconazole used as pesticide and biocide for professional use. This is partly due to that the professional exposure is the most relevant and partly because the results are needed providing additional information and insight for use in their risk assessment of products used on the Danish marked.

Optimization of the cumulative risk assessment of pesticides and biocides using computational techniques: Pilot project 105
With regard to dermal exposures to pesticides, is it considered most relevant to consider downwards spraying of liquid mixtures on fields by a professional employee from a machine station (downwards spraying by a spraying device attached to a tractor). The exposure occurs partly while filling a concentrated solution on the spraying equipment and mixing with water, and partly while spraying the diluted solution on the field. Dermal absorption of the concentrated solution is lower than for the diluted solution, but on the other hand there is substantially larger exposure to the concentrated solution (see section 3.3.3.2 for details). The Danish EPA has provided information on the dermal absorption of two common products and the evaluated exposure to those products. See detailed description on exposure to and health evaluations of these products in Appendix 9. The exposure is evaluated on the basis of a model for a professional spraying 20 ha field per day. Protection due to clothing and gloves is included in the exposure model, but data without use of gloves are provided as well (see section 3.3.3.1). Exposure of a profession spraying pesticide mixtures downwards by a tractor, is estimated to take 8 hrs. a day (8-16 hrs), 5-7 days a week. The Danish EPA has provided data on dermal absorption of water and solvent based formulations of tebuconazole used as a biocide, and well as exposure models for these formulations used for brushing and for industrial treatment of wood. These data and the provided exposure models are presented in Appendix 9. In this report we have primarily focused on solvent based formulations, as those are absorbed in larger quantities and the PBTK model is better optimized for simulating exposure from solvent based formulations. A concentration of 0.5% w/w is assumed for these products, and protection due to clothing and gloves is incorporated in the exposure model. Biocide exposure due to brushing is estimated to take 3 hrs/day (13-16 hrs), as the rest of the working day would be used for preparing the wood surface for brushing. Industrial wood treatment is evaluated to take 4 hrs/day (12-16 hrs) for each employee. Both brushing of wood surfaces and industrial wood treatment are considered to be 5 days a week, with a two day break in between. For all three applications, spraying, brushing and industrial wood treatment, the primary oral exposure criteria is assumed as well. Thereby the combined oral and dermal exposure is simulated. Finally a combined “worst case” scenario with 8 hour spraying, followed by two hour brushing, and consumption of >55o g fruit and vegetables per day (the second oral criteria) was constructed. This criteria thus combines professional and private usage, professional spraying combined with private brushing. 5.4.2 Results 5.4.2.1 Simulations for the proposed dietary exposure scenarios for tebuconazole We carried out simulations for the three dietary exposure criteria for tebuconazole proposed above. There are, exposure of an average consumer of fruit and vegetable in the Danish population (scenario 1), exposures of consumers that eat more than 55o g/day which is set to twice the mean exposure (scenario 2), and the combined exposure to triazoles and related compounds found in food samples on the Danish market (scenario 3), see Table 5.2. These estimates are for consumers eating only fruits and vegetables from conventional production. Figure 5.23 shows the simulated curves for amount of tebuconazole (labelled C1Mo) and metabolites (labelled C1M1) in the human body at each time point. The three curves are identical,

106 Optimization of the cumulative risk assessment of pesticides and biocides using computational techniques: Pilot project
with except for the numerical values of the amounts present, which scale with increased sizes of the dietary dose. TABLE 5.2. THE PROPOSED EXPOSURE SCENARIOS
Scenario 1 Scenario 2 Scenario 3
(µg/kg BW/day) (µg/kg BW/day)
(µg/kg BW/day)
Tebuconazole 0.13 0.026 0.29
Prochloraz 0.0064 0.0128 0.29
(a)
(b)

Optimization of the cumulative risk assessment of pesticides and biocides using computational techniques: Pilot project 107
(c) FIGURE 5.23. PREDICTED CURVES FOR THE TOTAL AMOUNT OF TEBUCONAZOLE (C1M0, GREEN CURVE) AND METABOLITES (C1M1, BLUE CURVE) IN THE HUMAN BODY AFTER ORAL DIETARY ADMINISTRATION OF 0.013 µG/KG BW/DAY (SCENARIO 1) (A), 0.026 µG/KG BW/DAY (SCENARIO 2)(B) AND 0.29 µG/KG BW/DAY (SCENARIO 3) (C). THE GRAPHS FOR THE THREE DIFFERENT EXPOSURE CRITERIA FOR DIETARY EXPOSURE ARE VERY SIMILAR, WERE THE AMOUNT OF TEBUCONAZOLE AND METABOLITES IS INCREASED PROPORTIONAL TO THE INCREASED EXPOSURE.
The exposure criteria with normal exposure (scenario 1) was analysed in greater detail. Figure 5.24 shows the amount of tebuconazole and metabolites together with the total amount excreted and the total amount of metabolites formed for the first three days of exposure. The simulated concentration of tebuconazole in blood, liver and skin, as well as the mean concentration of metabolites in the body for the first three days of the simulation is shown in Figure 5.25(a) and the concentration of tebuconazole in all the compartments in the model in Figure 5.25(b). All the simulated concentrations are in the range of nmol/l and lower, with total amount of tebuconazole and metabolites in the body up to 0.15 nmol and 1 nmol, respectively.
FIGURE 5.24. PREDICTED CURVES FOR THE TOTAL AMOUNT OF TEBUCONAZOLE (C1M0, GREEN CURVE), METABOLITES (C1M1, BLUE CURVE) IN THE HUMAN BODY AT EACH TIME AFTER ORAL DIETARY ADMINISTRATION OF 0.013 µG/KG BW/DAY (CRITERIA 3). THE TOTAL AMOUNT OF METABOLITES FORMED IN (BLACK CURVE) AND EXCRETED FROM (READ CURVE) THE BODY DURING THE SIMULATION, IS SHOWN AS WELL.

108 Optimization of the cumulative risk assessment of pesticides and biocides using computational techniques: Pilot project
(a)
(b) FIGURE 5.25. (A) PREDICTED CONCENTRATION OF TEBUCONAZOLE IN HUMAN BLOOD (BLACK), LIVER (RED) AND SKIN (GREEN), AND THE MEAN CONCENTRATION OF METABOLITES IN THE BODY (BLUE) AT EACH TIME AFTER ORAL DIETARY ADMINISTRATION OF 0.013 µG/KG BW/DAY. (B) THE CONCENTRATIONS OF TEBUCONAZOLE IN ALL THE COMPARTMENTS IS SHOWN AS WELL, WITH CURVES FOR FAT (CYAN), RAPIDLY (YELLOW) AND SLOWLY (VIOLET) PERFUSED TISSUE INCLUDED AS WELL.
5.4.2.2 Simulations for the proposed dietary exposure scenarios for prochloraz Similarly, simulations were carried out for the three oral exposure scenarios for prochloraz. Figure 5.26 shows the simulated curves for amount of prochloraz (labeled C1Mo) metabolites (labelled C1M1) in the human body at each time point. The three curves are identical, except for the numerical values of the amounts present, which scale with increased sizes of the dietary dose. The curves for prochloraz are similar to those for tebuconazole, as these compounds are metabolized at similar rate.

Optimization of the cumulative risk assessment of pesticides and biocides using computational techniques: Pilot project 109
(a)
(b)
(c) FIGURE 5.26. PREDICTED CURVES FOR THE TOTAL AMOUNT OF PROCHLORAZ (C1M0, GREEN CURVE) AND METABOLITES (C1M1, BLUE CURVE) IN THE HUMAN BODY AFTER ORAL DIETARY ADMINISTRATION OF 0.0064 µG/KG BW/DAY (SCENARIO 1) (A), 0.0128 µG/KG BW/DAY (SCENARIO 2) (B) AND 0.29 µG/KG BW/DAY (SCENARIO 3) (C). THE GRAPHS FOR THE THREE DIFFERENT EXPOSURE SCENARIOS FOR DIETARY EXPOSURE ARE VERY SIMILAR, THE AMOUNT OF PROCHLORAZ AND METABOLITES IS INCREASED PROPORTIONAL TO THE INCREASED EXPOSURE.

110 Optimization of the cumulative risk assessment of pesticides and biocides using computational techniques: Pilot project
The exposure scenarios with normal exposure (scenario 1) was analysed in greater detail. Figure 5.27 shows the amount of prochloraz and metabolites together with the total amount excreted and the total amount of metabolites formed for the first three days of the exposure. The simulated concentration of prochloraz in blood, liver, as well as the mean concentration of metabolites in the body for the first three days of the simulation is shown in Figure 5.28(a) and the concentration of tebuconazole in all the compartments in the model in Figure 5.28(b). All the simulated concentrations are in the range of nmol/l and lower, with total amount of prochloraz and metabolites in the body up to 0.072 nmol and 0.24 nmol, respectively. It is seen that the simulated blood concentration of prochloraz is relatively larger in blood compared to tebuconazole, due to the larger fraction bound to plasma proteins. It should be mentioned that the prochloraz model could not be validated properly. Thus these results are the prediction we could make based on the data we had, and or not necessary accurate.
FIGURE 5.27. PREDICTED CURVES FOR THE TOTAL AMOUNT OF PROCHLORAZ (C1M0, GREEN CURVE), METABOLITES (C1M1, BLUE CURVE) IN THE HUMAN BODY AT EACH TIME AFTER ORAL DIETARY ADMINISTRATION OF 0.0064 µG/KG BW/DAY (SCENARIO 1) FOR 3 DAYS. THE TOTAL AMOUNT OF METABOLITES FORMED IN (BLACK CURVE) AND EXCRETED FROM (RED CURVE) THE BODY DURING THE SIMULATION, IS SHOWN AS WELL.

Optimization of the cumulative risk assessment of pesticides and biocides using computational techniques: Pilot project 111
(a)
(b) FIGURE 5.28. (A) PREDICTED CONCENTRATION OF PROCHLORAZ IN BLOOD (BLACK), AND LIVER (RED), AND THE MEAN CONCENTRATION OF METABOLITES IN THE BODY (BLUE) AT EACH TIME AFTER ORAL DIETARY ADMINISTRATION OF 0.0063 µG/KG BW/DAY ) FOR 3 DAYS. (B) THE CONCENTRATION OF PROCHLORAZ IN ALL THE COMPARTMENTS BUT BLOOD IS SHOWN AS WELL, WHERE THE CURVES FOR FAT (CYAN), RAPIDLY (YELLOW) AND SLOWLY (VIOLET) PERFUSED TISSUE ARE INCLUDED.
5.4.2.3 Simulations for the proposed dermal exposure scenarios for tebuconazole Likewise, the four specific dermal exposure criteria specified in section 5.3.1.2 were simulated. The dermal absorption has been evaluated for each product, as the extent of absorption can vary depending concentration and formulation of the product. The simulations have thus been carried out for examples of products that can be considered as typical representatives for each product category, and selected by the help of collaborators at the Danish EPA, see section 5.3.1.2 for details. The simulated amounts of tebuconazole and metabolites according to the two dermal exposure scenario for tebuconazole used as biocide for industrial wood treatment and for brushing are shown in Figure 5.29. Dermal absorption of 15.7% was assumed for the biocide products. All the PBTK simulations are made for an average human of 70 kg, risk assessment of biocides normally done for a small human, 60%.
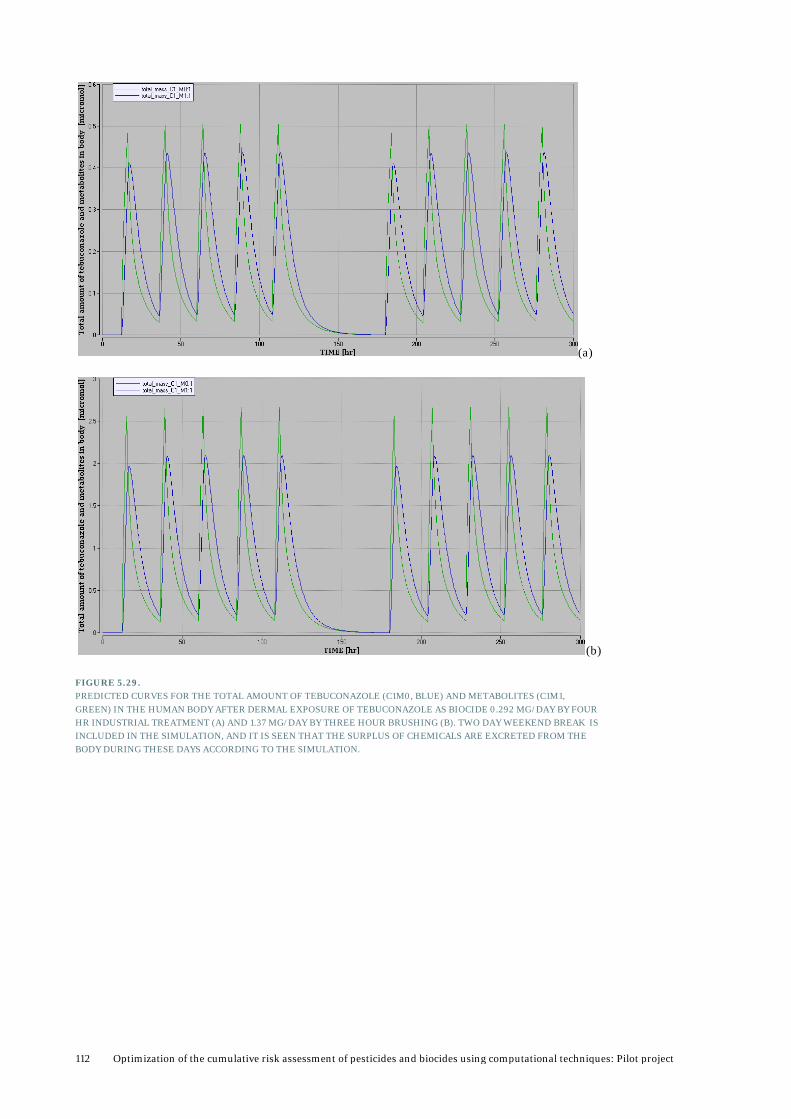
112 Optimization of the cumulative risk assessment of pesticides and biocides using computational techniques: Pilot project
(a)
(b) FIGURE 5.29. PREDICTED CURVES FOR THE TOTAL AMOUNT OF TEBUCONAZOLE (C1M0, BLUE) AND METABOLITES (C1M1, GREEN) IN THE HUMAN BODY AFTER DERMAL EXPOSURE OF TEBUCONAZOLE AS BIOCIDE 0.292 MG/DAY BY FOUR HR INDUSTRIAL TREATMENT (A) AND 1.37 MG/DAY BY THREE HOUR BRUSHING (B). TWO DAY WEEKEND BREAK IS INCLUDED IN THE SIMULATION, AND IT IS SEEN THAT THE SURPLUS OF CHEMICALS ARE EXCRETED FROM THE BODY DURING THESE DAYS ACCORDING TO THE SIMULATION.

Optimization of the cumulative risk assessment of pesticides and biocides using computational techniques: Pilot project 113
FIGURE 5.30. PREDICTED CURVES FOR THE TOTAL AMOUNT OF TEBUCONAZOLE (C1M0, GREEN CURVE), METABOLITES (C1M1, BLUE CURVE) IN THE HUMAN BODY AT EACH TIME AFTER DERMAL EXPOSURE AFTER SPILLING 1.75 ML OF SOLUTION USED FOR BRUSHING ON HANDS IN GO. THE TOTAL AMOUNT OF METABOLITES FORMED IN (BLACK CURVE) AND EXCRETED FROM (RED CURVE) THE BODY DURING THE SIMULATION, IS SHOWN AS WELL.
The daily systemic exposure as a result of three hour brushing was estimated to 1.37 mg active compound mg/day). According the estimates made by the Danish EPA (Appendix 9), this corresponds to that 1.75 g (or 1.75 ml assuming density of 1 g/ml) of the biocide product is spilled on unprotected human skin during this time period. If we assume that a professional spills 1.75 ml on his/her hands in one go, we can explore how the corresponding curves looks by using the Fick’s law implementation of the dermal absorption model. The surface area of the hands was assumed to be 2.6% of the total body surface area. The simulation results show that the whole dose of tebuconazole is absorbed within a short time period, and that the peak concentration of the metabolites corresponds to the one obtained in the previous simulation (Figure 5.30). It is absolutely a possible scenario that a person spills this amount of material on his/her hands, either in smaller portions over three hour period, or even in one go. The mitigation by gloves is set to 100% in the estimate by the Danish EPA, and there should be some protections due to gloves (if used). The corresponding results for tebuconazole product used as pesticide for spraying fields, with and without protection, are shown in Figure 5.31. Dermal absorption of 12% was assumed for the concentrated pesticide formulation and 20% for the diluted solution. It is seen that the tebuconazole and the sum of metabolites are present in similar quantity in these for simulation, and that a trace of the chemical is continuously present in the workers body while subject to repeated dermal dosing. During a two day break all this trace of chemical is excreted. The exposure using protection, results in similar levels as those resulting from the brushing scenario. When spraying fields without taking weekend break, this trace would remain in the body according to our simulation (Figure 5.32).

114 Optimization of the cumulative risk assessment of pesticides and biocides using computational techniques: Pilot project
(a)
(b) FIGURE 5.31. PREDICTED CURVES FOR THE TOTAL AMOUNT OF TEBUCONAZOLE (C1M0, BLUE) AND METABOLITES (C1M1, GREEN) IN THE HUMAN BODY AFTER DERMAL EXPOSURE OF TEBUCONAZOLE WHILE SPRAYING FIELDS WITH PRODUCT MYSTIC 250 EC FOR EIGHT HOURS A DAY: 1.96 MG/DAY EXPOSURE WITH PROTECTION (A) AND 3.48 MG/DAY EXPOSURE WITHOUT (B).

Optimization of the cumulative risk assessment of pesticides and biocides using computational techniques: Pilot project 115
FIGURE 5.32. PREDICTED CURVES FOR THE TOTAL AMOUNT OF TEBUCONAZOLE (C1M0, BLUE) AND METABOLITES (C1M1, GREEN) IN THE HUMAN BODY AFTER DERMAL EXPOSURE OF TEBUCONAZOLE WHILE SPRAYING FIELDS WITH PRODUCT MYSTIC 250 EC FOR EIGHT HOURS A DAY: 1.96 MG/DAY EXPOSURE WITH PROTECTION FOR 12 DAYS IN A ROW WITHOUT BREAK. ACCORDING TO THE SIMULATION TWO DAYS WITHOUT EXPOSURE ARE NEEDED TO EXCRETE THE TRACE OF THE MATERIAL (FIGURE 5.31).
One exposure scenario was analysed in greater detail for the dermal route as well, and for that purpose we chose the scenario for spraying pesticide on field and using protection. Figure 5.33 shows the amount of tebuconazole and metabolites together with the total amount excreted and the total amount of metabolites formed for the first three days of exposure. The simulated concentration of tebuconazole in blood, liver and skin, as well as the mean concentration of metabolites in the body for the first three days of the simulation is shown in Figure 5.34(a) and the concentration of tebuconazole in all the compartments in the model in Figure 5.34(b). All the simulated concentrations are in the range from o.o1-0.14 µmol/l (Fig 5.34), with total amount of both tebuconazole and metabolites in the body up to a level of 2.5 µmol (Fig 5.32).
FIGURE 5.33. PREDICTED CURVES FOR THE TOTAL AMOUNT OF TEBUCONAZOLE (C1M0, GREEN CURVE), METABOLITES (C1M1, BLUE CURVE) IN THE HUMAN BODY AT EACH TIME AFTER DERMAL EXPOSURE OF 1.96 MG/DAY. THE TOTAL AMOUNT OF METABOLITES FORMED IN (BLACK CURVE) AND EXCRETED FROM (RED CURVE) THE BODY DURING THE SIMULATION, IS SHOWN AS WELL.

116 Optimization of the cumulative risk assessment of pesticides and biocides using computational techniques: Pilot project
FIGURE 5.34. (A) PREDICTED CONCENTRATION OF TEBUCONAZOLE IN BLOOD (BLACK), LIVER (RED) AND SKIN (GREEN) AND THE MEAN CONCENTRATION OF METABOLITES IN THE BODY AT EACH TIME AFTER DERMAL EXPOSURE OF 1.96 MG/DAY. (B) THE CONCENTRATION OF TEBUCONAZOLE IN ALL THE COMPARTMENTS IS SHOWN AS WELL, WHERE THE CURVES FOR FAT (CYAN), RAPIDLY (YELLOW) AND SLOWLY (VIOLET) PERFUSED TISSUE ARE INCLUDED AS WELL.
Finally, Figure 5.35 illustrates which effect a relatively small variation in the elimination rate constants has on the simulated amount of metabolites. In addition to the elimination constants adjusted to the rat excretion data and extrapolated to the other species, we did adjust an elimination constant excretion data for a dermal experiment in a rhesus monkey. The excretion data for a rhesus monkey receiving an iv dose, were simulated better with the scaled rat values, than the value adjusted to the dermal data. However, this experiment provided an alternative elimination constant to explore the influence of this parameter on the simulation, which increases the amount of metabolites present in the workers body slightly, but has no influence on the overall conclusion from these simulations.

Optimization of the cumulative risk assessment of pesticides and biocides using computational techniques: Pilot project 117
FIGURE 5.35. PREDICTED CURVES FOR THE TOTAL AMOUNT OF TEBUCONAZOLE (C1M0, BLACK) AND METABOLITES (C1M1) IN THE HUMAN BODY AFTER DERMAL EXPOSURE OF TEBUCONAZOLE WHILE SPRAYING FIELDS WITH MYSTIC 250 EC FOR EIGHT HOURS A DAY: 1.96 MG/DAY EXPOSURE WITH PROTECTION. THE SIMULATION WAS CARRIED OUT WITH THE NORMAL ELIMINATION RATE CONSTANT EXTRAPOLATED FROM RAT, KE(HUMAN) =0.19 HR-1 (C1M1, GREEN) AND THE ELIMINATION RATE CONSTANT EXTRAPOLATED FROM RHESUS MONKEY, KE(HUANA),XMONKEY =0.10 HR-1
(C1M1, RED), ILLUSTRATING THE INFLUENCE OF UNCERTAINTIES IN THIS PARAMETER ON THE SIMULATION RESULT.
5.4.2.4 Simulations for the combined dietary and dermal exposure scenarios Simulations were then carried out assuming aggregate exposure (dietary and dermal), as the professionals working with applying biocides and pesticides, are also exposed to pesticides through their diet. We used the biocide industrial treatment cased to illustrate this aggregate exposure. This application results in the lowest dermal dose, and relatively smaller contribution from the dietary exposure have impact the simulation, than in the case for the other dermal scenarios. For dietary exposure scenario 1 and 2, no contribution from the dietary exposure, but for scenario 3 where contribution from 18 related active compounds were combined, some contribution was seen in the simulation (Figure 5.36). We thus tried two different constructed cases, with the dietary exposure in criteria 3 was multiplied by a factor of 10 (Figure 5.39). The contribution due to dietary exposure is increased with respect to the contribution from the dermal exposure, and is finally dominant exposure in the simulation. A small trace especially of the metabolites is not excreted from the body according to these simulations. The highest dose corresponds to exposure that has reached a hazard index of 110% from dietary exposure alone. Finally, we simulated at situation were a professional worker spraying fields between 8 and 16, works with brush application for two hours from 19 to 21, and is exposed to pesticide residues according to dietary exposure scenario 2 (Figure 5.37). The dietary exposure is so small that it has no impact on the overall simulation. The dermal exposure is significantly larger, but the body eliminates all the material during the two day weekend break.

118 Optimization of the cumulative risk assessment of pesticides and biocides using computational techniques: Pilot project
(a)
(b)
(c) FIGURE 5.36. SIMULATED CURVES FOR THE TOTAL AMOUNT OF TEBUCONAZOLE (C1M0, BLUE) AND METABOLITES (C1M1, GREEN) IN THE HUMAN BODY AFTER DERMAL EXPOSURE OF TEBUCONAZOLE AS BIOCIDE, 0.292 MG/DAY BY FOUR HR INDUSTRIAL TREATMENT, AND DIETARY ORAL EXPOSURE OF 0.01 µG/KG BW/DAY (EXPOSURE SCENARIO 1) (A), 0.29 µG/KG BW/DAY (EXPOSURE SCENARIO 3) (B) AND 2 µG/KG BW/DAY (THEORETICAL SCENARIO 10X EXPOSURE SCENARIO 3) (C). SMALL CONTRIBUTION IS SEEN FROM THE DIETARY EXPOSURE IN CASE OF EXPOSURE SCENARIO THREE, BUT BY MULTIPLYING THE AMOUNT BY 10, THE CONTRIBUTION FROM THE DIETARY EXPOSURE BECOMES SIGNIFICANT, AND A TRACE OF THE CHEMICALS IS NOT EXCRETED.
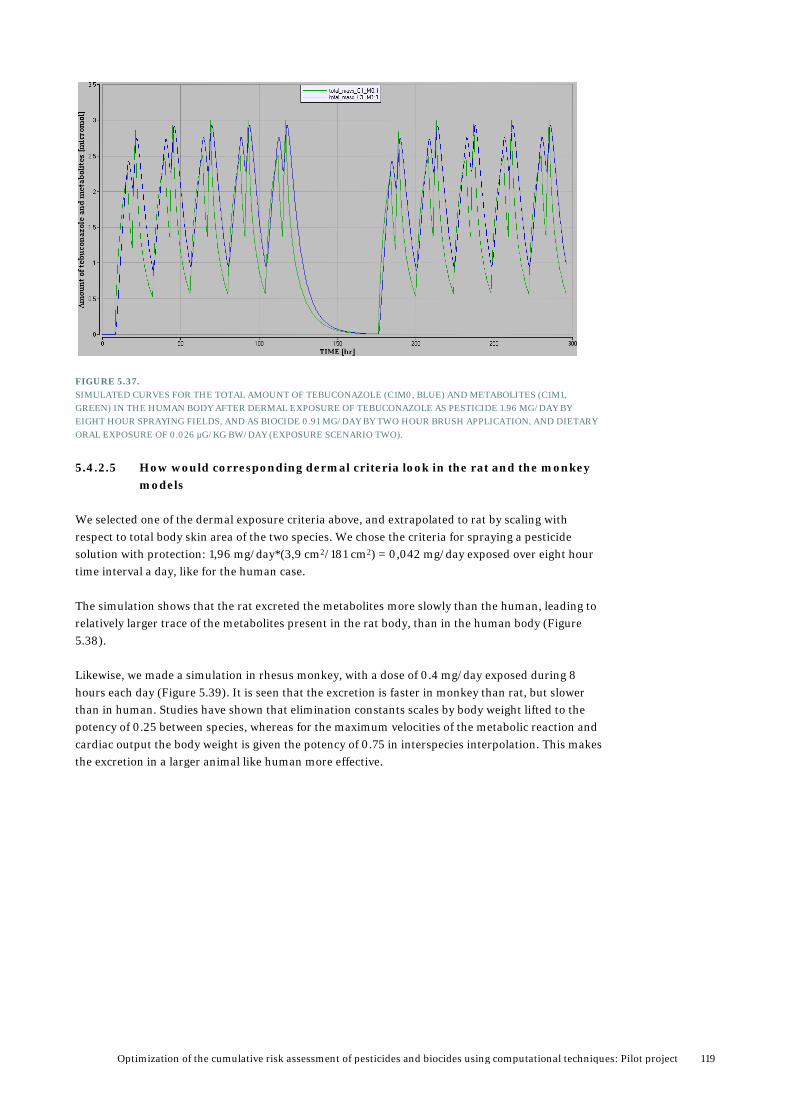
Optimization of the cumulative risk assessment of pesticides and biocides using computational techniques: Pilot project 119
FIGURE 5.37. SIMULATED CURVES FOR THE TOTAL AMOUNT OF TEBUCONAZOLE (C1M0, BLUE) AND METABOLITES (C1M1, GREEN) IN THE HUMAN BODY AFTER DERMAL EXPOSURE OF TEBUCONAZOLE AS PESTICIDE 1.96 MG/DAY BY EIGHT HOUR SPRAYING FIELDS, AND AS BIOCIDE 0.91 MG/DAY BY TWO HOUR BRUSH APPLICATION, AND DIETARY ORAL EXPOSURE OF 0.026 µG/KG BW/DAY (EXPOSURE SCENARIO TWO).
5.4.2.5 How would corresponding dermal criteria look in the rat and the monkey
models We selected one of the dermal exposure criteria above, and extrapolated to rat by scaling with respect to total body skin area of the two species. We chose the criteria for spraying a pesticide solution with protection: 1,96 mg/day*(3,9 cm2/181 cm2) = 0,042 mg/day exposed over eight hour time interval a day, like for the human case. The simulation shows that the rat excreted the metabolites more slowly than the human, leading to relatively larger trace of the metabolites present in the rat body, than in the human body (Figure 5.38). Likewise, we made a simulation in rhesus monkey, with a dose of 0.4 mg/day exposed during 8 hours each day (Figure 5.39). It is seen that the excretion is faster in monkey than rat, but slower than in human. Studies have shown that elimination constants scales by body weight lifted to the potency of 0.25 between species, whereas for the maximum velocities of the metabolic reaction and cardiac output the body weight is given the potency of 0.75 in interspecies interpolation. This makes the excretion in a larger animal like human more effective.

120 Optimization of the cumulative risk assessment of pesticides and biocides using computational techniques: Pilot project
(a)
(b) FIGURE 5.38. PREDICTED CURVES FOR THE TOTAL AMOUNT OF TEBUCONAZOLE (C1M0, GREEN CURVE), METABOLITES (C1M1, BLUE CURVE) IN THE RAT BODY AT EACH TIME AFTER DERMAL EXPOSURE OF 0.042 MG/DAY IN A 12 DAY (A) AND A THREE DAY (B) SIMULATION. THE TOTAL AMOUNT OF METABOLITES FORMED IN (BLACK CURVE) AND EXCRETED FROM (RED CURVE) THE BODY DURING THE SIMULATION, IS SHOWN AS WELL IN (B).

Optimization of the cumulative risk assessment of pesticides and biocides using computational techniques: Pilot project 121
FIGURE 5.39. PREDICTED CURVES FOR THE TOTAL AMOUNT OF TEBUCONAZOLE (C1M0, GREEN CURVE), METABOLITES (C1M1, BLUE CURVE) IN THE RHESUS MONKEY BODY AT EACH TIME AFTER DERMAL EXPOSURE OF 0.4 MG/DAY IN A 12 DAY SIMULATION.

122 Optimization of the cumulative risk assessment of pesticides and biocides using computational techniques: Pilot project

Optimization of the cumulative risk assessment of pesticides and biocides using computational techniques: Pilot project 123
6. Discussion
6.1 Quality of the PBTK models, strengths and weaknesses We have developed a pilot version of a toolbox of relatively simple PBTK models for tebuconazole and prochloraz in rat and human, with additional models developed for tebuconazole in rabbit and rhesus monkey. In the development of the PBTK models, much work was devoted to creating as good and accurate PBTK models for the individual compounds as possible, based on the available data for the compounds studied. It is important that the blood and tissue concentration levels are simulated sufficiently accurately for the individual compounds. The strength of the models developed in this work is that almost all the parameters used are based on available experimental data, and no parameters were adjusted to experimental blood and tissue concentration data. The elimination rate constant was adjusted to experimental excretion data for rats for each compound (and for tebuconazole also for rhesus monkeys), and this is the only parameter in the respective models that was adjusted to in vivo data. The weakness of the models is that we could only properly validate the tebuconazole model with respect to blood and tissues levels, as good a data set was not available for prochloraz. Blood and tissue concentrations of tebuconazole were validated in another species, namely rabbit, which also introduces some uncertainties. Another consideration is that the human versions of the PBTK models for tebuconazole and prochloraz could not be validated on in vivo data, as no such data exist in human for the compounds studied. To do the best evaluation of the models we possibly could, a variety of available data were used. For example, data on the rough estimate of the blood levels in rat after oral administration of a mixture of pesticides could be used to evaluate the approximate levels of tebuconazole and prochloraz in blood, respectively. This was very useful, as these data could verify that the simulated blood levels were within reasonable order of magnitude with respect to the experimental data. Also these data verify the fast metabolism tebuconazole and prochloraz measured in vitro. The extrapolations of parameters between species seem to work well. Obviously some uncertainties are introduced by applying such techniques. Also some uncertainties are introduced by using QSAR predicted parameters for the fraction unbound. This is discussed in greater detail in the following section. The models for the individual compounds are flow regulated PBTK models that assume instantaneous equilibrium between levels in blood and tissues. Essentially, one assumes the organism to be a well stirred system, and that no significant accumulation of the active compound occurs in fat or other tissue. Although a small accumulation was seen in rabbit fat, the tebuconazole was excreted within a short period of time. As fat is not a target tissue it was not considered worth while to include a diffusion based deep compartment, with the need of including additional parameters in the model.
124 Optimization of the cumulative risk assessment of pesticides and biocides using computational techniques: Pilot project
Such flow based models may have some limitations at very low tissue concentrations (Baelum et al., 1993). The simulated concentration levels of tebuconazole in rabbit plasma and tissues match the experimental data points well at the highest time points, indicating that the model is suitable for simulating the low concentration levels of the experiments terminal phase for this particular compound. 6.2 The sensitivity of the parameters on the simulation Species dependent physiological parameters like body weight, tissue volumes, cardiac output and blood flow rates are important in the sense that they define the species simulated. In the work presented here, simulations have been made for an average male rat and an average human male, the physiological parameters for those have been well defined in the literature (Brown et al., 1997). The influence of variability in body weight, etc. can be explored by PBTK (Clewell et al., 2004; Yoon et al., 2011), but it is not the scope of this work. The compound specific parameters are normally also specific for each species. Some of these parameters can be extrapolated from one species to another, and thus it can be sufficient to have experimental values in one of the species. We have investigated the accuracy of the parameters used in the developed PBTK models and the influence of variability in these parameters on the simulated blood and tissue concentrations. It was found that parameters like fraction unbound in plasma, the metabolic constants, the tissue:blood partition coefficients, and the elimination rate constant are particularly important. Available ADME data for tebuconazole and prochloraz were fed into the models. An experimental value for the fractional absorption in rat is available for each of the compounds, and the rat values were assumed for humans. The oral absorption rate constant was assumed, and it does influence the absorption rate of an oral bolus dose in the model, but is not used in dietary administration part of the model. Experimental in vitro data on the depletion rate are available in the literature, metabolic constants measured in rat microsomes for tebuconazole and intrinsic clearance measured in human hepatocytes for prochloraz. The experimental maximum velocity for tebuconazole was extrapolated from rat to human, and the intrinsic clearance of prochloraz was extrapolated from human to rat. The first order elimination rate constants for the urinary and faecal excretion of both compounds were adjusted to experimental excretion data in rat (accumulated excretion), in the case of tebuconazole and to rhesus monkeys as well for validation purposes. We do not have sufficient data to evaluate the uncertainty introduced in the depletion rate due to such extrapolations. On the other hand, we show some analysis of the sensitivity of these parameters on the simulated blood concentration levels in rat to illustrate the influence of intra-species variability. The simulation showed that two-fold change in the maximum velocity and intrinsic clearance lead to two-fold change in the peak concentration level in blood. Also the use of parameters predicted by QSAR models developed based on structurally similar compounds introduce uncertainties as well. One of the two parameters predicted by QSAR has substantial influence on the simulated blood and tissues concentrations of the mother compound, namely the fraction unbound in plasma. The predicted QSAR models were validated before they were applied for predicting parameters for tebuconazole and prochloraz (section 4.1.2.2). The QSAR predictions for the fraction unbound and the volume of distribution were obtained from models trained on human data, and extrapolated to rat. We have evaluated the uncertainty of the predicted fraction unbound in human to be ± 0.1, and ± 0.2 for rat. An experimental value for the fraction unbound of prochloraz measured in human cells found after the QSAR models had been developed, is well within the prediction uncertainty of the QSAR model.

Optimization of the cumulative risk assessment of pesticides and biocides using computational techniques: Pilot project 125
The distribution to the different tissues are modelled by tissue:blood partition coefficients, that are calculated on the basis of the octanol:water partition coefficient, fraction of water, neutral lipid and phospholipids in the tissue and fraction unbound in plasma. These values are predicted, and not adjusted to experimental blood and tissue concentrations. The validation and analysis of tebuconazole in rabbit indicated that for most tissue, the predictions deviated from the experiment data within factor of two, which is our preliminary rule of thumb for evaluating ranges for possible tissue levels. In cases of iv and dermal administration, we would estimate the liver concentration to be at the same level as the other rapidly perfused tissues, instead of using the predicted liver level, which is significantly underestimated. This needs to be investigated further for other compounds, before we can make any more general conclusions, as our experience is based on small number of data. See detailed discussion on the accuracy of the different parameters in the following sections. 6.2.1 The oral absorption rate constant and fractional absorption Data on the extent of oral absorption (fractional absorption) were available for both tebuconazole and prochloraz (JMPR, 2010; JMPR, 2001) On the other hand, no precise data on the absorption rate of these compounds were found, but it was stated that tebuconazole absorbs within an hour (JMPR, 2010). Thus it was necessary to assume the absorption rate constants governing the pulse function that simulates the oral absorption rate of an oral bolus dose from the GIT to the liver, via the portal vein. This can affect the simulated blood and tissue concentrations at low time points upon oral bolus dose administration, but does not influence on the dietary exposure simulation. In the case of dietary exposure it is assumed that we are evenly exposed to the chemical from the food 12 hrs a day, with 12 hr rest. This is of course an estimate as well. 6.2.2 Fraction unbound in plasma The fraction unbound in plasma has significant influence on the blood concentration levels, as only the fraction of the active compound that is not bound to plasma proteins can be distributed to the tissues at each time point. This parameter was not available for tebuconazole in the literature. We thus developed a QSAR model on corresponding human data for triazoles and imidazole that are used as drugs and predicted the fraction unbound for tebuconazole and prochloraz in human with the resulting QSAR model. Then we extrapolated the human values to rat values using correlative equation between human and rat from the literature. There is of course some error introduced by using predicted values, rather than experimental ones. Our results indicate that these predicted values gave realistic levels of the free fraction of the compounds in plasma, to the extent we can evaluate it by comparing simulated blood concentration levels with experiments. After the QSAR model had been developed experimental value for prochloraz measured in vitro was found in the literature (Wetmore et al., 2012). The QSAR prediction (fu,human(QSAR) = 0.07) can be considered in acceptable agreement with the experimental value (fu,human(exp) = 0.0224) for prochloraz. If these values are calculated as percentages and not fractions, this amounts to a 5% difference. Uncertainty of 20% can easily be expected for the predicted rat values, as an interspecies extrapolation has been done based on the QSAR prediction from the human model. As seen by the validation results, the QSAR predictions were fairly accurate in most cases. For compounds that had less structural similarity with the training set compounds, larger uncertainties were seen. For example, when tebuconazole was predicted with two different QSAR models, one based on all 14
126 Optimization of the cumulative risk assessment of pesticides and biocides using computational techniques: Pilot project
training set compounds and one based on a subset of 11 compounds, the predicted value differed by 3% (Table 3.12). For prochloraz the difference was 10%, which we can use as an estimate for the uncertainty in the QSAR prediction with the human model. Thus one has to be aware that some uncertainties are associated with using a parameter predicted by QSAR, yet it is a greatly valuable help to be able to predict parameters that are within range of the actual value, and helps us to develop more realistic models than we would otherwise be able to do. 6.2.3 The metabolic constants Accurate values for the Michaelis-Menten constant and the maximum velocity of the metabolic reaction are essential for any PBTK simulation. Experimental values measured in rat microsomes were available for tebuconazole (Shen et al., 2012). Corresponding parameters were not available for prochloraz, but instead experimental intrinsic clearance data in human hepatocytes have been published in Supplementary Table 8 in (Wetmore et al., 2012). We explored the influence caused by the two-fold variation in these constants by multiplying the experimental parameters with two or dividing them by two. For tebuconazole the simulated blood levels in rat scales essentially reversely with the altered Vmax and scales proportionally with the altered KM (Figure 5.10). Probably, in situations when a compound is essentially metabolised as soon as it enters the liver, changes in the blood levels scale so directly with changes in the metabolic constants. The blood levels are much less influenced by alterations in the metabolic constants in the rabbit simulation that used iv administration according to the model, where the first pass effect of liver metabolism is absent (Figure 5.6). In reality there might be some first pass effect due to enterohepatic recirculation in rat, but this is not included in the model. Similarly, the simulated blood levels of prochloraz scales inversely with the altered CLint (Figure 5.17). The intrinsic clearance can be used to describe the linear part of the Michaelis-Menten curve, and it thus well suited for simulating the depletion rate at low exposure levels, but not at higher exposure levels where saturation of the metabolic enzymes is reached. We investigated if it was possible to use experimental metabolic constants from similar compounds, undergoing similar metabolic reactions in the same CYP, to simulate the metabolism of prochloraz at higher concentrations. Prochloraz follows a rather special metabolic pathway, where the imidazole ring opens and cleaves off, and the resulting metabolite follows similar metabolic reactions like many triazole and imidazole compounds. Unfortunately we did not have such constants for a structurally similar compound to prochloraz, undergoing a sufficiently similar metabolic pathway. The closest we could get was to use metabolic constants for furan measured in liver hepatocytes for the ring opening reaction, and metabolic constant determined for the 5-hydroxilation of omeprazole in human CYP2C19 in insect liver microsomes measured in a recombinant assay for the remaining reactions. These “transferred” constants did result in depletion rate similar to the one calculated with the experimental intrinsic clearance value at lower exposure levels. Although this can be considered a long shot, we evaluated that we could use these parameters for the high exposure level simulations of prochloraz for studying the influence of inhibition by tebuconazole. Our collection of experimental metabolic constants for azole type compounds can probably be useful in more generic modelling (Appendix 6), and will be further explored in that respect. 6.2.4 Tissue:blood partition coefficients and fraction unbound in tissue

Optimization of the cumulative risk assessment of pesticides and biocides using computational techniques: Pilot project 127
We have used a relatively simple approach for predicting tissue:blood partition coefficients based on the octanol:water partition coefficients for the two compounds, the tissue composition, and the fraction unbound in plasma and tissue (Poulin and Theil, 2002). The advantage of this approach is that it can be used to predict the partition coefficients from readily available data. Experimental values for the octanol:water partition coefficients, and data for the fractional content of water, neutral lipids and phospholipids for the different tissue were available in the literature. A value for the fraction unbound in plasma was predicted by QSAR, but no data for the fraction unbound in tissue was available for these compounds. It was assumed to be unlikely that substantial binding to tissue proteins occurs for compounds that are eliminated rather fast, within 72 hrs, and we set the fraction unbound in the tissues to one. The correctness of this assumption can be discussed, and some underestimation of the partition coefficient indicated in our simulation could be due to this parameter. We estimated the accuracy of these predicted partition coefficients for the PBTK model for tebuconazole in rabbit, where tissue level curves were available in a number of tissue (sections 5.1.1.2 and 5.1.1.3). According to these results, the predicted partition coefficient in muscle can be considered to be accurately predicted by the method, and it seems that two-fold increase in the value for the rapidly perfused tissue types can capture the uncertainty in this parameter. The lungs behaved very differently from other tissue, possibly governed by some additional biological mechanism not included in the model. As the lungs are not a target organ, it is not a significant problem for the model. The experimentally measured tebuconazole concentrations in liver were comparable to the concentrations in other rapidly perfused tissue like kidney and heart. The model assumes that the entire metabolism takes place in the liver, and it looks like tebuconazole is drained from the liver by the fast metabolism in the simulation. Such trait is seen in all simulations that use either iv or dermal administration, instead of oral administration. Thus simulations where the tebuconazole is distributed in the body before it reaches the liver for metabolism render very low concentration levels in liver, compared to other rapidly perfused tissues. The measured liver levels could be matched by using approximately seven fold value of the predicted partition coefficient in the simulation. The experimental data show liver concentrations on comparable level to other tissue like kidney, and it is unlikely that the partition coefficient should be three times larger for liver than for kidney in this case. This might be an artefact of the model, when simulations are carried out for compounds with very high depletion rate. We assume that all the metabolism occurs in the liver, which is an over-simplification, and for non-oral exposure routes the compound might be metabolised in other tissue as well, as it is distributed to the body, including the liver, and does not benefit from the first pass effect like oral exposure. Both the first pass effect in the liver and the distribution to the liver from the blood stream are included in the models. It should be mentioned, that a mathematical description of enterohepatic recirculation has not been included in the model. It is known to occur in rats, and does possibly also occur in other rodents like rabbits, and in such case enterohepatic recirculation might contribute to some first pass like effect in rabbits upon iv administration. These results indicate that specific consideration needs to be made for the present model, when liver levels are estimated for non oral administration routes, like when the iv and the dermal routes are applied. A simple solution would be to assume that the liver concentration level is similar to the corresponding concentration level for the other rapidly perfused tissue. This needs to be investigated further, especially in relation to the use of simulated liver levels in risk assessment.
128 Optimization of the cumulative risk assessment of pesticides and biocides using computational techniques: Pilot project
Many other methods have been proposed for predicting the tissue:blood partition coefficients. Some of them incorporate the influence of ionization of the active compounds (Rodgers et al., 2005; Rodgers and Rowland, 2006; De Buck et al., 2007; Peyret et al., 2010; Poulin and Haddad, 2012), which is not relevant for the two compounds studied here as they are neutral at blood pH levels (Table 3.4). Another model has also included the fractional volume of the binding proteins in different tissue as well, and computed cell:water, interstitial fluid:water, plasma:water and erythrocyte:water partition coefficients in the process of determining the tissue:blood partition coefficient(Peyret et al., 2010). This algorithm seems highly biologically relevant, yet quite complicated and not straight forward to use. The authors compared predictions with their algorithm with predictions from several other algorithms, indicating that overall similar results are obtained with the different algorithms, including the relatively simple algorithm we have adapted in this work. 6.2.5 Elimination rate constants The elimination rate constants govern the excretion rate the compounds, and in this work the rate whereby the metabolites are excreted from the body. In the models developed in this work, the absorbed fraction of the active compounds is fully metabolised. The body levels of metabolites are therefore strongly affected by this parameter, but not the blood and tissue levels of the active compounds. The elimination rate constants were determined by adjusting calculated excretion variable in the PBTK model to available excretion data (accumulated excretion) for the compounds studied. This approach was chosen due to lack sufficient data for predicting these parameters otherwise. We would have had to make a much more complicated model, including enterohepatic recirculation and to add one or more compartment for the stomach and the intestines. Without proper data for doing so, this would only have made the overall model less accurate, and thus we chose make a specific excretion compartment and adjust this parameter to available experimental data. This simple approach of making a specific excretion compartment is often used in PBTK models in the literature, and when good excretion data are available, it can be highly recommended. It makes it possible to simulate compounds that are partly excreted via the bile in a simple way. The human values were calculated based on the rat values using inter-species extrapolation. Where the literature proposes an allometric scaling equation inversely proportional to the body weights in the power of 0.25 (ke,human = ke,rat (BWrat/BWhuman)0.25) (Campbell, Jr. et al., 2012), excretion data of tebuconazole from rhesus monkeys could be accurately simulated using an elimination rate constant that was proportionally scaled to the body weights of rat and monkey in the power of 0.25 (ke,monkey = ke,rat (BWmonkey/BWrat)0.25). Moreover, when an elimination rate constant was adjusted to the rhesus monkey data, the monkey to human extrapolated ke value corresponded to the rat to human extrapolated value, when allometric scaling proportional to the respective body weights in the power 0.25 was used (section 3.3.2.3). Our empirical data indicate that the altered allometric scaling equation can be used to for extrapolating elimination rate constants between the different species. 6.2.6 Inhibition constants and induction It was confirmed in our analysis with the binary model for prochloraz and tebuconazole that inhibition does not have to be considered at exposure levels in the range of the human relevant exposure scenarios, constructed in this work. In the absence of experimental data on inhibition constants between the two compounds, inhibition was explored with a set of relevant inhibition constants taken from the literature. One was retrieved from an inhibition study between R- and S-

Optimization of the cumulative risk assessment of pesticides and biocides using computational techniques: Pilot project 129
tebuconazole representing relatively strong inhibition (Shen et al., 2012), and another was within a range of KI values determined between many organic compounds in the literature (El-Masri et al., 2004; Timchalk and Poet, 2008), representing less strong inhibition. It was considered to include enzyme induction in the models, especially as prohcloraz is documented to induce CYP metabolism at higher dose levels. This would require an additional parameter added to the model. The simulated concentration levels at higher exposure levels were considered to be at an acceptable level for the purpose of the developed models, although induction is likely to occur for both compounds. As the developed tool is mainly aimed at low dose simulations for application in risk assessment, we did not include induction in this version of the models. The models can be refined if the need arises at a later point. 6.3 Applicability of the developed PBTK model Optimally we would need both single dose and multiple dose data on concentration levels in blood and tissues for validating the models adequately for an all-purpose application. Data for compounds administrated via different routes, orally, dietary or dermally, are a plus for the validation. Even with so limited data for validation, we have learned much about the two compounds by pooling together all relevant and available data for these compounds in the developed PBTK models. The following considerations are based on the limited validation that could be performed and analysis of trends seen in the simulation. The concentration levels are affected by the route of exposure. The dermal routes lead naturally to relatively larger skin concentration, and slower metabolism than it is the case for compounds administrated by the oral and dietary routes that benefit from the first pass effect of the liver. These differences in blood and tissue concentration levels are described by the same set of parameters describing the compounds ADME. In accordance to the available data, it seems that it is generally not of importance which exposure route is applied with respect to the accuracy of blood and tissue levels simulated by the models. There is an unfortunate exception to this, namely the liver concentration level, which seems to be significantly underestimated (more than a factor of two) for the dermal and iv exposure routes. We assume that the compounds have the same ADME at high and low doses. It is possible that the depletion rate is overestimated at very low liver concentration levels, in case the well stirred flow based model does describe the system adequately at very low concentrations. The experimental data for rabbit indicate that this is not a problem. Such issues we will seek to investigate in our future work. The important thing is to be able evaluate which are the uncertainties in the model, and to incorporate that in the risk assessment. This project provides valuable information for developing a more generic toolbox for cumulative risk assessment, where similar compounds are grouped together, and assuming similar ADME for the compounds. Another application area is aggregate exposure from different routes, as illustrated with combined dietary and dermal exposure of tebuconazole discussed in section 5.4.2.4. For such purpose we will have to do with validating well for some compounds and assume similar behaviour for others. That will be a useful approach for pesticides and biocides, and many other compounds where data are scarce. For this purpose it is important to group the compounds based on structural similarity and available data for ADME properties, such that we indeed group compounds that do behave similarly. Although the binary simulations are rather theoretical, they illustrate important principles with respect to inhibition, and verify that inhibition is not likely to be a problem at low exposure levels.

130 Optimization of the cumulative risk assessment of pesticides and biocides using computational techniques: Pilot project
We need to investigate this for more chemicals, to explore if this as a general trend, or specific behaviour for the compounds studied here. 6.3.1 Evaluation of the models with respect to WHO IPCS guidance on PBTK
models to be used in risk assessment As discussed in background section 1.2, there is increased interest in using PBTK models for risk assessment purposes. A recent report proposes a checklist for selecting and evaluating the quality of PBTK models for use in risk assessment (WHO, 2010b) and we will discuss the models presented in this report with respect to this check list. Biological basis:
• Relevant biological processes are included in the models, the equations for ADME are based on sound theoretical basis, and the parameters used in these equations are based on available experimental data for ADME properties of tebuconazole and prochloraz.
• The species specific physiological parameters are taken from a review with a comprehensive collection of such parameters (Brown et al., 1997) , the volume of the compartments are within known physiologically limits and the total sum of the tissue blood flow rates was normalized to equal the cardiac output in each case.
• An accepted method was used for calculating the tissue:blood partition coefficients, it is a generalised method that introduces some uncertainties.
• Allometric scaling was done according to literature guidelines with the exception of the elimination rate constant, which was extrapolated according to empirical observations made in this work.
• The computer model code was carefully checked for syntax errors and correctness of units, and a proven integration algorithm was used for solving the equations.
• An adequate method was used to estimate elimination rate constants. The elimination rate constants for the metabolites formed, are the only parameters that were adjusted to in viv experimental data, namely accumulated excretion data in each case.
Conclusion: The biological basis of the developed PBTK models is considered to be well described . Model simulation of data:
• The models were explored for their ability to predicting kinetics under various conditions, both at low exposures levels, which is the intended application area of the models, and at higher exposure levels up to saturation of the metabolic enzymes.
• The influence of inhibition of a binary mixture was explored based on theoretical considerations.
• It was investigated if the models were able to reproduce general trends of the data, using the limited data available for validation. Where the simulations for tebuconazole in various tissues in rabbit showed trends corresponding to the experimental data at higher time points, discrepancies were seen at the lowest time point (15 min after iv injection). The corresponding simulated plasma concentration followed the trend in of the experimental data. The lag time observed for tissue concentrations in this experiment was considerably larger than for comparable experiments for other compounds using iv administration (Sweeney et al., 2010; Hamelin et al., 2010; Hamelin et al., 2009). An exception to this was the lung, where no lag time was observed. We do not have an explanation of this behavior, which cannot be capture by a simple flow-based model. It should be mentioned that each time point is measured on one animal only. As the model is overestimating rather than underestimating the experimental levels at this early time point, it is not considered a problem with respect to application of the model for risk assessment.
• In most cases the simulated plasma and tissue concentrations of tebuconazole in rabbit were within factor of two with respect to the experimental data. An exception to this, were the liver and lung levels in the rabbit experiment.

Optimization of the cumulative risk assessment of pesticides and biocides using computational techniques: Pilot project 131
Conclusion: Based on the limited validation data available, the models seem generally to simulate blood and tissue concentration levels within a factor of two. Thus if the developed models were used for risk assessment, the best advice we can give is to multiply the simulated blood and tissue concentration levels by two. When dermal or iv administration is applied, it would be better to assume liver concentration at the same level as the other rapidly perfused tissue, than using the simulated concentration levels for liver, that seem to be significantly underestimated. Reliability (model testing, uncertainty and sensitivity):
• The models seem to underestimate the concentration levels in blood and tissue somewhat, as discussed in the section above.
• Simulations have been made for many relevant exposure conditions, but in the absence of data for validation, the uncertainty of the model cannot be fully assessed at these conditions.
• We have to rely on the inter-species extrapolations and the high dose to low dose extrapolations made, if deemed feasible in the investigation of the biological basis of the models.
• The experiments providing the data used for parameters describing the ADME of these compounds are to best of our knowledge reliable, and the reliability of the model is highly linked to the reliability of these parameters, as well as the reliability of the few available validation data.
• The sensitivity of key parameters has been investigated with respect to the simulated blood concentration levels.
Conclusion: Based on the evaluation of all the data fed into the models, we evaluate that it is acceptable to make predictions the developed models. Some uncertainty estimates for the rat model are discussed under the model simulation of data part, but corresponding estimates for the human models are difficult to make at present. Corresponding investigations for other compounds need to be made before assessing more accurate uncertainty estimates. Thus predictions with the present models, especially the human versions of the models, should be considered to give a more qualitative rather than quantitative estimate, and can be considered useful as such. Applicability of the developed models:
• The tebuconazole model was developed for rat, rabbit, rhesus monkey and human, and the prochloraz model for rat and human. The models were evaluated using available data for the different animal species, but we had no human data to evaluate the human model, although some human data were fed into the model. As these compounds follow the same metabolic pathways in a variety of species, it was assumed that these compounds would undergo similar metabolic reactions in humans.
• The oral, dietary and dermal exposure routes were implemented, corresponding to the anticipated routes of human exposure. The inhalation route is not implemented in the present model, but can be added if the need arises.
• Simulations were made for relevant exposure scenarios in human were, but it was not possible to validate the human models in similar situations.
• The models were developed and parameters selected with respect to the purpose of application, namely cumulative and aggregate risk assessment at low exposure levels. Thus relatively simple models with focus on obtaining estimates of concentration levels in blood and selected tissues within factor of two were developed.
Conclusion: The models developed in this pilot project can be considered as the first step in developing an applicable tool box to provide input to risk assessment of pesticides, biocides and other chemicals. Further development of this pilot project is needed before making sufficient conclusions of the applicability of the developed models. Some overall conclusion on the accuracy of the model predictions are given in the conclusions in the model simulation of data part, and these are the conclusions we can make based on the current pilot project. It is important to point out that all the relevant exposure levels of the individual compounds are much lower (>100) than the NOAEL measured in animal studies.

132 Optimization of the cumulative risk assessment of pesticides and biocides using computational techniques: Pilot project

Optimization of the cumulative risk assessment of pesticides and biocides using computational techniques: Pilot project 133
7. Conclusion
In this report we present new PBTK models for two individual active compounds in pesticides and biocides, tebuconazole and prochloraz, and a binary mixture of these two compounds. The models were developed in both rats and humans. The model development was based on thorough investigation of the ADME, toxicology and a broad range of biological and physic0-chemical parameters available in the literature for the compounds studied, and related compounds. The PBTK models of the individual compounds were carefully developed, validated to the extent it was possible and analysed, before combining them into a binary model for both compounds. We considered how uncertainties in the model parameters could affect the simulated blood and tissue levels, and it is of particular importance to have access to accurate parameters for the metabolism. Tebuconazole and prochloraz have available data for metabolic rates, measured in in vitro experiments. It was seen from our simulation for a binary mixture that inhibition of metabolic enzymes did not have to be considered at lower exposure levels like the ones of the exposure scenarios used. Simply speaking, there is sufficient metabolic capacity to metabolise the compounds in the low exposure simulations, such that the two compounds do not inhibit the metabolism of each other. Despite the lack of experimental in vivo data for better validating the models, the biological basis of the models is considered adequate. The developed models showed to be very useful for exploring trends in ADME, interactions at higher concentration levels, influence of aggregate exposure. It was evaluated that such models can be useful for providing input to risk assessment at lower exposure levels, well below NOAEL, if potential uncertainties in the model due to parameters used and extrapolations are considered as well. The exposure scenarios constructed based on detected pesticide residues in fruit and vegetable gave low body levels for tebuconazole in our simulation, but somewhat higher body levels for prochloraz that had lower fraction unbound in plasma. The dermal exposure scenarios were based on exposure assessment made by the Danish EPA for specific applications of tebuconazole as biocide or pesticide by professional workers. Simulations with these scenarios gave not surprisingly internal body levels that were relatively larger than those resulting from dietary exposure. Another issue is that at repeated daily exposure, the metabolism of prochloraz and the excretion of tebuconazole did not have the capacity to remove the active compound and its metabolites before the organism was exposed again, according to our simulation. Thus it was important with exposure free days to clear the body. Unfortunately, we do not have experimental data to verify this.

134 Optimization of the cumulative risk assessment of pesticides and biocides using computational techniques: Pilot project

Optimization of the cumulative risk assessment of pesticides and biocides using computational techniques: Pilot project 135
8. Perspectives
The motivation behind this project was to develop a pilot version of a tool box, intended for use in risk assessment of mixtures of pesticides, biocides and hazardous organic chemicals in general. The present pilot project was aimed at developing PBTK models for two individual compounds, tebuconazole and prochloraz, and a binary mixture of those. It was focused on developing the models, validating them on available data and carrying out simulations for specific exposure scenarios. As discussed previously, several examples of PBTK based risk assessment of individual organic volatile and other organic compounds can be found in the literature (Gargas et al., 2009; Sweeney et al., 2012; Sweeney et al., 2009; Sweeney et al., 2001; Clewell and Clewell, III, 2008; Andersen et al., 1987; Clewell and Andersen, 2004a). Experiences from these works will provide input to performing PBTK based cumulative risk assessment for pesticides, were only limited work has been done up to now. Presently it is debated which standards should apply to PBTK model development, and how the risk assessment should be carried out. It is generally agreed that there is increasing need for using such methods for higher tier cumulative risk assessment. Aggregate exposure by different exposure routes is another application area for PBTK based risk assessment, for example combined dietary and dermal exposure. PBTK can potentially incorporate more detailed information on ADME in the risk assessment by assessing the internal doses (concentration levels) of chemicals within the body upon exposure. For doing so, appropriate data need to be available for the chemical studied and the developed PBTK model should be considered adequate for the intended application. An important issue is that a PBTK model needs to be of appropriate quality to be used for risk assessment, as discussed above. The abovementioned IPCS report on application of PBTK in risk assessment has set up a checklist to evaluate the biological basis, reliability and applicability of the model, as well as the models capability to simulate different trends and conditions. These principles are important for ensuring that a PBTK model is properly developed, validated, tested and documented, before it is used for risk assessment and for providing framework for conducting PBTK based risk assessment (Meek et al., 2013). First and foremost it is important to document all the choses and assumptions made, both in the PBTK modelling work and in the risk assessment. The possibility of making inter-species extrapolations and high dose to low dose extrapolations makes PBTK highly applicable. It is not always possible to validate the model with respect to in vivo data for every species, nor at all relevant exposure conditions. Often a PBTK model can only be validated on in vivo data from animal studies performed at relatively high doses (compared to exposures to human). Therefore, it is important to establish a sound biological basis for each PBTK model based on available data, and to evaluate the feasibility of using extrapolations in each case. High dose to low dose and inter-species extrapolations seem to work adequately for the models developed in this work. In such cases, estimation of the internal concentration levels in humans at low exposure levels is a viable option, although the human version of the PBTK models have not been validated on human in vivo data.

136 Optimization of the cumulative risk assessment of pesticides and biocides using computational techniques: Pilot project
It is important to consider that such predictions have significant uncertainties. A practical solution to that problem is to multiply the simulated levels with a predefined factor based on an uncertainty estimate for the given model, for example a factor between two and five. In such a way one can seek to avoid underestimation of blood and tissue levels, as some overestimation of these concentration levels is much less of a problem when the results are used for risk assessment purposes. We are thus proposing to introduce an alternative assessment type factor to account for uncertainties in the PBTK simulation. It is important to point out that such models would not be applicable for drugs, as drugs are administrated at relatively high doses, and may have narrow therapeutic window. An assessment factor (previously called safety factor) of 100 has been used as a default in risk assessment for more than 50 years, 10 to account for inter-species differences between laboratory animals and humans, and 1o to account for inter-individual differences in humans. It has been suggested that the inter-species difference should be further divided to two parts, accounting for uncertainties in toxicokinetics (100.6 = 4) and toxicodynamics (100.4 = 2.5), respectively. The inter-individual assessment factor should likewise be subdivided by (100.5 = 3.2) for uncertainties in both toxicokinetics and toxicodynamics (Dourson et al., 2013). PBTK modelling has a large potential to refine the present risk assessment. One can do simulations in the individual species, and thereby study the actual concentration levels in human versus rat. One of the possibilities is to simulate simultaneous exposures from different routes, for example dermal, oral and inhalation, and thereby assess aggregate exposure for risk assessment. PBTK modelling is also considered for cumulative risk assessment by different bodies, like EFSA, as a higher tier approach. There are two very important directions one can chose for further work in this area.
• One possibility is to make relatively simple PBTK models for many compounds with basis in the pilot version of the toolbox developed in this project, and to use such models in cumulative and aggregate risk assessment at relatively low exposure levels, well below NOAEL. In such case the focus will be on establishing as good and sound biological basis for the models, feed available data into the models as parameters, validate the models as well as possible, and accept that all models cannot be validated at all conditions due to lack of data. It is important to use knowledge about similarity between chemicals, especially with respect to molecular structure and ADME characteristics, to group chemicals that can be handled by similar PBTK model architecture, and that can interact with one another via similar metabolism.
• The other main direction is to develop much more accurate PBTK models that are validated at relevant conditions. This can either be done by selecting chemicals that are rich on in vivo data both from animal studies and have some human data, or by acquiring the necessary data by collaboration with experimental groups.
It is important to follow both these direction. In this way a practical tool box for providing input to cumulative and aggregate risk assessment in the pesticide and biocide area can be developed. Such tool box should be applied in situations where data is generally scarce and strong need exist for estimates of internal concentration levels in the low dose area. At the same time more detailed analysis can be done for other compounds, were strengths and limitations of the underlying methods used for inter-species extrapolations are explored for compounds where thorough validation can be performed. To develop a comprehensive tool box for use in cumulative risk assessment, the model for a binary mixture needs to be extended to models for multiple component mixture. Technically this can be done in the framework of the modular approach developed in this project. In such case one would have to make estimates of inhibition constants between the compounds in the mixture at higher exposure levels. In the low exposure level range, like the scenarios used in this work, a possibility
Optimization of the cumulative risk assessment of pesticides and biocides using computational techniques: Pilot project 137
would be to use a simple procedure where the actual blood and tissue levels for the different compounds are added together at each time point in the simulation. In such case, the curve for each compound needs to be scaled by a reference value for the same compound. It is therefore important to adjust present risk assessment methods to accommodate the use of internal concentration levels in blood and tissues, and to develop reference values suitable for PBTK based risk assessment. Present reference values like ADI are made for traditionally risk assessment, which is carried out with respect to the exposed dose, are not considered appropriate for use in PBTK based risk assessment. The recent IPCS report on application of PBTK in risk assessment (WHO, 2010a) points out that the dose metric for the exposure scenario to be risk assessed should be calculated in the same way as the critical toxicological study. A simple solution would be to carry out simulations at the actual exposures and then simulations at an exposure equal to a specific reference value as well. Thereby, internal concentration reference values would be created based on the present reference values. An important question is which reference value would be the most appropriate to use in PBTK based risk assessment of chemicals, and for pesticides and biocides in particular. As PBTK models can be extrapolated from one species to another by inserting the appropriate parameters, inter-species differences are incorporated in the simulation. The ADI, which is derived from NOAEL obtained from animal studies, generally by division with an assessment factor of 100 to account for inter-species and inter-individual differences, is thus not necessarily the most appropriated reference values to use. A possibility would be to base the risk assessment on NOAEL. In such case it would be necessary to account for the inter-individual differences, for example by applying an assessment factor that only accounts for inter-individual and not inter-species variability. These questions need to be addressed. The bench mark dose (BMD) is also mentioned in relation to PBTK based risk assessment among other. Judson et al. proposed a relatively simple and innovative approach where human in vitro data from the ToxCast program of U.S.EPA was combined with a simple human PBTK model ling to define so-called Biological Pathway Altering Dose. This approach could be applied as a surrogate risk assessment in cases where no animal data in available. In some cases one might choose to use the external exposure as a reference value, basically assuming complete absorption and no degradation. In such case, this should be clear from documentation of the work. For compounds like tebuconazole and prochloraz, which are almost completely metabolised upon absorption, such approximation would underestimate the risk, because the internal levels are so small compared to the exposed doses. More sophisticated ideas can be realised with present methods in PBTK modelling, given that appropriate data for model parameter, as well as for model validation, are available. The pesticide and biocide area suffers from lack of toxicokinetic data in contrast to the rich toxicological information available. Thus it will take time to acquire the necessary data to develop advanced PBTK models in this area. Nevertheless, some key possibilities are mentioned below. One possibility is to include inter-individual variability into the model, for example by carrying out simulations for different age groups and to do probabilistic estimates of the influence of genetic variability. In such case appropriate experimental data on variability in metabolism between individuals is needed, among other, and new data has to be acquired for vast amount of chemicals. Another important extension of the present model would be to make a specific model for children. There are many physiological and toxicokinetic differences between children and adults which may result in different internal concentration levels . Children are the most sensitive group of individuals as their metabolic pathways are still developing. The exposure levels of pesticide residues from the

138 Optimization of the cumulative risk assessment of pesticides and biocides using computational techniques: Pilot project
food are higher for children the adults, as children eat larger quantities of food in relation to their body weight. Simulating the distribution of compounds to the fetus by developing a model for at pregnant woman is also an important possibility to assess the internal dose during fetal life. Probabilistic methods are very useful to account for variability and uncertainty in data used for the risk assessment, and can be used to evaluate the variability in key parameters and to incorporate variation due to inter-individual differences in the PBTK based risk assessment (Rietjens et al., 2008; Bois et al., 2010; Nong et al., 2008). Such work could eventually be used to modify the assessment factors presently used to account for inter-species and inter-individual variability. Probabilistic methods are also powerful tools for estimating variation in exposure levels, and are also used as tools for estimating cumulative risk assessment (Bos et al., 2009; Muller et al., 2009; Petersen et al., 2013).

Optimization of the cumulative risk assessment of pesticides and biocides using computational techniques: Pilot project 139
References
Andersen,M.E., Clewell III,H.J., Gargas,M.L., Smith,F.A., and Reitz,R.H. (1987). Physiologically based pharmacokinetics and the risk assessment process for methylene chloride. Toxicol. Appl. Pharmacol. 87, 185-205.
Baelum,J., Molhave,L., Honore,H.S., and Dossing,M. (1993). Hepatic metabolism of toluene after gastrointestinal uptake in humans. Scand. J. Work Environ. Health 19, 55-62.
Barton,H.A., Tang,J., Sey,Y.M., Stanko,J.P., Murrell,R.N., Rockett,J.C., and Dix,D.J. (2006). Metabolism of myclobutanil and triadimefon by human and rat cytochrome P450 enzymes and liver microsomes. Xenobiotica 36, 793-806.
Baugros,J.B., Cren-Olive,C., Giroud,B., Gauvrit,J.Y., Lanteri,P., and Grenier-Loustalot,M.F. (2009). Optimisation of pressurised liquid extraction by experimental design for quantification of pesticides and alkyl phenols in sludge, suspended materials and atmospheric fallout by liquid chromatography-tandem mass spectrometry. J. Chromatogr. A 1216, 4941-4949.
Beamer,P.I., Canales,R.A., Ferguson,A.C., Leckie,J.O., and Bradman,A. (2012). Relative pesticide and exposure route contribution to aggregate and cumulative dose in young farmworker children. Int. J. Environ. Res. Public Health 9, 73-96.
Belfiore,C.J., Yang,R.S., Chubb,L.S., Lohitnavy,M., Lohitnavy,O.S., and Andersen,M.E. (2007). Hepatic sequestration of chlordecone and hexafluoroacetone evaluated by pharmacokinetic modeling. Toxicology 234, 59-72.
Bois,F.Y., Jamei,M., and Clewell,H.J. (2010). PBPK modelling of inter-individual variability in the pharmacokinetics of environmental chemicals. Toxicology 278, 256-267.
Bomont,H.L., Tarbit,M.H., Humphrey,M.J., and Houston,J.B. (1994). Disposition of azole antifungal agents. II. Hepatic binding and clearance of dichlorophenyl-bis-triazolylpropanol (DTP) in the rat. Pharm. Res. 11, 951-960.
Bos,P.M., Boon,P.E., van,d., V, Janer,G., Piersma,A.H., Bruschweiler,B.J., Nielsen,E., and Slob,W. (2009). A semi-quantitative model for risk appreciation and risk weighing. Food Chem. Toxicol. 47, 2941-2950.
Brightman,F.A., Leahy,D.E., Searle,G.E., and Thomas,S. (2006). Application of a generic physiologically based pharmacokinetic model to the estimation of xenobiotic levels in rat plasma. Drug Metab Dispos. 34, 84-93.
Brown,R.P., Delp,M.D., Lindstedt,S.L., Rhomberg,L.R., and Beliles,R.P. (1997). Physiological parameter values for physiologically based pharmacokinetic models. Toxicol Ind. Health 13, 407-484.
Buist,H.E., van de Sandt,J.J., van Burgsteden,J.A., and de,H.C. (2005). Effects of single and repeated exposure to biocidal active substances on the barrier function of the skin in vitro. Regul. Toxicol. Pharmacol. 43, 76-84.

140 Optimization of the cumulative risk assessment of pesticides and biocides using computational techniques: Pilot project
Byvatov,E. and Schneider,G. (2003). Support vector machine applications in bioinformatics. Appl. Bioinformatics. 2, 67-77.
Caldwell,G.W., Masucci,J.A., Yan,Z., and Hageman,W. (2004). Allometric scaling of pharmacokinetic parameters in drug discovery: can human CL, Vss and t1/2 be predicted from in-vivo rat data? Eur. J. Drug Metab Pharmacokinet. 29, 133-143.
Campbell,J.L., Jr., Clewell,R.A., Gentry,P.R., Andersen,M.E., and Clewell,H.J., III (2012). Physiologically based pharmacokinetic/toxicokinetic modeling. Methods Mol. Biol. 929, 439-499.
Chan,M.P., Morisawa,S., Nakayama,A., Kawamoto,Y., Sugimoto,M., and Yoneda,M. (2006). A physiologically based pharmacokinetic model for endosulfan in the male Sprague-Dawley rats. Environ Toxicol. 21, 464-478.
Chen,K., Teo,S., and Seng,K.Y. (2009). Sensitivity analysis on a physiologically-based pharmacokinetic and pharmacodynamic model for diisopropylfluorophosphate-induced toxicity in mice and rats. Toxicol. Mech. Methods 19, 486-497.
Chen,Y. and Nie,D. (2009). Pregnane X receptor and its potential role in drug resistance in cancer treatment. Recent Pat Anticancer Drug Discov. 4, 19-27.
Chimuka,L., Michel,M., Cukrowska,E., and Buszewski,B. (2009). Influence of temperature on mass transfer in an incomplete trapping supported liquid membrane extraction of triazole fungicides. J. Sep. Sci. 32, 1043-1050.
Clewell,H.J. and Andersen,M.E. (2004b). Applying mode-of-action and pharmacokinetic considerations in contemporary cancer risk assessments: an example with trichloroethylene. Crit Rev. Toxicol. 34, 385-445.
Clewell,H.J. and Andersen,M.E. (2004c). Applying mode-of-action and pharmacokinetic considerations in contemporary cancer risk assessments: an example with trichloroethylene. Crit Rev. Toxicol. 34, 385-445.
Clewell,H.J. and Andersen,M.E. (2004a). Applying mode-of-action and pharmacokinetic considerations in contemporary cancer risk assessments: an example with trichloroethylene. Crit Rev. Toxicol. 34, 385-445.
Clewell,H.J., Gentry,P.R., Covington,T.R., Sarangapani,R., and Teeguarden,J.G. (2004). Evaluation of the potential impact of age- and gender-specific pharmacokinetic differences on tissue dosimetry. Toxicol. Sci. 79, 381-393.
Clewell,H.J., III, Gentry,P.R., Gearhart,J.M., Covington,T.R., Banton,M.I., and Andersen,M.E. (2001). Development of a physiologically based pharmacokinetic model of isopropanol and its metabolite acetone. Toxicol. Sci. 63, 160-172.
Clewell,R.A. and Clewell,H.J., III (2008). Development and specification of physiologically based pharmacokinetic models for use in risk assessment. Regul. Toxicol. Pharmacol. 50, 129-143.
Clewell,R.A., Merrill,E.A., Gearhart,J.M., Robinson,P.J., Sterner,T.R., Mattie,D.R., and Clewell,H.J., III (2007). Perchlorate and radioiodide kinetics across life stages in the human: using PBPK models to predict dosimetry and thyroid inhibition and sensitive subpopulations based on developmental stage. J. Toxicol. Environ. Health A 70, 408-428.
Conolly,R.B. (2001). Biologically motivated quantitative models and the mixture toxicity problem. Toxicol. Sci. 63, 1-2.

Optimization of the cumulative risk assessment of pesticides and biocides using computational techniques: Pilot project 141
Contrera,J.F., Matthews,E.J., Kruhlak,N.L., and Benz,R.D. (2005). In silico screening of chemicals for bacterial mutagenicity using electrotopological E-state indices and MDL QSAR software. Regul. Toxicol. Pharmacol. 43, 313-323.
Coscolla,C., Yusa,V., Beser,M.I., and Pastor,A. (2009). Multi-residue analysis of 30 currently used pesticides in fine airborne particulate matter (PM 2.5) by microwave-assisted extraction and liquid chromatography-tandem mass spectrometry. J. Chromatogr. A 1216, 8817-8827.
Crowell,S.R., Henderson,W.M., Fisher,J.W., and Kenneke,J.F. (2010). Gender and species differences in triadimefon metabolism by rodent hepatic microsomes. Toxicol. Lett. 193, 101-107.
Crowell,S.R., Henderson,W.M., Kenneke,J.F., and Fisher,J.W. (2011). Development and application of a physiologically based pharmacokinetic model for triadimefon and its metabolite triadimenol in rats and humans. Toxicol Lett. 205, 154-162.
Daniell,N., Olds,T., and Tomkinson,G. (2012). Technical note: Criterion validity of whole body surface area equations: a comparison using 3D laser scanning. Am. J. Phys. Anthropol. 148, 148-155.
Davies,B. and Morris,T. (1993). Physiological parameters in laboratory animals and humans. Pharm. Res. 10, 1093-1095.
De Buck,S.S., Sinha,V.K., Fenu,L.A., Gilissen,R.A., Mackie,C.E., and Nijsen,M.J. (2007). The prediction of drug metabolism, tissue distribution, and bioavailability of 50 structurally diverse compounds in rat using mechanism-based absorption, distribution, and metabolism prediction tools. Drug Metab Dispos. 35, 649-659.
Dennison,J.E., Andersen,M.E., Dobrev,I.D., Mumtaz,M.M., and Yang,R.S.H. (2004). PBPK modeling of complex hydrocarbon mixtures: gasoline. Environ. Toxicol. Pharmacol. 16, 107-119.
Dourson,M.L., Gadagbui,B., Griffin,S., Garabrant,D.H., Haws,L.C., Kirman,C., and Tohyama,C. (2013). The importance of problem formulations in risk assessment: a case study involving dioxin-contaminated soil. Regul. Toxicol. Pharmacol. 66, 208-216.
Dreisig,K., Taxvig,C., Birkhoj,K.M., Nellemann,C., Hass,U., and Vinggaard,A.M. (2013). Predictive value of cell assays for developmental toxicity and embryotoxicity of conazole fungicides. ALTEX. 30, 319-330.
Dvorak,Z. (2011). Drug-drug interactions by azole antifungals: Beyond a dogma of CYP3A4 enzyme activity inhibition. Toxicol. Lett. 202, 129-132.
EFSA. EFSA scientific colloquium. 28-29 November 2006 - Parma, Italy. Summary report. Cumulative risk assessment of pesticides to human health: the way forward. 2007. Ref Type: Report
EFSA. Conclusion regarding the peer review of the pesticide risk assessment of the active substance tebuconazole. Issued on 25 September 2008. 176, 1-109. 2008. EFSA Scientific Report. Ref Type: Report
EFSA. Panel on Plant Protection Products and their Residues (PPR Panel). Scientific Opinion on risk assessment for a selected group of pesticides from the triazole group to test possible methodologies to assess cumulative effects from exposure throughout food from these pesticides on human health on request of EFSA. 7 (9), 1167. 10-9-2009. The EFSA Journal. Ref Type: Report
EFSA (2011). Conclusion on the peer review of the pesticide risk assessment of the active substance prochloraz. EFSA Journal 9, 2323.

142 Optimization of the cumulative risk assessment of pesticides and biocides using computational techniques: Pilot project
EFSA (2013). International Framework Dearling with Human Risk Assessmetn of Combined Exposure to Multiple Chemicals. EFSA Journal 11, 1-69.
EFSA Panel on Plant Protection Products and their Residues (PPR) (2013). Scientific Opinion on the identificaiton of pesticides to be included in cumulatevie assessmetn group on the basis of theri toxicological profile. EFSA Journal 11, 1-131.
El-Masri,H.A., Mumtaz,M.M., and Yushak,M.L. (2004). Application of physiologically-based pharmacokinetic modeling to investigate the toxicological interaction between chlorpyrifos and parathion in the rat. Environ. Toxicol. Pharmacol. 16, 57-71.
European Commission (2007a): Draft Assessment Report (DAR) public version, Tebuconazole. Vol. 1, Level 1-4, 27. European Commission, EU Review Programme.
European Commission (2007b): Draft Assessment Report (DAR) public version, Tebuconazole, Annex B.6: Toxicology and metabolism. Volume 3, part 2/A, B.6, 1-224. European Commission, EU Review Programme.
Fagerholm,U. (2007). Prediction of human pharmacokinetics--evaluation of methods for prediction of volume of distribution. J. Pharm. Pharmacol. 59, 1181-1190.
FAO. Tebuconazole (188). 1055-1095. 1994. Ref Type: Report
Fenneteau,F., Poulin,P., and Nekka,F. (2010). Physiologically based predictions of the impact of inhibition of intestinal and hepatic metabolism on human pharmacokinetics of CYP3A substrates. J. Pharm. Sci. 99, 486-514.
Fisher,J., Lumpkin,M., Boyd,J., Mahle,D., Bruckner,J.V., and El-Masri,H.A. (2004). PBPK modeling of the metabolic interactions of carbon tetrachloride and tetrachloroethylene in B6C3F1 mice. Environ. Toxicol. Pharmacol. 16, 93-105.
Forsyth,R.P. (1970). Hypothalamic control of the distribution of cardiac output in the unanesthetized rhesus monkey. Circ. Res. 26, 783-794.
Gargas,M.L., Kirman,C.R., Sweeney,L.M., and Tardiff,R.G. (2009). Acrylamide: Consideration of species differences and nonlinear processes in estimating risk and safety for human ingestion. Food Chem. Toxicol. 47, 760-768.
Garrod,A.N.I. and et al. (2000). Potential exposure of amateurs (consumers) through painting wood preservatives and antifoulant preaparations. Annals of Occupational Hygiene 44, 421-426.
Garrod,A.N.I., Martinez,M., Peason,J., Proud,A., and Rimmer,D.A. (1999). Exposure to preservative used in the industial pre-treatment of timber. Annals of Occupational Hygiene 43, 543-555.
Giordano,A., Fernandez-Franzon,M., Ruiz,M.J., Font,G., and Pico,Y. (2009). Pesticide residue determination in surface waters by stir bar sorptive extraction and liquid chromatography/tandem mass spectrometry. Anal. Bioanal. Chem. 393, 1733-1743.
Gleeson,M.P., Waters,N.J., Paine,S.W., and Davis,A.M. (2006). In silico human and rat Vss quantitative structure-activity relationship models. J. Med. Chem. 49, 1953-1963.
Godin,S.J., DeVito,M.J., Hughes,M.F., Ross,D.G., Scollon,E.J., Starr,J.M., Setzer,R.W., Conolly,R.B., and Tornero-Velez,R. (2010). Physiologically based pharmacokinetic modeling of deltamethrin: development of a rat and human diffusion-limited model. Toxicol Sci. 115, 330-343.
Gubbins,P.O. (2011). Triazole antifungal agents drug-drug interactions involving hepatic cytochrome P450. Expert. Opin. Drug Metab Toxicol. 7, 1411-1429.
Optimization of the cumulative risk assessment of pesticides and biocides using computational techniques: Pilot project 143
Haddad,S., Charest-Tardif,G., and Krishnan,K. (2000). Physiologically based modeling of the maximal effect of metabolic interactions on the kinetics of components of complex chemical mixtures. J. Toxicol. Environ. Health A 61, 209-223.
Hadrup,N., Taxvig,C., Pedersen,M., Nellemann,C., Hass,U., and Vinggaard,A.M. (2013). Concentration addition, independent action and generalized concentration addition models for mixture effect prediction of sex hormone synthesis in vitro. PLoS. One. 8, e70490.
Hamelin,G., Charest-Tardif,G., Krishnan,K., Cyr,D., Charbonneau,M., Devine,P.J., Haddad,S., Cooke,G.M., Schrader,T., and Tardif,R. (2009). Toxicokinetics of p-tert-octylphenol in male and female Sprague-Dawley rats after intravenous, oral, or subcutaneous exposures. J. Toxicol. Environ. Health A 72, 541-550.
Hamelin,G., Haddad,S., Krishnan,K., and Tardif,R. (2010). Physiologically based modeling of p-tert-octylphenol kinetics following intravenous, oral or subcutaneous exposure in male and female Sprague-Dawley rats. J. Appl. Toxicol. 30, 437-449.
Hasegawa,K. and Funatsu,K. (2010). Advanced PLS Techniques in Chemoinformatics Studies. Curr. Comput. Aided Drug Des.
Hass, U. and et al. Developmental toxicity effects in experimental animals after mixed exposure to endocrine disrupting pesticides. No. 141 2012, 1-163. 2012. Danish Ministry of the Environment. Environmental Protection Agency. Pesticides Research. Ref Type: Report
Igari,Y., Sugiyama,Y., Sawada,Y., Iga,T., and Hanano,M. (1983). Prediction of diazepam disposition in the rat and man by a physiologically based pharmacokinetic model. J. Pharmacokinet. Biopharm. 11, 577-593.
Isoherranen,N., Kunze,K.L., Allen,K.E., Nelson,W.L., and Thummel,K.E. (2004). Role of itraconazole metabolites in CYP3A4 inhibition. Drug Metab Dispos. 32, 1121-1131.
Jensen, B. H., christensen, H. B., Andersen, J. H., Petersen, A., Hilbert, G., Grossmann, A., and Madsen, H. L. Pesticidrester i fødevarer 2010, Resultater fra den danske pesticidkontrol. 2011002, 1-71. 2011. Ministeriet for Fødervarer, Landbrug og Fiskerri, Fødevarestyrelsen. Ref Type: Report
Jensen, B. H., Petersen, A., Andersen, J. H., Hilbert, G., Grossmann, A., and Holm, M. Pesticidrester i fødervarer 2011, Resultater fra den danske pesticidkontrol. 2012002, 1-66. 2012. Ministeriet for Fødevarer, Landbrug og Fiskeri, Fødevarestyrelsen. Ref Type: Report
Jensen, B. H., Petersen, A., christensen, H. B., Andersen, J. H., Herrmann, S. S., Erecius, M., Hilbert, G., Grossmann, A., and Holm, M. Pesticidrester i fødervarer 2009, Resultater fra den danske pesticidkontrol. 1-65. 2010. Ministeriet for Fødevarer, Landbrug og Fiskeri, Fødevarestyrelsen. Ref Type: Report
JMPR. 495. T, 2,4,5- (Pesticide residues in food: 1979 evaluations. 1979. WHO, Geneva. PrFont34Bin0BinSub0Frac0Def1Margin0Margin0Jc1Indent1440Lim0Lim1495. T, 2,4,5- (Pesticide residues in food: 1979 evaluations) . Ref Type: Report
JMPR. Pesticide residues in food: 1996 evaluations Part II Toxicological, 2,4-DICHLOROPHENOXYACETIC ACID (2,4-D). 1996. WHO, Geneva. Ref Type: Report

144 Optimization of the cumulative risk assessment of pesticides and biocides using computational techniques: Pilot project
JMPR. Pesticide residues in food 2001, Toxicological evaluations PROCHLORAZ. 2001. WHO, Geneva. Ref Type: Report
JMPR. Pesticide residues in food - 2010. Evaluations. Part II - Toxicological. Joint FAO / WHO Meeting on Pesticide Residues. Rome 21 - 30 September 2010. 2010. WHO, Geneva. Ref Type: Report
Jonsdottir,S.O., Ringsted,T., Nikolov,N.G., Dybdahl,M., Wedebye,E.B., and Niemela,J.R. (2012). Identification of cytochrome P450 2D6 and 2C9 substrates and inhibitors by QSAR analysis. Bioorg. Med. Chem. 20, 2042-2053.
Jonsson,F. and Johanson,G. (2002). Physiologically based modeling of the inhalation kinetics of styrene in humans using a bayesian population approach. Toxicol. Appl. Pharmacol. 179, 35-49.
Judson,R.S., Kavlock,R.J., Setzer,R.W., Hubal,E.A., Martin,M.T., Knudsen,T.B., Houck,K.A., Thomas,R.S., Wetmore,B.A., and Dix,D.J. (2011). Estimating toxicity-related biological pathway altering doses for high-throughput chemical risk assessment. Chem. Res. Toxicol. 24, 451-462.
Kedderis,G.L., Carfagna,M.A., Held,S.D., Batra,R., Murphy,J.E., and Gargas,M.L. (1993). Kinetic analysis of furan biotransformation by F-344 rats in vivo and in vitro. Toxicol. Appl. Pharmacol. 123, 274-282.
Kedderis,G.L. and Held,S.D. (1996). Prediction of furan pharmacokinetics from hepatocyte studies: comparison of bioactivation and hepatic dosimetry in rats, mice, and humans. Toxicol. Appl. Pharmacol. 140, 124-130.
Kim,D., Andersen,M.E., Pleil,J.D., Nylander-French,L.A., and Prah,J.D. (2007). Refined PBPK model of aggregate exposure to methyl tertiary-butyl ether. Toxicol. Lett. 169, 222-235.
Kim,K.B., Anand,S.S., Kim,H.J., White,C.A., and Bruckner,J.V. (2008). Toxicokinetics and tissue distribution of deltamethrin in adult Sprague-Dawley rats. Toxicol. Sci. 101, 197-205.
Kirman,C.R., Albertini,R.J., Sweeney,L.M., and Gargas,M.L. (2010). 1,3-Butadiene: I. Review of metabolism and the implications to human health risk assessment. Crit Rev. Toxicol. 40 Suppl 1, 1-11.
Kjaerstad, M. B., Andersen, H. R., Taxvig, C., Hass, U., Alexstad, M., Metzdorff, S. B., and Vinggaard, A. M. Effects of azole fungicides on the function of sex and thyroid hormones. 111, 1-74. 2007. Danish Ministry of the Environment. Environmental Protection Agency. Pesticides Research. Ref Type: Report
Kjaerstad,M.B., Taxvig,C., Nellemann,C., Vinggaard,A.M., and Andersen,H.R. (2010). Endocrine disrupting effects in vitro of conazole antifungals used as pesticides and pharmaceuticals. Reprod. Toxicol. 30, 573-582.
Klaassen,C.D. (1996). Casarett and Doull's Toxicology. The Basic Science of Poisons. McGraw-Hill Inc.).
Kochansky,C.J., McMasters,D.R., Lu,P., Koeplinger,K.A., Kerr,H.H., Shou,M., and Korzekwa,K.R. (2008). Impact of pH on plasma protein binding in equilibrium dialysis. Mol. Pharm. 5, 438-448.
Kojima,H., Sata,F., Takeuchi,S., Sueyoshi,T., and Nagai,T. (2011). Comparative study of human and mouse pregnane X receptor agonistic activity in 200 pesticides using in vitro reporter gene assays. Toxicology 280, 77-87.
Kojima,H., Takeuchi,S., and Nagai,T. (2010). Endocrine-disrupting Potential of Pesticides via Nuclear Receptors and Aryl Hydrocarbon Receptor. J. Health Sci. 56, 374-386.

Optimization of the cumulative risk assessment of pesticides and biocides using computational techniques: Pilot project 145
Kongsbak,K., Vinggaard,A.M., Hadrup,N., and Audouze,K. (2013). A computational approach to mechanistic and predictive toxicology of pesticides. ALTEX.
Kortenkamp, A., Evans, R., Faust, M., Kalberlah, F., Scholtze, M., and Schuhmacher-Wolz, U. Investigation of the state of the science on combined action of chemicals in food through dissimilar modes of action and proposal for science-based apprach for performing related cumulative assessment. 1-133. 2012. EFSA. Supporting Publication 2012: EN-232. Ref Type: Report
Krishnan,K., Haddad,S., Béliveau,M., and Tardif,R. (2002). Physiological modeling and extrapolation of pharmacokinetic interactions from binary to more complex chemical mixtures. Environ. Health Perspect. 110, 989-994.
Krishnan,K., Andersen,M.E., Clewell III,H.J., and Yang,R.S.H. (1994). Physiologically based pharmacokinetic modeling of chemical mixtures. In Toxicology of Chemical Mixtures, R.S.H.Yang, ed. (New York: Academic Press), pp. 399-437.
Laignelet,L., Narbonne,J.F., Lhuguenot,J.C., and Riviere,J.L. (1989). Induction and inhibition of rat liver cytochrome(s) P-450 by an imidazole fungicide (prochloraz). Toxicology 59, 271-284.
Laignelet,L., Riviere,J.L., and Lhuguenot,J.C. (1992). Metabolism of an imidazole fungicide (prochloraz) in the rat after oral administration. Food Chem. Toxicol. 30, 575-583.
Lee,S.K., Ou,Y.C., and Yang,R.S. (2002). Comparison of pharmacokinetic interactions and physiologically based pharmacokinetic modeling of PCB 153 and PCB 126 in nonpregnant mice, lactating mice, and suckling pups. Toxicol. Sci. 65, 26-34.
Lombardo,F., Obach,R.S., Shalaeva,M.Y., and Gao,F. (2004). Prediction of human volume of distribution values for neutral and basic drugs. 2. Extended data set and leave-class-out statistics. J. Med. Chem. 47, 1242-1250.
Lombardo,F., Obach,R.S., Shalaeva,M.Y., and Gao,F. (2002). Prediction of volume of distribution values in humans for neutral and basic drugs using physicochemical measurements and plasma protein binding data. J. Med. Chem. 45, 2867-2876.
Long,M., Laier,P., Vinggaard,A.M., Andersen,H.R., Lynggaard,J., and Bonefeld-Jorgensen,E.C. (2003). Effects of currently used pesticides in the AhR-CALUX assay: comparison between the human TV101L and the rat H4IIE cell line. Toxicology 194, 77-93.
Lowe,E.R., Poet,T.S., Rick,D.L., Marty,M.S., Mattsson,J.L., Timchalk,C., and Bartels,M.J. (2009). The effect of plasma lipids on the pharmacokinetics of chlorpyrifos and the impact on interpretation of blood biomonitoring data. Toxicol. Sci. 108, 258-272.
Ma,Q. (2001). Induction of CYP1A1. The AhR/DRE paradigm: transcription, receptor regulation, and expanding biological roles. Curr. Drug Metab 2, 149-164.
Martignoni,M., Groothuis,G.M., and de,K.R. (2006). Species differences between mouse, rat, dog, monkey and human CYP-mediated drug metabolism, inhibition and induction. Expert. Opin. Drug Metab Toxicol. 2, 875-894.
McMullin,T.S., Brzezicki,J.M., Cranmer,B.K., Tessari,J.D., and Andersen,M.E. (2003). Pharmacokinetic modeling of disposition and time-course studies with [14C]atrazine. J. Toxicol. Environ Health A 66, 941-964.
Meek,M.E., Barton,H.A., Bessems,J.G., Lipscomb,J.C., and Krishnan,K. (2013). Case study illustrating the WHO IPCS guidance on characterization and application of physiologically based pharmacokinetic models in risk assessment. Regul. Toxicol. Pharmacol. 66, 116-129.

146 Optimization of the cumulative risk assessment of pesticides and biocides using computational techniques: Pilot project
Miljøministeriet (2012): Sundhedsmæssig vurdering af Mystic 250 EC (Tebuconazol), bilag 2.b., sagens oplysninger og Miljøstyrelsen vurdering. H. Nr MST-661-04782. 6-11-2012. Miljøministeriet, Miljøstyrelsen.
Millburn,P., Smith,R.L., and Williams,R.T. (1967). Biliary Excretion of Foreign Compounds. Biochem. J. 105, 1275-1281.
Mirfazaelian,A., Kim,K.B., Anand,S.S., Kim,H.J., Tornero-Velez,R., Bruckner,J.V., and Fisher,J.W. (2006). Development of a physiologically based pharmacokinetic model for deltamethrin in the adult male Sprague-Dawley rat. Toxicol. Sci. 93, 432-442.
Moda,T.L., Torres,L.G., Carrara,A.E., and Andricopulo,A.D. (2008). PK/DB: database for pharmacokinetic properties and predictive in silico ADME models. Bioinformatics. 24, 2270-2271.
Muller,A.K., Bosgra,S., Boon,P.E., van,d., V, Nielsen,E., and Ladefoged,O. (2009). Probabilistic cumulative risk assessment of anti-androgenic pesticides in food. Food Chem. Toxicol. 47, 2951-2962.
Needham,D. and Challis,I.R. (1991). The metabolism and excretion of prochloraz, an imidazole-based fungicide, in the rat. Xenobiotica 21, 1473-1482.
Needham,D., Creedy,C.L., and Dawson,J.R. (1992). The profile of rat liver enzyme induction produced by prochloraz and its major metabolites. Xenobiotica 22, 283-291.
Nielsen, E., Nørhede, P., Boberg, J., Isling, L. K., Kroghsbo, S., Hadrup, N., Bredsdorff, L., Mortensen, A., and Larsen, J. C. Identification of Cumulative Assessment Groups of Pesticides. External scientific report submitted to EFSA. Question No Q-2009-01092. 2012. Ref Type: Report
Niwa,T., Murayama,N., Emoto,C., and Yamazaki,H. (2008b). Comparison of kinetic parameters for drug oxidation rates and substrate inhibition potential mediated by cytochrome P450 3A4 and 3A5. Curr. Drug Metab 9, 20-33.
Niwa,T., Murayama,N., Emoto,C., and Yamazaki,H. (2008a). Comparison of kinetic parameters for drug oxidation rates and substrate inhibition potential mediated by cytochrome P450 3A4 and 3A5. Curr. Drug Metab 9, 20-33.
Nong,A., Tan,Y.M., Krolski,M.E., Wang,J., Lunchick,C., Conolly,R.B., and Clewell,H.J., III (2008). Bayesian calibration of a physiologically based pharmacokinetic/pharmacodynamic model of carbaryl cholinesterase inhibition. J. Toxicol. Environ Health A 71, 1363-1381.
Obach,R.S., Lombardo,F., and Waters,N.J. (2008). Trend analysis of a database of intravenous pharmacokinetic parameters in humans for 670 drug compounds. Drug Metab Dispos. 36, 1385-1405.
Pelekis,M. and Emond,C. (2009). Physiological modeling and derivation of the rat to human toxicokinetic uncertainty factor for the carbamate pesticide aldicarb. Environ. Toxicol. Pharmacol. 28, 179-191.
Petersen, A., Jensen, B. H., Andersen, J. H., Poulsen, M. E., Christiansen, T., and Nielsen, E. Pesticide Residues, Results from the period 2004-2011. 1-113. 2013. National Food Institute, Technical University of Denmark. Ref Type: Report
Peyret,T. and Krishnan,K. (2011). QSARs for PBPK modelling of environmental contaminants. SAR QSAR. Environ. Res. 22, 129-169.

Optimization of the cumulative risk assessment of pesticides and biocides using computational techniques: Pilot project 147
Peyret,T., Poulin,P., and Krishnan,K. (2010). A unified algorithm for predicting partition coefficients for PBPK modeling of drugs and environmental chemicals. Toxicol. Appl. Pharmacol. 249, 197-207.
Pohl, H., Hansen, H., Wilbur, S., Odin, M., Ingerman, L., Bosch, S., McClure, P, and Coleman, J. (2001): ATSDR. Guidance for the preparation of an interaction profile. U.S. Department of Health and Human Services. Public Health Service. Agency for Toxic Substances and Disease Registry. Division of Toxicology.
Poet,T.S., Corley,R.A., Thrall,K.D., Edwards,J.A., Tanojo,H., Weitz,K.K., Hui,X., Maibach,H.I., and Wester,R.C. (2000). Assessment of the percutaneous absorption of trichloroethylene in rats and humans using MS/MS real-time breath analysis and physiologically based pharmacokinetic modeling. Toxicol. Sci. 56, 61-72.
Poet,T.S., Kousba,A.A., Dennison,S.L., and Timchalk,C. (2004). Physiologically based pharmacokinetic/pharmacodynamic model for the organophosphorus pesticide diazinon. Neurotoxicology 25, 1013-1030.
Poulin,P. and Haddad,S. (2012). Advancing prediction of tissue distribution and volume of distribution of highly lipophilic compounds from a simplified tissue-composition-based model as a mechanistic animal alternative method. J. Pharm. Sci. 101, 2250-2261.
Poulin,P. and Krishnan,K. (2001). Molecular structure-based prediction of human abdominal skin permeability coefficients for several organic compounds. J. Toxicol. Environ. Health A 62, 143-159.
Poulin,P. and Krishnan,K. (1996). A mechanistic algorithm for predicting blood:air partition coefficients of organic chemicals with the consideration of reversible binding in hemoglobin. Toxicol. Appl. Pharmacol. 136, 131-137.
Poulin,P. and Theil,F.P. (2002). Prediction of pharmacokinetics prior to in vivo studies. 1. Mechanism-based prediction of volume of distribution. J. Pharm. Sci. 91, 129-156.
Price,K. and Krishnan,K. (2011). An integrated QSAR-PBPK modelling approach for predicting the inhalation toxicokinetics of mixtures of volatile organic chemicals in the rat. SAR QSAR. Environ. Res. 22, 107-128.
Proctor,N.J., Tucker,G.T., and Rostami-Hodjegan,A. (2004). Predicting drug clearance from recombinantly expressed CYPs: intersystem extrapolation factors. Xenobiotica 34, 151-178.
Reading,B.D. and Freeman,B. (2005). Simple formula for the surface area of the body and a simple model for anthropometry. Clin. Anat. 18, 126-130.
Reddy,M.B., Andersen,M.E., Morrow,P.E., Dobrev,I.D., Varaprath,S., Plotzke,K.P., and Utell,M.J. (2003). Physiological modeling of inhalation kinetics of octamethylcyclotetrasiloxane in humans during rest and exercise. Toxicol. Sci. 72, 3-18.
Reffstrup, T. K. Evaluation of methodologies for risk assessment of combined toxic actions of chemical subtances and establishment of PBTK/TD models for pesticides, PhD Thesis. 2012. DTU Food, National Food Institute. Ref Type: Report
Reffstrup,T.K., Larsen,J.C., and Meyer,O. (2010). Risk assessment of mixtures of pesticides. Current approaches and future strategies. Regul. Toxicol. Pharmacol. 56, 174-192.
Renwick,A.G. (2001). Toxicokinetics: pharmacokinetics in toxicology. In Principles and methods of toxicology, A.W.Hayes, ed. (Philadelphia: Taylor & Francis), pp. 137-191.

148 Optimization of the cumulative risk assessment of pesticides and biocides using computational techniques: Pilot project
Rietjens,I.M., Boersma,M.G., Zaleska,M., and Punt,A. (2008). Differences in simulated liver concentrations of toxic coumarin metabolites in rats and different human populations evaluated through physiologically based biokinetic (PBBK) modeling. Toxicol. In Vitro 22, 1890-1901.
Rietjens,I.M., Louisse,J., and Punt,A. (2011). Tutorial on physiologically based kinetic modeling in molecular nutrition and food research. Mol. Nutr. Food Res. 55, 941-956.
Ringsted,T., Nikolov,N., Jensen,G.E., Wedebye,E.B., and Niemela,J. (2009). QSAR models for P450 (2D6) substrate activity. SAR QSAR. Environ. Res. 20, 309-325.
Rodgers,T., Leahy,D., and Rowland,M. (2005). Physiologically based pharmacokinetic modeling 1: predicting the tissue distribution of moderate-to-strong bases. J. Pharm. Sci. 94, 1259-1276.
Rodgers,T. and Rowland,M. (2006). Physiologically based pharmacokinetic modelling 2: predicting the tissue distribution of acids, very weak bases, neutrals and zwitterions. J. Pharm. Sci. 95, 1238-1257.
Roffey,S.J., Cole,S., Comby,P., Gibson,D., Jezequel,S.G., Nedderman,A.N., Smith,D.A., Walker,D.K., and Wood,N. (2003). The disposition of voriconazole in mouse, rat, rabbit, guinea pig, dog, and human. Drug Metab Dispos. 31, 731-741.
Rudzok,S., Schmucking,E., Graebsch,C., Herbarth,O., and Bauer,M. (2009). The inducibility of human cytochrome P450 1A by environmental-relevant xenobiotics in the human hepatoma derived cell line HepG2. Environ. Toxicol. Pharmacol. 28, 370-378.
Shen,Z., Zhu,W., Liu,D., Xu,X., Zhang,P., and Zhou,Z. (2012). Stereoselective degradation of tebuconazole in rat liver microsomes. Chirality 24, 67-71.
Stanton,D.T. (2012). QSAR and QSPR model interpretation using partial least squares (PLS) analysis. Curr. Comput. Aided Drug Des 8, 107-127.
Sweeney,L.M., Gut,C.P., Jr., Gargas,M.L., Reddy,G., Williams,L.R., and Johnson,M.S. (2012). Assessing the non-cancer risk for RDX (hexahydro-1,3,5-trinitro-1,3,5-triazine) using physiologically based pharmacokinetic (PBPK) modeling. Regul. Toxicol. Pharmacol. 62, 107-114.
Sweeney,L.M., Himmelstein,M.W., and Gargas,M.L. (2001). Development of a preliminary physiologically based toxicokinetic (PBTK) model for 1,3-butadiene risk assessment. Chem. Biol. Interact. 135-136, 303-322.
Sweeney,L.M., Kirman,C.R., Albertini,R.J., Tan,Y.M., Clewell,H.J., Filser,J.G., Csanady,G., Pottenger,L.H., Banton,M.I., Graham,C.J., Andrews,L.S., Papciak,R.J., and Gargas,M.L. (2009). Derivation of inhalation toxicity reference values for propylene oxide using mode of action analysis: example of a threshold carcinogen. Crit Rev. Toxicol. 39, 462-486.
Sweeney,L.M., Kirman,C.R., Gargas,M.L., Carson,M.L., and Tardiff,R.G. (2010). Development of a physiologically-based toxicokinetic model of acrylamide and glycidamide in rats and humans. Food Chem. Toxicol. 48, 668-685.
Takeuchi,S., Iida,M., Yabushita,H., Matsuda,T., and Kojima,H. (2008). In vitro screening for aryl hydrocarbon receptor agonistic activity in 200 pesticides using a highly sensitive reporter cell line, DR-EcoScreen cells, and in vivo mouse liver cytochrome P450-1A induction by propanil, diuron and linuron. Chemosphere 74, 155-165.
Tang,J., Amin,U.K., Hodgson,E., and Rose,R.L. (2004). In vitro metabolism of fipronil by human and rat cytochrome P450 and its interactions with testosterone and diazepam. Chem. Biol. Interact. 147, 319-329.

Optimization of the cumulative risk assessment of pesticides and biocides using computational techniques: Pilot project 149
Taxvig,C., Hass,U., Axelstad,M., Dalgaard,M., Boberg,J., Andeasen,H.R., and Vinggaard,A.M. (2007). Endocrine-disrupting activities in vivo of the fungicides tebuconazole and epoxiconazole. Toxicol. Sci. 100, 464-473.
Thompson,C.M., Johns,D.O., Sonawane,B., Barton,H.A., Hattis,D., Tardif,R., and Krishnan,K. (2009). Database for physiologically based pharmacokinetic (PBPK) modeling: physiological data for healthy and health-impaired elderly. J. Toxicol Environ. Health B Crit Rev. 12, 1-24.
Timchalk,C., Nolan,R.J., Mendrala,A.L., Dittenber,D.A., Brzak,K.A., and Mattsson,J.L. (2002). A Physiologically based pharmacokinetic and pharmacodynamic (PBPK/PD) model for the organophosphate insecticide chlorpyrifos in rats and humans. Toxicol. Sci. 66, 34-53.
Timchalk,C. and Poet,T.S. (2008). Development of a physiologically based pharmacokinetic and pharmacodynamic model to determine dosimetry and cholinesterase inhibition for a binary mixture of chlorpyrifos and diazinon in the rat. Neurotoxicology 29, 428-443.
Tornero-Velez,R., Davis,J., Scollon,E.J., Starr,J.M., Setzer,R.W., Goldsmith,M.R., Chang,D.T., Xue,J., Zartarian,V., DeVito,M.J., and Hughes,M.F. (2012). A pharmacokinetic model of cis- and trans-permethrin disposition in rats and humans with aggregate exposure application. Toxicol. Sci. 130, 33-47.
Tozer,T.N., Rowland,M., and . (2006). Introduction to Pharmacokinetics and Pharmacodynamics. (Philadelphia: Lippincott Williams & Wilkins).
U.S.EPA. Reference physiological parameters in pharmacokinetic modeling. Arms, A. D. and Travis, C. C. EPA/600/S6-88-004. 1988. Ref Type: Report
U.S.EPA. Approaches for the Application of Physiologically Based Pharmacokinetic (PBPK) Models and Supporting Data in Risk Assessment. Barton, Hugh, Chiu, Weihsueh, DeWoskin, Robert, Foureman, Gary, Krishnan, Kannan, Lipscomb, John, Schlosser, Paul, Sonawane, Babasaheb, and Thompson, Chadwick. EPA/600/R-05/043F. 2006. National Center for Environmental Assessment. Office of Research and Development. U.S. Environmental Protection Agency, Washington, DC. Ref Type: Report
U.S.EPA. Physiological Infomation Database (PID). 2009. http://cfpub.epa.gov/ncea/risk/recordisplay.cfm?deid=202847. Ref Type: Data File
U.S.EPA. Exposure related dose estimating model (ERDEM). A Physiologically-Based Pharmacokinetic and Pharmacodynamic (PBPK/PD) model for assessing human exposure and risk. Blancato, J. N., Power, F. W., Brown, R. N., and Dary, C. C. EPA/600/R-06/061, 1-151. 2012. U.S.EPA. Research and Development. Ref Type: Report
van den Berg,S.J., Punt,A., Soffers,A.E., Vervoort,J., Ngeleja,S., Spenkelink,B., and Rietjens,I.M. (2012). Physiologically based kinetic models for the alkenylbenzene elemicin in rat and human and possible implications for risk assessment. Chem. Res. Toxicol. 25, 2352-2367.
Wan,H. and Rehngren,M. (2006). High-throughput screening of protein binding by equilibrium dialysis combined with liquid chromatography and mass spectrometry. J. Chromatogr. A 1102, 125-134.
Weijs,L., Yang,R.S., Das,K., Covaci,A., and Blust,R. (2013). Application of Bayesian population physiologically based pharmacokinetic (PBPK) modeling and Markov chain Monte Carlo simulations to pesticide kinetics studies in protected marine mammals: DDT, DDE, and DDD in harbor porpoises. Environ. Sci. Technol. 47, 4365-4374.

150 Optimization of the cumulative risk assessment of pesticides and biocides using computational techniques: Pilot project
Wetmore,B.A., Wambaugh,J.F., Ferguson,S.S., Sochaski,M.A., Rotroff,D.M., Freeman,K., Clewell,H.J., III, Dix,D.J., Andersen,M.E., Houck,K.A., Allen,B., Judson,R.S., Singh,R., Kavlock,R.J., Richard,A.M., and Thomas,R.S. (2012). Integration of dosimetry, exposure, and high-throughput screening data in chemical toxicity assessment. Toxicol. Sci. 125, 157-174.
WHO (2010a): Characterization and Application of Physiologically Based Pharmacokinetic Models in Risk Assessment. World Health Organization and IOMC (Inter-Organization Programme for the Sound Management of Chemicals). IPCS Harmonized Project Document No. 9. Ref Type: Report
WHO (2010b): Characterization and Application of Physiologically Based Pharmacokinetic Models in Risk Assessment. World Health Organization and IOMC (Inter-Organization Programme for the Sound Management of Chemicals). IPCS Harmonized Project Document No. 9.
WHO (2010c): Characterization and Application of Physiologically Based Pharmacokinetic Models in Risk Assessment. World Health Organization and IOMC (Inter-Organization Programme for the Sound Management of Chemicals). IPCS Harmonized Project Document No. 9.
WHO (2010d): Characterization and Application of Physiologically Based Pharmacokinetic Models in Risk Assessment. World Health Organization and IOMC (Inter-Organization Programme for the Sound Management of Chemicals). IPCS Harmonized Project Document No. 9.
European Commission (2010e): Draft Assessement Report (DAR) public version: Prochloraz Resubmission, Annex B-6, Toxicology and metabolism. 138-162. European Commission, EU Review Program. Volume 3, B.1.-B.7.
Yamazaki,H., Inoue,K., Shaw,P.M., Checovich,W.J., Guengerich,F.P., and Shimada,T. (1997). Different contributions of cytochrome P450 2C19 and 3A4 in the oxidation of omeprazole by human liver microsomes: effects of contents of these two forms in individual human samples. J. Pharmacol. Exp. Ther. 283, 434-442.
Yang,X., Gandhi,Y.A., Duignan,D.B., and Morris,M.E. (2009). Prediction of Biliary Excretion in Rats and Humans Using Molecular Weight and Quantitative Structure-Pharmacokinetic Relationships. The AAPS Journal 11, 511-525.
Yoon,M., Schroeter,J.D., Nong,A., Taylor,M.D., Dorman,D.C., Andersen,M.E., and Clewell,H.J., III (2011). Physiologically based pharmacokinetic modeling of fetal and neonatal manganese exposure in humans: describing manganese homeostasis during development. Toxicol. Sci. 122, 297-316.
Zhang,X., Tsang,A.M., Okino,M.S., Power,F.W., Knaak,J.B., Harrison,L.S., and Dary,C.C. (2007). A physiologically based pharmacokinetic/pharmacodynamic model for carbofuran in Sprague-Dawley rats using the exposure-related dose estimating model. Toxicol. Sci. 100, 345-359.
Zhu,W., Qiu,J., Dang,Z., Lv,C., Jia,G., Li,L., and Zhou,Z. (2007). Stereoselective degradation kinetics of tebuconazole in rabbits. Chirality 19, 141-147.
Zvinavashe,E., van den,B.H., Soffers,A.E., Vervoort,J., Freidig,A., Murk,A.J., and Rietjens,I.M. (2008). QSAR models for predicting in vivo aquatic toxicity of chlorinated alkanes to fish. Chem. Res. Toxicol. 21, 739-745.
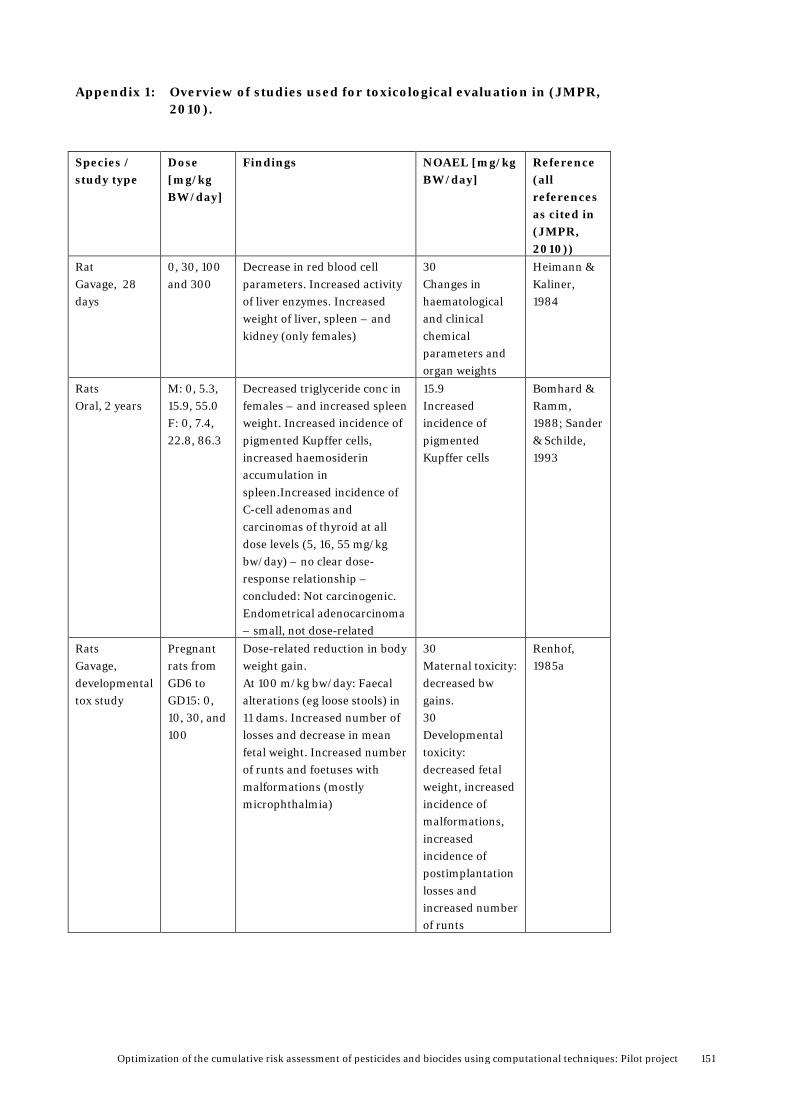
Optimization of the cumulative risk assessment of pesticides and biocides using computational techniques: Pilot project 151
Appendix 1: Overview of studies used for toxicological evaluation in (JMPR, 2010).
Species / study type
Dose [mg/kg BW/day]
Findings NOAEL [mg/kg BW/day]
Reference (all references as cited in (JMPR, 2010))
Rat Gavage, 28 days
0, 30, 100 and 300
Decrease in red blood cell parameters. Increased activity of liver enzymes. Increased weight of liver, spleen – and kidney (only females)
30 Changes in haematological and clinical chemical parameters and organ weights
Heimann & Kaliner, 1984
Rats Oral, 2 years
M: 0, 5.3, 15.9, 55.0 F: 0, 7.4, 22.8, 86.3
Decreased triglyceride conc in females – and increased spleen weight. Increased incidence of pigmented Kupffer cells, increased haemosiderin accumulation in spleen.Increased incidence of C-cell adenomas and carcinomas of thyroid at all dose levels (5, 16, 55 mg/kg bw/day) – no clear dose-response relationship – concluded: Not carcinogenic. Endometrical adenocarcinoma – small, not dose-related
15.9 Increased incidence of pigmented Kupffer cells
Bomhard & Ramm, 1988; Sander & Schilde, 1993
Rats Gavage, developmental tox study
Pregnant rats from GD6 to GD15: 0, 10, 30, and 100
Dose-related reduction in body weight gain. At 100 m/kg bw/day: Faecal alterations (eg loose stools) in 11 dams. Increased number of losses and decrease in mean fetal weight. Increased number of runts and foetuses with malformations (mostly microphthalmia)
30 Maternal toxicity: decreased bw gains. 30 Developmental toxicity: decreased fetal weight, increased incidence of malformations, increased incidence of postimplantation losses and increased number of runts
Renhof, 1985a

152 Optimization of the cumulative risk assessment of pesticides and biocides using computational techniques: Pilot project
Rats Dieary, two-generation study of reproductive toxicity
M: 0, 7.1, 21.6 and 72.3 F: 0, 9.1, 27.8 and 94.8
Reduced feed consumption, decreased body weights, decreased liver and kidney weights. Decreased pub body weights and decreased litter size. No reproductive toxicity seen.
21.6 Parental systemic toxicity and offspring toxicity
Eiben, 1987
Mice Oral, 21 months
M: 0, 5.9, 18 and 53 F: 0, 9.0 26 and 81
Increased liver weight at highest dose level Slight increase in prevalence of lipid-containing periportal vacuoles in liver. No evidence of carcinogenic potential.
5.9 Centrilobular fine vacuolization in the liver (lipids)
Bomhard & Ramm, 1988a
Mice, developmental tox study
0, 1,3, 10, 30, 100
Maternal toxicity: increased hepatic enzyme induction (increased cytochrome P450 content and N-demethylase activity), severity of vacuolization in liver cells. Developmental toxicity: marginal increase in postimplantation loss and statistically significant increase of common malformations
30 Maternal toxicity 10 embryo and fetal toxicity
Becker and Biedermann, 1995a
Dogs Oral, 1 year
M: 0, 2.96, 4.39 F: 0, 2.94, 4.45
Slight hypertrophy of adrenal zona fasciculate cells – accompanied by an increased incidence of large fatty vacuoles
2.94 Histopathological changes in the adrenals. 4.39 Cataract induction (no effects found in the study)
Porter et al, 1989, 1993
Rabbit, gavage, developmental tox study
0, 10, 30, 100
Maternal decreased body weight gain, decreased food consumption. Increased postimplantation loss and malformations, hydrocephalus and increased external and skeletal abnormalities at 100 mg/kg bw/day
30 Maternal, embryo and fetal toxicity According to DAR (2006): NOAEL for embryotoxic and teratogenic effects: 10 mg/kg bw/day and 30 mg/kg bw/day for maternal toxicity in the Becker and Biedermann-study
Two studies: Becker, Vogel and Terrier, 1988b; Becker and Biedermann, 1995c)

Optimization of the cumulative risk assessment of pesticides and biocides using computational techniques: Pilot project 153
Appendix 2: Detailed mathematical description of the tebuconazole model
Equations for liver concentration, metabolism and oral exposure The concentration of the mother compound in the liver (Cliver) is calculated by the following differential equation for change in the concentration over time [µmol/l/hr]. 𝑑𝐶𝑙𝑖𝑣𝑒𝑟(𝐶1𝑀0)
𝑑𝑡 =𝑄𝑙𝑖𝑣𝑒𝑟𝑉𝑙𝑖𝑣𝑒𝑟
� 𝐶𝐴(𝐶1𝑀0) −𝐶𝑙𝑖𝑣𝑒𝑟(𝐶1𝑀0)
𝑃𝑙𝑖𝑣𝑒𝑟(𝐶1𝑀0)� +
1𝑉𝑙𝑖𝑣𝑒𝑟
�–𝑑𝐴𝑀𝐿(𝐶1𝑀0)
𝑑𝑡 –𝑑𝐴𝑂𝐿(𝐶1𝑀0)
𝑑𝑡 + 𝐴′𝐷𝑖𝑒𝑡𝑒𝑥𝑝(𝐶1𝑀0)�
The concentration change is a function of the difference in the concentration of free (unbound) tebuconazole in arterial blood entering the liver (CA) and the concentration of free tebuconazole in the venous blood leaving the liver (CV,liver = Cliver/Pliver). Qliver is the blood flow through the liver in [l/hr], Vliver is the liver volume in [l] and Pliver is the liver:blood partition coefficient. All concentrations are calculated in [µmol/l] and the partition coefficient is unit less. The mother compound, tebuconazole in this case, is labelled C1M0. (The metabolites formed, are labelled C1M1.) CA is calculated by multiplying the total blood concentration with the fraction unbound (fu), which we have calculated from percent plasma binding (%PPB).
𝐶𝐴(𝐶1𝑀0) = 𝐶𝑏𝑙𝑜𝑜𝑑(𝐶1𝑀0) 𝑓𝑢(𝐶1𝑀0) = 𝐶𝑏𝑙𝑜𝑜𝑑(𝐶1𝑀0) (100− %𝑃𝑃𝐵𝐶1𝑀0)
100
The concentration in the liver depends also on the rate of metabolism (dAML/dt) and the amount of orally administered compound entering the liver via the portal vein over time. The metabolism in the liver is described by Michaelis-Menten kinetics. As we use Vmax and KM values obtained by in vitro measurement in rat liver microsomes, we need to use concentration of free tebuconazole in the venous blood leaving the liver (Cliver/Pliver) rather than the concentration of tebuconazole in the liver (Cliver) (Campbell, Jr. et al., 2012). In our model Vmax and KM have the units [µmol/hr] and [µmol/l], respectively.
𝑑𝐴𝑀𝐿(𝐶1𝑀0)
𝑑𝑡 =𝑉max(𝐶1𝑀0) 𝐶𝑙𝑖𝑣𝑒𝑟(𝐶1𝑀0) 𝑃𝑙𝑖𝑣𝑒𝑟(𝐶1𝑀0)⁄𝐾𝑀(𝐶1𝑀0) + 𝐶𝑙𝑖𝑣𝑒𝑟(𝐶1𝑀0) 𝑃𝑙𝑖𝑣𝑒𝑟(𝐶1𝑀0)⁄
Input to the liver from the gastro intestinal tract is either described by a bolus dose, when a dose is given at a specific time point or with a function describing dietary intake over period of time. In our model a bolus dose is sent directly to the liver by using a pulse function (AOL), where the absorption rate in modelled by a rate constant (ka) with the unit [hr-1]. AOL is the amount of compound left in the GIT. The following equation describes the decrease of AOL in GIT over time, after administration of oral dose. The corresponding rate of delivering tebuconazole to the liver is thus (- dAOL/dt).
𝑑𝐴𝑂𝐿(𝐶1𝑀0)
𝑑𝑡 = − 𝑘𝑎 𝐴𝑂𝐿(𝐶1𝑀0)
𝐴𝑂𝐿(𝐶1𝑀0) (𝑇𝐼𝑀𝐸 = 0) = 𝐴𝑂𝑟𝑎𝑙(𝐶1𝑀0) = 𝐹𝑎(𝐶1𝑀0) 𝐴𝑂𝑟𝑎𝑙𝑑𝑜𝑠𝑒(𝐶1𝑀0) 𝐵𝑊
𝑀𝑊𝐶1𝑀0
AOral is the total amount of compound entering the liver in [µmol], Fa is the fractional absorption of the compound, AOraldose is the orally administered dose in [mg/kg BW], BW is the body weight in [kg] and MW is the molecular weight in [mg/µmol]. The dietary exposure (A´Dietexp) is calculated with the following equation, where it is assumed that the daily exposure from the diet (AOraladm) is distributed equally throughout 12 hours (the A´kzero function), with 12 hour rest. AOraladm has the unit [mg/kg BW] and A´Dietexp and A´kzero [µmol/hr].

154 Optimization of the cumulative risk assessment of pesticides and biocides using computational techniques: Pilot project
𝐴𝐷𝑖𝑒𝑡𝑒𝑥𝑝(𝐶1𝑀0)′ = 𝐼𝐹 𝑀𝑂𝐷(𝑇𝐼𝑀𝐸, 24) ≤ 12 𝑇𝐻𝐸𝑁 𝐴𝑘𝑧𝑒𝑟𝑜(𝐶1𝑀0)
′ 𝐸𝐿𝑆𝐸 0
𝐴′𝑘𝑧𝑒𝑟𝑜(𝐶1𝑀0) = 𝐹𝑎(𝐶1𝑀0) 𝐴𝑂𝑟𝑎𝑙𝑎𝑑𝑚(𝐶1𝑀0) 𝐵𝑊
𝑀𝑊𝐶1𝑀0
112ℎ𝑟
Normally the time the dietary intake is assumed between 7 and 19 hours and when simulating aggregate exposure it is important to add exact time points of the exposure via each route. Thus the equation takes the following form.
𝐴𝐷𝑖𝑒𝑡𝑒𝑥𝑝(𝐶1𝑀0)′ = 𝐼𝐹 𝑀𝑂𝐷(𝑇𝐼𝑀𝐸, 24) ≥ 7 𝐴𝑁𝐷 𝑀𝑂𝐷(𝑇𝐼𝑀𝐸, 24) ≤ 19 𝑇𝐻𝐸𝑁 𝐴𝑘𝑧𝑒𝑟𝑜(𝐶1𝑀0)
′ 𝐸𝐿𝑆𝐸 0
Equations for skin concentration and dermal exposure The concentration of the compound in the skin (Cskin) is calculated as a function of the concentration of free compound entering the skin by arterial blood (CA) and the concentration of free compound in the venous blood leaving the skin (Cv,skin = Cskin/Pskin), as well as the amount of compound penetrating the skin by dermal exposure when relevant.
𝑑𝐶𝑠𝑘𝑖𝑛(𝐶1𝑀0)
𝑑𝑡 = 𝑄𝑠𝑘𝑖𝑛𝑉𝑠𝑘𝑖𝑛
� 𝐶𝐴(𝐶1𝑀0) − 𝐶𝑠𝑘𝑖𝑛(𝐶1𝑀0)
𝑃𝑠𝑘𝑖𝑛(𝐶1𝑀0)� +
1𝑉𝑠𝑘𝑖𝑛
𝑑𝐴𝐷𝑆(𝐶1𝑀0)
𝑑𝑡 𝑋𝑑𝑒𝑟𝑚𝑎𝑙−𝑜𝑛−𝑜𝑓𝑓
The equation is set up so that it can be used with and without dermal exposure, with Xdermal-on-off set to 1 and 0, respectively. The dermal exposure (ADS) is described by the following equation, where tdermalexptime is the time the rat or the human is exposed to tebuconzole, i.e. the time a product containing tebuconazole is estimated to be on the skin surface. This equation can be modified for specific exposure scenarios, in order to account for the time of the day the subject is exposed to the biocide product containing tebuconazole.
𝑑𝐴𝐷𝑆(𝐶1𝑀0)
𝑑𝑡 = 𝐼𝐹 𝑀𝑂𝐷(𝑇𝐼𝑀𝐸, 24) ≤ 𝑡𝑑𝑒𝑟𝑚𝑎𝑙𝑒𝑥𝑝𝑡𝑖𝑚𝑒 𝑇𝐻𝐸𝑁 𝑑𝐴𝐷𝑆𝑐𝑜𝑛𝑡(𝐶1𝑀0)
𝑑𝑡 𝐸𝐿𝑆𝐸 0
The dermal absorption is calculated by Fick’s law,
𝑑𝐴𝐷𝑆𝑐𝑜𝑛𝑡(𝐶1𝑀0)
𝑑𝑡 = 𝐾𝑝 𝑆𝐴 � 𝐶𝑠𝑢𝑟𝑓𝑎𝑐𝑒(𝐶1𝑀0) − 𝐶𝑠𝑘𝑖𝑛(𝐶1𝑀0)
𝑃𝑠𝑘𝑖𝑛:𝑠𝑢𝑟𝑓𝑎𝑐𝑒(𝐶1𝑀0)�
where Kp is the skin permeability rate constant in [dm/hr], SA is the exposed skin surface area in [dm2], Csurface is the concentration of compound in liquid mixture on the skin surface in [µmol/l] and Pskin:surface is the unitless skin:surface partition coefficient. According to the above equation, the exposure is calculated based on the concentration in the biocide liquid on the skin surface, the skin permeability and the skin:surface partition coefficient. The equation above simulates c0ntious absorption in a situation where a solution of a fixed concentration is present on the skin surface, assuming unlimited exposure within the simulation time. To simulate a situation where a solution of volume Vsurface(C1M0) and concentration Csurface,init(C1M0) is spilled on or administered to the skin surface, it is necessary to reduce the concentration of the compounds on the skin surface by removing the compound that has already been absorbed. As our PBTK model only considers the active compound, this is a practical mathematical way to administer the compound in the model. In reality, probably both the active compound and the solvent are absorbed through the skin, and some of the solvent can evaporate as well.

Optimization of the cumulative risk assessment of pesticides and biocides using computational techniques: Pilot project 155
𝐶𝑠𝑢𝑟𝑓𝑎𝑐𝑒(𝐶1𝑀0) = 𝐷𝑎𝑏𝑠(𝐶1𝑀𝑜) � 𝐶𝑠𝑢𝑟𝑓𝑎𝑐𝑒,𝑖𝑛𝑖𝑡(𝐶1𝑀0) 𝑉𝑠𝑢𝑟𝑓𝑎𝑐𝑒(𝐶1𝑀0) − 𝐴𝐷𝑆(𝐶1𝑀0)�
𝑉𝑠𝑢𝑟𝑓𝑎𝑐𝑒(𝐶1𝑀0)
The fractional dermal absorption (Dabs) was added to this equation. In our simulations, all the compound that was administered on the skin surface was absorbed, and no equilibrium between the surface concentration and the skin concentration was obtained. If a lower value of Pskin:surface was used, the absorption rate would be lower, but all the compound was absorbed. The same would happen if SA was smaller. Thus, we added Dabs to the model, and thereby modified the Csurface term and reduced the concentration to equal the part of the solution that is absorbed. Thus, we modified the surface concentration to control the amount of administered compound, which should be considered as practical solution. The above implementation was, however, not practical with respect to the simulations carried out in this work, which includes specific criteria based on application and product, including protection factors due to clothing and gloves. Therefore a new set of equations, with the dermal dose (𝐴𝐷𝑒𝑟𝑚𝑎𝑙𝑑𝑜𝑠𝑒(𝐶1𝑀0)) administered equally over the time period the exposure occurs (𝑡𝑑𝑒𝑟𝑚𝑎𝑙𝑒𝑥𝑝𝑡𝑖𝑚𝑒(𝐶1𝑀0)). This equation also includes the possibility to define the specific time interval during the day, by specifying the time of exposure start (𝑡𝑑𝑒𝑟𝑚𝑎𝑙𝑒𝑥𝑝𝑠𝑡𝑎𝑟𝑡(𝐶1𝑀0)) as well. All
times are in hrs. It is possible to simulate exposure during two working weeks with a weekend break in between.
𝑑𝐶𝑠𝑘𝑖𝑛(𝐶1𝑀0)
𝑑𝑡 = 𝑄𝑠𝑘𝑖𝑛𝑉𝑠𝑘𝑖𝑛
� 𝐶𝐴(𝐶1𝑀0) − 𝐶𝑠𝑘𝑖𝑛(𝐶1𝑀0)
𝑃𝑠𝑘𝑖𝑛(𝐶1𝑀0)� +
1𝑉𝑠𝑘𝑖𝑛
𝐴´𝐷𝑆(𝐶1𝑀0) 𝑋𝑑𝑒𝑟𝑚𝑎𝑙−𝑜𝑛−𝑜𝑓𝑓
𝐴´𝐷𝑆(𝐶1𝑀0) = 𝐼𝐹 𝑀𝑂𝐷(𝑇𝐼𝑀𝐸, 24) ≥ 𝑡𝑑𝑒𝑟𝑚𝑎𝑙𝑒𝑥𝑝𝑠𝑡𝑎𝑟𝑡(𝐶1𝑀0) 𝐴𝑁𝐷 𝑀𝑂𝐷(𝑇𝐼𝑀𝐸, 24)
≤ (𝑡𝑑𝑒𝑟𝑚𝑎𝑙𝑒𝑥𝑝𝑠𝑡𝑎𝑟𝑡(𝐶1𝑀0) + 𝑡𝑑𝑒𝑟𝑚𝑎𝑙𝑒𝑥𝑝𝑡𝑖𝑚𝑒(𝐶1𝑀0)) 𝐴𝑁𝐷 (𝑇𝐼𝑀𝐸 ≥ 5 ∗ 24 𝑂𝑅 𝑇𝐼𝑀𝐸≤ 7 ∗ 24) 𝑇𝐻𝐸𝑁 𝐴´𝑘𝑑𝑒𝑟𝑚𝑎𝑙(𝐶1𝑀0) 𝐸𝐿𝑆𝐸 0
𝐴′𝑘𝑑𝑒𝑟𝑚𝑎𝑙(𝐶1𝑀0) = 𝐴𝐷𝑒𝑟𝑚𝑎𝑙𝑑𝑜𝑠𝑒(𝐶1𝑀0) 1
𝑀𝑊𝐶1𝑀0
1𝑡𝑑𝑒𝑟𝑚𝑎𝑙𝑒𝑥𝑝𝑡𝑖𝑚𝑒(𝐶1𝑀0)
𝐴𝐷𝑒𝑟𝑚𝑎𝑙𝑑𝑜𝑠𝑒(𝐶1𝑀0) is calculated based on specific exposure scenarios described in section 5.3.1.2 . The dermal dose is calculated from the estimated total exposure of a given formulation (product), protection factors due to clothes and gloves, and the estimated dermal absorption of the product. It has the unit [mg] in the model and not [mg/kg BW] which is used for the other exposure routes (oral bolus, dietary and iv). Equations for rapidly and slowly perfused tissue concentrations Tissues and organs not of specific interest in the model are often lumped together, and in such a way we can simulate to whole body without considering each organ specifically. The rapidly perfused (rperfused) tissue compartment, consist of the brain, hearth, kidney, lung and spleen. The concentration of the compound in the rperfused compartment is calculated by solving the following differential equation. The variables correspond to the variables for liver compartment, where the blood flow (Qrperfused) and tissue volume (Vrperfused) are the combined blood flows and tissue volumes for all the tissues of the compartment, respectively.
𝑑𝐶𝑟𝑝𝑒𝑟𝑓𝑢𝑠𝑒𝑑(𝐶1𝑀0)
𝑑𝑡 = 𝑄𝑟𝑝𝑒𝑟𝑓𝑢𝑠𝑒𝑑𝑉𝑟𝑝𝑒𝑟𝑓𝑢𝑠𝑒𝑑
� 𝐶𝐴(𝐶1𝑀0) − 𝐶𝑟𝑝𝑒𝑟𝑓𝑢𝑠𝑒𝑑(𝐶1𝑀0)
𝑃𝑟𝑝𝑒𝑟𝑓𝑢𝑠𝑒𝑑(𝐶1𝑀0)�
Similarly, the slowly perfused (sperfused) compartment contains muscle and bone.
𝑑𝐶𝑠𝑝𝑒𝑟𝑓𝑢𝑠𝑒𝑑(𝐶1𝑀0)
𝑑𝑡 = 𝑄𝑠𝑝𝑒𝑟𝑓𝑢𝑠𝑒𝑑𝑉𝑠𝑝𝑒𝑟𝑓𝑢𝑠𝑒𝑑
� 𝐶𝐴(𝐶1𝑀0) − 𝐶𝑠𝑝𝑒𝑟𝑓𝑢𝑠𝑒𝑑(𝐶1𝑀0)
𝑃𝑠𝑝𝑒𝑟𝑓𝑢𝑠𝑒𝑑(𝐶1𝑀0)�

156 Optimization of the cumulative risk assessment of pesticides and biocides using computational techniques: Pilot project
A special compartment was made for adipose (fat) tissue was added to the model and described with a separate differential equation. As adipose tissue has very different properties compared to muscle and bone due to high content of neutral lipids, it was kept in a separate compartment, instead of including it in the slowly perfused compartment.
𝑑𝐶𝑓𝑎𝑡(𝐶1𝑀0)
𝑑𝑡 = 𝑄𝑓𝑎𝑡𝑉𝑓𝑎𝑡
� 𝐶𝐴(𝐶1𝑀0) − 𝐶𝑓𝑎𝑡(𝐶1𝑀0)
𝑃𝑓𝑎𝑡(𝐶1𝑀0)�
Equations for the blood compartments The concentration change in the blood is calculated as the difference in the free concentrations in the venous (CV) and the arterial blood (CA) multiplied by the cardiac output (QC) and divide by the whole blood volume (Vblood).
𝑑𝐶𝑏𝑙𝑜𝑜𝑑(𝐶1𝑀0)
𝑑𝑡 = 𝑄𝐶
𝑉𝑏𝑙𝑜𝑜𝑑� 𝐶𝑉(𝐶1𝑀0) − 𝐶𝐴(𝐶1𝑀0)�
The free concentration of the compound in the venous blood (CV) is the sum of the venous blood leaving the different tissues and organs (CV,t = Ct/Pt), where t stands for tissue (liver, skin, fat, rperfused or sperfused). Not all tissues are accounted for in the model, and thus we only divide with of the sum of the blood flows of the tissues considered and not the cardiac output. Otherwise, mass would not be preserved.
𝐶𝑉(𝐶1𝑀0) =
�𝑄𝑙𝑖𝑣𝑒𝑟 𝐶𝑉,𝑙𝑖𝑣𝑒𝑟(𝐶1𝑀0) + 𝑄𝑠𝑘𝑖𝑛 𝐶𝑉,𝑠𝑘𝑖𝑛(𝐶1𝑀0) + 𝑄𝑟𝑝𝑒𝑟𝑓𝑢𝑠𝑒𝑑 𝐶𝑉,𝑟𝑝𝑒𝑟𝑓𝑢𝑠𝑒𝑑(𝐶1𝑀0) +
𝑄𝑠𝑝𝑒𝑟𝑓𝑢𝑠𝑒𝑑 𝐶𝑉,𝑠𝑝𝑒𝑟𝑓𝑢𝑠𝑒𝑑(𝐶1𝑀0) + 𝑄𝑓𝑎𝑡 𝐶𝑉,𝑓𝑎𝑡(𝐶1𝑀0)� / (𝑄𝑙𝑖𝑣𝑒𝑟 + 𝑄𝑠𝑘𝑖𝑛 + 𝑄𝑟𝑝𝑒𝑟𝑓𝑢𝑠𝑒𝑑 + 𝑄𝑠𝑝𝑒𝑟𝑓𝑢𝑠𝑒𝑑 + 𝑄𝑓𝑎𝑡)
The equation can be extended to allow for intra venous (iv) administration, where Xiv-on-off variable is set to one when the iv exposure route should be active and set to zero to keep it inactive.
𝐶𝑉(𝐶1𝑀0) =�𝑄𝑙𝑖𝑣𝑒𝑟 𝐶𝑉,𝑙𝑖𝑣𝑒𝑟(𝐶1𝑀0) + 𝑄𝑠𝑘𝑖𝑛 𝐶𝑉,𝑠𝑘𝑖𝑛(𝐶1𝑀0) + 𝑄𝑟𝑝𝑒𝑟𝑓𝑢𝑠𝑒𝑑 𝐶𝑉,𝑟𝑝𝑒𝑟𝑓𝑢𝑠𝑒𝑑(𝐶1𝑀0) +
𝑄𝑠𝑝𝑒𝑟𝑓𝑢𝑠𝑒𝑑 𝐶𝑉,𝑠𝑝𝑒𝑟𝑓𝑢𝑠𝑒𝑑(𝐶1𝑀0) + 𝑄𝑓𝑎𝑡 𝐶𝑉,𝑓𝑎𝑡(𝐶1𝑀0) + 𝐴𝐼𝑉𝑒𝑥𝑝(𝐶1𝑀0)
′ 𝑋𝑖𝑣−𝑜𝑛−𝑜𝑓𝑓� / (𝑄𝑙𝑖𝑣𝑒𝑟 + 𝑄𝑠𝑘𝑖𝑛 +𝑄𝑟𝑝𝑒𝑟𝑓𝑢𝑠𝑒𝑑 + 𝑄𝑠𝑝𝑒𝑟𝑓𝑢𝑠𝑒𝑑 + 𝑄𝑓𝑎𝑡)
Where A´IVexp was calculated with the following equation, where AIVdose is the iv dose in [mg/kg BW] and A´IVexp and A´kiv have the unit [µmol/hr]. It is assumed that the iv dose in administered and distributed in the blood in 0ne minute. The dose is scaled to be delivered in one minute, but having a unit of [µmol/hr] as a general implementation.
𝐴𝐼𝑉𝑒𝑥𝑝(𝐶1𝑀0)′ = 𝐼𝐹 𝑇𝐼𝑀𝐸 ≤ 1/60 𝑇𝐻𝐸𝑁 𝐴𝑘𝑖𝑣(𝐶1𝑀0)
′ 𝐸𝐿𝑆𝐸 0
𝐴′𝑘𝑖𝑣(𝐶1𝑀0) = 𝐴𝐼𝑉𝑑𝑜𝑠𝑒(𝐶1𝑀0) 𝐵𝑊
𝑀𝑊𝐶1𝑀0 60 𝑚𝑖𝑛/ℎ𝑟
1 𝑚𝑖𝑛
The compounds free concentration in the arterial blood is calculated as the whole blood concentration (free + bound) times the fraction unbound, as also described in section 3.1.2.1.
𝐶𝐴(𝐶1𝑀0) = 𝐶𝑏𝑙𝑜𝑜𝑑(𝐶1𝑀0) 𝑓𝑢(𝐶1𝑀0)

Optimization of the cumulative risk assessment of pesticides and biocides using computational techniques: Pilot project 157
Equations describing elimination of metabolites from the body The elimination in urine and faeces was modelled by first order kinetics. A specific compartment was constructed for this purpose. In the case of tebuconazole, practically all the tebuconazole was metabolites and thus it was only necessary to model the excretion of the metabolites. Moreover, we only considered the sum of all metabolites formed (labelled C1M1). The elimination rates for urinary and faecal excretion (labelled EU and EF respectively) are calculated with the following equations.
𝑑𝐴𝐸𝑈(𝐶1𝑀1)
𝑑𝑡 = 𝐴𝐶1𝑀1 𝑘𝑒𝑢(𝐶1𝑀1)
𝑑𝐴𝐸𝐹(𝐶1𝑀1)
𝑑𝑡 = 𝐴𝐶1𝑀1 𝑘𝑒𝑓(𝐶1𝑀1)
Where keu and kef are the rate constants for urinary and faecal excretion in [hr-1], respectively, and AC1M1 is the total amount of metabolites in the body. The change of amount of metabolites at each time point is described by the following differential equations, and is the difference between the rate of formation of metabolites and the excretion rate for metabolites removed from the body.
𝑑𝐴𝐶1𝑀1𝑑𝑡 =
𝑑𝐴𝑀𝐿(𝐶1𝑀0)
𝑑𝑡 − 𝑑𝐴𝐸(𝐶1𝑀1)
𝑑𝑡
𝑑𝐴𝐸(𝐶1𝑀1)
𝑑𝑡 =𝑑𝐴𝐸𝑈(𝐶1𝑀1)
𝑑𝑡 +𝑑𝐴𝐸𝐹(𝐶1𝑀1)
𝑑𝑡
The average concentration of metabolites in the body (Cbody) is calculated with the following equation, where VdSS is the volume of distribution at steady state in the body in [l/kg].
𝐶𝑏𝑜𝑑𝑦(𝐶1𝑀1) =𝐴𝐶1𝑀1
𝑉𝑑(𝐶1𝑀1))𝑆𝑆 𝐵𝑊
Mass balances for controlling that preservation of mass In addition we have set up mass balances to control that mass is preserved, i.e. that that no compound is lost during the simulation. The sum of the total amount of tebuconazole (AC1M0) and the combined amount of all metabolites (AC1M1) in the body, and the amount of compounds eliminated via faeces (AEF(C1M1)) and urine (AEU(C1M1)), ATotal(C1), should be equal to the total amount of tebuconazole administered to the body in [µmol].
𝐴𝑇𝑜𝑡𝑎𝑙(𝐶1) = 𝐴𝐶1𝑀0 + 𝐴𝐶1𝑀1 + 𝐴𝐸𝑈(𝐶1𝑀1) + 𝐴𝐸𝐹(𝐶1𝑀1) = 𝐴𝐶1𝑀0 + 𝐴𝐶1𝑀1 + 𝐴𝐸(𝐶1𝑀1)
AC1M0 is the portion of an oral bolus dose of tebuconazole not yet absorbed and thus present in the GIT at a given time point, plus the combined amount tebuconazole in all compartments at the same time point. Compound administered by dietary exposure is sent directly to the liver, dermal dose is absorbed to the skin and an iv dose is added to the venous blood, and distributes from there. AC1M1 is the total amount of metabolites formed by metabolism of tebuconazole at a given time point, minus the amount of tebuconazole metabolites that excreted from the body at the same time point. (AC1M0 is labelled total_mass_C1M0 and AC1M1 is labelled total_mass_C1M1 in the graphs in the results section).
𝐴𝐶1𝑀0 = 𝐴𝑂𝐿(𝐶1𝑀0) + 𝑉𝑙𝑖𝑣𝑒𝑟 𝐶𝑙𝑖𝑣𝑒𝑟(𝐶1𝑀0) + 𝑉𝑠𝑘𝑖𝑛 𝐶𝑠𝑘𝑖𝑛(𝐶1𝑀0) + 𝑉𝑟𝑝𝑒𝑟𝑓𝑢𝑠𝑒𝑑 𝐶𝑟𝑝𝑒𝑟𝑓𝑢𝑠𝑒𝑑(𝐶1𝑀0)+ 𝑉𝑠𝑝𝑒𝑟𝑓𝑢𝑠𝑒𝑑 𝐶𝑠𝑝𝑒𝑟𝑓𝑢𝑠𝑒𝑑(𝐶1𝑀0)
+ 𝑉𝑓𝑎𝑡 𝐶𝑓𝑎𝑡(𝐶1𝑀0) + 𝑉𝑏𝑙𝑜𝑜𝑑 𝐶𝑏𝑙𝑜𝑜𝑑(𝐶1𝑀0)
𝐴𝐶1𝑀1 = 𝐴𝑀𝐿(𝐶1𝑀0) − 𝐴𝐸(𝐶1𝑀1)

158 Optimization of the cumulative risk assessment of pesticides and biocides using computational techniques: Pilot project
A simple check of ATotal, is to sum up the amount of tebuconzole administered by different exposure routes for a given simulation on a daily bases, such that the combined exposure can be evaluated for a given day, summed up with exposure on all the prior day studies in the simulation. In the present implementation, the oral and the iv doses are only implemented as single bolus doses at time zero, whereas the oral dietary administration and the dermal exposure are implemented as repeated exposure on a daily basis. NDermaldays is the number of days where repeated dermal exposure occurs, and correspondingly NOraldays is the number of days of repeated oral dietary exposure.
𝐴𝑇𝑜𝑡𝑎𝑙𝑑𝑜𝑠𝑒 =𝐵𝑊
𝑀𝑊𝐶1𝑀0�𝐴𝑂𝑟𝑎𝑙𝑑𝑜𝑠𝑒(𝐶1𝑀0) + 𝐴𝑂𝑟𝑎𝑙𝑎𝑑𝑚(𝐶1𝑀0) 𝑁𝑂𝑟𝑎𝑙𝑑𝑎𝑦𝑠 + 𝐴𝑖𝑣𝑑𝑜𝑠𝑒(𝐶1𝑀0)�
+1
𝑀𝑊𝐶1𝑀0𝐴𝐷𝑒𝑟𝑚𝑎𝑙𝑑𝑜𝑠𝑒(𝐶1𝑀0) 𝑁𝐷𝑒𝑟𝑚𝑎𝑙𝑑𝑎𝑦𝑠

Optimization of the cumulative risk assessment of pesticides and biocides using computational techniques: Pilot project 159
Appendix 3: Detailed mathematical description of the prochloraz model
Equations for liver concentration, metabolism and oral exposure The concentration of the mother compound (labelled C1M0) in the liver (Cliver) is calculated by the following differential equation for change in the concentration over time in [µmol/l/hr]. 𝑑𝐶𝑙𝑖𝑣𝑒𝑟(𝐶1𝑀0)
𝑑𝑡 =𝑄𝑙𝑖𝑣𝑒𝑟𝑉𝑙𝑖𝑣𝑒𝑟
� 𝐶𝐴(𝐶1𝑀0) −𝐶𝑙𝑖𝑣𝑒𝑟(𝐶1𝑀0)
𝑃𝑙𝑖𝑣𝑒𝑟(𝐶1𝑀0)� +
1𝑉𝑙𝑖𝑣𝑒𝑟
�–𝑑𝐴𝑀𝐿(𝐶1𝑀0)
𝑑𝑡 –𝑑𝐴𝑂𝐿(𝐶1𝑀0)
𝑑𝑡 + 𝐴′𝑑𝑖𝑒𝑡𝑒𝑥𝑝(𝐶1𝑀0)�
As described above, the concentration change depends on the difference in the concentration of free (unbound) prochloraz in arterial blood entering the liver and the concentration of free prochloraz in the venous blood leaving the liver, on the rate of metabolism in the liver, and the absorption rate of orally administered compound entering the liver via the portal vein. The input to the liver is modelled in the same way in the tebuconazole model. The liver part of prochloraz model is identical to the corresponding one for tebuconazole, with the exception a different set of equation was implemented for the metabolism. Experimental in vitro data for the intrinsic clearance (CLint) of prochloraz is available in the literature, but no Vmas and KM values. At low prochloraz concentrations the following equation is used.
𝑑𝐴𝑀𝐿(𝐶1𝑀0)
𝑑𝑡 = 𝐶𝐿𝑖𝑛𝑡(𝐶1𝑀0)𝐶𝑙𝑖𝑣𝑒𝑟(𝐶1𝑀0) 𝑃𝑙𝑖𝑣𝑒𝑟(𝐶1𝑀0)
At higher concentrations the metabolism of prochloraz was described by a combination of two reactions, using Michaelis-Menten kinetics. Formation of the first intermediate metabolite (metabolite 1) is described by one set of parameters and the remaining metabolic reaction scheme for depletion of metabolite 1 by another set of parameters. We make the preliminary assumption that the concentration of prochloraz and metabolite 1 in the liver is the same. The assumption is based on the hypothesis that most of the prochloraz entering the body metabolizes rather fast and undergoes ring opening to and then metabolizes further.
𝑑𝐴𝑀𝐿(𝐶1𝑀0)
𝑑𝑡 =𝑉max1(𝐶1𝑀0) 𝐶𝑙𝑖𝑣𝑒𝑟(𝐶1𝑀0) 𝑃𝑙𝑖𝑣𝑒𝑟(𝐶1𝑀0)⁄𝐾𝑀1(𝐶1𝑀0) + 𝐶𝑙𝑖𝑣𝑒𝑟(𝐶1𝑀0) 𝑃𝑙𝑖𝑣𝑒𝑟(𝐶1𝑀0)⁄ ∗
𝑉max2(𝐶1𝑀0) 𝐶𝑙𝑖𝑣𝑒𝑟(𝐶1𝑀0) 𝑃𝑙𝑖𝑣𝑒𝑟(𝐶1𝑀0)⁄𝐾𝑀2(𝐶1𝑀0) + 𝐶𝑙𝑖𝑣𝑒𝑟(𝐶1𝑀0) 𝑃𝑙𝑖𝑣𝑒𝑟(𝐶1𝑀0)⁄
Equations for rapidly and slowly perfused tissue and fat concentrations Tissues and organs not of specific interest in the model are often lumped together, with the rapidly perfused (rperfused) tissue compartment consisting of the brain, hearth, kidney, lung and spleen and the slowly perfused compartment consisting of muscle, bone and skin. Due to the special properties of adipose tissue and our experience with the tebuconazole model simulations, a special fat compartment was implemented. The concentration of the compound in the rperfused, sperfused and fat compartment is calculated by solving the following differential equation as described for the tebuconazole model, where all the variables and parameters are explained as well.
𝑑𝐶𝑟𝑝𝑒𝑟𝑓𝑢𝑠𝑒𝑑(𝐶1𝑀0)
𝑑𝑡 = 𝑄𝑟𝑝𝑒𝑟𝑓𝑢𝑠𝑒𝑑𝑉𝑟𝑝𝑒𝑟𝑓𝑢𝑠𝑒𝑑
� 𝐶𝐴(𝐶1𝑀0) − 𝐶𝑟𝑝𝑒𝑟𝑓𝑢𝑠𝑒𝑑(𝐶1𝑀0)
𝑃𝑟𝑝𝑒𝑟𝑓𝑢𝑠𝑒𝑑(𝐶1𝑀0)�
𝑑𝐶𝑠𝑝𝑒𝑟𝑓𝑢𝑠𝑒𝑑(𝐶1𝑀0)
𝑑𝑡 = 𝑄𝑠𝑝𝑒𝑟𝑓𝑢𝑠𝑒𝑑𝑉𝑠𝑝𝑒𝑟𝑓𝑢𝑠𝑒𝑑
� 𝐶𝐴(𝐶1𝑀0) − 𝐶𝑠𝑝𝑒𝑟𝑓𝑢𝑠𝑒𝑑(𝐶1𝑀0)
𝑃𝑠𝑝𝑒𝑟𝑓𝑢𝑠𝑒𝑑(𝐶1𝑀0)�
.

160 Optimization of the cumulative risk assessment of pesticides and biocides using computational techniques: Pilot project
𝑑𝐶𝑓𝑎𝑡(𝐶1𝑀0)
𝑑𝑡 = 𝑄𝑓𝑎𝑡𝑉𝑓𝑎𝑡
� 𝐶𝐴(𝐶1𝑀0) − 𝐶𝑓𝑎𝑡(𝐶1𝑀0)
𝑃𝑓𝑎𝑡(𝐶1𝑀0)�
Equations for the blood compartments The concentration change in the blood is calculated based on the difference in the total concentrations (free and bound) in the venous and arterial blood as described for the tebuconazole model.
𝑑𝐶𝑏𝑙𝑜𝑜𝑑(𝐶1𝑀0)
𝑑𝑡 = 𝑄𝐶
𝑉𝑏𝑙𝑜𝑜𝑑� 𝐶𝑉(𝐶1𝑀0) − 𝐶𝐴(𝐶1𝑀0)�
The free concentration of the compound in the venous blood is calculated as the sum of the venous blood leaving the different tissues and organs, where t stands for tissue (liver, rperfused, sperfused and fat). The sperfused compartment consists of muscle, bone and skin in the prochloraz model. The implementation of the iv and dermal exposure routes were left out in the present prochloraz model, but model can easily be modified to include those if need arises.
𝐶𝑉(𝐶1𝑀0) = �𝑄𝑙𝑖𝑣𝑒𝑟 𝐶𝑉,𝑙𝑖𝑣𝑒𝑟(𝐶1𝑀0) + 𝑄𝑟𝑝𝑒𝑟𝑓𝑢𝑠𝑒𝑑 𝐶𝑉,𝑟𝑝𝑒𝑟𝑓𝑢𝑠𝑒𝑑(𝐶1𝑀0) + 𝑄𝑠𝑝𝑒𝑟𝑓𝑢𝑠𝑒𝑑 𝐶𝑉,𝑠𝑝𝑒𝑟𝑓𝑢𝑠𝑒𝑑(𝐶1𝑀0) +
𝑄𝑓𝑎𝑡 𝐶𝑉,𝑓𝑎𝑡(𝐶1𝑀0)� / (𝑄𝑙𝑖𝑣𝑒𝑟 + 𝑄𝑟𝑝𝑒𝑟𝑓𝑢𝑠𝑒𝑑 + 𝑄𝑠𝑝𝑒𝑟𝑓𝑢𝑠𝑒𝑑 + 𝑄𝑓𝑎𝑡)
The compounds free concentration in the arterial blood is calculated as the whole blood concentration (free + bound) times the fraction unbound.
𝐶𝐴(𝐶1𝑀0) = 𝐶𝑏𝑙𝑜𝑜𝑑(𝐶1𝑀0) 𝑓𝑢(𝐶1𝑀0)
Equations describing elimination of metabolites and prochloraz from the body The elimination in urine and faeces was modelling by first order kinetics. Like for tebuconazole a specific compartment was constructed for this purpose. Practically all the prochloraz was metabolites and thus it was only necessary to model the excretion of the metabolites when considering the portion of prochloraz absorbed from the GIT. The portion of prochloraz not absorbed is on the other hand excreted as prochloraz. In this model, we only considered the sum of all metabolites formed (labelled C1M1) and not the individual metabolites. The elimination rates for urinary and faecal excretion (labelled EU and EF respectively) were combined in the prochloraz model into a common term (labelled E). This was done because as according to our data, larger a fraction of the metabolites were eliminated via the urine at higher concentration, than at lower concentrations. The excretion was thus calculated with the following equation, see section 3.1.2.5 for details.
𝑑𝐴𝐸(𝐶1𝑀1)
𝑑𝑡 = 𝐴𝐶1𝑀1 𝑘𝑒(𝐶1𝑀1)
The equation consists of the following subparts, which are not calculated specifically.
𝑑𝐴𝐸(𝐶1𝑀1)
𝑑𝑡 =𝑑𝐴𝐸𝑈(𝐶1𝑀1)
𝑑𝑡 +𝑑𝐴𝐸𝐹(𝐶1𝑀1)
𝑑𝑡
AC1M1, which is the total amount of metabolites in the body at each time point, is calculated with the following differential equation. The average concentration of metabolites in the body (Cbody) is calculated as described in section 3.1.2.5.

Optimization of the cumulative risk assessment of pesticides and biocides using computational techniques: Pilot project 161
𝑑𝐴𝐶1𝑀1𝑑𝑡 =
𝑑𝐴𝑀𝐿(𝐶1𝑀0)
𝑑𝑡 − 𝑑𝐴𝐸(𝐶1𝑀1)
𝑑𝑡
For prohloraz that is not absorbed and eliminated as un-metabolized via faeces, we had to implement removal of the unabsorbed via faeces. In the case of oral dietary administration we remove the unabsorbed compound instantaneously, as it is of no practical purpose to consider it in the simulation. As we used a total excretion data for validation of the model and for adjusting the elimination rate constants, we needed a more realistic implementation in the case of a single oral dose. We proposed the following equation where we assumed that all the compound was excreted within 24 hrs. after administration of a single oral bolus dose. The linear excretion equation is just an approximation that is sufficient for the current purpose, as the data sets we used did not contain excretion data at time points under 24 hrs.
𝑑𝐴𝐸,𝑂𝐵(𝐶1𝑀0)
𝑑𝑡 = 𝐼𝐹 𝑇𝐼𝑀𝐸 ≤ 24 𝑇𝐻𝐸𝑁 (1 − 𝐹𝑎(𝐶1𝑀0)) 𝐴𝑂𝑟𝑎𝑙𝑑𝑜𝑠𝑒(𝐶1𝑀0) 𝐵𝑊
𝑀𝑊𝐶1𝑀0
124ℎ𝑟 𝐸𝐿𝑆𝐸 0
The corresponding portion of the unabsorbed compound from dietary exposure is calculated as equally excreted for a period of 24 hour, repeatedly.
𝐴𝐸,𝐷𝑖𝑒𝑡(𝐶1𝑀0) = 𝐼𝐹 𝑀𝑂𝐷(𝑇𝐼𝑀𝐸, 24) ≤ 24 𝑇𝐻𝐸𝑁 (1 − 𝐹𝑎(𝐶1𝑀0)) 𝐴𝑂𝑟𝑎𝑙𝑎𝑑𝑚(𝐶1𝑀0) 𝐵𝑊
𝑀𝑊𝐶1𝑀0 𝑇𝐼𝑀𝐸24ℎ𝑟 𝐸𝐿𝑆𝐸 0
And the total excretion of unabsorbed and not metabolised prochloraz is thus.
𝐴𝐸(𝐶1𝑀0) = 𝐴𝐸,𝑂𝐵(𝐶1𝑀0) + 𝐴𝐸,𝐷𝑖𝑒𝑡(𝐶1𝑀0) The combined excretion of prohloraz and its metabolites is thus calculated by addition together the contributions from the metaboltized and the original compound. This equation was of particular used for validation and adjusting the elimination rate constant based on experimental data.
𝐴𝐸(𝐶1𝑡𝑜𝑡) = 𝐴𝐸(𝐶1𝑀1) + 𝐴𝐸(𝐶1𝑀0)
Mass balances for controlling that preservation of mass The mass balances to control that mass is preserved, i.e. that that no compound is lost during the simulation is similar to the corresponding equation for tebuconazole, with the exception that excretion of unabsorbed prochloraz (AEU(C1M0)) was added. ATotal(C1), should be equal to the total amount of tebuconazole administered to the body in [µmol].
𝐴𝑇𝑜𝑡𝑎𝑙(𝐶1) = 𝐴𝐶1𝑀0 + 𝐴𝐶1𝑀1 + 𝐴𝐸(𝐶1𝑀1) + 𝐴𝐸(𝐶1𝑀0)
AC1M0 is calculated with a similar equation as for tebuconazole, with the exception that the skin is part of the slowly perfused compartment, and AC1M1 is calculated in the same way as shown for the tebuconazole model.
𝐴𝐶1𝑀0 = 𝐴𝑂𝐿(𝐶1𝑀0) + 𝑉𝑙𝑖𝑣𝑒𝑟 𝐶𝑙𝑖𝑣𝑒𝑟(𝐶1𝑀0) + 𝑉𝑟𝑝𝑒𝑟𝑓𝑢𝑠𝑒𝑑 𝐶𝑟𝑝𝑒𝑟𝑓𝑢𝑠𝑒𝑑(𝐶1𝑀0) + 𝑉𝑠𝑝𝑒𝑟𝑓𝑢𝑠𝑒𝑑 𝐶𝑠𝑝𝑒𝑟𝑓𝑢𝑠𝑒𝑑(𝐶1𝑀0) + 𝑉𝑓𝑎𝑡 𝐶𝑓𝑎𝑡(𝐶1𝑀0) + 𝑉𝑏𝑙𝑜𝑜𝑑 𝐶𝑏𝑙𝑜𝑜𝑑(𝐶1𝑀0)
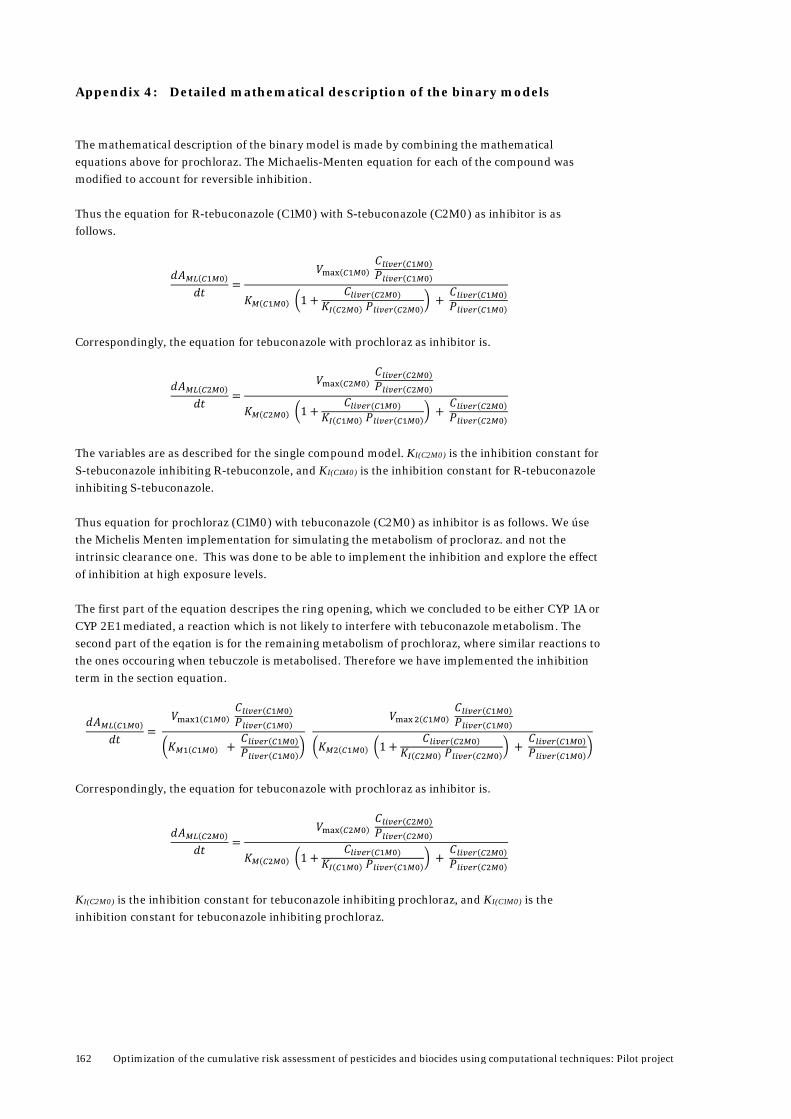
162 Optimization of the cumulative risk assessment of pesticides and biocides using computational techniques: Pilot project
Appendix 4: Detailed mathematical description of the binary models
The mathematical description of the binary model is made by combining the mathematical equations above for prochloraz. The Michaelis-Menten equation for each of the compound was modified to account for reversible inhibition. Thus the equation for R-tebuconazole (C1M0) with S-tebuconazole (C2M0) as inhibitor is as follows.
𝑑𝐴𝑀𝐿(𝐶1𝑀0)
𝑑𝑡 =𝑉max(𝐶1𝑀0)
𝐶𝑙𝑖𝑣𝑒𝑟(𝐶1𝑀0)𝑃𝑙𝑖𝑣𝑒𝑟(𝐶1𝑀0)
𝐾𝑀(𝐶1𝑀0) �1 +𝐶𝑙𝑖𝑣𝑒𝑟(𝐶2𝑀0)
𝐾𝐼(𝐶2𝑀0) 𝑃𝑙𝑖𝑣𝑒𝑟(𝐶2𝑀0)� +
𝐶𝑙𝑖𝑣𝑒𝑟(𝐶1𝑀0)𝑃𝑙𝑖𝑣𝑒𝑟(𝐶1𝑀0)
Correspondingly, the equation for tebuconazole with prochloraz as inhibitor is.
𝑑𝐴𝑀𝐿(𝐶2𝑀0)
𝑑𝑡 =𝑉max(𝐶2𝑀0)
𝐶𝑙𝑖𝑣𝑒𝑟(𝐶2𝑀0)𝑃𝑙𝑖𝑣𝑒𝑟(𝐶2𝑀0)
𝐾𝑀(𝐶2𝑀0) �1 +𝐶𝑙𝑖𝑣𝑒𝑟(𝐶1𝑀0)
𝐾𝐼(𝐶1𝑀0) 𝑃𝑙𝑖𝑣𝑒𝑟(𝐶1𝑀0)� +
𝐶𝑙𝑖𝑣𝑒𝑟(𝐶2𝑀0)𝑃𝑙𝑖𝑣𝑒𝑟(𝐶2𝑀0)
The variables are as described for the single compound model. KI(C2M0) is the inhibition constant for S-tebuconazole inhibiting R-tebuconzole, and KI(C1M0) is the inhibition constant for R-tebuconazole inhibiting S-tebuconazole. Thus equation for prochloraz (C1M0) with tebuconazole (C2M0) as inhibitor is as follows. We úse the Michelis Menten implementation for simulating the metabolism of procloraz. and not the intrinsic clearance one. This was done to be able to implement the inhibition and explore the effect of inhibition at high exposure levels. The first part of the equation descripes the ring opening, which we concluded to be either CYP 1A or CYP 2E1 mediated, a reaction which is not likely to interfere with tebuconazole metabolism. The second part of the eqation is for the remaining metabolism of prochloraz, where similar reactions to the ones occouring when tebuczole is metabolised. Therefore we have implemented the inhibition term in the section equation.
𝑑𝐴𝑀𝐿(𝐶1𝑀0)
𝑑𝑡 = 𝑉max1(𝐶1𝑀0)
𝐶𝑙𝑖𝑣𝑒𝑟(𝐶1𝑀0)𝑃𝑙𝑖𝑣𝑒𝑟(𝐶1𝑀0)
�𝐾𝑀1(𝐶1𝑀0) + 𝐶𝑙𝑖𝑣𝑒𝑟(𝐶1𝑀0)𝑃𝑙𝑖𝑣𝑒𝑟(𝐶1𝑀0)
�
𝑉max2(𝐶1𝑀0) 𝐶𝑙𝑖𝑣𝑒𝑟(𝐶1𝑀0)𝑃𝑙𝑖𝑣𝑒𝑟(𝐶1𝑀0)
�𝐾𝑀2(𝐶1𝑀0) �1 +𝐶𝑙𝑖𝑣𝑒𝑟(𝐶2𝑀0)
𝐾𝐼(𝐶2𝑀0) 𝑃𝑙𝑖𝑣𝑒𝑟(𝐶2𝑀0)� +
𝐶𝑙𝑖𝑣𝑒𝑟(𝐶1𝑀0)𝑃𝑙𝑖𝑣𝑒𝑟(𝐶1𝑀0)
�
Correspondingly, the equation for tebuconazole with prochloraz as inhibitor is.
𝑑𝐴𝑀𝐿(𝐶2𝑀0)
𝑑𝑡 =𝑉max(𝐶2𝑀0)
𝐶𝑙𝑖𝑣𝑒𝑟(𝐶2𝑀0)𝑃𝑙𝑖𝑣𝑒𝑟(𝐶2𝑀0)
𝐾𝑀(𝐶2𝑀0) �1 +𝐶𝑙𝑖𝑣𝑒𝑟(𝐶1𝑀0)
𝐾𝐼(𝐶1𝑀0) 𝑃𝑙𝑖𝑣𝑒𝑟(𝐶1𝑀0)� +
𝐶𝑙𝑖𝑣𝑒𝑟(𝐶2𝑀0)𝑃𝑙𝑖𝑣𝑒𝑟(𝐶2𝑀0)
KI(C2M0) is the inhibition constant for tebuconazole inhibiting prochloraz, and KI(C1M0) is the inhibition constant for tebuconazole inhibiting prochloraz.

Optimization of the cumulative risk assessment of pesticides and biocides using computational techniques: Pilot project 163
Then we added a few equations to be able to calculate the total concentration of the two active compounds in blood and the different tissues (t), and to calculate the total amount of active compounds and their metabolites, respectively.
𝐶𝑡(𝑡𝑜𝑡) = 𝐶𝑡(𝐶1𝑀0) + 𝐶𝑡(𝐶2𝑀0)
𝐴𝐶1𝑀0,𝐶2𝑀0 = 𝐴𝐶1𝑀0 + 𝐴𝐶2𝑀0
𝐴𝐶1𝑀1,𝐶2𝑀1 = 𝐴𝐶1𝑀1 + 𝐴𝐶2𝑀1
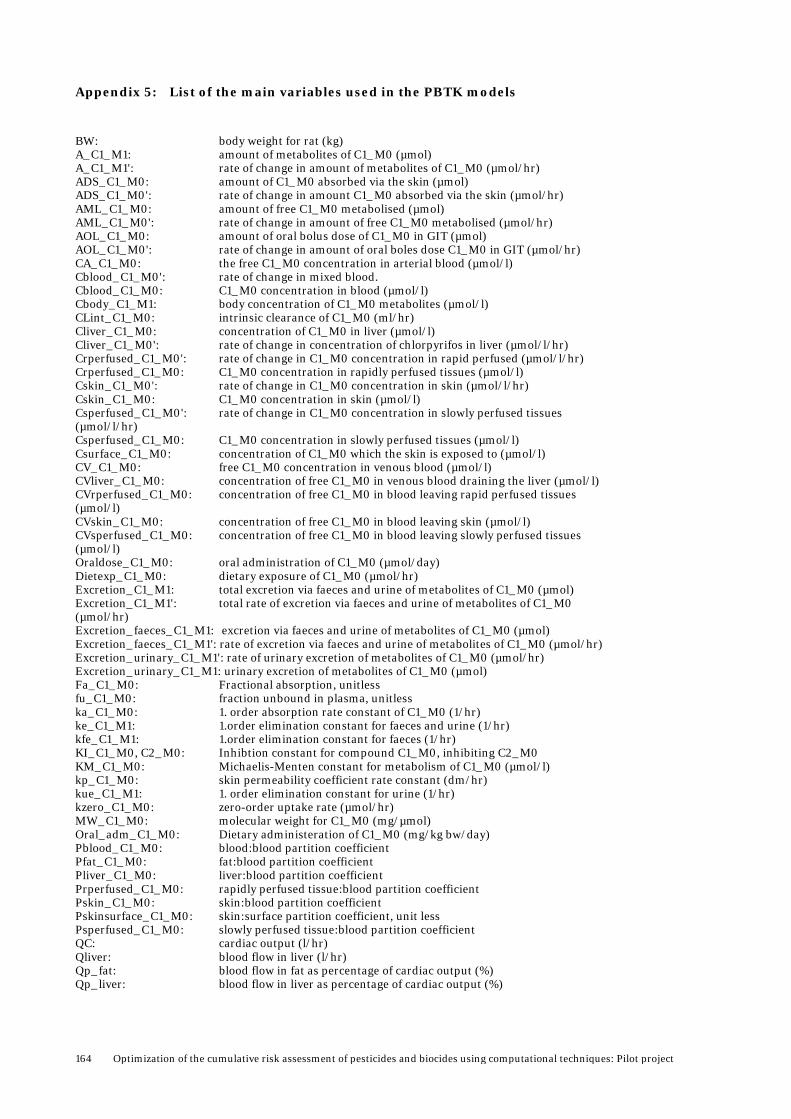
164 Optimization of the cumulative risk assessment of pesticides and biocides using computational techniques: Pilot project
Appendix 5: List of the main variables used in the PBTK models
BW: body weight for rat (kg) A_C1_M1: amount of metabolites of C1_M0 (µmol) A_C1_M1': rate of change in amount of metabolites of C1_M0 (µmol/hr) ADS_C1_M0: amount of C1_M0 absorbed via the skin (µmol) ADS_C1_M0': rate of change in amount C1_M0 absorbed via the skin (µmol/hr) AML_C1_M0: amount of free C1_M0 metabolised (µmol) AML_C1_M0': rate of change in amount of free C1_M0 metabolised (µmol/hr) AOL_C1_M0: amount of oral bolus dose of C1_M0 in GIT (µmol) AOL_C1_M0': rate of change in amount of oral boles dose C1_M0 in GIT (µmol/hr) CA_C1_M0: the free C1_M0 concentration in arterial blood (µmol/l) Cblood_C1_M0': rate of change in mixed blood. Cblood_C1_M0: C1_M0 concentration in blood (µmol/l) Cbody_C1_M1: body concentration of C1_M0 metabolites (µmol/l) CLint_C1_M0: intrinsic clearance of C1_M0 (ml/hr) Cliver_C1_M0: concentration of C1_M0 in liver (µmol/l) Cliver_C1_M0': rate of change in concentration of chlorpyrifos in liver (µmol/l/hr) Crperfused_C1_M0': rate of change in C1_M0 concentration in rapid perfused (µmol/l/hr) Crperfused_C1_M0: C1_M0 concentration in rapidly perfused tissues (µmol/l) Cskin_C1_M0': rate of change in C1_M0 concentration in skin (µmol/l/hr) Cskin_C1_M0: C1_M0 concentration in skin (µmol/l) Csperfused_C1_M0': rate of change in C1_M0 concentration in slowly perfused tissues (µmol/l/hr) Csperfused_C1_M0: C1_M0 concentration in slowly perfused tissues (µmol/l) Csurface_C1_M0: concentration of C1_M0 which the skin is exposed to (µmol/l) CV_C1_M0: free C1_M0 concentration in venous blood (µmol/l) CVliver_C1_M0: concentration of free C1_M0 in venous blood draining the liver (µmol/l) CVrperfused_C1_M0: concentration of free C1_M0 in blood leaving rapid perfused tissues (µmol/l) CVskin_C1_M0: concentration of free C1_M0 in blood leaving skin (µmol/l) CVsperfused_C1_M0: concentration of free C1_M0 in blood leaving slowly perfused tissues (µmol/l) Oraldose_C1_M0: oral administration of C1_M0 (µmol/day) Dietexp_C1_M0: dietary exposure of C1_M0 (µmol/hr) Excretion_C1_M1: total excretion via faeces and urine of metabolites of C1_M0 (µmol) Excretion_C1_M1': total rate of excretion via faeces and urine of metabolites of C1_M0 (µmol/hr) Excretion_faeces_C1_M1: excretion via faeces and urine of metabolites of C1_M0 (µmol) Excretion_faeces_C1_M1': rate of excretion via faeces and urine of metabolites of C1_M0 (µmol/hr) Excretion_urinary_C1_M1': rate of urinary excretion of metabolites of C1_M0 (µmol/hr) Excretion_urinary_C1_M1: urinary excretion of metabolites of C1_M0 (µmol) Fa_C1_M0: Fractional absorption, unitless fu_C1_M0: fraction unbound in plasma, unitless ka_C1_M0: 1. order absorption rate constant of C1_M0 (1/hr) ke_C1_M1: 1.order elimination constant for faeces and urine (1/hr) kfe_C1_M1: 1.order elimination constant for faeces (1/hr) KI_C1_M0, C2_M0: Inhibtion constant for compound C1_M0, inhibiting C2_M0 KM_C1_M0: Michaelis-Menten constant for metabolism of C1_M0 (µmol/l) kp_C1_M0: skin permeability coefficient rate constant (dm/hr) kue_C1_M1: 1. order elimination constant for urine (1/hr) kzero_C1_M0: zero-order uptake rate (µmol/hr) MW_C1_M0: molecular weight for C1_M0 (mg/µmol) Oral_adm_C1_M0: Dietary administeration of C1_M0 (mg/kg bw/day) Pblood_C1_M0: blood:blood partition coefficient Pfat_C1_M0: fat:blood partition coefficient Pliver_C1_M0: liver:blood partition coefficient Prperfused_C1_M0: rapidly perfused tissue:blood partition coefficient Pskin_C1_M0: skin:blood partition coefficient Pskinsurface_C1_M0: skin:surface partition coefficient, unit less Psperfused_C1_M0: slowly perfused tissue:blood partition coefficient QC: cardiac output (l/hr) Qliver: blood flow in liver (l/hr) Qp_fat: blood flow in fat as percentage of cardiac output (%) Qp_liver: blood flow in liver as percentage of cardiac output (%)

Optimization of the cumulative risk assessment of pesticides and biocides using computational techniques: Pilot project 165
Qp_rperfused: blood flow in rapidly perfused tissues as percentage of cardiac output (%) Qp_skin: blood flow in skin as percentage of cardiac output (%) Qp_sperfused: blood flow in slowly perfused tissues as percentage of cardiac output (%) Qfat: blood flow in fat (l/hr) Qrperfused: blood flow in rapidly perfused tissues (l/hr) Qskin: blood flow in skin (l/hr) Qsperfused: blood flow to slowly perfused tissues (l/hr) SA: area of exposed skin (dm2) Varterial: volume of arterial blood (l) Vblood: volume of blood (l) Vfat: volume of fat (l) Vd: volume of distribution (l) Vliver: volume of liver (l) Vmax_C1_M0: maximum rate (velocity) for metabolism of C1_M0 (µmol/hr) VmaxC_C1_M0: maximum rate for metabolism of C1_M0 per kg body weight (liver) (µmol/hr/kg) Vp_arterial: volume of arterial blood as percentage of body weight (%) Vp_blood: volume of blood percentage of body weight (%) Vp_fat: volume of fat percentage of body weight (%) Vp_liver: volume of liver percentage of body weight (%) Vp_rperfused: volume of rapidly perfused tissues percentage of body weight (%) Vp_skin: volume of skin percentage of body weight (%) Vp_sperfused: volume of slowly perfused tissues percentage of body weight (%) Vp_venous: volume of venous blood as percentage of body weight (%) Vrperfused: volume of rapidly perfused tissue (l) Vskin: volume of skin (l) Vsperfused: volume of slowly perfused tissues (l) Vvenous: volume of venous blood (l) TOTAL_C1_M0: total mass of C1_M0 in blood, delivered to tissues or excreted (µmol) total_mass_C1_M0: total mass of C1_M0 in body (µmol) total_mass_C1_M1: total mass of metabolites of C1_M0 in body (µmol)

166 Optimization of the cumulative risk assessment of pesticides and biocides using computational techniques: Pilot project
Appendix 6: Review on Metabolic Constants of Related Compounds
Imidazoles and triazoles are known to be extensively metabolized in the liver by cytochrome P450s (CYPs) and other enzymes. Such compounds are also known to be potent inhibitors and inducers of CYP activity, and are at higher doses involved in substantial drug-drug interactions. Drug-drug interactions due to the inhibitory effects of ketaconazole, fluconazole, itraconazole have been extensively documented for a wide range of drugs in the literature. Increased CYP enzyme activity of some imidazoles and triazoles due to induction of CYP, for example mediated by PXR and CAR binding, is also well documented in the literature. The CYP metabolism of compounds from these classes is predominantly carried out by CYP 3A4, CYP 2C9 and in humans, but other CYPs play a role as well (Gubbins, 2011; Dvorak, 2011). Metabolism in rats is carried out by other isoforms, as the three named isoforms in humans are not expressed in rats. Martignoni et al. reviewed species differences in expression of major drug-metabolizing CYPs in human, rat, mouse, dog and monkey (Martignoni et al., 2006). Whereas in the CYP 1A, CYP 1B and CYP 2E families the same four isoforms are expressed in all five species, the number and type of isoforms expressed for CYP 2A, B, C, D and CYP 3A varies from one species to another. Triadimefon and triadimenol Crowell et al. measured metabolic constants for triadimefon depletion and triadimenol formation in hepatic micosomal metabolic assay for male and female SD rats, and male and female CD-1 mice (Crowell et al., 2010), and for triadimefon depletion in male human liver microsomes (Crowell et al., 2011). Gender differences were seen in rats for these processes, but not in mice. Species differences were also observed between rats, mice and human. The experimental Vmax and KM values for triadimefon depletion in male rat and male human were used for triadimefon reduction in a PBTK model, and the corresponding parameters for triadimenol oxidation used in the same model were estimated to be half of values for triadimefon reduction.
Tridimefon depletion Vmax [pmol min-1 mg-1 protein] KM [µM] Rat liver microsomes-male (SD) 7452 ± 493 47 ± 8 Rat liver microsomes-female (SD) 3771 ± 589 80 ± 25 Mouse liver microsomes-male (CD-1) 2824 ± 261 45 ± 11 Mouse liver microsomes-female (CD-1) 3957 ± 725 42 ± 20 Triadimenol formation Vmax [pmol min-1 mg-1 protein] KM [µM] Rat liver microsomes-male (SD) 5703 ± 149 61 ± 4 Rat liver microsomes-female (SD) 344 ± 15 78 ± 8 Mouse liver microsomes-male (CD-1) 1052 ± 38 42 ± 20 Mouse liver microsomes-female (CD-1) 1341 ± 52 6 ± 1
Tridimefon reduction VmaxC [µmol hr-1 kg-0.75] KM [µM] Rat liver microsomes-male (SD) 556.4 47.3 Human liver micorosomes 547.2 132.7
Barton et al. published the apparent metabolic constants for triadimefon and myclobutanil by human and rat liver microsomes (Barton et al., 2006), measurements were carried out in pretreated rats in two dose groups, and in a control group. Relative liver weight and total CYP content was

Optimization of the cumulative risk assessment of pesticides and biocides using computational techniques: Pilot project 167
significantly increased at in the highest dose group for both compounds. Half live in different rat and human CYP, and in rat and human male or female microsomes are given as well. Fluconazole and itraconazole Niwa et al. (Niwa et al., 2008a) published a review over metabolic constants in recombinant human CYP 3A4 and CYP 3A5 for a wide variety of drugs, including fluconazole and itraconazole.
Compound CYP Vmax [nmol KM min-1 nmol-1 protein] [µM] Fluconazole 3-hydroxylation in supersomes CYP 3A4 19.3 106 CYP 3A5 3.85 49.3 Fluconazole demethylation in supersomes CYP 3A4 0.55 35.6 CYP 3A5 0.217 43.8 Itraconazole hydroxylation in supersomes CYP3 A4 0.27 0.0444
Itraconazole Isoherranen et al. (Isoherranen et al., 2004) published metabolic constants for cDNA-expressed CYP 3A4 (supersomes)-mediated metabolism of itraconazole, and its metabolites hydroxy-itraconazole and keto-itraconazole. Itraconazole undergoes hydroxylation to hydroxy-itraconazole, which is oxidized to keto-itraconazole. Keto-itraconazole then undergoes cleavage with the keto side-chain removed to form N-desalkyl-itraconazole. Kinetic parameters for CYP 3A4 inhibition of these compounds and their binding to CYP 3A4 are also listed in this paper. The detailed information on specific metabolic reaction in a specific CYP makes this information suitable for read-a-cross determination of missing metabolic constants for other triazoles and imidazoles. (The value for itraconazole reported in the review by Niwa et al. (Niwa et al., 2008b), is from this paper.)
CYP Vmax [nmol KM min-1 nmol-1 3A4] [nM] Itraconazole hydroxylation in supersomes CYP 3A4 0.27 44.4 ± 11.1 Hydroxy-itraconazole oxydation in supersomes: CYP 3A4 0.543 71.7 ± 37.5 Keto-itraconazole cleavage in supersomes CYP 3A4 0.0869 17.9 ± 8.8
Omeprazole Yamazaki et al.(Yamazaki et al., 1997) published metabolic constants for human recombinant CYP 2C19 and 3A4 5-hydroxylation in insect liver microsomes.
Sample Vmax [nmol hr-1 nmol-1 P450] KM [µM] 5-hydroxylation Human CYP 2C19 in insect liver microsomes 8.3 6.6 Human CYP 3A4 in insect liver microsomes 2.4 60 Sulfoxidation Human CYP 3A4 in insect liver mircosomes 18 140

168 Optimization of the cumulative risk assessment of pesticides and biocides using computational techniques: Pilot project
Fipronil Metabolic constants were measured for fibronil, an insectide form the phenyl pyrazole family, in human and rat liver microsomes, as well as baculovirus-expressed CYP3A4 microsomes (Tang et al., 2004). The difference in fipronil metabolism was analyzed in 19 single donor human liver microsomes, showing significant inter-individual variations. Two individuals showed ultra-rapid metabolism of this compounds, one with over 40-fold faster metabolism than the most slowly metabolizing individual. Fipronil has significant structural similarities to prochloraz, however the CYP mediated metabolism of Fipronil involves oxidation of the sulfur to form a sulfonyl.
Fipronil oxidation Vmax [nmol min-1 mg-1 protein] KM [µM] Human liver microsomes 0.1074 27.2 Rat liver microsomes 0.3904 19.9 Baculovirus-expressed CYP 3A4 supersomes 12.7 17.4
Bis-triazolylpropanol (DTP) in rat Bomont et al. (Bomont et al., 1994) published paper on hepatic binding and clearance of DTP, and compared the interactions DTP and ketoconazole with CYPs . DTP undergoes CYP mediated N-dealkylation to form a diol and a triazole, followed by oxidation of the diol to acid and conjugation of both the diol and the acid to form glucouronides. Vmax is calculated per standard rat body weight (SRW).
Sample Vmax [nmol hr-1 SRW-1] KM [µM] Rat liver mircosomes (total concentration) 51.6 2.7 Rat liver mircosomes (unbound concentration) 51.6 1.5
Voriconazole Roffey et al.(Roffey et al., 2003) reported in vivo metabolic constants in rats and dogs.
Vmax [µg hr-1 ml-1] KM [µg/ml] In vivo male rats 1.2 2.4 In vivo male/female dogs 0.11 0.27

Optimization of the cumulative risk assessment of pesticides and biocides using computational techniques: Pilot project 169
Appendix 7: 2D structures of training set compounds for the developed QSAR models, showing ionizable atoms and predicted logD values at pH=7.0 and pH=7.4 (blood pH).
Name 2D-structure with ionizable atoms
logD pH=7.0
logD pH=7.4
Comment
Albendazole 3.1 3.1 NH in the imidazole ring partly ionized to NH2+ (2-1%)
Anastrozole 0.97 0.97
Aripiprazole 5.2 5.4 N (dark blue) partly ionized to NH+ (82-65%)
Cefmetazole -2.7 -2.7 Carboxyl acid fully Ionized
Clomethiazole 1.6 1.6
Fluconazole 0.50 0.50
Fosfluconazole -5.5 -5.6 Phosphate group ionized (both OH) (net charge -2)
Genaconazole 0.97 0.97
Itraconazole 4.2 4.29 N partly ionized to NH+ (23-11%)
Ketoconazole 3.3 3.4 N partly ionized to NH+ (43-23%)
Lansoprazole 1.8 1.8

170 Optimization of the cumulative risk assessment of pesticides and biocides using computational techniques: Pilot project
Letrozole 1.9 1.9
Mebendazole 2.8 2.8
Methimazole -0.3 -0.3
Metronidazole 0.0 -0.01 Compound ionized as shown (net charge 0)
Omeprazole 2.2 2.2 NH partly ionized to N- (3-7%)
Pantoprazole 1.7 1.7 NH partly ionized to N- (4-10%)
Rabeprazole 1.8 1.8 NH partly ionized to N- (0-1%)
Sulfisoxazole -0.3 -0.55 NH ionized to N- (99-100%)
Sulfamethoxazole
0.0 -0.32 NH ionized to N- (94-97%)
Tinidazole
-0.3 -0.27
Voriconazole
0.9 0.93
Flumazenil
0.67 0.67
Clotrimazole 5.4 5.4 N ionized to NH+ (12-5%)
Astemizole
4.1 4.4 N ionized to NH+ Net charge +2 (9-4%), +1 (89-92%)

Optimization of the cumulative risk assessment of pesticides and biocides using computational techniques: Pilot project 171
Appendix 8: Overview over blood and tissue concentration and excretion data
The data sets with excretion, as well as blood and tissue concentration data are listed below. Excretion data for tebuconazole and predominantly for the metabolites from DAR (European Commission, 2007b) and JMPR (2010) Table A8.1. Mean cumulative excretion from single bolus dose experiments in male rat at two different doses, 5 test animals in each dose group. The same data set is found both in DAR and JMPR. Mean 0.81% of the dose was left in the body for the low and high dose group.
Dose 2 mg/kg bw = 1.62 µmol 20 mg/kg bw = 16.2 µmol
time (h) total excretion total excretion total excretion total excretion
[hr] [% of adm dose] [µmol] [% of adm dose] [µmol]
Urine 4 3.2 0.052 1.2 0.19
8 6.6 0.107 3.4 0.55
24 13.9 0.226 11.7 1.90
32 14.9 0.242 12.6 2.05
48 15.9 0.258 13.9 2.26
56 16.1 0.262 14.1 2.29
72 16.3 0.265 14.4 2.34
Faeces 24 71.1 1.15 61.3 9.96
48 79.9 1.30 70.8 11.50
56 81.3 1.32 71.1 11.55
72 82.1 1.33 72.1 11.71
urine+faeces 24 85.0 1.38 73.0 11.86
48 95.8 1.56 84.7 13.76
56 97.4 1.58 85.2 13.84
72 98.4 1.60 86.5 14.05

172 Optimization of the cumulative risk assessment of pesticides and biocides using computational techniques: Pilot project
Table A8.2. Cumulative excretion data from DAR (European Commission, 2007b), iv bolus dose experiments in male rhesus monkeys.
IV bolus dose of tebuconazole in vivo in rhesus monkey. DAR B.6.12.7
Actual dose [µg]: 240
BW_m [kg]: 6.2
[µmol]: 0.780
Urine pan / Normalized Normalized
Time Urine Faeces Cage rinse Cage wash Total excr. Total excr. Total excr.
[hr] [% of dose] [% of dose] [% of dose] [% of dose] [% of dose] [% of dose] [µmol]
4 39.49 0.04 8.07 0.00 47.6 45.2 0.353
8 53.89 0.07 13.04 0.00 67.0 63.6 0.496
12 56.14 0.07 15.56 0.00 71.8 68.2 0.531
24 66.52 8.28 19.83 0.00 94.6 89.9 0.701
48 70.92 9.03 22.00 0.00 102.0 96.8 0.755
72 71.66 9.66 22.59 0.00 103.9 98.7 0.770
96 71.96 9.71 22.67 0.00 104.3 99.1 0.773
120 72.02 9.71 23.23 0.00 105.0 99.7 0.777
144 72.02 9.71 23.47 0.09 105.3 100.0 0.780 Table A8.3. Cumulative excretion data from DAR, (European Commission, 2007b) dermal dose experiments in male rhesus monkeys.
Dermal dose of tebuconazole in vivo in rhesus monkey. DAR B.6.12.7
Actual dose [µg] 261
SA [cm2]: 24 [µg/cm2]: 10.9
[µmol]: 0.848
Normalized Normalized
Time Urine Faeces Cage rinse Urine pan Total excr. Total excr. Total excr.
[hr] [% of dose] [% of dose] [% of dose] [% of dose] [% of dose] [% of dose] [µmol]
4 0.20 0.20 0.19 0.0016
8 2.44 0.02 2.46 2.38 0.0201
12 3.27 0.02 0.38 3.67 3.54 0.0301
24 4.36 1.18 0.49 6.03 5.82 0.0494
48 4.36 1.50 0.49 0.47 6.82 6.59 0.0558
72 4.36 1.53 0.49 0.47 6.85 6.62 0.0561
96 4.36 1.58 0.49 0.47 6.90 6.66 0.0565
120 4.36 1.63 0.49 0.47 6.95 6.71 0.0569

Optimization of the cumulative risk assessment of pesticides and biocides using computational techniques: Pilot project 173
Table A8.4. Cumulative excretion data from DAR (European Commission, 2007b), dermal dose experiments in male rhesus monkeys.
Dermal dose of tebuconazole in vivo in rhesus monkey. DAR B.6.12.7
Actual dose [µg] 132
SA [cm2]: 24 [µg/cm2]: 5.5
[µmol]: 0.429
Time Urine Faeces Cage rinse Urine pan Total excr. Total excr.
[hr] [% of dose] [% of dose] [% of dose] [% of dose] [% of dose] [µmol]
4 0.69 0.27 0.96 0.0041
8 2.54 1.01 3.55 0.0152
12 3.71 0.37 1.01 5.09 0.0218
24 6.87 0.11 0.85 1.01 8.84 0.0379
48 7.75 1.18 0.85 1.01 10.79 0.0463
72 8.25 1.23 0.85 1.01 11.34 0.0486
96 8.25 1.23 0.85 1.01 11.34 0.0486
120 8.25 1.26 0.98 1.01 11.50 0.0493

174 Optimization of the cumulative risk assessment of pesticides and biocides using computational techniques: Pilot project
Blood and tissue concentration data for tebuconazole in rabbit from Zhu et al. (2007) Table A8.5. Data for R- and S- tebuconazole after administration of an iv bolus dose of 30 mg/kg BW of racemic mixture of tebuconazole, BW of animals 2-2.25 kg. Each time point corresponds to one animal.
S(+) form R(-)form S(+) + R(-)
Time conc. time conc. time total conc.
[min] [µmol/l] [min] [µmol/l] [min] [µmol/l]
BRAIN concentration-time curve
14.7 32.7 14.7 38.1 15 70.8
29.4 70.2 29.4 83.5 30 153.7
59.82 53.3 59.82 66 60 119.3
119.4 15.1 119.4 30.3 120 45.4
358.8 2.42 358.8 2.42 360 4.84
HEART concentration-time curve
14.46 38.8 14.46 47.4 15 86.2
30.18 56 30.18 66.6 30 122.6
60.6 42.9 60.6 51.5 60 94.4
119.4 18.2 119.4 28.3 120 46.5
238.8 13.6 240 21.2 240 34.8
480.6 2.02 480 2.02
KIDNEY concentration-time curve
14.46 38.6 14.46 42.3 15 80.9
30.24 67.4 30.24 84.6 30 152
59.88 55.2 59.88 68.7 60 123.9
120 13.5 120.6 23.3 120 36.8
239.4 11 240 20.2 240 31.2
LIVER concentration-time curve
15.72 42.5 15.72 55.8 15 98.3
28.86 80.6 30.18 99.4 30 180
60.6 86.4 60.6 106 60 192.4
119.4 27.5 119.4 40.8 120 68.3
238.8 20.5 240 27.2 240 47.7
477.6 2.15 478.8 2.86 480 5.01
LUNG concentration-time curve
14.76 925 16.08 989 15 1914
30.84 381 30.84 466 30 847
60.6 162 61.8 226 60 388
120.6 70.6 121.8 106 120 176.6
240 28.3 240 42.4 240 70.7
480 35.3 481.2 42.4 480 77.7

Optimization of the cumulative risk assessment of pesticides and biocides using computational techniques: Pilot project 175
S(+) form R(-)form S(+) + R(-)
time conc. time conc. time total conc.
[min] [µmol/l] [min] [µmol/l] [min] [µmol/l]
SPLEEN concentration-time curve
15.12 48.1 15.72 52.9 15 101
29.52 101 30.18 112 30 213
59.7 55.4 60.6 80.2 60 135.6
120 12.8 120.6 24.1 120 36.9
240 16 240 27.3 240 43.3
FAT concentration-time curve
13.14 50.5 14.46 47.7 15 98.2
28.92 73 28.92 63.2 30 136.2
59.22 194 59.22 170 60 364
239.4 171 239.4 171 240 342
480 4.21 480 11.2 480 15.41
MUSCLE concentration-time curve
14.76 3.25 14.76 4.67 15 7.92
30.18 5.08 30.18 5.89 30 10.97
59.76 12.7 60.6 15.5 60 28.2
120 8.33 120 13.9 120 22.23
240 4.47 240.6 7.61 240 12.08
PLASMA concentration-time curve
6 36.1 4.026 24.5 5 60.6
14.04 31.5 14.1 21.7 15 53.2
32.1 25.2 30.18 18.5 30 43.7
60 16.5 58.38 13.2 60 29.7
120.6 7.07 118.8 7.46 120 14.53
237 1.31 239.4 2.89 240 4.2
479.4 0.193 481.2 1.68 480 1.873

176 Optimization of the cumulative risk assessment of pesticides and biocides using computational techniques: Pilot project
Excretion data for prochoraz and predominantly for metabolites from DAR (European Commission, 2010e) Table A8.6. Collection of data from single dose groups using oral bolus dose administration to rat, measured at different time points.
Dose: 10 mg/kg BW = 6.64 µmol Scaled to
98% recov.
male time urine bile feaces cage wash bile+feaces
tot. excr. tissues total tot. excr.
N animals [hr] [%] [%] [%] [%] [%] [%] [%] [%]
5 24 14.8 47.3 14.3 1.2 61.6 77.6 11.9 89.5
1 48 37.7 47.9 0.0 47.9 85.6 5.1 90.7
5 168 45.0 40.9 7.2 40.9 93.1 0.4 93.5
[hr] [µmol] [µmol] [µmol] [µmol] [µmol] [µmol] [µmol] [µmol] [µmol]
5 24 0.98 3.14 0.95 0.08 4.09 5.15 0.79 5.94 5.71
1 48 2.50 3.18 0.00 3.18 5.68 0.34 6.02 6.17
5 168 2.99 2.71 0.48 2.71 6.18 0.03 6.21 6.48
female time urine bile feaces cage wash bile+feaces
tot. excr. tissues total tot. excr.
N animals [hr] [%] [%] [%] [%] [%] [%] [%] [%]
5 24 6.4 52.1 9.7 0.5 61.8 68.7 15.2 83.9
5 168 29.2 59.5 5.6 59.5 94.3 0.5 94.8
[hr] [µmol] [µmol] [µmol] [µmol] [µmol] [µmol] [µmol] [µmol] [µmol]
5 24 0.42 3.46 0.64 0.03 4.10 4.56 1.01 5.57 5.50
5 168 1.94 3.95 0.37 3.95 6.26 0.03 6.29 6.47
Dose: 100 mg/kg BW = 66.4 µmol Scaled to
98% recov.
male time urine bile feaces cage wash bile+feaces
tot. excr. tissues total tot. excr.
N animals [hr] [%] [%] [%] [%] [%] [%] [%] [%]
1 48 51.2 28.8 0.0 28.8 80.0 4.0 84.0
5 168 54.0 37.2 10.0 37.2 101.2 0.5 101.7
[hr] [µmol] [µmol] [µmol] [µmol] [µmol] [µmol] [µmol] [µmol] [µmol]
1 48 34.0 19.1 0.0 19.1 53.1 2.7 55.7 62.4
5 168 35.8 24.7 6.6 24.7 67.2 0.3 67.5 64.7

Optimization of the cumulative risk assessment of pesticides and biocides using computational techniques: Pilot project 177
Table A8.7. Accumulated excretion for 4 male rats in a multiple dose experiment using oral bolus dose administration is shown below. 0.23% of the dose was found in tissues (0.10% skin, 0.07% liver, 0.04% gut content and 0.02% blood cells) and 0.18% in carcass 168 hrs after administration of labelled dose.
Multiple dose. 14 unlabeled 100 mg/kg/day and
1 labeled 100 mg/kg/day on day 15 = 66.4 µmol/day
time urine faeces cage wash total total
[hr] [% dose] [% dose] [% dose] [% dose] [µmol]
6 9.43
12 21.13
24 49.81 13.75 63.56 42.2
48 65.21 21.57 86.78 57.6
72 69.56 23.5 93.06 61.8
96 70.64 23.79 94.43 62.7
120 71.27 23.94 95.21 63.2
144 71.65 24.02 95.67 63.5
168 71.89 24.08 0.84 96.81 64.2

178 Optimization of the cumulative risk assessment of pesticides and biocides using computational techniques: Pilot project
Whole blood concentration of prochloraz and metabolites from DAR (European Commission, 2010e) Table A8.8. Total radioactivity measured as ng equivalent/ ml, mean from 5 male and 5 female animals at each time point after oral bolus dose administration to rats.
Dose 10 mg/kg bw
Gender male female
Time Cblood +/- Cblood +/- Cblood +/- Cblood +/-
[hr ] [ng/mL] [ng/mL] [µmol/l] [µmol/l] [ng/mL] [ng/mL] [µmol/l] [µmol/l]
0.25 559 304 1.48 0.81 341 64.9 0.91 0.17
0.5 1290 405 3.42 1.08 586 104 1.56 0.28
1 2270 674 6.03 1.79 897 137 2.38 0.36
2 4610 1360 12.24 3.61 1560 170 4.14 0.45
3 6680 1970 17.73 5.23 2200 513 5.84 1.36
4 8490 2550 22.54 6.77 2820 871 7.49 2.31
6 10600 2730 28.14 7.25 3320 1390 8.81 3.69
8 10400 3430 27.61 9.11 2820 1080 7.49 2.87
12 8210 3040 21.79 8.07 2310 868 6.13 2.30
24 3700 1660 9.82 4.41 970 374 2.57 0.99
48 572 352 1.52 0.93 311 107 0.83 0.28
96 134 38.8 0.36 0.10 114 43.5 0.30 0.12
120 100 54.1 0.27 0.14 84.2 37.6 0.22 0.10
168 49.8 11.3 0.13 0.03 46.4 19.7 0.12 0.05
Dose 100 mg/kg bw
Gender male
female
Time Cblood +/- Cblood +/- Cblood +/- Cblood +/-
[hr ] [ng/mL] [ng/mL] [µmol/l] [µmol/l] [ng/mL] [ng/mL] [µmol/l] [µmol/l]
0.25 4840 932 12.85 2.47 1599 431 4.24 1.14
0.5 10000 2080 26.55 5.52 3120 271 8.28 0.72
1 18900 3650 50.17 9.69 4480 376 11.89 1.00
2 34300 4740 91.05 12.58 6700 696 17.79 1.85
3 46700 5110 123.97 13.57 10200 1490 27.08 3.96
4 56600 7060 150.25 18.74 13300 1820 35.31 4.83
6 72700 4180 192.99 11.10 20800 3990 55.22 10.59
8 76800 7930 203.88 21.05 26900 5730 71.41 15.21
12 85500 14000 226.97 37.16 31100 8680 82.56 23.04
24 52700 7940 139.90 21.08 19400 5560 51.50 14.76
48 6850 1620 18.18 4.30 4470 878 11.87 2.33
96 1300 293 3.45 0.78 1510 511 4.01 1.36
120 1020 481 2.71 1.28 917 179 2.43 0.48
168 387 105 1.03 0.28 581 239 1.54 0.63

Optimization of the cumulative risk assessment of pesticides and biocides using computational techniques: Pilot project 179
Appendix 9: Supplementary information for dietary and dermal exposures scenarios
The dietary exposure scenarios are based on finding of pesticides residues in commodities on the sold on the Danish marked, based on samples taken by the pesticide control unit of theDanish Veterinary and Food Administration. The yearly reports from 2009 and 2011, show that tebuconazole and prochloraz residues were only found in fruit and vegetables(Jensen et al., 2010; Jensen et al., 2011; Jensen et al., 2012), see Tables A5.1 and A5.2. The dermal exposure scenarios used in this reported have been based on exposure assessments made by the Danish EPA. Data for solvent based tebuconzole biocide formulations used for industrial pre-treatment of wood and for professional brush application are given in Table A5.3. Data for an oil-water based tebuconazole pesticide formulation, used for spraying on fields for agricultural use are listed in Table A5.2. Assessment for the pesticide product has been made with and without gloves for protection of hands. Protection due to the use of gloves was not applied in the exposure assessment of the biocide products. Table A9.1. Number of samples taken (#samples) and samples positively detected with tebuconazole residues
(#pos.) in the years 2009-2011. The data were taken from reports over finding of pesticide residues in food by
the pesticide monitoring program and DTU (Jensen et al., 2010; Jensen et al., 2011; Jensen et al., 2012).
2011 2010 2009
#samples #pos. #samples #pos. #samples #pos.
Abrikos 5 1 1 1
Blomme 45 3
46 2
Citron
51 1
Courgette
7 1
Fersken 18 2 26 8 21 3
Grapefrugt 53 2
Gulerod
17 1
Kirsebær
5 1
Kiwi 50 1
Lime
5 1
Melon 44 1
Nektarin 33 4 27 6 31 7
Papaya
18 1
Peberfrugt 56 2 52 1
Salat
30 1
Tomat 29 3 29 1 39 1
Vindrue 52 4 66 2 84 3
Ærter m. bælg 15 5 6 2 5 1
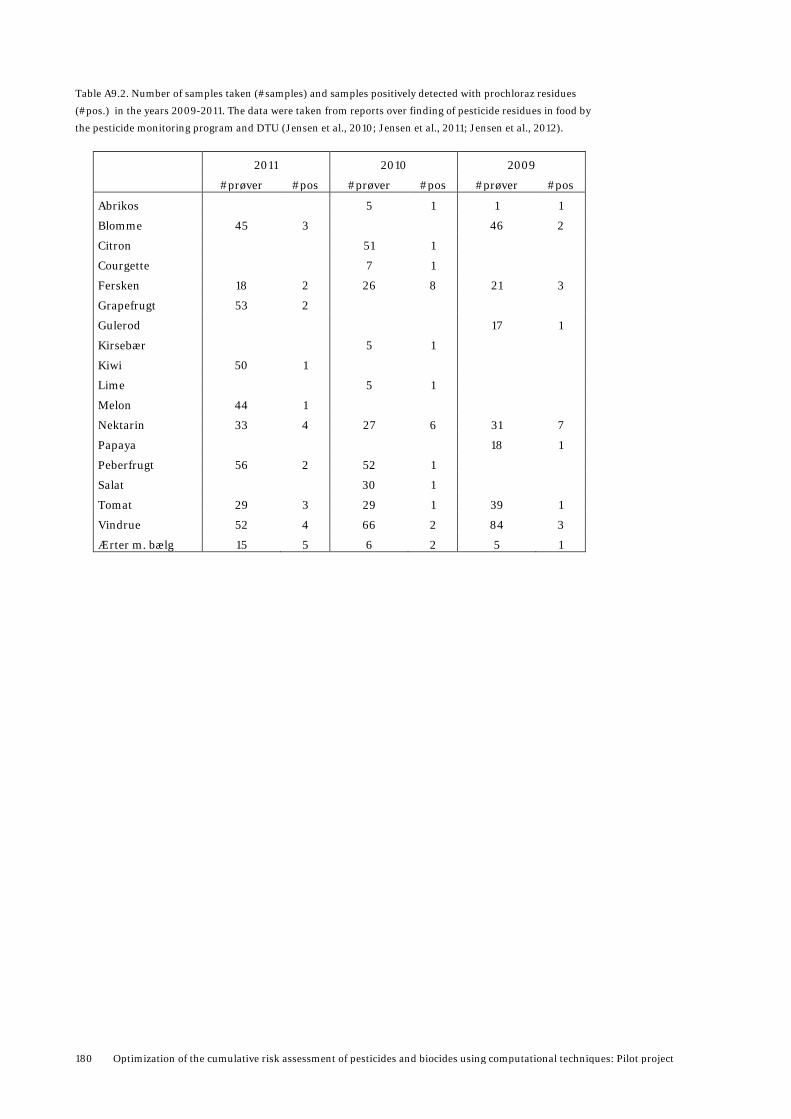
180 Optimization of the cumulative risk assessment of pesticides and biocides using computational techniques: Pilot project
Table A9.2. Number of samples taken (#samples) and samples positively detected with prochloraz residues
(#pos.) in the years 2009-2011. The data were taken from reports over finding of pesticide residues in food by
the pesticide monitoring program and DTU (Jensen et al., 2010; Jensen et al., 2011; Jensen et al., 2012).
2011 2010 2009
#prøver #pos #prøver #pos #prøver #pos
Abrikos 5 1 1 1
Blomme 45 3
46 2
Citron
51 1
Courgette
7 1
Fersken 18 2 26 8 21 3
Grapefrugt 53 2
Gulerod
17 1
Kirsebær
5 1
Kiwi 50 1
Lime
5 1
Melon 44 1
Nektarin 33 4 27 6 31 7
Papaya
18 1
Peberfrugt 56 2 52 1
Salat
30 1
Tomat 29 3 29 1 39 1
Vindrue 52 4 66 2 84 3
Ærter m. bælg 15 5 6 2 5 1

Optimization of the cumulative risk assessment of pesticides and biocides using computational techniques: Pilot project 181
Table A9.3. Exposure assessments for industrial timber pre-treatment and professional brush application using
solvent based formulation, calculated from values provide by the Danish EPA. Indicative value for potential
body and hand exposure, duration of exposure, penetration through clothing and gloves, have been estimated as
part of the Danish EPAs risk assessment of biocide products base on data from (Garrod et al., 1999; Garrod and
et al., 2000). Active substance concentration of 0.5 % (w/w) is typical concentration of such concentration of
biocide products on the Danish marked.
Type of treatment Industrial timber Professional
pre-treatment brush application
Formulation Solvent based Solvent based
Unit IPBC IPBC
Active substance % (w/w) 0,5 0,5
Potential body exposure
Indicative value [mg/min] 3,8 1,12
Duration [min] 240 180
Potential dermal deposit [mg] 912 201,6
Clothing type Coated overalls Light clothing
Clothing penetration [%] 10 50
Actual dermal deposit [product] [mg] 91,2 100,8
Hand exposure
Indicative value [mg/min] 1,17 9,14
Duration [min] 240 180
Potential dermal deposit [mg] 281 1645
Migation by gloves [%] 100 100
Actual dermal deposit [product] [mg] 281 1645
Total dermal exposure
Total dermal deposit [mg] 372 1746
Acitve substance [mg] 1,86 8,73
Dermal absorption [%] 15,7 15,7
Systemic exposure via dermal route [mg] 0,292 1,37
Systemic exposure via dermal route [µmol] 0,949 4,45
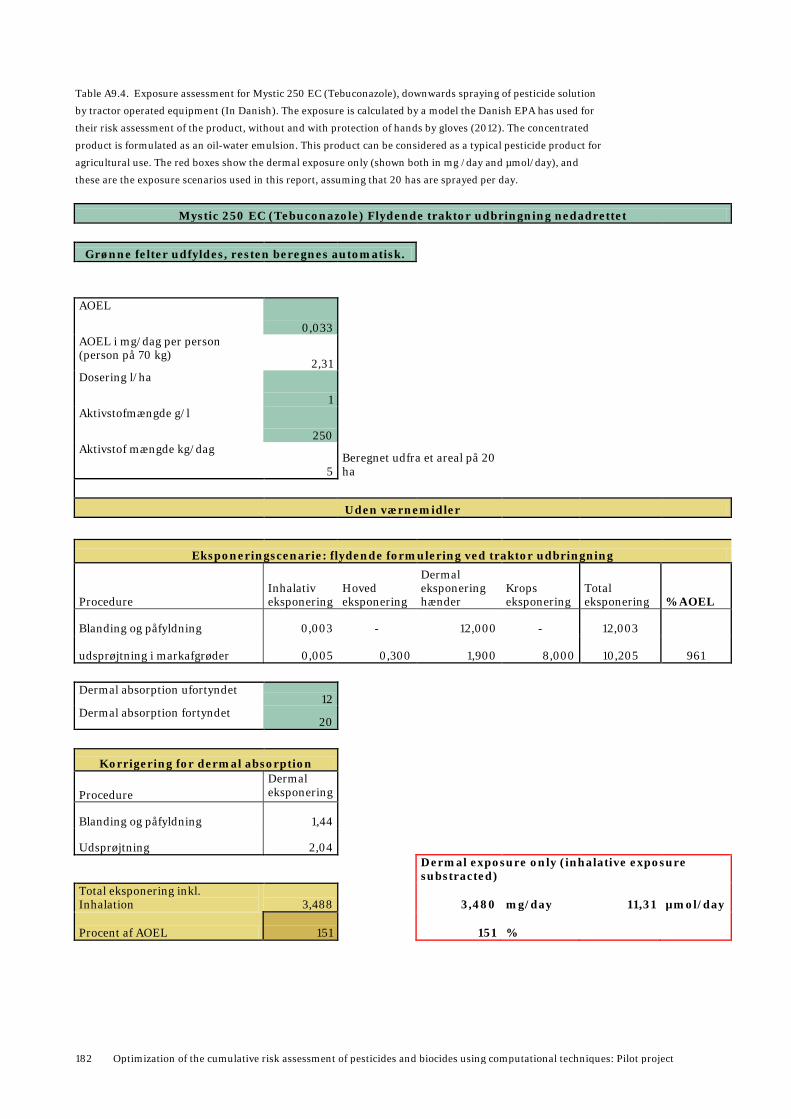
182 Optimization of the cumulative risk assessment of pesticides and biocides using computational techniques: Pilot project
Table A9.4. Exposure assessment for Mystic 250 EC (Tebuconazole), downwards spraying of pesticide solution
by tractor operated equipment (In Danish). The exposure is calculated by a model the Danish EPA has used for
their risk assessment of the product, without and with protection of hands by gloves (2012). The concentrated
product is formulated as an oil-water emulsion. This product can be considered as a typical pesticide product for
agricultural use. The red boxes show the dermal exposure only (shown both in mg /day and µmol/day), and
these are the exposure scenarios used in this report, assuming that 20 has are sprayed per day.
Mystic 250 EC (Tebuconazole) Flydende traktor udbringning nedadrettet
Grønne felter udfyldes, resten beregnes automatisk.
AOEL
0,033 AOEL i mg/dag per person
(person på 70 kg) 2,31
Dosering l/ha
1 Aktivstofmængde g/l
250 Aktivstof mængde kg/dag
5 Beregnet udfra et areal på 20 ha
Uden værnemidler
Eksponeringscenarie: flydende formulering ved traktor udbringning
Procedure Inhalativ eksponering
Hoved eksponering
Dermal eksponering hænder
Krops eksponering
Total eksponering % AOEL
Blanding og påfyldning 0,003 - 12,000 - 12,003
961 udsprøjtning i markafgrøder 0,005 0,300 1,900 8,000 10,205
Dermal absorption ufortyndet 12
Dermal absorption fortyndet 20
Korrigering for dermal absorption
Procedure Dermal eksponering
Blanding og påfyldning 1,44
Udsprøjtning 2,04
Dermal exposure only (inhalative exposure substracted)
Total eksponering inkl. Inhalation 3,488
3,480 mg/day 11,31 µmol/day
Procent af AOEL 151
151 %

Optimization of the cumulative risk assessment of pesticides and biocides using computational techniques: Pilot project 183
Med værnemidler
Med handskefaktor på 60 % ved udsprøjtning og 90 % ved opblanding
Procedure Inhalativ eksponering
Hoved eksponering
Dermal eksponering hænder
Krops eksponering
Total eksponering % AOEL
Blanding og påfyldning 0,003 - 1,200 - 1,203
445 udsprøjtning i markafgrøder 0,005 0,300 0,760 8,000 9,065
Dermal absorption ufortyndet 12 Dermal absorption fortyndet 20
Korrigering for dermal absorption
Procedure Dermal eksponering
Blanding og påfyldning 0,144
udsprøjtning 1,812
Dermal exposure only (inhalative exposure substracted)
Total eksponering inkl. inhalation 1,964
1,956 mg/day 6,35 µmol/day
Procent af AOEL 85
85 %

Strandgade 29 DK - 1401 Copenhagen K Tel.: (+45) 72 54 40 00
www.mst.dk
Optimization of the cumulative risk assessment of pesticides and biocides using computational techniques: Pilot project This pilot project is intended as the first step in developing a computational strategy to assist in refining methods for higher tier cumulative and aggregate risk assessment of exposure to mixture of pesticides and biocides. For this purpose, physiologically based toxicokinetic (PBTK) models were developed for two compounds, tebuconazole and prochloraz, and a binary mixture of these compounds in two species, rat and human. PBTK models can be used to estimate the concentration levels (internal doses) of toxic substances and their metabolites in blood and tissue, by a collection of differential equations, and parameters describing species physiology and ADME (absorption, distribution, metabolism and elimination) characteristics of the chemicals. Sufficient data were found to determine the parameters needed for the PBTK model development. The PBTK models were validated on plasma and tissue concentration level data of tebuconazole in rabbit, and in most cases the predictions were seen to be within a factor of two compared to the experimental data. Also simple blood concentration measurements for both compounds from a mixture study in rat, and other data were used to validate and evaluate the models. Exposure scenarios were constructed based on findings of pesticide residues in food of ordinary consumers, and assessment of dermal exposure of professional workers. PBTK simulations were carried using these scenarios.