optimization of the power transformer dry-out process in ... 9 15 am... · process in the field...
TRANSCRIPT

1
Optimization of the Power Transformer Dry-out Process in the Field
Application of Advanced Diagnostic Technologies
Authors: Diego M. Robalino, Ph.D. & Peter Werelius, Ph.D.
Dallas, TX – September 11-13, 2013

2
DFR - Application
Determine moisture concentration in solid insulation
Determine degree of contamination in the liquid insulation
Determine presence of contaminants and non-typical responses
Determine dissipation factor thermal behavior
3
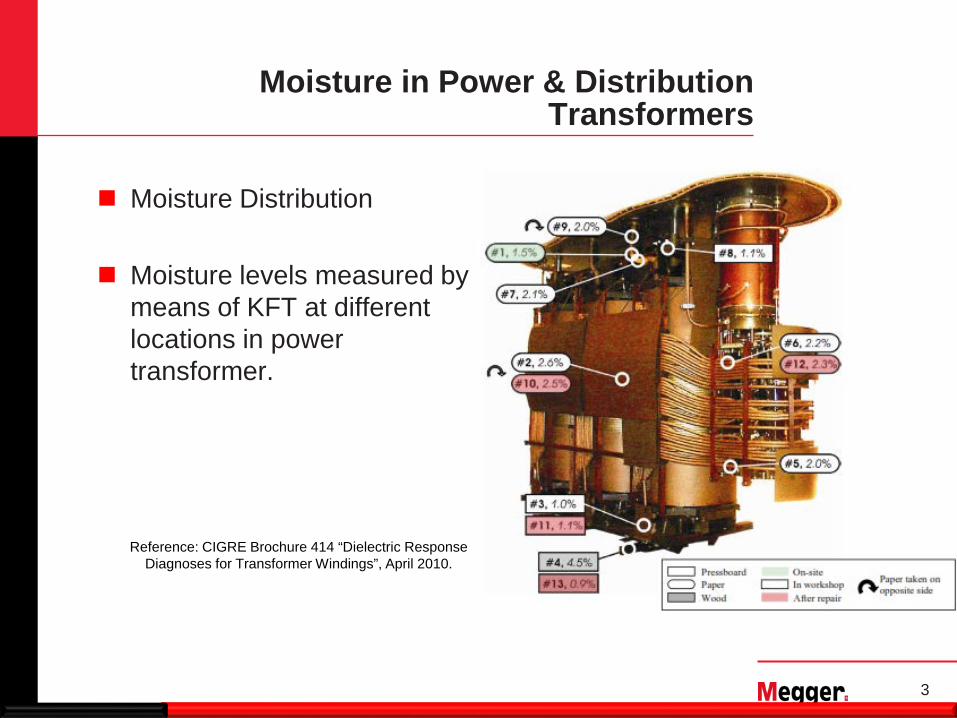
Moisture in Power & Distribution Transformers
Moisture Distribution
Moisture levels measured by
means of KFT at different locations in power transformer.
Reference: CIGRE Brochure 414 “Dielectric Response Diagnoses for Transformer Windings”, April 2010.
4
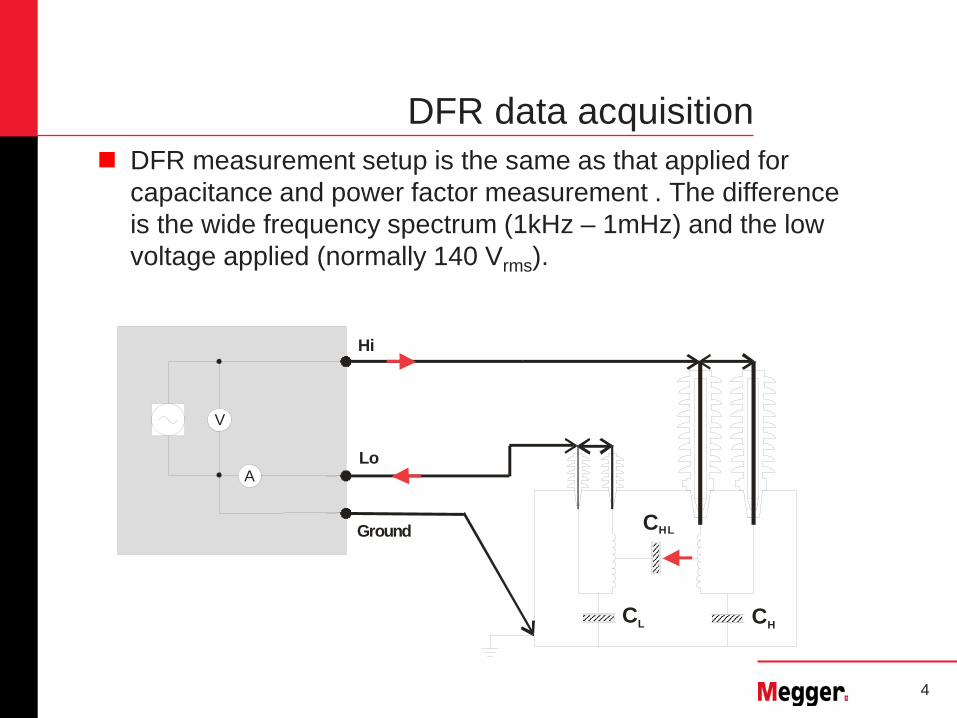
DFR data acquisition DFR measurement setup is the same as that applied for
capacitance and power factor measurement . The difference is the wide frequency spectrum (1kHz – 1mHz) and the low voltage applied (normally 140 Vrms).
V
A
Hi
Lo
Ground CHL
CL CH

5
Typical curve: OIL only response
6
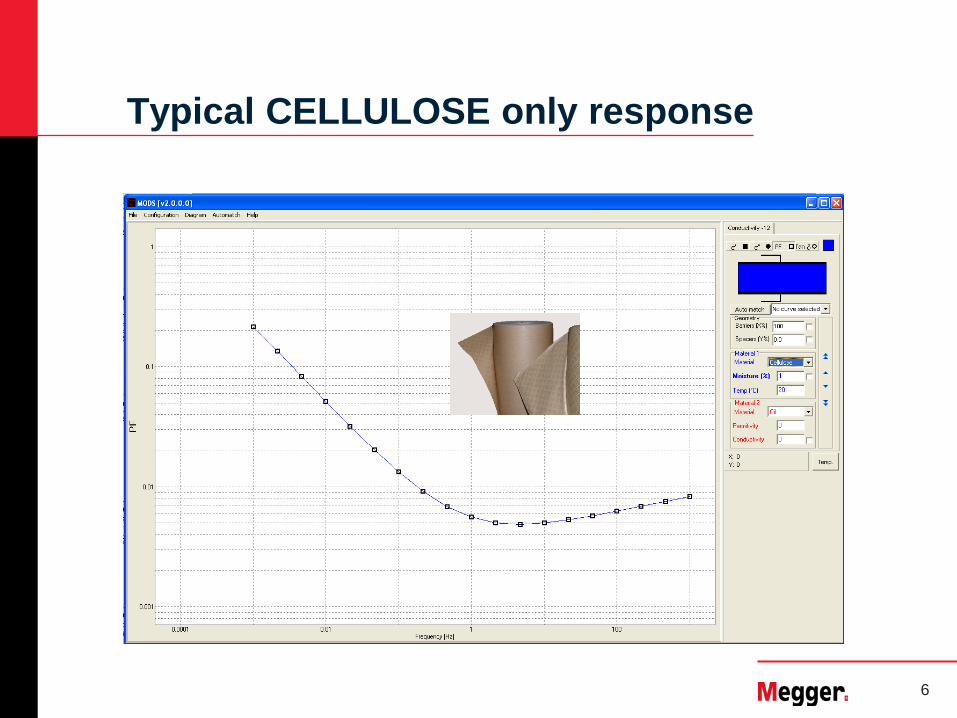
Typical CELLULOSE only response
7
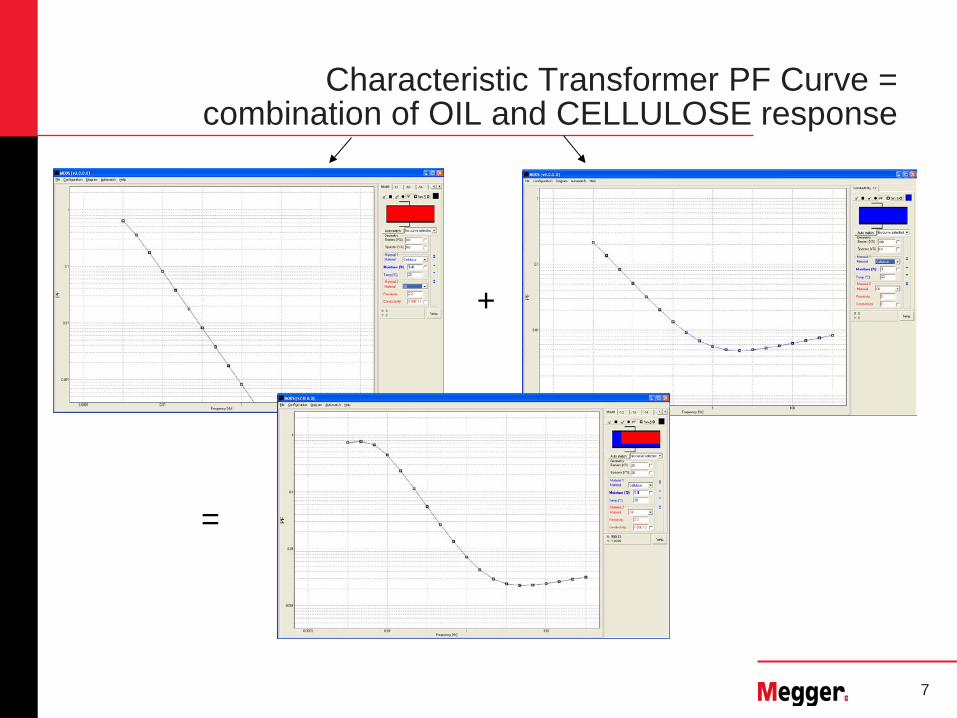
Characteristic Transformer PF Curve = combination of OIL and CELLULOSE response
+
=
8
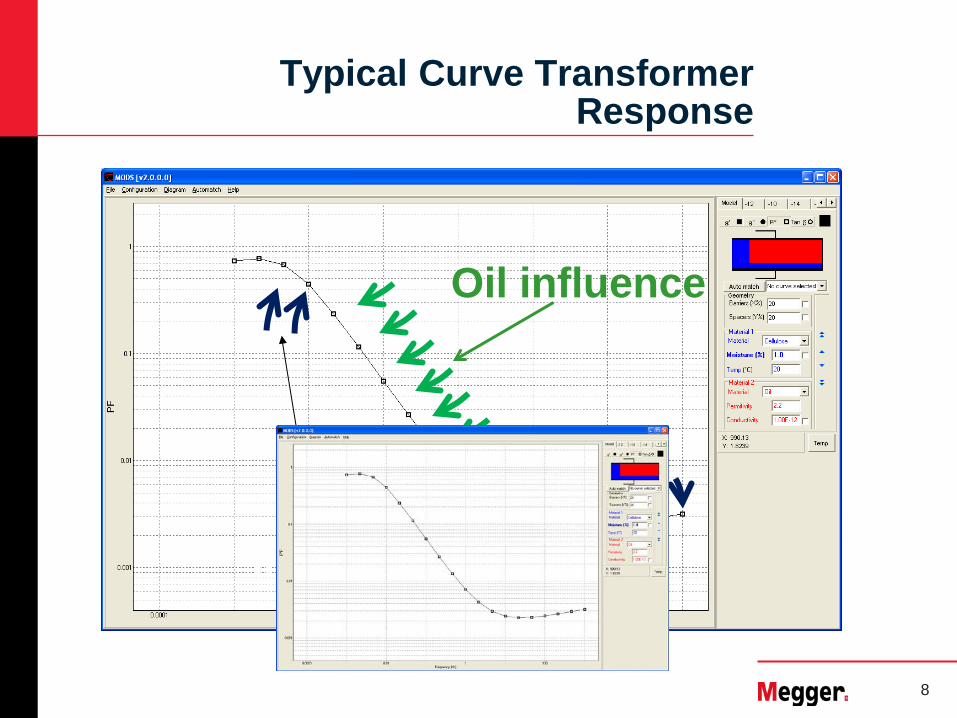
Typical Curve Transformer Response
Paper influence
Oil influence

9
Factors affecting the curve distribution
Good understanding of the factors that may influence the measurements under field conditions is of crucial importance for the diagnosis reliability.
• Constant and preferably not too low temperature is advantageous for the interpretation quality – at higher temperatures the time necessary for the measurements can be shortened.
• It is recommended to make CHL measurements between main transformer windings.
• In the case of CH and CL measurements, it is also important to make sure that the transformer bushings are dry and clean, and good grounding connection is in place.
10
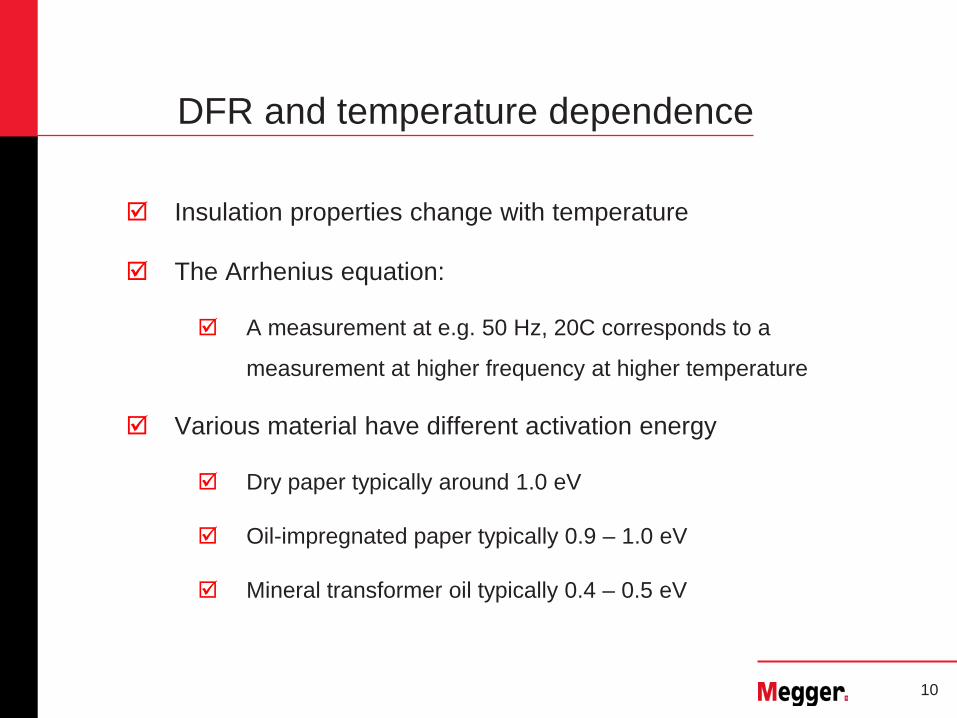
DFR and temperature dependence
Insulation properties change with temperature
The Arrhenius equation:
A measurement at e.g. 50 Hz, 20C corresponds to a
measurement at higher frequency at higher temperature
Various material have different activation energy
Dry paper typically around 1.0 eV
Oil-impregnated paper typically 0.9 – 1.0 eV
Mineral transformer oil typically 0.4 – 0.5 eV
11
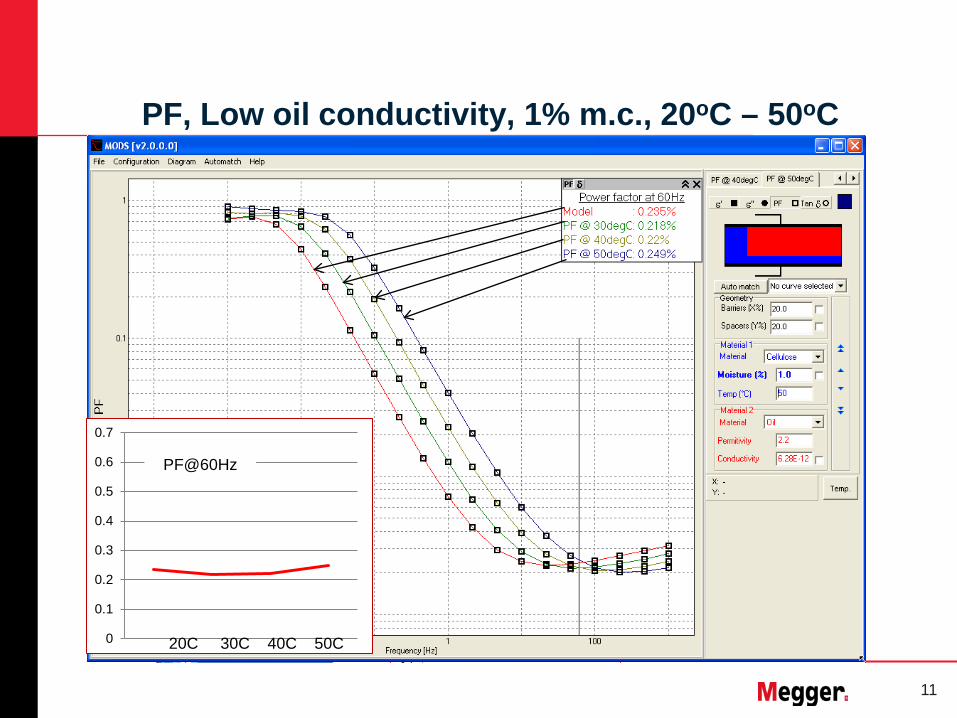
0
0.1
0.2
0.3
0.4
0.5
0.6
0.7
20C 30C 40C 50C
PF@60Hz
PF, Low oil conductivity, 1% m.c., 20oC – 50oC
12
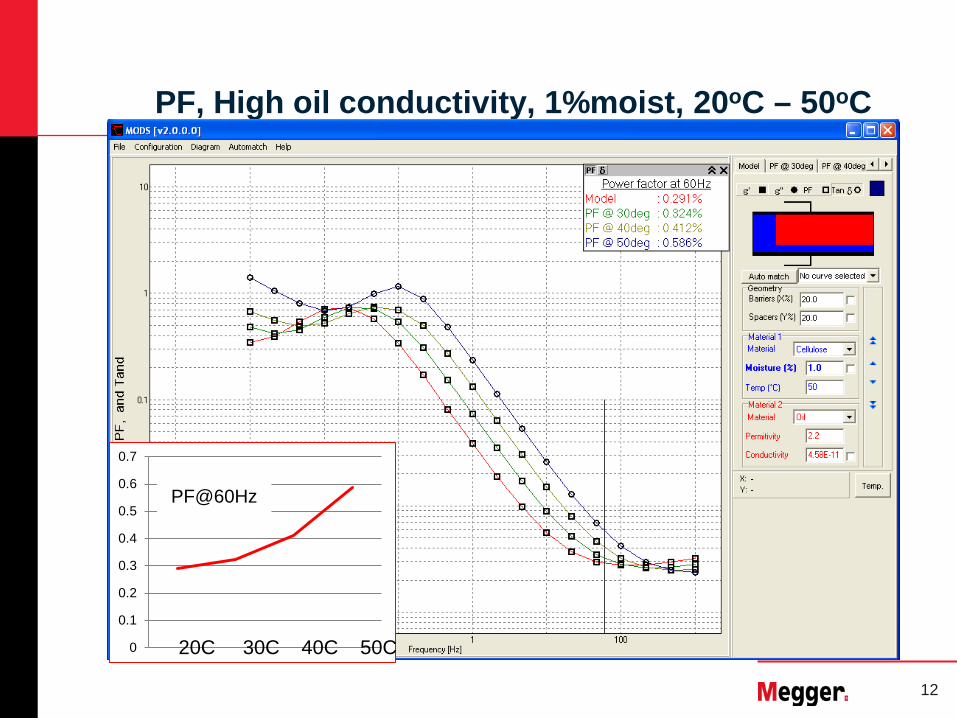
PF, High oil conductivity, 1%moist, 20oC – 50oC
0
0.1
0.2
0.3
0.4
0.5
0.6
0.7
20C 30C 40C 50C
PF@60Hz

13
Each point corresponds to a measured Power Factor
value at constant Temperature and known
frequency value!
CHL
Frequency
Pow
er F
acto
r
0.1 %
1 %
10 %
100 %
0.001 Hz
P.F. @ 0.001 Hz
60 Hz
P.F. @ 60 Hz
1000 Hz
P.F. @ 1000 Hz
Dielectric Frequency Response Measurement
14
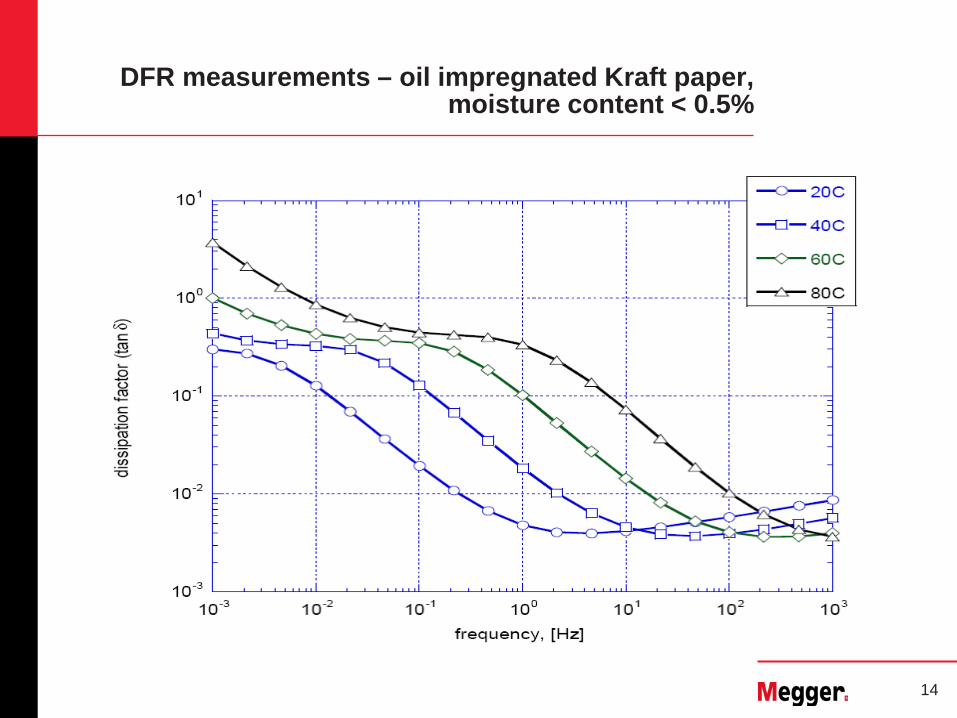
DFR measurements – oil impregnated Kraft paper, moisture content < 0.5%

15
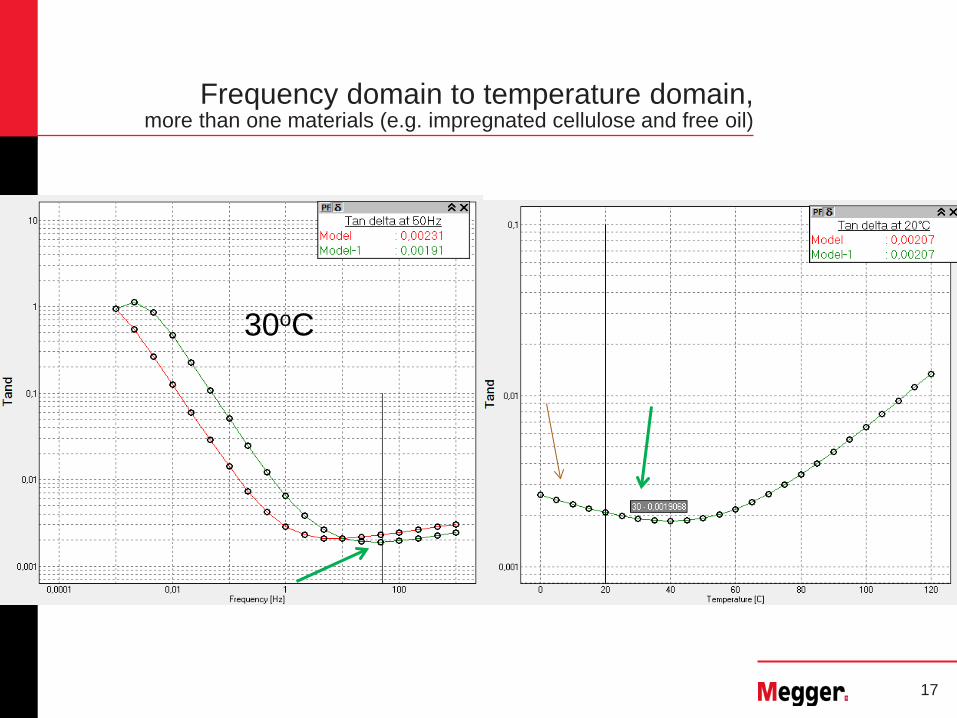
Frequency domain to temperature domain, more than one materials (e.g. impregnated cellulose and free oil)
Example (E-cellulose=0.9eV, E-oil= 0.5eV): Below is an example how a frequency sweep is transformed into temperature domain based on the procedure above
10oC
DF(w, T2) = DF(w/Axy(T1, T2), T1)

16
Frequency domain to temperature domain, more than one materials (e.g. impregnated cellulose and free oil)
20oC
17
Frequency domain to temperature domain, more than one materials (e.g. impregnated cellulose and free oil)
30oC

18
Frequency domain to temperature domain, more than one materials (e.g. impregnated cellulose and free oil)
40oC

19
Frequency domain to temperature domain, more than one materials (e.g. impregnated cellulose and free oil)
50oC
20
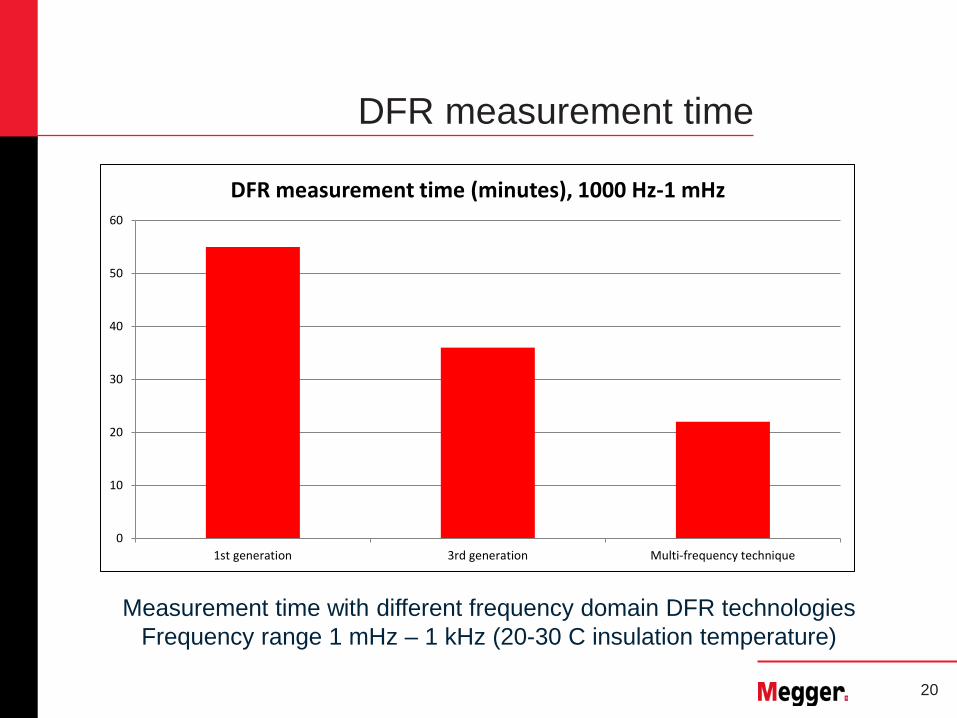
DFR measurement time
Measurement time with different frequency domain DFR technologies Frequency range 1 mHz – 1 kHz (20-30 C insulation temperature)
0
10
20
30
40
50
60
1st generation 3rd generation Multi-frequency technique
DFR measurement time (minutes), 1000 Hz-1 mHz
21
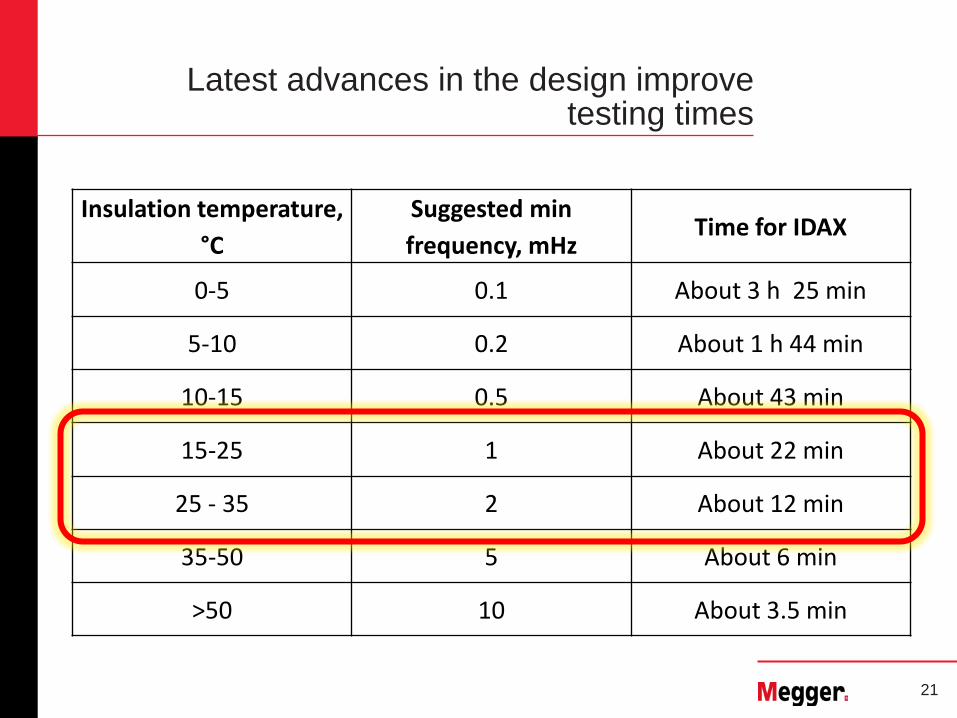
Latest advances in the design improve testing times
Insulation temperature, °C
Suggested min frequency, mHz
Time for IDAX
0-5 0.1 About 3 h 25 min
5-10 0.2 About 1 h 44 min
10-15 0.5 About 43 min
15-25 1 About 22 min
25 - 35 2 About 12 min
35-50 5 About 6 min
>50 10 About 3.5 min
22
1 mHz 60 Hz 1kHz
Fact
or d
e di
sipa
ción
Frequency
FDS: From one single measurement at line frequency

23
DFR – Special Applications
Contamination analysis Dry-out / impregnation monitoring Oil Immersed CTs Bushings
24
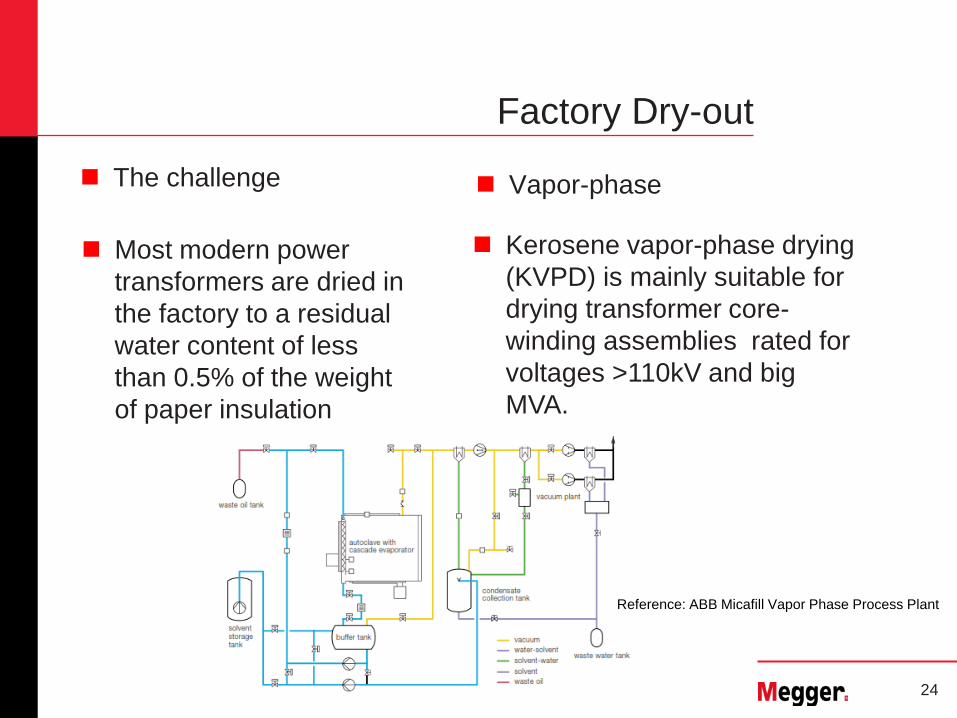
Factory Dry-out
Most modern power transformers are dried in the factory to a residual water content of less than 0.5% of the weight of paper insulation
The challenge Vapor-phase
Reference: ABB Micafill Vapor Phase Process Plant
Kerosene vapor-phase drying (KVPD) is mainly suitable for drying transformer core-winding assemblies rated for voltages >110kV and big MVA.
25
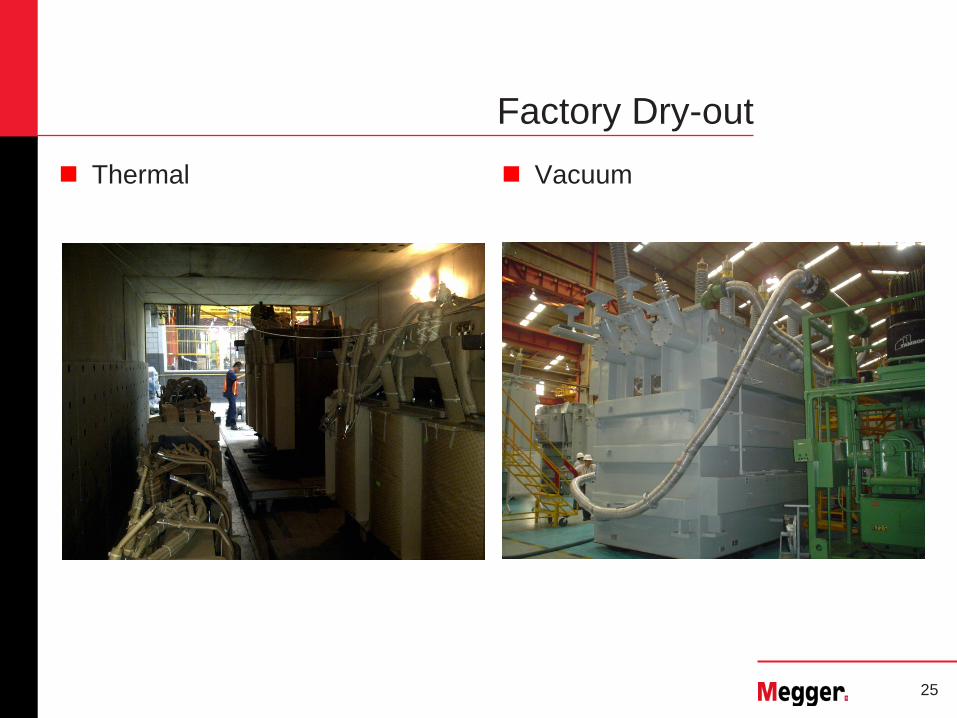
Factory Dry-out Thermal Vacuum

26
Factory Dry-out Evaluation
Dew-Point Test: Dew point measurement of
the nitrogen (ASTM D-1933 Type III) in the tank space provide an estimate of the average surface water content of the cellulose insulation after reaching steady-state temperatures.
Test duration is from 12 – 24h or until steady state has been reached.
Reference: IEEE Std C57.93™-2007 (Revision of IEEE Std C57.93-1995)

27
Field Dry-out
There are several mechanisms applicable for field dry-out of power transformers.
A simple way to differentiate the efficiency of the mechanism is by understanding the velocity of the process.
Reference: P. Koestinger, E. Aronsen, P. Boss, G. Rindlisbacher, “Practical Experience with the drying of Power transformers in the field, applying LFH Technology,” CIGRE,
Session 2004, A2-205.

28
Typical Field Dry-out Process
The combination of heat and vacuum is a typical and quite efficient approach to extract moisture from the cellulose
Heat is applied by means of hot oil spray or hot oil recirculation and fast removal. The process also performs filtration, dehydration and degasification of the liquid insulation
Reference: BARON USA, G. Stevens. Weidmann/PROLEC Seminar 2012.

29
DFR Monitoring During Field Dry-out
5MVA transformer, 69/12.5kV, Dyn1.
%DF = 0.9% @ 20°C. DFR results confirmed the
presence of 3.5% moisture in the cellulose and insulation liquid conductivity value of 1.5•10-12 S/m.
The experimental unit DFR before process
30
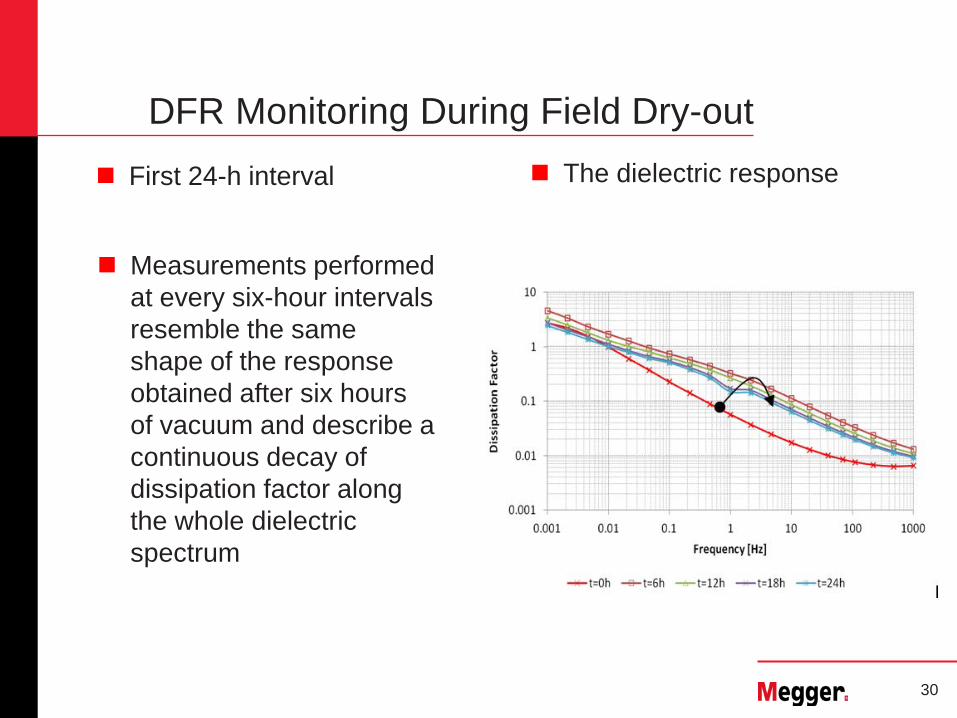
DFR Monitoring During Field Dry-out
Measurements performed at every six-hour intervals resemble the same shape of the response obtained after six hours of vacuum and describe a continuous decay of dissipation factor along the whole dielectric spectrum
First 24-h interval The dielectric response

31
DFR Monitoring During Field Dry-out
Once the process is observed to have low or non efficiency, this is a clear indication for the operators to re-heat the core and windings and initiate a new vacuum cycle
Another 30h vacuum The dielectric response

32
DFR Monitoring During Field Dry-out
Final response during the thermal-vacuum process
Immersed in oil and after 2 weeks operation
33
Conclusions: DFR/FDS
Dielectric Frequency Response (DFR) also known as Frequency Domain Spectroscopy (FDS) is an advanced application of the dissipation factor (tanδ) insulation test.
DFR discriminates between the moisture concentration in the solid insulation and the contamination of the liquid insulation.
The DFR instrumentation utilized in the field has evolved to overcome the field challenges such as: testing time constraints and the effect of AC and/or DC induced noise in the substations.
DFR provides accurate temperature correction of the 60Hz power factor value not based on reference tables but on the unique dielectric response of the tested insulation system.

34
Conclusions: Transformer Field Dry-out DFR Application
The application of DFR in the field during dry-out process is relevant.
• It shows the point where the process reduces efficiency and slows down the moisture extraction
DFR provides a bulk average value of %moisture concentration in the insulation investigated.
• Other practices may involve the analysis of surface insulation and/or removal of samples that may affect the insulation integrity.
DFR is a low voltage advances application of power factor testing where the modeling tools allow the operator to monitor the %moisture concentration variation under thermal and/or vacuum conditions.
35
Applicable standards 2004 - CIGRE report 254, ”Dielectric Response Methods for
Diagnostics of Power Transformers” is published
2006 - Project REDIATOOL reported at CIGRE, recommending DFR as a preferred method for moisture assessment of power transformers
2009 - CIGRE Task Force D1.01.14 “Dielectric response diagnoses for transformer windings”
2011 – IEEE Transformer Committee first meeting of a TF to elaborate a DFR guide proposal – March 2012 – TF incorporated as part of the Dielectric Test Subcommittee
2013 – IEEE C57.152. Incorporated an informative section: Annex G : Dielectric Frequency Response

36
References

37
References

39
References U. Gäfvert, G. Frimpong, and J. Fuhr, ” Modeling of Dielectric Measurements on Power
Transformers”, paper 15-103, CIGRE session 1998. A. C. Gjaerde, L. Lundgaard, and E. Ildstad, “Effect of Temperature and Moisture on the
Dielectric Properties of Oil-Impregnated Cellulose”, paper 1060-1, Proc. of the ISH, 1995. V. Der Hauhanessian, Measurement and Analysis of Dielectric Response in Oil-Paper
Insulation Systems. Doctoral Thesis, Swiss Federal Institute of Technology Zurich, Diss. ETH. No. 12832, Zurich, 1998.
U. Gäfvert, L. Adeen, M. Tapper, P. Ghasemi, B. Jönsson, “Dielectric Spectroscopy in Time and Frequency Domain Applied to Diagnostics of Power Transformers”, Proc. Of the ICPADM, Xi’an, China, 2000.
S.M. Gubanski, J. Blennow, B. Holmgren, M. Koch, A. Kuechler, R. Kutzner, J. Lapworth, D. Linhjell, S. Tenbohlen, P. Werelius, ”Dielectric Response Diagnoses for Transformer Windings,” CIGRE WG D1.01 (TF 14), Brochure 414, 2010
Cheng, J. ; Werelius, P. ; Ohlen, M. “FEM analysis of the transformer insulation XY model,” Proceedings of the Transmission & Distribution conference, 2012
Ernst, W., Kau Ho, Levin, A. “Dry-out properties of insulating paper in distribution transformers”, Proceedings of the Conference on Electrical Insulation and Dielectric Phenomena (CEIDP), 2012
Valery G. Davydov, “Moisture Related Phenomena in Transformers and Reactors: Need for Development of a New Reference Document,” Proceeding TechCon North America 2012.
P. Koestinger, E. Aronsen, P. Boss, G. Rindlisbacher, “Practical Experience with the drying of Power transformers in the field, applying LFH Technology,” CIGRE, Session 2004, A2-205.