optimized electric propulsion system modeling and ... · optimized electric propulsion ... photo...
TRANSCRIPT

ISSN (Print) 2320 ndash 3765
ISSN (Online) 2278 ndash 8875
International Journal of Advanced Research in Electrical
Electronics and Instrumentation Engineering
(An ISO 3297 2007 Certified Organization)
Vol 3 Issue 12 December 2014
1015662ijareeie20140312014
Copyright to IJAREEIE wwwijareeiecom 13602
Optimized Electric Propulsion System
Modeling and Simulation with Low Voltage
DC Hybrid Power Systems
NVisali1 SNiranjan
2
Professor and HOD MTech PhD Dept of EEE JNTU Engineering College Pulivendula Kadapa AP India1
PG Student (EPS) Dept of EEE JNTU Engineering College Pulivendula Kadapa AP India2
ABSTRACT Electrification of ship propulsion system with hybrid power systems created interest in modeling of all
marine vessels Reduction in the emission of green house gases fuel consumption and efficient energy management
with improved system dynamic performance is possible with hybrid power systems With penetration of power
electronic converters into power systems ship board direct current distribution systems offer further more advantages
such as space weight saving and flexible arrangement of equipment On board marine vessel consists of synchronous
generator energy storage system fuel cell photo voltaic array and induction motor drive Power electronic converters
are modeled through detailed model Mechanical components are modeled with mathematical analysis approach Power
sharing among the proposed hybrid power system is observed in MATLABSimulink software
KEYWORDS Simulation DC distribution systems detailed modeling PVA module and vector (or) field oriented
control
NOMENCLATURE
A Curve fitting factor
d Instantaneous duty cycle
D Design value of duty cycle
dabc Switching functions of the inverter
Dp Propeller diameter
ESS Energy storage system
FC Fuel cell
PVA photo voltaic array
Kq Propeller torque coefficient
Kt Propeller thrust coefficient
m Modulation index
n Transformer turns ratio
Qp Propeller torque
Tp Propeller thrust
v Voltage
w Taylorlsquos wake fraction
ρ Water density
Flux linkage
e Electron charge (1602 times 10-19
C)
K Boltzmann constant (138 times 10-23
J0K)
Ic Cell output current A
Iph Photo current
I0 Reverse saturation current of diode (00002 A)
Tc Reference cell operating temperature (20 degC)
Vc Cell output voltage
SOC State of charge
I INTRODUCTION
Electrical installations are present in every marine vessel ranging from powering of communication and monitoring
systems running of different motors to high power electrical installation for electric propulsion [1]-[2] With the
possibility to control electrical motors with variable speed drives in a large power range with compact reliable and cost
competitive solutions the use of electrical propulsion has emerged in new application areas Electrification of
propulsion system brought us advantages like improved life cycle cost by reduced fuel consumption and maintenance
less propulsion noise and vibrations Less space consuming etc[3]-[5]
ISSN (Print) 2320 ndash 3765
ISSN (Online) 2278 ndash 8875
International Journal of Advanced Research in Electrical
Electronics and Instrumentation Engineering
(An ISO 3297 2007 Certified Organization)
Vol 3 Issue 12 December 2014
1015662ijareeie20140312014
Copyright to IJAREEIE wwwijareeiecom 13603
Now a daylsquos all electrical ships are enabled by hybrid power systems [6] Hybrid power systems use low calorie
renewable energy resources to generate electrical energy [7]-[9] In this paper hybrid power system incorporates a set
of primary and auxiliary energy sources in order to provide the propulsion power and at the same time to energize the
ship board electric loads A gas or diesel energy source comes under primary sources which are capable to drive both
propulsion and also ship loads Fuel cell photo voltaic and energy storage systems comes under auxiliary sources
which participate only in improving ship dynamic performance and also ship load system
Models are derived for different electrical and mechanical elements including the synchronous generatorndashrectifier
system inverter dcdc converters diesel engine propeller and ship hydrodynamics Power electronic converters are
modeled in detailed modeling to give an effective solution and to improve speed of simulation A simulation platform
is developed in MATLABSimulink for system-level studies of hybrid electric ships As a case study marine vessel is
simulated in different modes of operation The simulation results of a power sharing control among two diesel
generators a fuel cell unit photo voltaic array and an energy storage system show practical utility of such a simulation
tool in system studies associated with design evaluation power management
II SYSTEM CHARACTERISTICS AND OVERVIEW
Fig 1 Single line diagram of shipboard DC hybrid power system
The single line diagram of an overall system is shown in the above Fig 1 Modeling of system-level analysis of
ship dc distribution power systems requires specific features imposed by the system characteristics First of all there
are mechanical and electrical components in such a system with extremely different dynamics This difference ranges
from a very small time constant of a power electronic switch which is on the order of nanoseconds to a large time
constant of ship hydrodynamics which is tens of seconds Detailed switching models of power electronic converters
are considered hear Second for system level studies in which large variations occur in system states small signal or
linearized averaging is invalid and large signal models must be developed instead Third the interactions among
connected elements should be included in order for the system model to be realistic In other words each element
should receive the reaction of the connected elements as soon as it affects them
III MODELING OF POWER ELECTRONIC CONVERTERS
It is the power electronics area that brought a great change in technology of electric power industry Compared to
rotating commutation static conversion is more efficient and reliable The DC-DC converters are very prominent for
energy management in shipboard hybrid power systems [10] These converters are used to shift voltage from one level
to another among the dc distribution system Here we use two types of DC-DC converters a boost converter to step up
the voltage generated from fuel cell module and a boost type bidirectional converter for battery cell module
A DC-DC Boost Converter
ISSN (Print) 2320 ndash 3765
ISSN (Online) 2278 ndash 8875
International Journal of Advanced Research in Electrical
Electronics and Instrumentation Engineering
(An ISO 3297 2007 Certified Organization)
Vol 3 Issue 12 December 2014
1015662ijareeie20140312014
Copyright to IJAREEIE wwwijareeiecom 13604
Fig 2 Full-Bridge boost converter circuit
The step up dc to dc converter is basically called as boost converter [10] Topological circuit diagram of full bridge
boost converter is shown in above fig2 Here we can observe that when controllable switch (Sc) is in onlsquo state current
flows through inductor and it charges When switch is in offlsquo state the energy stored inductor and supply voltage
together gets voltage boost The amount of boosting voltage depends on duty cycle of controllable switch
B DC-DC Bi-Directional Converter
Fig 3 Full-Bridge bidirectional converter circuit
Most of the existing bidirectional dc-dc converters fall into the generic circuit structure illustrated in the above fig
3 which is characterized by a current fed or voltage fed on one side Based on the placement of the auxiliary energy
storage the bidirectional dc-dc converter can be categorized into buck and boost type [12] The buck type is to have
energy storage placed on the high voltage side and the boost type is to have it placed on the low voltage side [11] The
high frequency transformer based system is an attractive one to obtain isolation between the source and load sides
since transformer can isolate the voltage sources and provide the impedance matching between them
C Synchronous Machine-Rectifier System
Nearly all of the electrical power used throughout the world is generated by the synchronous machines driven
either by steam or hydraulic turbine or any combustion engines The synchronous machine is the principle means of
converting mechanical energy to electrical energy [13] Here we prefer d-q model to eliminate the dependency of
inductance on rotor position Since rotor field d and q-axis are already aligned in rotor coordinates it is only stator
voltages currents and flux linkages that have to be transformed to the rotor coordinates [14] This transformation is
done through parklsquos transformation valid for voltages currents and flux linkages
119875 120579119890119903 =2
3
cos(minus120579119890119903) cos(minus120579119890119903 +
2120587
3) cos(minus120579119890119903 minus
2120587
3)
sin(minus120579119890119903) sin(minus120579119890119903 +2120587
3) sin(minus120579119890119903 minus
2120587
3)
1
2
1
2
1
2
(1)
119907119889
119907119902
1199070
= 119875 120579119890119903
119907119860
119907119861
119907119862
1198681198891198681199021198680
= 119875 120579119890119903
119868119860119868119861119868119862
119889
119902
0
= 119875 120579119890119903
119860
119861
119862
(2)
ISSN (Print) 2320 ndash 3765
ISSN (Online) 2278 ndash 8875
International Journal of Advanced Research in Electrical
Electronics and Instrumentation Engineering
(An ISO 3297 2007 Certified Organization)
Vol 3 Issue 12 December 2014
1015662ijareeie20140312014
Copyright to IJAREEIE wwwijareeiecom 13605
Fig 4 SM-rectifier response to a step change at higher
loads
Fig5 SM-rectifier response to a step change at lower
loads
As a case study synchronous machine rectifier system is modeled in detailed model The response to a step change
in the higher loads (013 to 02) is also shown in the above fig 4 Similarly for a step change in the lower loads
(28 to 1) is observed here in the above fig 5 Modeling of the synchronous machine in the detailed model gives us
better precision than any other average value models with constant and also variable parameters
D Modeling of induction motor drive
Induction motor drives have been the work horses for variable speed applications ranging from fractional horse
power to multi-megawatt Modeling of induction motor drive is done in vector control method though scalar control
method is simple to implement due to its inherent coupling effect gives sluggish response and the system is prone to
instability A vector controlled induction motor drive operates like a separately exited dc motor drive [14]
IV MODELING OF PHOTO VOLTAIC ARRAY
Photo voltaic solar cells (PVSC) are emerging as a renewable green energy power source Use of solar energy
gives reduces fuel consumption and emission of green house gases Combined seriesparallel combinations of photo
voltaic solar cells which are usually represented by a simplified equivalent circuit model shown in below fig 6 or by
equation 3
Fig6 Simplified circuit of photo voltaic cell
119881119888 =119860119896119879119888
119890119897119899
119868119901ℎ +1198680minus119868119888
1198680 minus 119877119904119868119888 (3)
The above equation gives single solar cell voltage which is then multiplied by number of cells connected in series
to get full array voltage [15] The solar cell operating temperature varies as a function of solar irradiation and level and
ambient temperature (Ta) These effects are represented in the model by temperature coefficients CTV and CTI for cell
output voltage and current
119862119879119881 = 1 + 120573119879 119879119886 minus 119879119883 - (4)
1198621198791 = 1 +
120574119879
119878119888 119879119883 minus 119879119886 - (5)
Where βT = 0004 and γT = 006 for the cell used Ta=200c is the ambient temperature during cell testing This is
used to obtain the modified model of cell for another ambient temperature Tx If solar irradiation (Sc) increases from Sx1
Load = 1
Load = 28
Load = 013
Load = 02
ISSN (Print) 2320 ndash 3765
ISSN (Online) 2278 ndash 8875
International Journal of Advanced Research in Electrical
Electronics and Instrumentation Engineering
(An ISO 3297 2007 Certified Organization)
Vol 3 Issue 12 December 2014
1015662ijareeie20140312014
Copyright to IJAREEIE wwwijareeiecom 13606
to Sx2 the cell operating temperatures and currents also increases to new values Thus this change due to solar
irradiation can be implemented using correction factors
119862119878119881 = 1 + 120573119879120572119878 119878119909 minus 119878119862 - (6)
1198621198791 = 1 +
1
119878119888 119878119909 minus 119878119862 - (7)
∆119879119862 = 120572119878 119878119909 minus 119878119862 - (8)
Where Sc is the original solar irradiation level and Sx is the new level CSI CSI are correction factors for cell output
voltages and currents and ΔTC is the change in the temperature with αS slope change in the operating temperature By
using all correction factors new output voltage VCX and photo current Iphx are obtained as follows
119881119862119883 = 119862119879119881119862119878119881119881119862 119868119901ℎ119909 = 119862119879119868119862119878119868119868119901ℎ (9)
Here above fig 7 is the sub model of the photo voltaic array block in above fig 8
V MODELING OF MECHANICAL SYSTEMS
1 Propeller Modeling
Propeller can be modeled by implementing relations between torque thrust and speed For fixed propeller these
relationships can be expressed as given below eq 10 and eq11 [16]
119879119901 = 1205881198631199014119870119879119899119898 - (10)
119876119901 = 1205881198631199015119870119876119899119898 - (11)
Where Tp is propeller thrust [N] nm is the propeller shaft speed [rpm] and Qp is the propeller torque [N-m]
Parameters ρ Dp KT and KQ are water density propeller diameter thrust coefficient respectively KT and KQ are
functions of propeller structure and advance ratio J and advance velocity VA is always less than the ship velocity due to
Taylorlsquos wake fraction (w) Their relations are expressed by
119869 =119881119860
119899119898 119863119875 - (12)
119881119860 = 119881119878 1 minus 119908 - (13)
2 Ship Hydro Dynamics
The vessel hydrodynamic model could be complicated when dynamic positioning is purposed [17] For power
system analysis in integrated power and propulsion systems a one dimensional forward-motion model suffices
ISSN (Print) 2320 ndash 3765
ISSN (Online) 2278 ndash 8875
International Journal of Advanced Research in Electrical
Electronics and Instrumentation Engineering
(An ISO 3297 2007 Certified Organization)
Vol 3 Issue 12 December 2014
1015662ijareeie20140312014
Copyright to IJAREEIE wwwijareeiecom 13607
Therefore the ship can be treated as an inertial mass with a resistive drag on which the propeller thrust Tp applies The
resistive drag is proportional to the square of ship speed Vs
3 Diesel Engine
Diesel engine dynamics can be modeled in different levels of complexity depending on the application In this paper
it is approximated by a time delay τ and a time constant τC [16] as represented in (14)
119879119898 119878 = 119890minus120591119904 119870119910
1+120591119888119904119884 119904 (14)
Where Tm is the generated torque Ky is the torque constant and Y is the fuel index (governor setting) The time
delay is half the period between consecutive cylinder firings which can be calculated by eq 15 [37]
120591 asymp 1
2119899119898119873 - (15) 120591119888 asymp
09
2119899119898 120587 - (16)
Where nm is the engine rotational speed in [rps] and N is the number of cylinders The time constant is calculated by
eq16In order to model the interaction between the diesel engine and the synchronous generator a speed control loop is
established between speed governor and synchronous generator
VI SYSTEM SIMULATION AND RESULTS
The below fig 9 represents overview of the system implemented in MATLABSimulink Interfaces among elements
are bidirectional to represent interactions among connected elements This facilitates the interface among different
types of electrical mechanical and electromechanical elements Parameters for different parts of the system are given
in the Appendix To represent the simulation results a sailing profile including high speed (140 radsec) moderate
speed (70 radse) and low speed (30 radsec) is studied in this section with and without solar module
Fig9 Overview of ship hybrid power system implemented in MATLABSimulink
ISSN (Print) 2320 ndash 3765
ISSN (Online) 2278 ndash 8875
International Journal of Advanced Research in Electrical
Electronics and Instrumentation Engineering
(An ISO 3297 2007 Certified Organization)
Vol 3 Issue 12 December 2014
1015662ijareeie20140312014
Copyright to IJAREEIE wwwijareeiecom 13608
A Without solar module under operation
Fig10 (a) (b) Per unit mechanical power and terminal
voltage of generator-1
Fig11 (a) (b) Per unit mechanical power and terminal
voltage of generator-2
Fig 10 (a) (b) shows per unit mechanical power and terminal voltage of generator set-1 Fig 11 (a) (b) shows
per unit mechanical power and terminal voltage of and generator set-2
Fig 12(a) shows the variation in the stator current of motor used for propulsion Fig 12(b) represents ship
actual speeds and reference speeds of propulsion motor Fig 12(c) represents propeller reference torque and
electromagnetic torque of induction motor over the simulation time
Fig12 (a) (b) (c) Stator current speeds and torques of induction machine
In the first cycle the ship is accelerating from zero to full speed which examines the power system response to high
stress and also due to high inertia during start current drawn during this cycle of operation is high The propeller
accelerates much faster than the ship as dynamics of the propulsion system is much faster than ship motion so during
first cycle there is a deviation of the actual speed from reference speed but in later cycles of operation both speeds are
same with small deviations In reference electromagnetic torque and actual electromagnetic torque of the propulsion
induction motor there is minor deviation between these two torques which is due to load variation during first cycle is
high ie from zero to maximum torque value so variation between torques is more in first cycle of operation In
remaining two stages of operation better match is obtained between reference torque and actual torque
Ref Torque
Act Torque
Ref Speed
Act Speed
ISSN (Print) 2320 ndash 3765
ISSN (Online) 2278 ndash 8875
International Journal of Advanced Research in Electrical
Electronics and Instrumentation Engineering
(An ISO 3297 2007 Certified Organization)
Vol 3 Issue 12 December 2014
1015662ijareeie20140312014
Copyright to IJAREEIE wwwijareeiecom 13609
Fig13 Current of generator-1
Fig14 Current of generator-2
Fig15 Current of fuel cell
Fig16 Current of battery
Fig 13 to fig16 shows dc currents of different units that are connected to the dc grid During high speeds 140
radsec the propulsion system demands highest amount of power Therefore both of the diesel generators the fuel cell
and the energy storage supply power to the grid during the first cycle of simulation The propulsion power highly
reduces with the reduction of propeller rotational speed and ship speed
Fig 17 DC bus voltage
Fig 18 Total load current
Reduction of the ship speed by half leads to reduction in the propeller speed At this speed range 70 radsec one of
the generators (G2) shuts down and the power is mainly supplied by the remaining generator (G1) and the fuel cell At
slow speed operation (30 radsec) the generator G1 also shuts down and the power is mainly supplied by the fuel cell
and battery
Fig 19 Battery SOC Current and Voltage
Fig20 Auxiliary load current
Fig21 Thrust
ISSN (Print) 2320 ndash 3765
ISSN (Online) 2278 ndash 8875
International Journal of Advanced Research in Electrical
Electronics and Instrumentation Engineering
(An ISO 3297 2007 Certified Organization)
Vol 3 Issue 12 December 2014
1015662ijareeie20140312014
Copyright to IJAREEIE wwwijareeiecom 13610
Fig 17 shows the dc bus voltage which is maintained constant with small droop Fig 18 shows total load current
drawn by overall system The battery state of charge (SOC) is maintained within certain limits This is done by starting
an idle diesel generator when SOC reaches the lower boundary and by shutting down an active diesel generator when
SOC exceeding the upper limit Fig 18 shows SOC voltage and current of the battery Fig20 shows load current of
ship auxiliary and hotel load rated at 175hp which is modeled by a constant dc motor load
B With solar module under operation
This addition of solar module provides ultra-low emission mode of operation which is important when ship is
approachingleaving harbors at low speeds Improvement in voltage profile is observed with addition of additional solar
module Some of important waveforms are shown below
Fig 22 DC bus voltage with solar module
Fig23 Current of generator-1
Fig 24 Current of generator-2
Fig25 Current of fuel cell
Fig 22 shows the dc bus voltage which is maintained constant with small droop we can observe the improvement in
voltage profile with additional hybrid power system Fig 23 to fig27 shows dc currents of different units that are
connected to the dc grid Since there is no change in load pattern the electromagnetic torque thrust auxiliary load
current and total load current drawn will remains same as shown in the above case without solar module under
operation
Fig26 Current of battery
Fig 27 Photo voltaic array current
The control methods for power sharing and voltage regulation of all-electric ships with dc distribution systems can
be tested and optimized by this simulation program The derived models and the simulation platform can be
reconfigured to assist in design implementation and control of experimental setups of dc power systems for all-electric
ships
ISSN (Print) 2320 ndash 3765
ISSN (Online) 2278 ndash 8875
International Journal of Advanced Research in Electrical
Electronics and Instrumentation Engineering
(An ISO 3297 2007 Certified Organization)
Vol 3 Issue 12 December 2014
1015662ijareeie20140312014
Copyright to IJAREEIE wwwijareeiecom 13611
VII CONCLUSION
A simulation platform is developed using the derived models of different components presented in the paper
Detailed modeling method is used to model all power electronic converters without neglecting system dynamic
behavior We have observed the exact system behavior under transient conditions The simulation results for a sailing
profile of an all-electric ship and how power sharing is done between different mechanical and electrical components
with different dynamics A significant reduction in emission of green house gases and use of non-renewable energy
(diesel) is done by adding a green energy source so that better energy management is done and improvement in voltage
profile is obtained With this green power sources ultra low emission of effluent gases like near shore is obtained
APPENDIX
1) The synchronous generator model is based on Parklsquos equivalent circuit [14] with the following parameters 300 KVA 320460 V 2 pole pairs
J = 335 kgm2 rs = 166 mΩ rfd = 5245 mΩ Llfd = 068 mH Lls = 168 mH Lmd = 585 mH Lmq = 505 mH rkd1= 01526 Ω L
lkd1 = 3404 mH
Llkq1= 3404 mH r
kq1= 4057 mΩ
2) Fuel cell parameters 130 cells Vnom = 90 V Inom = 1333 A Imax = 2250 A T =7000C P = 1199 kW 3) Li-ion battery parameters Vfull = 931 V Vnom = 80 V 5 kAh
4) The induction motor is modeled in synchronously rotating d-q reference frame [46] using the following parameters 200 hp 320460 V 4 poles
J = 41 kgm2 rs = 76 mΩ Rr= 46 mΩ Lls = 015 mH L
lr = 015 mH LM = 52 mH 5) Propeller parameters D= 05 m KT = ndash01060 KQ = ndash00186 ρ = 1024 kgm3
6) Diesel engine parameters Ky = 15e6 300 kW
7) PI controller parameters of the governor Kp = 00077 Kl= 00165 8) Voltage regulatormdashexciter parameters Kp = 04 Kl = 02 Tfb = 001 s Tff = 1 ms
9) Photo voltaic array module parameters Ns=1000 Np=10 Tx(temperature)=250C Sx(solar irradiation)=400
REFERENCES
[1] Bijan Zahedi Student Member IEEE and Lars E Norum Member IEEErdquo Modeling and Simulation of All-Electric Ships With Low-Voltage
DC Hybrid Power Systems
[2] J M Apsley A Gonzalez-Villasenor M Barnes A C Smith SWilliamson J D Schuddebeurs P J Norman C D Booth G M Burt and J R McDonald ―Propulsion drive models for full electric marine propulsion systems IEEE Trans Ind Appl vol 45 no 2 pp 676ndash684
Mar 2009 [3] S De Breucker E Peeters and J Driesen ―Possible applications of plug-in hybrid electric ships in Proc IEEE Electric Ship Technol Symp
Apr 20ndash22 2009 pp 560ndash567
[4] R E Hebner ―Electric ship power systemmdashResearch at the University of Texas at Austin in Proc IEEE Electric Ship Technol Symp Jul 25ndash27 2005 pp 34ndash38
[5] R Nilsen and I Sorfonn ―Hybrid power generation systems in Proc 13th Eur Conf Power Electron Appl Sep 2009
[6] G Seenumani H Peng and Sun ―A reference governor-based hierarchical control for failure mode power management of hybrid power
systems for all-electric ships J Power Sources vol 196 no 3 pp 1599ndash1607 2011
[7] K Hochkirch and V Bertram ―Options for fuel saving for ships Mare Forum Maritime Transportation of Energy Houston TX Feb 19
2010 [8] Ph Thounthong S Raumlel and B Davat ―Energy management of fuel cellbatterysuper capacitor hybrid power source for vehicle
applications J Power Sources vol 193 no 1 pp 376ndash385 Aug 2009
[9] J-S Lai and D J Nelson ―Energy management power converters in hybrid electric and fuel cell vehicles Proc IEEE vol 95 no 4 pp 766ndash 777 Apr 2007
[10] Muhammad H Rashid Power Electronics PhD Fellow IEE Fellow IEEE
[11] Robert W Erickson Fundamentals of Power Electronics Norwell MA Kluwer 1999 [12] B Zahedi O C Nebb and L E Norum ―An isolated bidirectional converter modeling for hybrid electric ship simulations in Proc IEEE
Transp Electrification Conf Expo Jun 2012
[13] H A Peterson and P C Krause ―A direct- and quadrature-axis representation of a parallel ac and dc power system IEEE Trans Power App Syst vol PAS-85 no 3 pp 210ndash225 Mar 1966
[14] P C Krause O Wasynczuk and S D Sudhoff Analysis of Electric Machinery and Drive Systems Piscataway NJ IEEE PressWiley 2002
[15] H Altas and AM Sharaf ―A Photovoltaic Array Simulation Model for Matlab-Simulink GUI Environment [16] J F Hansen A K Adnanes and T I Fossen ―Mathematical modeling of diesel-electric propulsion systems for marine vessels Math
Comput Model Dyn Syst vol 7 no 3 pp 323ndash355 2001
[17] R Ferreiro M Casado and F JVelasco ―Trends on modelling techniques applied on ships propulsion systems monitoring JMar Res vol 2 no 1 pp 87ndash104 2005

ISSN (Print) 2320 ndash 3765
ISSN (Online) 2278 ndash 8875
International Journal of Advanced Research in Electrical
Electronics and Instrumentation Engineering
(An ISO 3297 2007 Certified Organization)
Vol 3 Issue 12 December 2014
1015662ijareeie20140312014
Copyright to IJAREEIE wwwijareeiecom 13608
A Without solar module under operation
Fig10 (a) (b) Per unit mechanical power and terminal
voltage of generator-1
Fig11 (a) (b) Per unit mechanical power and terminal
voltage of generator-2
Fig 10 (a) (b) shows per unit mechanical power and terminal voltage of generator set-1 Fig 11 (a) (b) shows
per unit mechanical power and terminal voltage of and generator set-2
Fig 12(a) shows the variation in the stator current of motor used for propulsion Fig 12(b) represents ship
actual speeds and reference speeds of propulsion motor Fig 12(c) represents propeller reference torque and
electromagnetic torque of induction motor over the simulation time
Fig12 (a) (b) (c) Stator current speeds and torques of induction machine
In the first cycle the ship is accelerating from zero to full speed which examines the power system response to high
stress and also due to high inertia during start current drawn during this cycle of operation is high The propeller
accelerates much faster than the ship as dynamics of the propulsion system is much faster than ship motion so during
first cycle there is a deviation of the actual speed from reference speed but in later cycles of operation both speeds are
same with small deviations In reference electromagnetic torque and actual electromagnetic torque of the propulsion
induction motor there is minor deviation between these two torques which is due to load variation during first cycle is
high ie from zero to maximum torque value so variation between torques is more in first cycle of operation In
remaining two stages of operation better match is obtained between reference torque and actual torque
Ref Torque
Act Torque
Ref Speed
Act Speed
ISSN (Print) 2320 ndash 3765
ISSN (Online) 2278 ndash 8875
International Journal of Advanced Research in Electrical
Electronics and Instrumentation Engineering
(An ISO 3297 2007 Certified Organization)
Vol 3 Issue 12 December 2014
1015662ijareeie20140312014
Copyright to IJAREEIE wwwijareeiecom 13609
Fig13 Current of generator-1
Fig14 Current of generator-2
Fig15 Current of fuel cell
Fig16 Current of battery
Fig 13 to fig16 shows dc currents of different units that are connected to the dc grid During high speeds 140
radsec the propulsion system demands highest amount of power Therefore both of the diesel generators the fuel cell
and the energy storage supply power to the grid during the first cycle of simulation The propulsion power highly
reduces with the reduction of propeller rotational speed and ship speed
Fig 17 DC bus voltage
Fig 18 Total load current
Reduction of the ship speed by half leads to reduction in the propeller speed At this speed range 70 radsec one of
the generators (G2) shuts down and the power is mainly supplied by the remaining generator (G1) and the fuel cell At
slow speed operation (30 radsec) the generator G1 also shuts down and the power is mainly supplied by the fuel cell
and battery
Fig 19 Battery SOC Current and Voltage
Fig20 Auxiliary load current
Fig21 Thrust
ISSN (Print) 2320 ndash 3765
ISSN (Online) 2278 ndash 8875
International Journal of Advanced Research in Electrical
Electronics and Instrumentation Engineering
(An ISO 3297 2007 Certified Organization)
Vol 3 Issue 12 December 2014
1015662ijareeie20140312014
Copyright to IJAREEIE wwwijareeiecom 13610
Fig 17 shows the dc bus voltage which is maintained constant with small droop Fig 18 shows total load current
drawn by overall system The battery state of charge (SOC) is maintained within certain limits This is done by starting
an idle diesel generator when SOC reaches the lower boundary and by shutting down an active diesel generator when
SOC exceeding the upper limit Fig 18 shows SOC voltage and current of the battery Fig20 shows load current of
ship auxiliary and hotel load rated at 175hp which is modeled by a constant dc motor load
B With solar module under operation
This addition of solar module provides ultra-low emission mode of operation which is important when ship is
approachingleaving harbors at low speeds Improvement in voltage profile is observed with addition of additional solar
module Some of important waveforms are shown below
Fig 22 DC bus voltage with solar module
Fig23 Current of generator-1
Fig 24 Current of generator-2
Fig25 Current of fuel cell
Fig 22 shows the dc bus voltage which is maintained constant with small droop we can observe the improvement in
voltage profile with additional hybrid power system Fig 23 to fig27 shows dc currents of different units that are
connected to the dc grid Since there is no change in load pattern the electromagnetic torque thrust auxiliary load
current and total load current drawn will remains same as shown in the above case without solar module under
operation
Fig26 Current of battery
Fig 27 Photo voltaic array current
The control methods for power sharing and voltage regulation of all-electric ships with dc distribution systems can
be tested and optimized by this simulation program The derived models and the simulation platform can be
reconfigured to assist in design implementation and control of experimental setups of dc power systems for all-electric
ships
ISSN (Print) 2320 ndash 3765
ISSN (Online) 2278 ndash 8875
International Journal of Advanced Research in Electrical
Electronics and Instrumentation Engineering
(An ISO 3297 2007 Certified Organization)
Vol 3 Issue 12 December 2014
1015662ijareeie20140312014
Copyright to IJAREEIE wwwijareeiecom 13611
VII CONCLUSION
A simulation platform is developed using the derived models of different components presented in the paper
Detailed modeling method is used to model all power electronic converters without neglecting system dynamic
behavior We have observed the exact system behavior under transient conditions The simulation results for a sailing
profile of an all-electric ship and how power sharing is done between different mechanical and electrical components
with different dynamics A significant reduction in emission of green house gases and use of non-renewable energy
(diesel) is done by adding a green energy source so that better energy management is done and improvement in voltage
profile is obtained With this green power sources ultra low emission of effluent gases like near shore is obtained
APPENDIX
1) The synchronous generator model is based on Parklsquos equivalent circuit [14] with the following parameters 300 KVA 320460 V 2 pole pairs
J = 335 kgm2 rs = 166 mΩ rfd = 5245 mΩ Llfd = 068 mH Lls = 168 mH Lmd = 585 mH Lmq = 505 mH rkd1= 01526 Ω L
lkd1 = 3404 mH
Llkq1= 3404 mH r
kq1= 4057 mΩ
2) Fuel cell parameters 130 cells Vnom = 90 V Inom = 1333 A Imax = 2250 A T =7000C P = 1199 kW 3) Li-ion battery parameters Vfull = 931 V Vnom = 80 V 5 kAh
4) The induction motor is modeled in synchronously rotating d-q reference frame [46] using the following parameters 200 hp 320460 V 4 poles
J = 41 kgm2 rs = 76 mΩ Rr= 46 mΩ Lls = 015 mH L
lr = 015 mH LM = 52 mH 5) Propeller parameters D= 05 m KT = ndash01060 KQ = ndash00186 ρ = 1024 kgm3
6) Diesel engine parameters Ky = 15e6 300 kW
7) PI controller parameters of the governor Kp = 00077 Kl= 00165 8) Voltage regulatormdashexciter parameters Kp = 04 Kl = 02 Tfb = 001 s Tff = 1 ms
9) Photo voltaic array module parameters Ns=1000 Np=10 Tx(temperature)=250C Sx(solar irradiation)=400
REFERENCES
[1] Bijan Zahedi Student Member IEEE and Lars E Norum Member IEEErdquo Modeling and Simulation of All-Electric Ships With Low-Voltage
DC Hybrid Power Systems
[2] J M Apsley A Gonzalez-Villasenor M Barnes A C Smith SWilliamson J D Schuddebeurs P J Norman C D Booth G M Burt and J R McDonald ―Propulsion drive models for full electric marine propulsion systems IEEE Trans Ind Appl vol 45 no 2 pp 676ndash684
Mar 2009 [3] S De Breucker E Peeters and J Driesen ―Possible applications of plug-in hybrid electric ships in Proc IEEE Electric Ship Technol Symp
Apr 20ndash22 2009 pp 560ndash567
[4] R E Hebner ―Electric ship power systemmdashResearch at the University of Texas at Austin in Proc IEEE Electric Ship Technol Symp Jul 25ndash27 2005 pp 34ndash38
[5] R Nilsen and I Sorfonn ―Hybrid power generation systems in Proc 13th Eur Conf Power Electron Appl Sep 2009
[6] G Seenumani H Peng and Sun ―A reference governor-based hierarchical control for failure mode power management of hybrid power
systems for all-electric ships J Power Sources vol 196 no 3 pp 1599ndash1607 2011
[7] K Hochkirch and V Bertram ―Options for fuel saving for ships Mare Forum Maritime Transportation of Energy Houston TX Feb 19
2010 [8] Ph Thounthong S Raumlel and B Davat ―Energy management of fuel cellbatterysuper capacitor hybrid power source for vehicle
applications J Power Sources vol 193 no 1 pp 376ndash385 Aug 2009
[9] J-S Lai and D J Nelson ―Energy management power converters in hybrid electric and fuel cell vehicles Proc IEEE vol 95 no 4 pp 766ndash 777 Apr 2007
[10] Muhammad H Rashid Power Electronics PhD Fellow IEE Fellow IEEE
[11] Robert W Erickson Fundamentals of Power Electronics Norwell MA Kluwer 1999 [12] B Zahedi O C Nebb and L E Norum ―An isolated bidirectional converter modeling for hybrid electric ship simulations in Proc IEEE
Transp Electrification Conf Expo Jun 2012
[13] H A Peterson and P C Krause ―A direct- and quadrature-axis representation of a parallel ac and dc power system IEEE Trans Power App Syst vol PAS-85 no 3 pp 210ndash225 Mar 1966
[14] P C Krause O Wasynczuk and S D Sudhoff Analysis of Electric Machinery and Drive Systems Piscataway NJ IEEE PressWiley 2002
[15] H Altas and AM Sharaf ―A Photovoltaic Array Simulation Model for Matlab-Simulink GUI Environment [16] J F Hansen A K Adnanes and T I Fossen ―Mathematical modeling of diesel-electric propulsion systems for marine vessels Math
Comput Model Dyn Syst vol 7 no 3 pp 323ndash355 2001
[17] R Ferreiro M Casado and F JVelasco ―Trends on modelling techniques applied on ships propulsion systems monitoring JMar Res vol 2 no 1 pp 87ndash104 2005
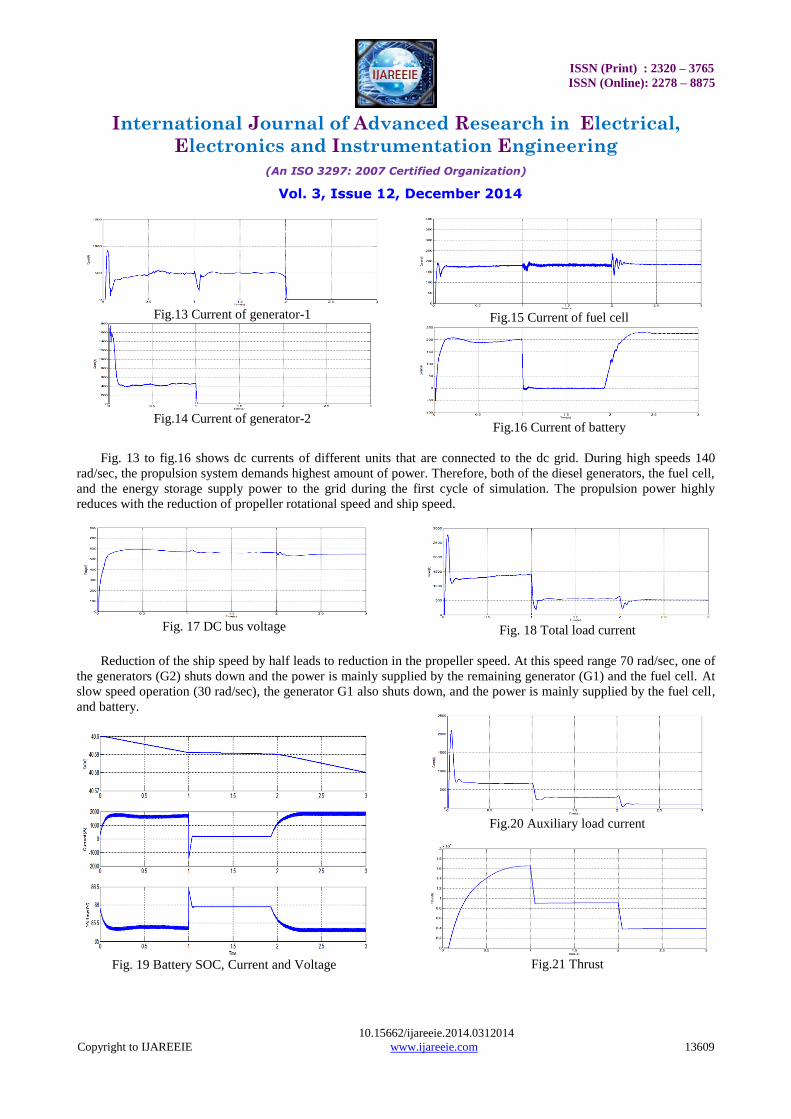
ISSN (Print) 2320 ndash 3765
ISSN (Online) 2278 ndash 8875
International Journal of Advanced Research in Electrical
Electronics and Instrumentation Engineering
(An ISO 3297 2007 Certified Organization)
Vol 3 Issue 12 December 2014
1015662ijareeie20140312014
Copyright to IJAREEIE wwwijareeiecom 13611
VII CONCLUSION
A simulation platform is developed using the derived models of different components presented in the paper
Detailed modeling method is used to model all power electronic converters without neglecting system dynamic
behavior We have observed the exact system behavior under transient conditions The simulation results for a sailing
profile of an all-electric ship and how power sharing is done between different mechanical and electrical components
with different dynamics A significant reduction in emission of green house gases and use of non-renewable energy
(diesel) is done by adding a green energy source so that better energy management is done and improvement in voltage
profile is obtained With this green power sources ultra low emission of effluent gases like near shore is obtained
APPENDIX
1) The synchronous generator model is based on Parklsquos equivalent circuit [14] with the following parameters 300 KVA 320460 V 2 pole pairs
J = 335 kgm2 rs = 166 mΩ rfd = 5245 mΩ Llfd = 068 mH Lls = 168 mH Lmd = 585 mH Lmq = 505 mH rkd1= 01526 Ω L
lkd1 = 3404 mH
Llkq1= 3404 mH r
kq1= 4057 mΩ
2) Fuel cell parameters 130 cells Vnom = 90 V Inom = 1333 A Imax = 2250 A T =7000C P = 1199 kW 3) Li-ion battery parameters Vfull = 931 V Vnom = 80 V 5 kAh
4) The induction motor is modeled in synchronously rotating d-q reference frame [46] using the following parameters 200 hp 320460 V 4 poles
J = 41 kgm2 rs = 76 mΩ Rr= 46 mΩ Lls = 015 mH L
lr = 015 mH LM = 52 mH 5) Propeller parameters D= 05 m KT = ndash01060 KQ = ndash00186 ρ = 1024 kgm3
6) Diesel engine parameters Ky = 15e6 300 kW
7) PI controller parameters of the governor Kp = 00077 Kl= 00165 8) Voltage regulatormdashexciter parameters Kp = 04 Kl = 02 Tfb = 001 s Tff = 1 ms
9) Photo voltaic array module parameters Ns=1000 Np=10 Tx(temperature)=250C Sx(solar irradiation)=400
REFERENCES
[1] Bijan Zahedi Student Member IEEE and Lars E Norum Member IEEErdquo Modeling and Simulation of All-Electric Ships With Low-Voltage
DC Hybrid Power Systems
[2] J M Apsley A Gonzalez-Villasenor M Barnes A C Smith SWilliamson J D Schuddebeurs P J Norman C D Booth G M Burt and J R McDonald ―Propulsion drive models for full electric marine propulsion systems IEEE Trans Ind Appl vol 45 no 2 pp 676ndash684
Mar 2009 [3] S De Breucker E Peeters and J Driesen ―Possible applications of plug-in hybrid electric ships in Proc IEEE Electric Ship Technol Symp
Apr 20ndash22 2009 pp 560ndash567
[4] R E Hebner ―Electric ship power systemmdashResearch at the University of Texas at Austin in Proc IEEE Electric Ship Technol Symp Jul 25ndash27 2005 pp 34ndash38
[5] R Nilsen and I Sorfonn ―Hybrid power generation systems in Proc 13th Eur Conf Power Electron Appl Sep 2009
[6] G Seenumani H Peng and Sun ―A reference governor-based hierarchical control for failure mode power management of hybrid power
systems for all-electric ships J Power Sources vol 196 no 3 pp 1599ndash1607 2011
[7] K Hochkirch and V Bertram ―Options for fuel saving for ships Mare Forum Maritime Transportation of Energy Houston TX Feb 19
2010 [8] Ph Thounthong S Raumlel and B Davat ―Energy management of fuel cellbatterysuper capacitor hybrid power source for vehicle
applications J Power Sources vol 193 no 1 pp 376ndash385 Aug 2009
[9] J-S Lai and D J Nelson ―Energy management power converters in hybrid electric and fuel cell vehicles Proc IEEE vol 95 no 4 pp 766ndash 777 Apr 2007
[10] Muhammad H Rashid Power Electronics PhD Fellow IEE Fellow IEEE
[11] Robert W Erickson Fundamentals of Power Electronics Norwell MA Kluwer 1999 [12] B Zahedi O C Nebb and L E Norum ―An isolated bidirectional converter modeling for hybrid electric ship simulations in Proc IEEE
Transp Electrification Conf Expo Jun 2012
[13] H A Peterson and P C Krause ―A direct- and quadrature-axis representation of a parallel ac and dc power system IEEE Trans Power App Syst vol PAS-85 no 3 pp 210ndash225 Mar 1966
[14] P C Krause O Wasynczuk and S D Sudhoff Analysis of Electric Machinery and Drive Systems Piscataway NJ IEEE PressWiley 2002
[15] H Altas and AM Sharaf ―A Photovoltaic Array Simulation Model for Matlab-Simulink GUI Environment [16] J F Hansen A K Adnanes and T I Fossen ―Mathematical modeling of diesel-electric propulsion systems for marine vessels Math
Comput Model Dyn Syst vol 7 no 3 pp 323ndash355 2001
[17] R Ferreiro M Casado and F JVelasco ―Trends on modelling techniques applied on ships propulsion systems monitoring JMar Res vol 2 no 1 pp 87ndash104 2005