optimized search strategy to maximize ptm characterization ... · optimized search strategy to...
TRANSCRIPT
Optimized Search Strategy to Maximize PTM Characterization and Protein Coverage in Proteome Discoverer Software Xiaoyue Jiang1, David Horn1, Michael Blank1, Devin Drew1, Bernard Delanghe2, Rosa Viner1, Andreas FR Huhmer1
1Thermo Fisher Scientific, San Jose, CA, USA; 2Thermo Fisher Scientific, Bremen, Germany
Ap
plica
tion
No
te 6
58
Key WordsProtein coverage, post-translational modification (PTM), Proteome Discoverer, SEQUEST, Byonic, Mascot, MaxQuant, MS Amanda, FDR
GoalTo evaluate several commonly used search algorithms to maximize peptide/protein identifications and PTM signatures for different types of samples.
Introduction New advances in mass spectrometry enable comprehensive characterization and accurate quantitation of complete proteomes. However, complex biological questions can only be answered through sophisticated data processing using multiple state-of-the-art proteomics search engines. The list of identified peptides and proteins returned from such search engines ultimately determines the conclusions for the whole experiment and thus high confidence in the results is critical. Identification of biological post-translational modifications (PTMs) is even more challenging. As the number, types, and combinatorial variations of PTMs expand, the analysis time significantly increases with a concomitant increase in incorrect assignments and missed identifications. This fact hinders the broader application of LCMS/MS for disease studies related to PTM signatures.
Several database search strategies have emerged to handle identifications and complex PTM schemes, including SEQUEST®1, Mascot®2, Andromeda™3, Byonic™4 and MS Amanda™5. These search engines will return different numbers of confidently identified peptides, proteins, and PTM signatures due to their different preprocessing and scoring algorithms.6 A number of publications recently compared the performance of various search engines, but the overall findings were inconclusive.7-8
This is probably due to the heterogeneous nature of the samples (heavily modified or lightly modified), acquisition methods (acquired at high resolution or low resolution), database searching parameters (mass tolerance, modifications), and search filters (false discovery rate (FDR)) that were used in those comparisons, all of which can affect the results of the assessment.
A more standardized approach, in which optimized instrument method and search parameters as well as the search filters included as part of the comparative study, must be applied so clear conclusions of the search engine comparison can be drawn.
In this study, we evaluated several widely used search algorithms including SEQUEST, Mascot, Byonic, and MS Amanda available in Thermo Scientific™ Proteome Discoverer™ 2.0 software, and the Andromeda search engine in MaxQuant™ software on two representative datasets acquired on high-resolution, accurate mass (HRAM) Orbitrap™ instruments—a simple mixture consisting of HeLa lysate and a complex mixture of histone proteins. Optimal search parameters and filters were utilized in this study and kept consistent across search engines. The peptide/protein identifications and PTM signatures were compared and the best search strategy was assessed for different types of sample. Data processing time was also included in the overall comparison.
Methods Sample PreparationThermo Scientific™ Pierce™ HeLa Protein Digest Standard was used as the standard for peptide and protein identification. Histone samples prepared according to Reference 8 were used as the mixture with complex PTM signatures.
2 Liquid ChromatographyThe HeLa sample (200 ng) was analyzed on a Thermo Scientific™ Q Exactive™ Plus mass spectrometer (MS) coupled to a Thermo Scientific™ EASY-nLC™ 1000 chromatograph with a 50 cm Thermo Scientific™ EASY-Spray™ column. The Q Exactive Plus MS was operated using a data-dependent top10 experiment with 70K resolving power setting for the full MS scans, 17.5K resolving power setting for high energy collisional dissociation (HCD) MS/MS scans, and a dynamic exclusion of 20 seconds.
The histone sample (1 μg) was analyzed on a Thermo Scientific™ Orbitrap Fusion™ Tribrid™ mass spectrometer coupled to the Easy-nLC 1000 chromatograph using the same 50 cm column. The Orbitrap Fusion MS used 120K resolving power setting for MS1 and rapid scan in ion trap analyzer for MS/MS. The maximum injection time for MS/MS was 150 ms. The gradient for both samples was 2–32% (acetonitrile, 0.1% FA) over 120 min at 300 nL/min.
Data AnalysisThe data were analyzed using Proteome Discoverer 2.0 software and MaxQuant software 1.5.2.8. The search algorithms used in the study were Sequest HT, Mascot 2.3, Byonic 2.3.49, and MS Amanda as part of the Proteome Discoverer software platform, and MaxQuant software (Max Planck Institute for Biochemistry) with the Andromeda search engine.3 For the HeLa searches, the search parameters were set as shown in Table 1. For the histone study, we performed the modification search based on Reference 8. Specifically, propionylation modifications on N-terminus were considered as fixed and seven combinations of modifications as dynamic: (1) propionyl-only for unmodified peptides (un); (2) propionyl and acetyl for acetylated peptides (ac); (3) propionyl and methyl propionyl for monomethylated peptides (me); (4) propionyl and dimethyl for dimethylated peptides (di); (5) propionyl and trimethyl for trimethylated peptides (tr); (6) propionyl and phospho for phosphorylated peptides (ph); and (7) all of the above modifications for multi modified peptides (co). All seven sets of modifications were run using each search engine separately and the results were combined using the multi-consensus feature in Proteome Discoverer software or Microsoft® Excel® for the MaxQuant result. A FDR of 1% for peptide was set for all search engines (1% PSM FDR for MaxQuant), and 2% protein FDR for Byonic and MaxQuant search engines. PtmRS was used to calculate the site localization probabilities of all the PTMs. All search engines used the same FASTA database and all searches were performed using the same 2.9 GHz processing PC with 16GB RAM. The Mascot Server is equipped with the same processor and 24GB RAM. The identifications generated from Proteome Discoverer and MaxQuant software were imported into Thermo Scientific™ ProteinCenter™ software for comparison.
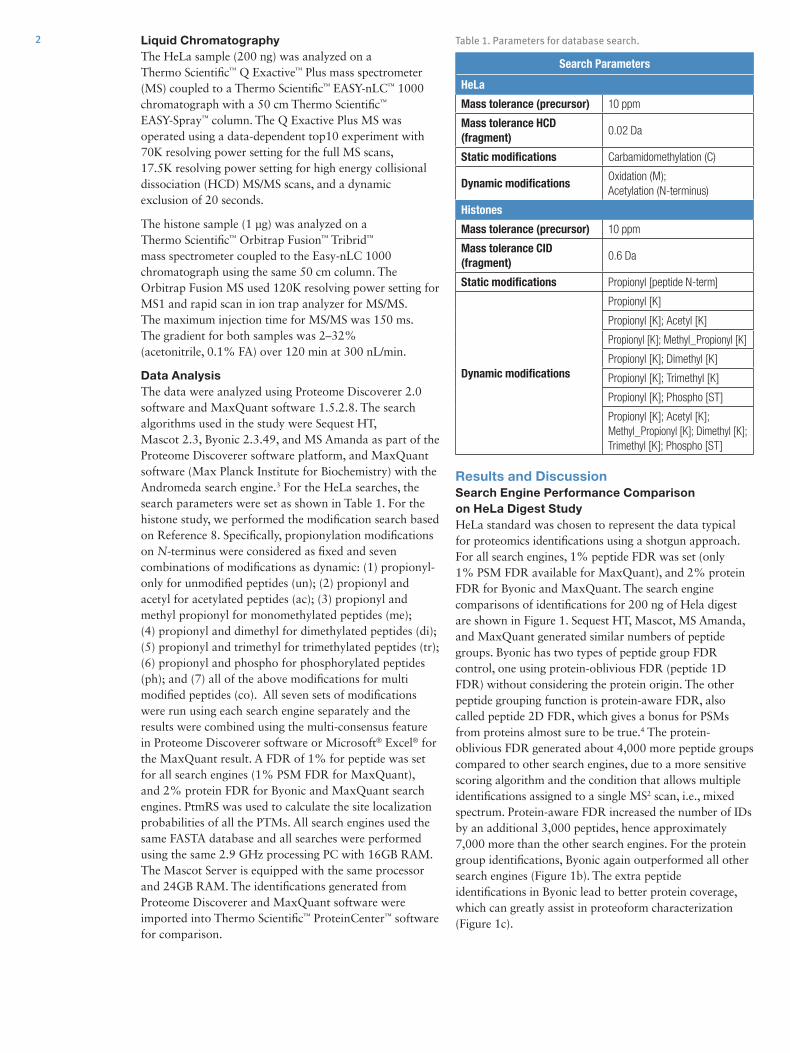
Results and Discussion Search Engine Performance Comparison on HeLa Digest StudyHeLa standard was chosen to represent the data typical for proteomics identifications using a shotgun approach. For all search engines, 1% peptide FDR was set (only 1% PSM FDR available for MaxQuant), and 2% protein FDR for Byonic and MaxQuant. The search engine comparisons of identifications for 200 ng of Hela digest are shown in Figure 1. Sequest HT, Mascot, MS Amanda, and MaxQuant generated similar numbers of peptide groups. Byonic has two types of peptide group FDR control, one using protein-oblivious FDR (peptide 1D FDR) without considering the protein origin. The other peptide grouping function is protein-aware FDR, also called peptide 2D FDR, which gives a bonus for PSMs from proteins almost sure to be true.4 The protein-oblivious FDR generated about 4,000 more peptide groups compared to other search engines, due to a more sensitive scoring algorithm and the condition that allows multiple identifications assigned to a single MS2 scan, i.e., mixed spectrum. Protein-aware FDR increased the number of IDs by an additional 3,000 peptides, hence approximately 7,000 more than the other search engines. For the protein group identifications, Byonic again outperformed all other search engines (Figure 1b). The extra peptide identifications in Byonic lead to better protein coverage, which can greatly assist in proteoform characterization (Figure 1c).
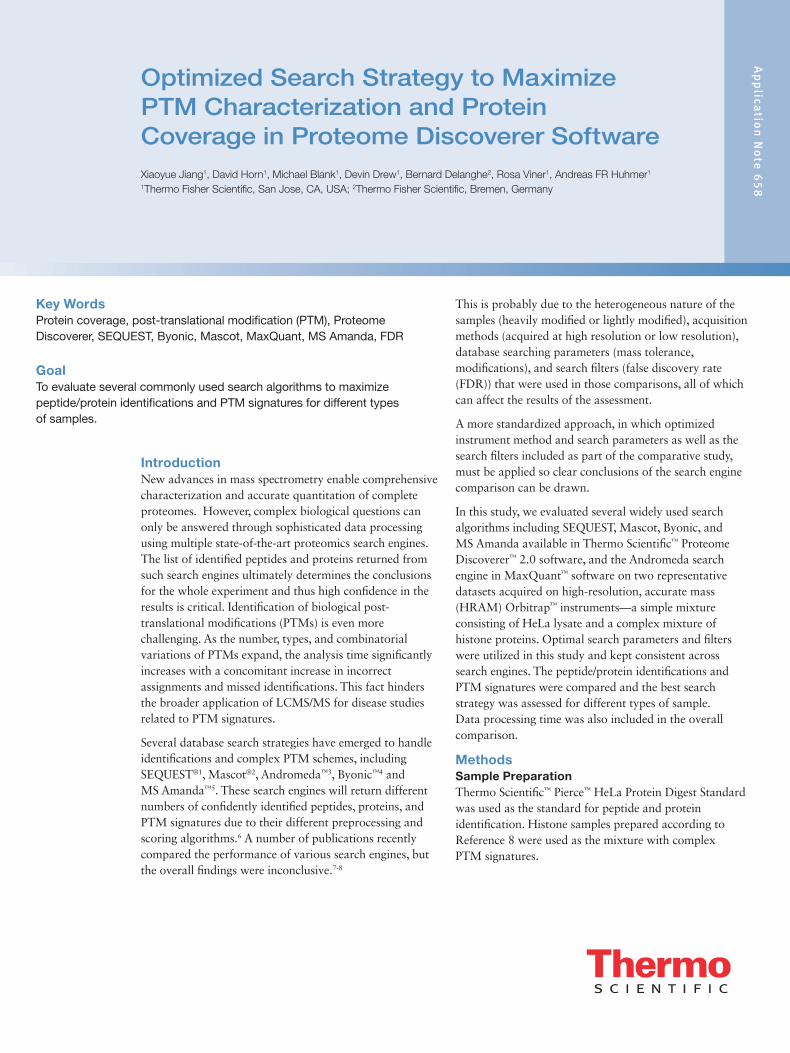
Table 1. Parameters for database search.
Search Parameters
HeLa
Mass tolerance (precursor) 10 ppm
Mass tolerance HCD (fragment)
0.02 Da
Static modifications Carbamidomethylation (C)
Dynamic modificationsOxidation (M); Acetylation (N-terminus)
Histones
Mass tolerance (precursor) 10 ppm
Mass tolerance CID (fragment)
0.6 Da
Static modifications Propionyl [peptide N-term]
Dynamic modifications
Propionyl [K]
Propionyl [K]; Acetyl [K]
Propionyl [K]; Methyl_Propionyl [K]
Propionyl [K]; Dimethyl [K]
Propionyl [K]; Trimethyl [K]
Propionyl [K]; Phospho [ST]
Propionyl [K]; Acetyl [K]; Methyl_Propionyl [K]; Dimethyl [K]; Trimethyl [K]; Phospho [ST]
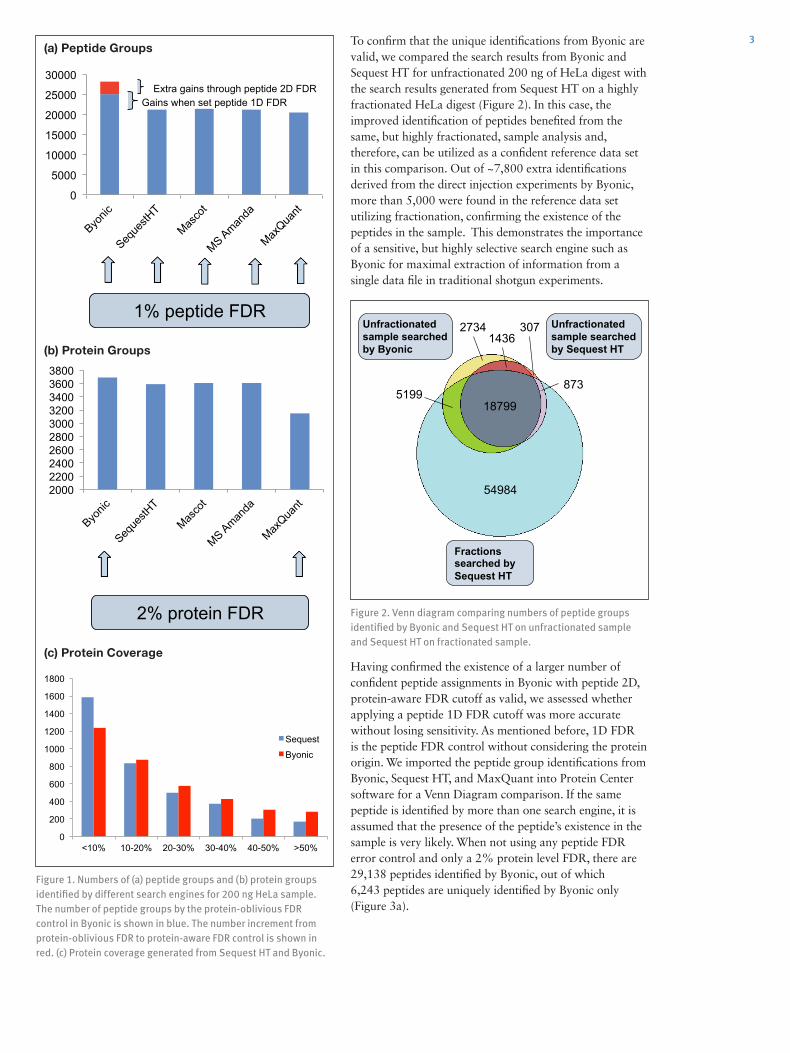
3To confirm that the unique identifications from Byonic are valid, we compared the search results from Byonic and Sequest HT for unfractionated 200 ng of HeLa digest with the search results generated from Sequest HT on a highly fractionated HeLa digest (Figure 2). In this case, the improved identification of peptides benefited from the same, but highly fractionated, sample analysis and, therefore, can be utilized as a confident reference data set in this comparison. Out of ~7,800 extra identifications derived from the direct injection experiments by Byonic, more than 5,000 were found in the reference data set utilizing fractionation, confirming the existence of the peptides in the sample. This demonstrates the importance of a sensitive, but highly selective search engine such as Byonic for maximal extraction of information from a single data file in traditional shotgun experiments.
Having confirmed the existence of a larger number of confident peptide assignments in Byonic with peptide 2D, protein-aware FDR cutoff as valid, we assessed whether applying a peptide 1D FDR cutoff was more accurate without losing sensitivity. As mentioned before, 1D FDR is the peptide FDR control without considering the protein origin. We imported the peptide group identifications from Byonic, Sequest HT, and MaxQuant into Protein Center software for a Venn Diagram comparison. If the same peptide is identified by more than one search engine, it is assumed that the presence of the peptide’s existence in the sample is very likely. When not using any peptide FDR error control and only a 2% protein level FDR, there are 29,138 peptides identified by Byonic, out of which 6,243 peptides are uniquely identified by Byonic only (Figure 3a).
(a) Peptide Groups
(b) Protein Groups
(c) Protein Coverage
Figure 1. Numbers of (a) peptide groups and (b) protein groups identified by different search engines for 200 ng HeLa sample. The number of peptide groups by the protein-oblivious FDR control in Byonic is shown in blue. The number increment from protein-oblivious FDR to protein-aware FDR control is shown in red. (c) Protein coverage generated from Sequest HT and Byonic.
Figure 2. Venn diagram comparing numbers of peptide groups identified by Byonic and Sequest HT on unfractionated sample and Sequest HT on fractionated sample.
0
5000
10000
15000
20000
25000
30000
Gains when set peptide 1D FDR Extra gains through peptide 2D FDR
1% peptide FDR
2000 2200 2400 2600 2800 3000 3200 3400 3600 3800
2% protein FDR
Fractions searched by Sequest HT
Unfractionated sample searched by Byonic
Unfractionated sample searched by Sequest HT
54984
18799 5199
873
2734 307 1436
0
200
400
600
800
1000
1200
1400
1600
1800
<10% 10-20% 20-30% 30-40% 40-50% >50%
Sequest
Byonic
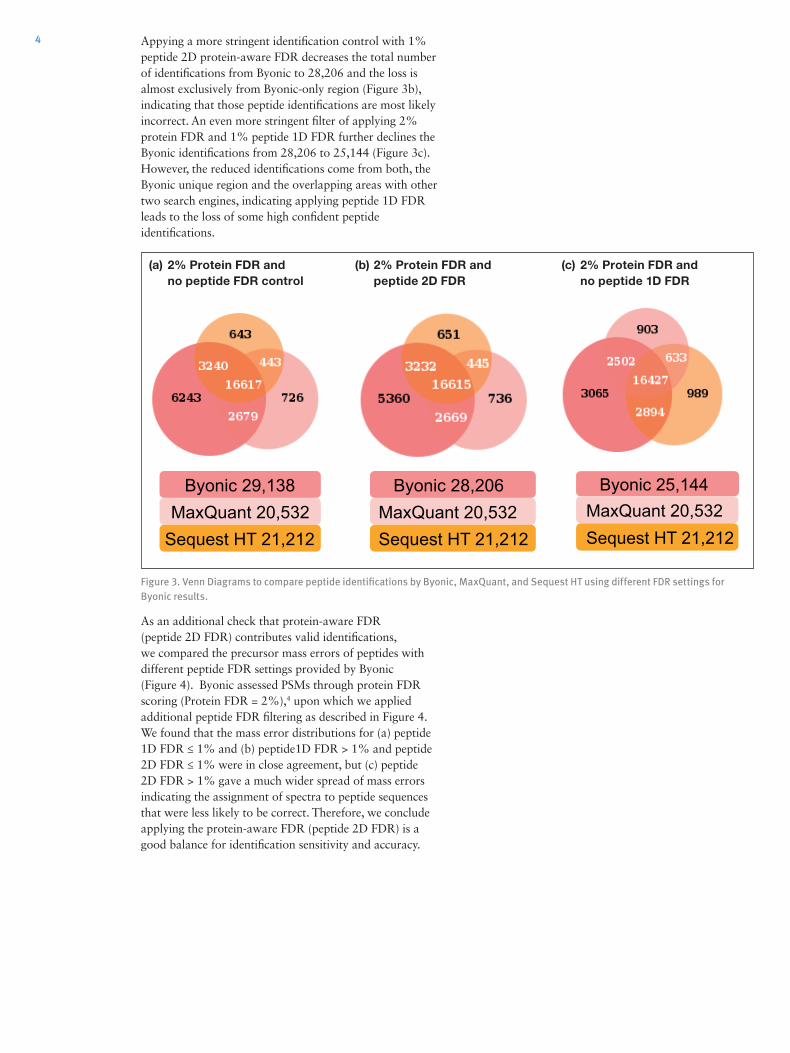
4 Appying a more stringent identification control with 1% peptide 2D protein-aware FDR decreases the total number of identifications from Byonic to 28,206 and the loss is almost exclusively from Byonic-only region (Figure 3b), indicating that those peptide identifications are most likely incorrect. An even more stringent filter of applying 2% protein FDR and 1% peptide 1D FDR further declines the Byonic identifications from 28,206 to 25,144 (Figure 3c). However, the reduced identifications come from both, the Byonic unique region and the overlapping areas with other two search engines, indicating applying peptide 1D FDR leads to the loss of some high confident peptide identifications.
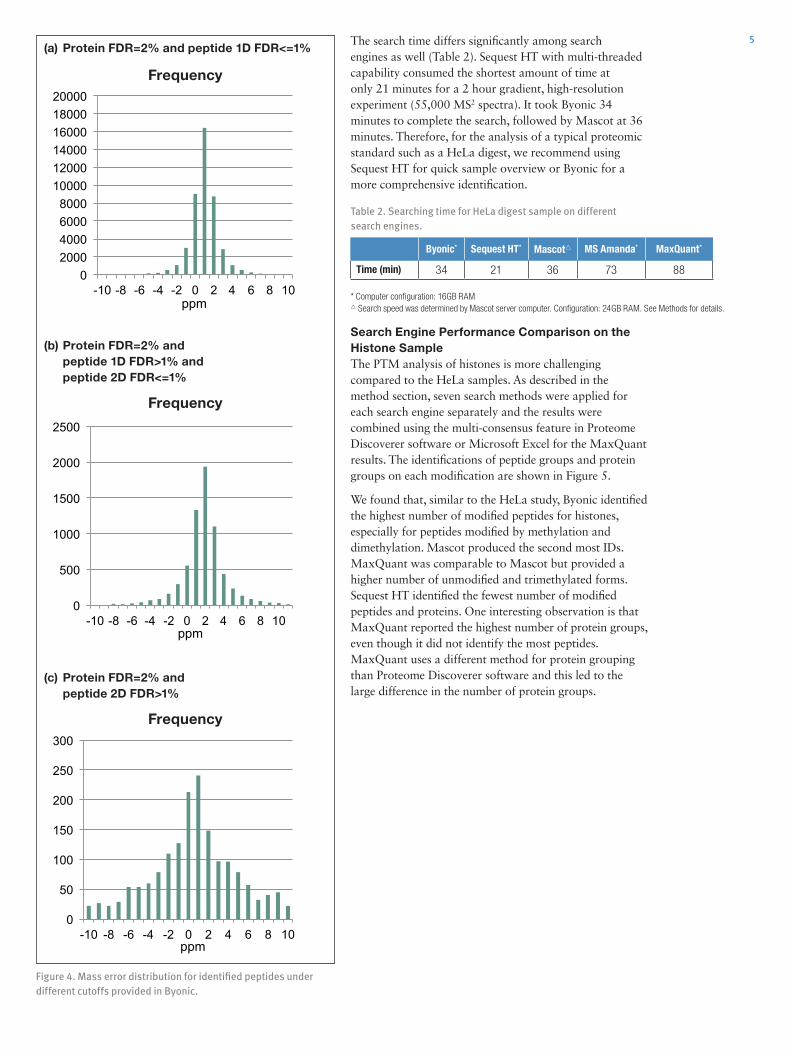
As an additional check that protein-aware FDR (peptide 2D FDR) contributes valid identifications, we compared the precursor mass errors of peptides with different peptide FDR settings provided by Byonic (Figure 4). Byonic assessed PSMs through protein FDR scoring (Protein FDR = 2%),4 upon which we applied additional peptide FDR filtering as described in Figure 4. We found that the mass error distributions for (a) peptide 1D FDR ≤ 1% and (b) peptide1D FDR > 1% and peptide 2D FDR ≤ 1% were in close agreement, but (c) peptide 2D FDR > 1% gave a much wider spread of mass errors indicating the assignment of spectra to peptide sequences that were less likely to be correct. Therefore, we conclude applying the protein-aware FDR (peptide 2D FDR) is a good balance for identification sensitivity and accuracy.
Figure 3. Venn Diagrams to compare peptide identifications by Byonic, MaxQuant, and Sequest HT using different FDR settings for Byonic results.
(a) 2% Protein FDR and no peptide FDR control
(b) 2% Protein FDR and peptide 2D FDR
(c) 2% Protein FDR and no peptide 1D FDR
Byonic 29,138 MaxQuant 20,532
Sequest HT 21,212
Byonic 28,206 MaxQuant 20,532 Sequest HT 21,212
Byonic 25,144 MaxQuant 20,532 Sequest HT 21,212
5
0
500
1000
1500
2000
2500
-10 -8 -6 -4 -2 0 2 4 6 8 10 ppm
0 2000 4000 6000 8000
10000 12000 14000 16000 18000 20000
-10 -8 -6 -4 -2 0 2 4 6 8 10 ppm
The search time differs significantly among search engines as well (Table 2). Sequest HT with multi-threaded capability consumed the shortest amount of time at only 21 minutes for a 2 hour gradient, high-resolution experiment (55,000 MS2 spectra). It took Byonic 34 minutes to complete the search, followed by Mascot at 36 minutes. Therefore, for the analysis of a typical proteomic standard such as a HeLa digest, we recommend using Sequest HT for quick sample overview or Byonic for a more comprehensive identification.
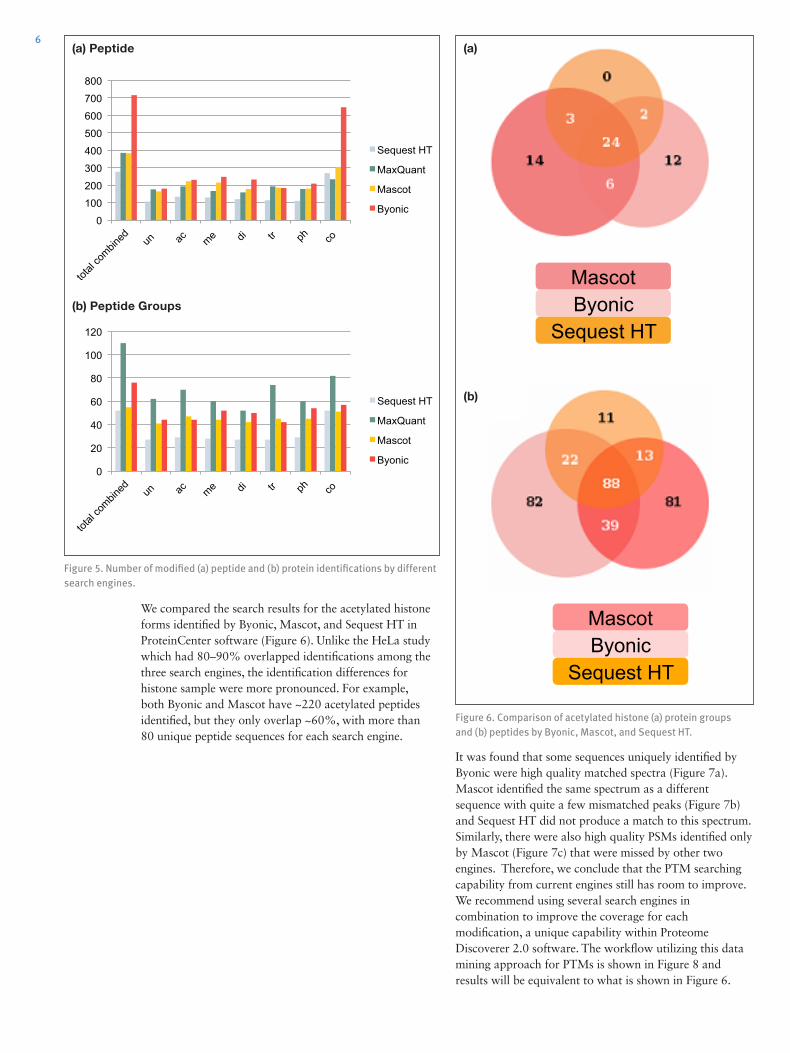
Search Engine Performance Comparison on the Histone SampleThe PTM analysis of histones is more challenging compared to the HeLa samples. As described in the method section, seven search methods were applied for each search engine separately and the results were combined using the multi-consensus feature in Proteome Discoverer software or Microsoft Excel for the MaxQuant results. The identifications of peptide groups and protein groups on each modification are shown in Figure 5.
We found that, similar to the HeLa study, Byonic identified the highest number of modified peptides for histones, especially for peptides modified by methylation and dimethylation. Mascot produced the second most IDs. MaxQuant was comparable to Mascot but provided a higher number of unmodified and trimethylated forms. Sequest HT identified the fewest number of modified peptides and proteins. One interesting observation is that MaxQuant reported the highest number of protein groups, even though it did not identify the most peptides. MaxQuant uses a different method for protein grouping than Proteome Discoverer software and this led to the large difference in the number of protein groups.
Figure 4. Mass error distribution for identified peptides under different cutoffs provided in Byonic.
(a) Protein FDR=2% and peptide 1D FDR<=1%
(b) Protein FDR=2% and peptide 1D FDR>1% and peptide 2D FDR<=1%
Frequency
Frequency
Frequency
(c) Protein FDR=2% and peptide 2D FDR>1%
0
50
100
150
200
250
300
-10 -8 -6 -4 -2 0 2 4 6 8 10 ppm
Table 2. Searching time for HeLa digest sample on different search engines.
Byonic* Sequest HT* Mascotr MS Amanda* MaxQuant*
Time (min) 34 21 36 73 88
* Computer configuration: 16GB RAM r Search speed was determined by Mascot server computer. Configuration: 24GB RAM. See Methods for details.
6(a) Peptide (a)
(b)
(b) Peptide Groups
Figure 5. Number of modified (a) peptide and (b) protein identifications by different search engines.
Figure 6. Comparison of acetylated histone (a) protein groups and (b) peptides by Byonic, Mascot, and Sequest HT.
0
100
200
300
400
500
600
700
800
Sequest HT
MaxQuant
Mascot
Byonic
0
20
40
60
80
100
120
Sequest HT
MaxQuant
Mascot
Byonic
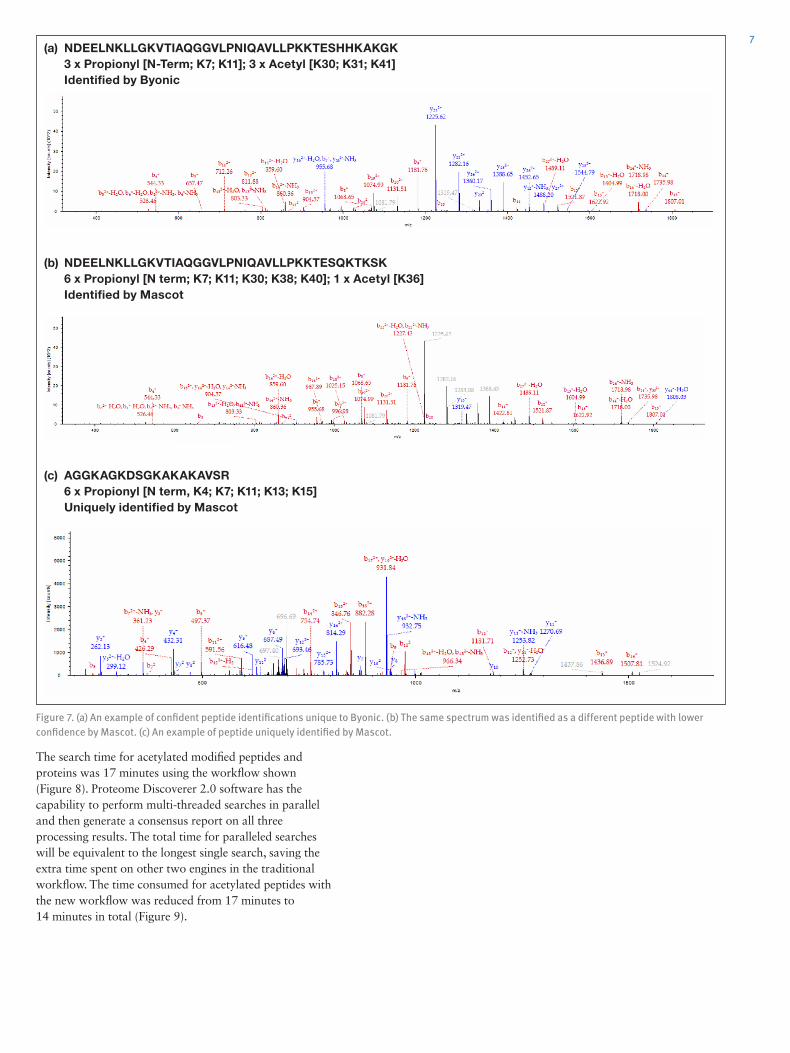
We compared the search results for the acetylated histone forms identified by Byonic, Mascot, and Sequest HT in ProteinCenter software (Figure 6). Unlike the HeLa study which had 80–90% overlapped identifications among the three search engines, the identification differences for histone sample were more pronounced. For example, both Byonic and Mascot have ~220 acetylated peptides identified, but they only overlap ~60%, with more than 80 unique peptide sequences for each search engine.
It was found that some sequences uniquely identified by Byonic were high quality matched spectra (Figure 7a). Mascot identified the same spectrum as a different sequence with quite a few mismatched peaks (Figure 7b) and Sequest HT did not produce a match to this spectrum. Similarly, there were also high quality PSMs identified only by Mascot (Figure 7c) that were missed by other two engines. Therefore, we conclude that the PTM searching capability from current engines still has room to improve. We recommend using several search engines in combination to improve the coverage for each modification, a unique capability within Proteome Discoverer 2.0 software. The workflow utilizing this data mining approach for PTMs is shown in Figure 8 and results will be equivalent to what is shown in Figure 6.
Mascot Byonic
Sequest HT
Mascot Byonic
Sequest HT
7(a)
(b)
(c)
NDEELNKLLGKVTIAQGGVLPNIQAVLLPKKTESHHKAKGK 3 x Propionyl [N-Term; K7; K11]; 3 x Acetyl [K30; K31; K41] Identified by Byonic
NDEELNKLLGKVTIAQGGVLPNIQAVLLPKKTESQKTKSK 6 x Propionyl [N term; K7; K11; K30; K38; K40]; 1 x Acetyl [K36] Identified by Mascot
AGGKAGKDSGKAKAKAVSR 6 x Propionyl [N term, K4; K7; K11; K13; K15] Uniquely identified by Mascot
Figure 7. (a) An example of confident peptide identifications unique to Byonic. (b) The same spectrum was identified as a different peptide with lower confidence by Mascot. (c) An example of peptide uniquely identified by Mascot.
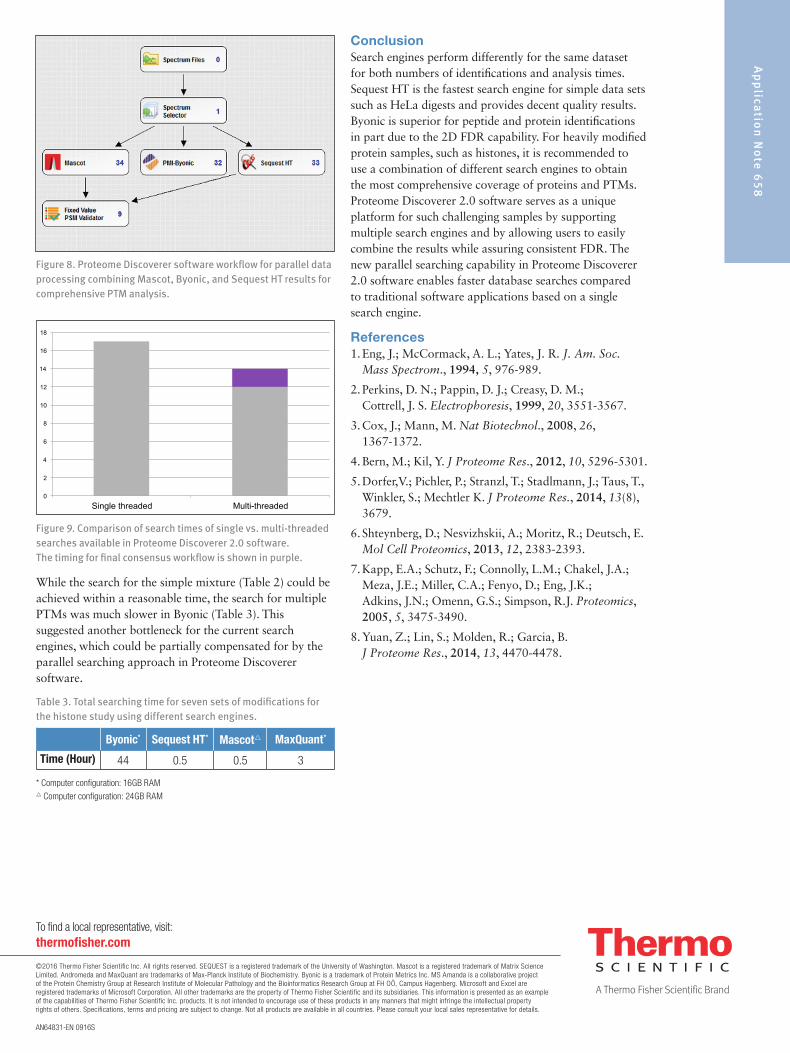
The search time for acetylated modified peptides and proteins was 17 minutes using the workflow shown (Figure 8). Proteome Discoverer 2.0 software has the capability to perform multi-threaded searches in parallel and then generate a consensus report on all three processing results. The total time for paralleled searches will be equivalent to the longest single search, saving the extra time spent on other two engines in the traditional workflow. The time consumed for acetylated peptides with the new workflow was reduced from 17 minutes to 14 minutes in total (Figure 9).
Ap
plica
tion
No
te 6
58
AN64831-EN 0916S
Figure 8. Proteome Discoverer software workflow for parallel data processing combining Mascot, Byonic, and Sequest HT results for comprehensive PTM analysis.
Figure 9. Comparison of search times of single vs. multi-threaded searches available in Proteome Discoverer 2.0 software. The timing for final consensus workflow is shown in purple.
0
2
4
6
8
10
12
14
16
18
Single threaded Multi-threaded
While the search for the simple mixture (Table 2) could be achieved within a reasonable time, the search for multiple PTMs was much slower in Byonic (Table 3). This suggested another bottleneck for the current search engines, which could be partially compensated for by the parallel searching approach in Proteome Discoverer software.
ConclusionSearch engines perform differently for the same dataset for both numbers of identifications and analysis times. Sequest HT is the fastest search engine for simple data sets such as HeLa digests and provides decent quality results. Byonic is superior for peptide and protein identifications in part due to the 2D FDR capability. For heavily modified protein samples, such as histones, it is recommended to use a combination of different search engines to obtain the most comprehensive coverage of proteins and PTMs. Proteome Discoverer 2.0 software serves as a unique platform for such challenging samples by supporting multiple search engines and by allowing users to easily combine the results while assuring consistent FDR. The new parallel searching capability in Proteome Discoverer 2.0 software enables faster database searches compared to traditional software applications based on a single search engine.
References1. Eng, J.; McCormack, A. L.; Yates, J. R. J. Am. Soc.
Mass Spectrom., 1994, 5, 976-989.
2. Perkins, D. N.; Pappin, D. J.; Creasy, D. M.; Cottrell, J. S. Electrophoresis, 1999, 20, 3551-3567.
3. Cox, J.; Mann, M. Nat Biotechnol., 2008, 26, 1367-1372.
4. Bern, M.; Kil, Y. J Proteome Res., 2012, 10, 5296-5301.
5. Dorfer,V.; Pichler, P.; Stranzl, T.; Stadlmann, J.; Taus, T., Winkler, S.; Mechtler K. J Proteome Res., 2014, 13(8), 3679.
6. Shteynberg, D.; Nesvizhskii, A.; Moritz, R.; Deutsch, E. Mol Cell Proteomics, 2013, 12, 2383-2393.
7. Kapp, E.A.; Schutz, F.; Connolly, L.M.; Chakel, J.A.; Meza, J.E.; Miller, C.A.; Fenyo, D.; Eng, J.K.; Adkins, J.N.; Omenn, G.S.; Simpson, R.J. Proteomics, 2005, 5, 3475-3490.
8. Yuan, Z.; Lin, S.; Molden, R.; Garcia, B. J Proteome Res., 2014, 13, 4470-4478.
Table 3. Total searching time for seven sets of modifications for the histone study using different search engines.
Byonic* Sequest HT* Mascotr MaxQuant*
Time (Hour) 44 0.5 0.5 3
* Computer configuration: 16GB RAMr Computer configuration: 24GB RAM
To find a local representative, visit:thermofisher.com
©2016 Thermo Fisher Scientific Inc. All rights reserved. SEQUEST is a registered trademark of the University of Washington. Mascot is a registered trademark of Matrix Science Limited. Andromeda and MaxQuant are trademarks of Max-Planck Institute of Biochemistry. Byonic is a trademark of Protein Metrics Inc. MS Amanda is a collaborative project of the Protein Chemistry Group at Research Institute of Molecular Pathology and the Bioinformatics Research Group at FH OÖ, Campus Hagenberg. Microsoft and Excel are registered trademarks of Microsoft Corporation. All other trademarks are the property of Thermo Fisher Scientific and its subsidiaries. This information is presented as an example of the capabilities of Thermo Fisher Scientific Inc. products. It is not intended to encourage use of these products in any manners that might infringe the intellectual property rights of others. Specifications, terms and pricing are subject to change. Not all products are available in all countries. Please consult your local sales representative for details.