optimizing disease outbreak detection methods using reinforcement learning masoumeh izadi clinical...
TRANSCRIPT
Optimizing Disease Outbreak Detection Methods Using Reinforcement Learning
Masoumeh Izadi
Clinical & Health Informatics Research Group
Faculty of Medicine, McGill
Overview
• Motivation
• Problem formulation
• Basic definitions
• The suggested method
• Experimental results
• Concluding remarks
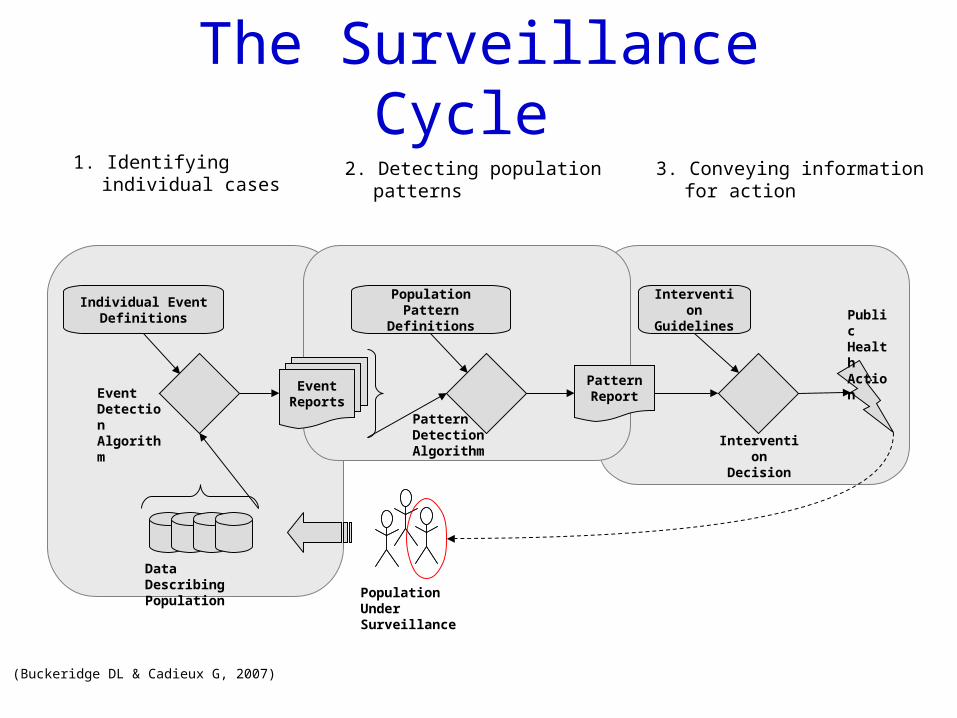
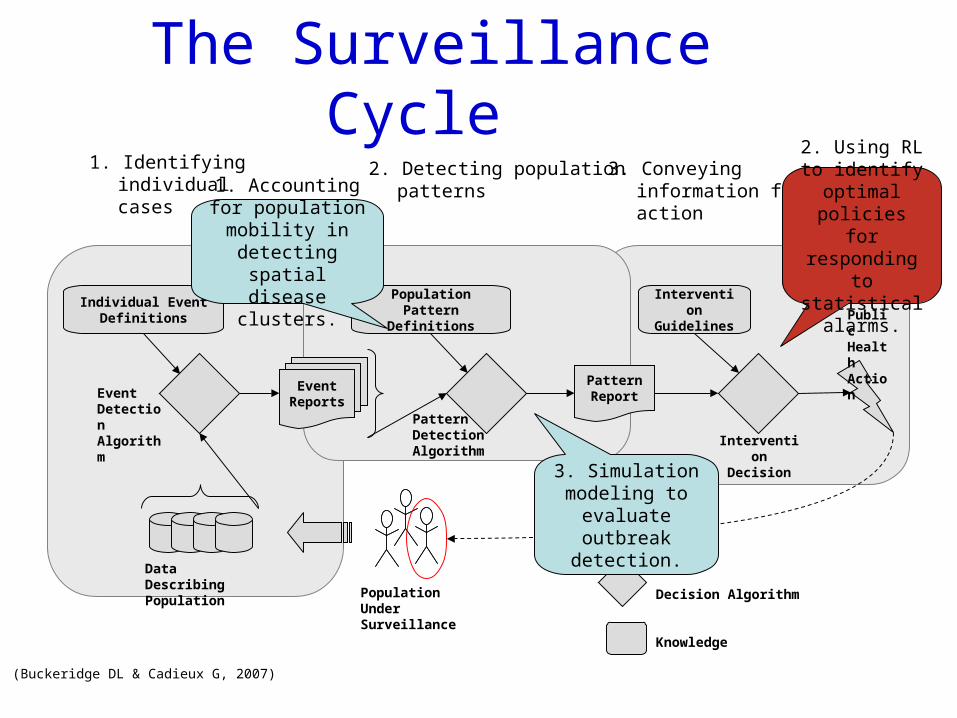
The Surveillance Cycle
Event Report
s
Individual Event Definitions
Population Pattern
Definitions
Event Detection Algorithm
Pattern Report
Population Under Surveillance
Intervention Decision
Intervention
GuidelinesPublic Health Action
Data Describing Population
Pattern Detection Algorithm
1. Identifying individual cases
2. Detecting population patterns
3. Conveying information for action
(Buckeridge DL & Cadieux G, 2007)
Surveillance Research
• Achieving the National Electronic Disease Surveillance System (NEDSS) architecture
• Data fusion (linkage)• New data sources• Case definitions (automation/validation)• Geographic Information System (GIS)
indices• Forecasting• Evaluation and quality control
The Surveillance Cycle
Event Report
s
Individual Event Definitions
Population Pattern
Definitions
Event Detection Algorithm
Pattern Report
Population Under Surveillance
Intervention Decision
Intervention
GuidelinesPublic Health Action
Data Describing Population
Pattern Detection Algorithm
1. Identifying individual cases
2. Detecting population patterns
3. Conveying information for action
Decision Algorithm
Knowledge
2. Using RL to identify
optimal policies for responding to statistical
alarms.
1. Accounting for population
mobility in detecting spatial disease clusters.
3. Simulation modeling to
evaluate outbreak detection.
(Buckeridge DL & Cadieux G, 2007)
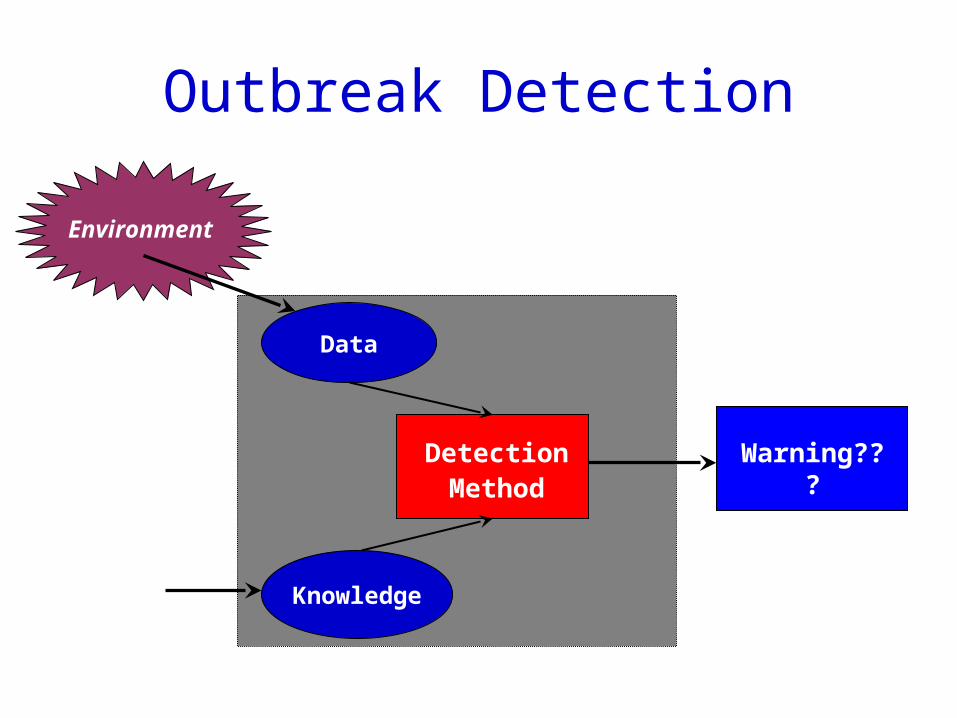
Outbreak Detection
Knowledge
Data
DetectionMethod
Environment
Warning???
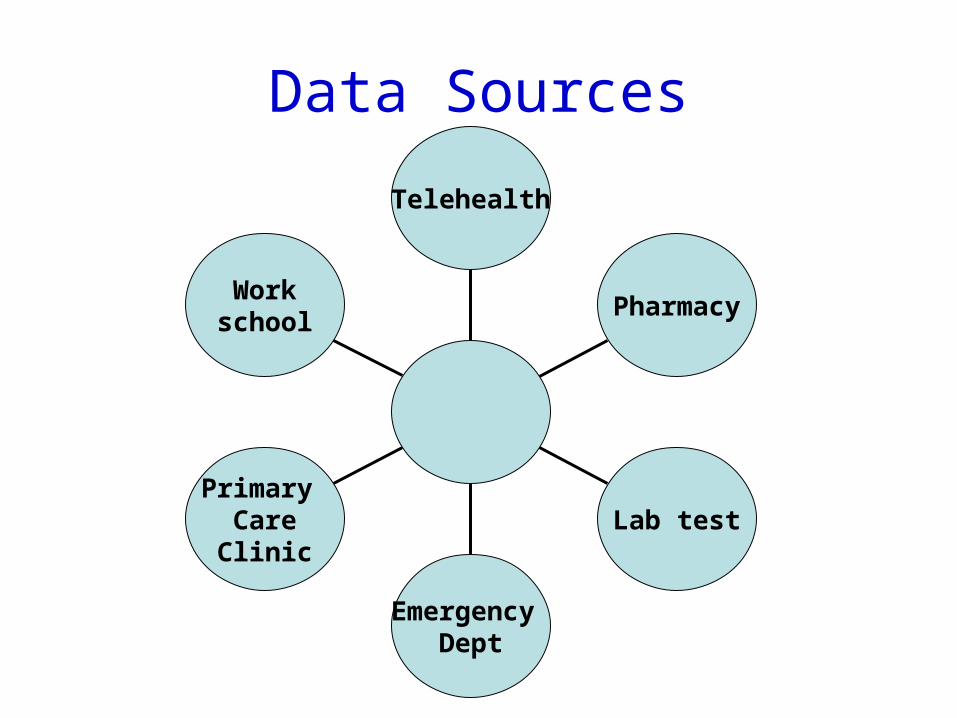
Workschool
Primary CareClinic
Emergency Dept
Lab test
Pharmacy
Telehealth
Data Sources
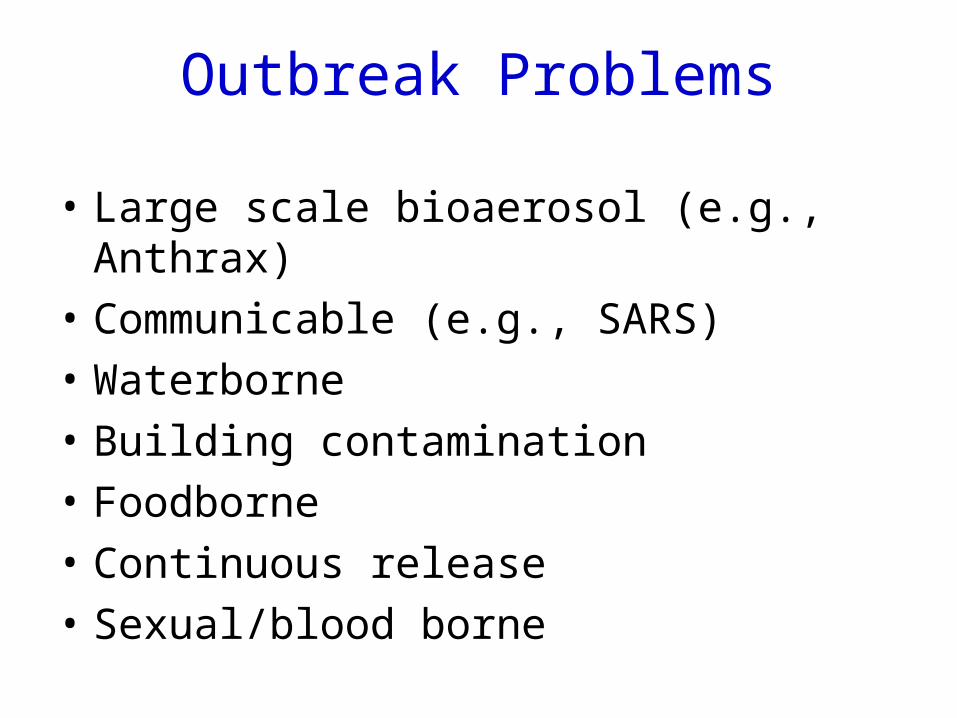
Outbreak Problems
• Large scale bioaerosol (e.g., Anthrax)
• Communicable (e.g., SARS)
• Waterborne
• Building contamination
• Foodborne
• Continuous release
• Sexual/blood borne
Detection Methods
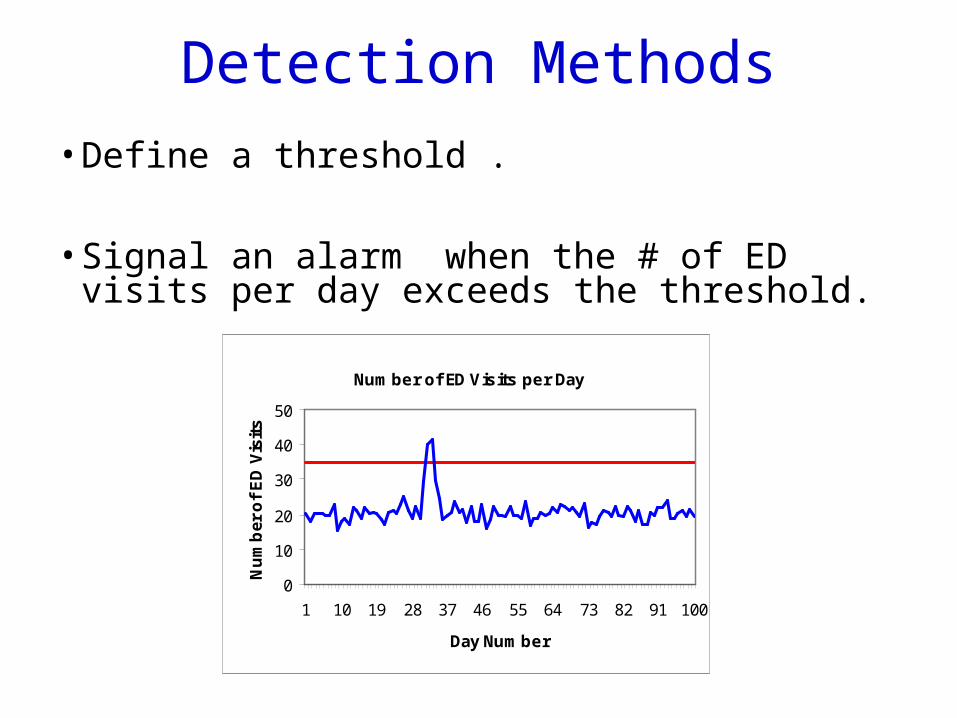
• Define a threshold .
• Signal an alarm when the # of ED visits per day exceeds the threshold.
Number of ED Visits per Day
0
10
20
30
40
50
1 10 19 28 37 46 55 64 73 82 91 100
Day Number
Nu
mb
er o
f E
D V
isit
s
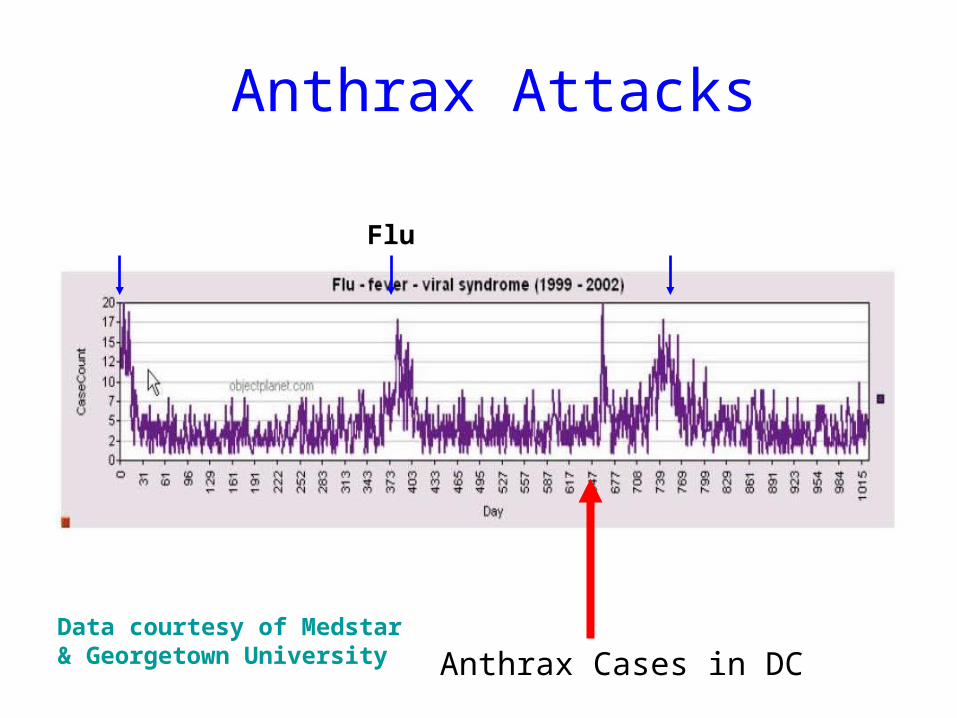
Anthrax Cases in DC
Flu Flu Flu
Anthrax Attacks
Data courtesy of Medstar & Georgetown University
Existing Detection Methods
Temporal methods
e.g. Moving average
Spatio-temporal methods
e.g. Space-time scan
Features Shared by Most Detection
Methods
• Design a baseline.
• Define an important event when the p-value of a statistic is less than an expected value by the baseline.
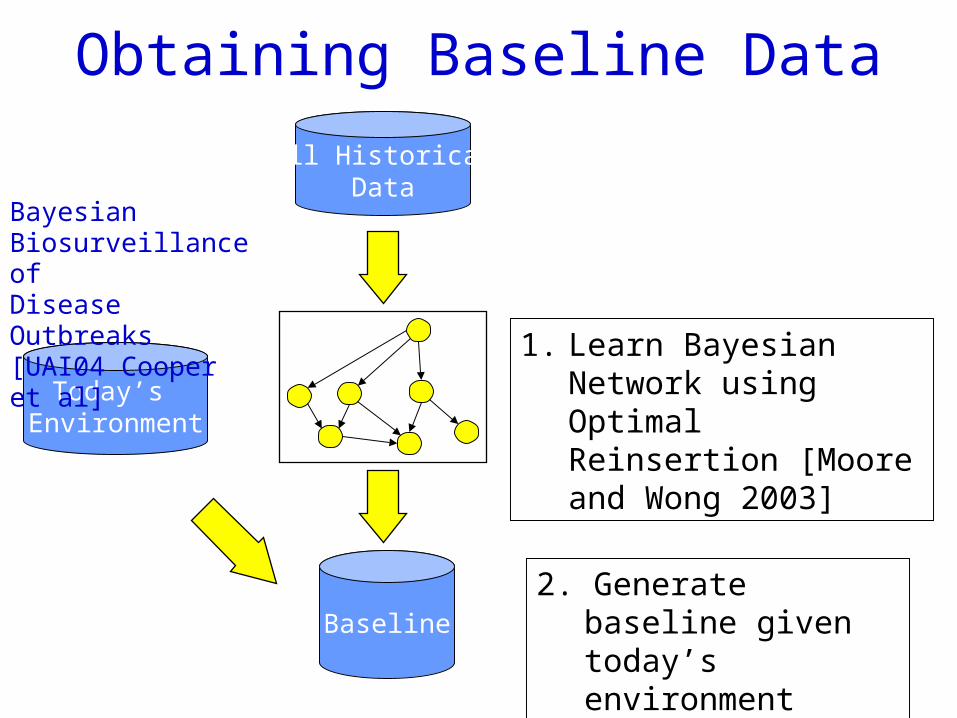
Obtaining Baseline Data
Baseline
All HistoricalData
Today’s Environment
1. Learn Bayesian Network using Optimal Reinsertion [Moore and Wong 2003]
2. Generate baseline given today’s environment
Bayesian Biosurveillance of Disease Outbreaks [UAI04 Cooper et al]
Important Events
• determine which of these p-values are significant for a specific problem.
Idea: use association rules to define cases
Key Observations
There is a great amount of uncertainty about suspicious events. An action has to be taken in response to any suspicious change in the environmental patterns.
Surveillance systems faced by high-risk decision problems under uncertainty.
Surveillance algorithms are inaccurate in practice
• How precisely can we detect if an outbreak is happening? (sensitivity)
• How early can we detect it? (timeliness)
Research to address this problem– Novel or ‘improved’ data streams– Better forecasts or detection methods– Improve decision making after alarms
Our Approach
Instead of trying to improve the detection method, we ‘post-process’ the signals:
Use a standard surveillance method to provide alarm signals
Feed this signal to the model of outbreak detection as a partially observed Markov decision process (POMDP)
Partially Observable MDP
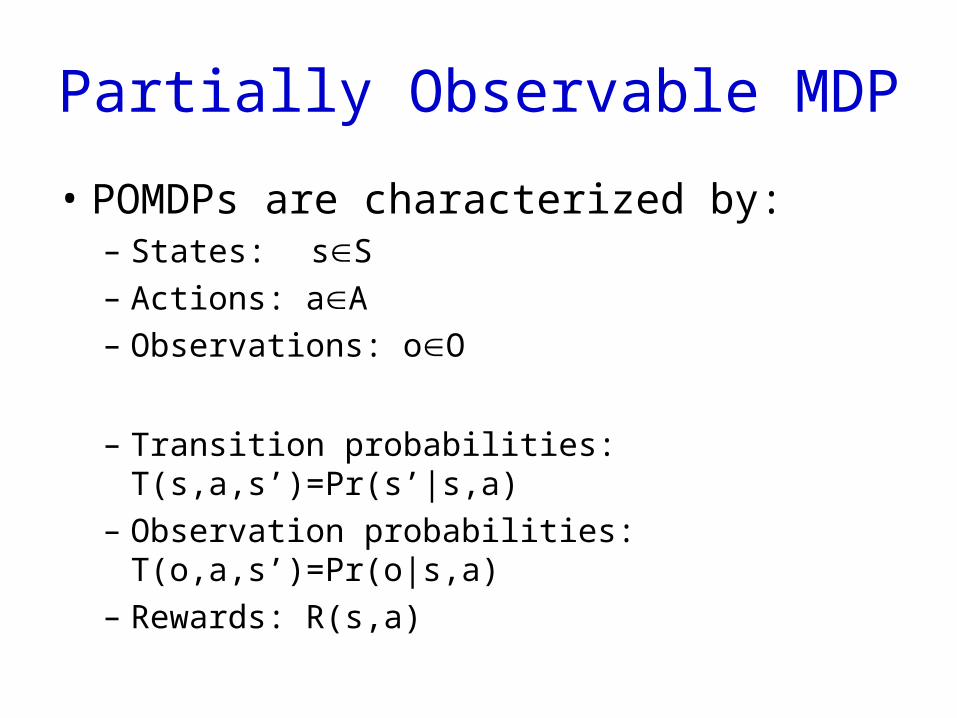
• POMDPs are characterized by:– States: sS
– Actions: aA
– Observations: oO
– Transition probabilities: T(s,a,s’)=Pr(s’|s,a)
– Observation probabilities: T(o,a,s’)=Pr(o|s,a)
– Rewards: R(s,a)
Solving POMDPs
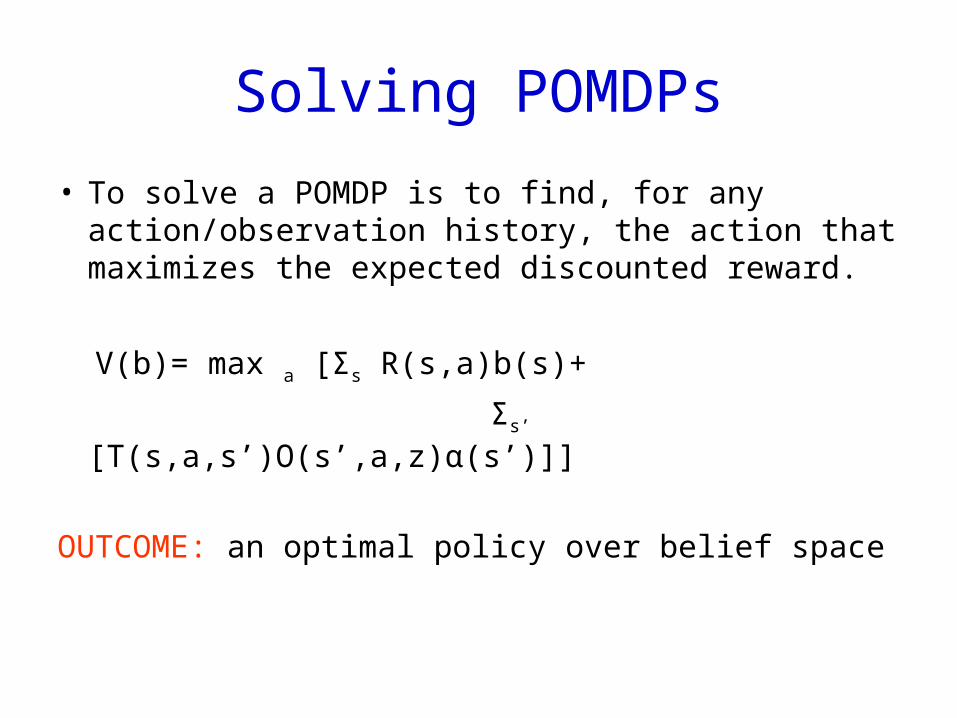
• To solve a POMDP is to find, for any action/observation history, the action that maximizes the expected discounted reward.
V(b)= max a [Σs R(s,a)b(s)+
Σs’ [T(s,a,s’)O(s’,a,z)α(s’)]]
OUTCOME: an optimal policy over belief space
Suitability
The ‘true’ state of the outbreak cannot be observed
Statistical algorithms provide imperfect measurements of the true state
That the probability of success of (i.e., effectiveness) of actions can be determined
The that costs of actions and of outcomes can be determined
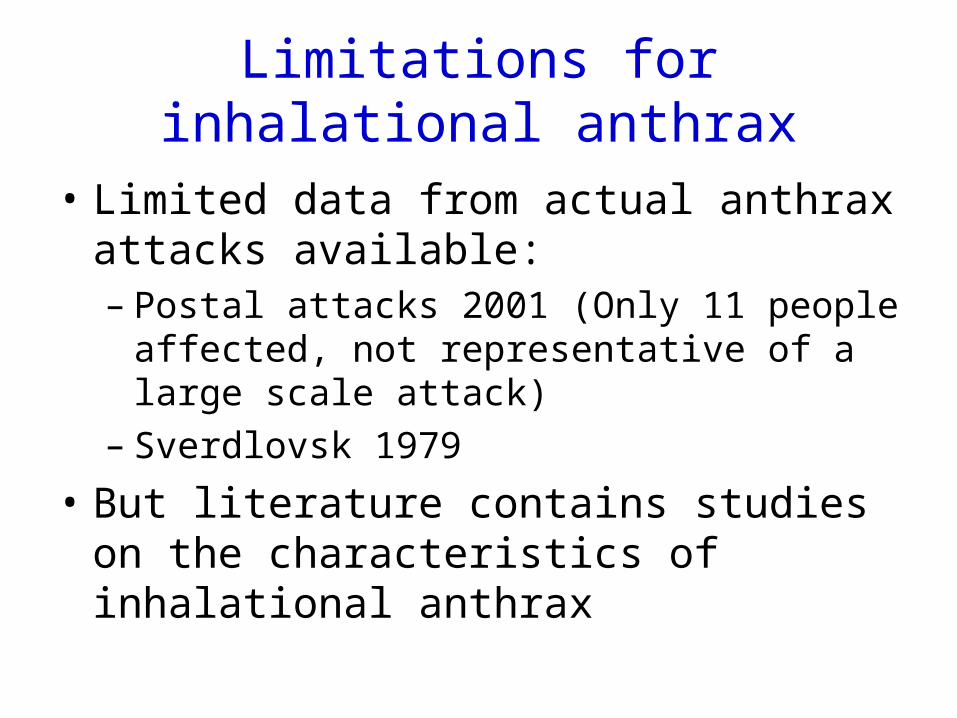
Limitations for inhalational anthrax
• Limited data from actual anthrax attacks available:– Postal attacks 2001 (Only 11 people affected,
not representative of a large scale attack)– Sverdlovsk 1979
• But literature contains studies on the characteristics of inhalational anthrax
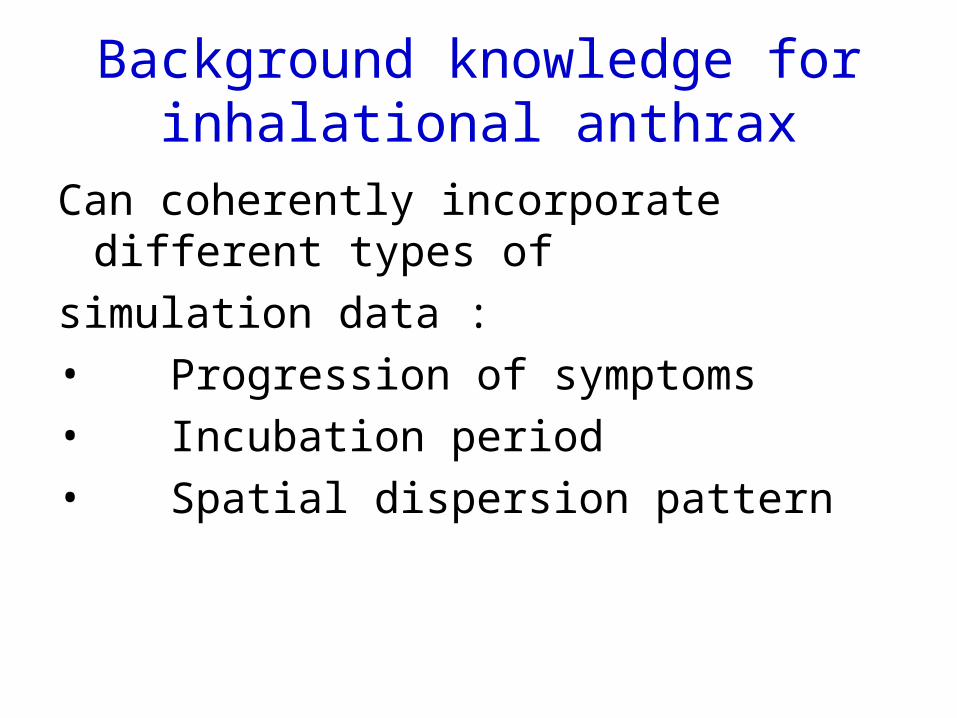
Background knowledge for inhalational anthrax
Can coherently incorporate different types of
simulation data :
• Progression of symptoms
• Incubation period
• Spatial dispersion pattern
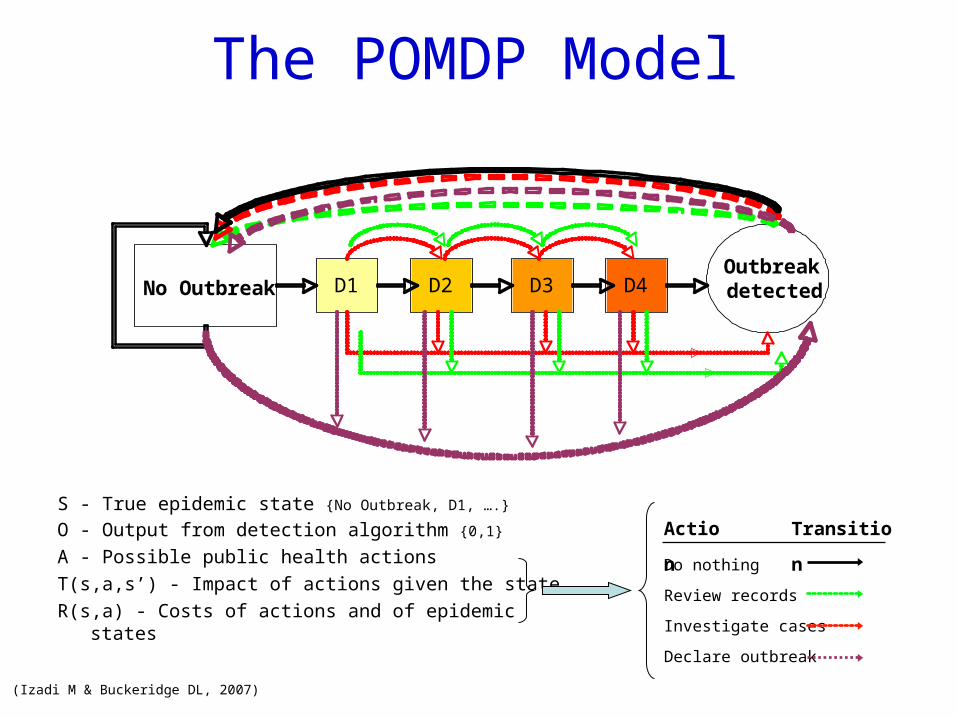
The POMDP Model
S - True epidemic state {No Outbreak, D1, ….}
O - Output from detection algorithm {0,1}
A - Possible public health actions
T(s,a,s’) - Impact of actions given the state
R(s,a) - Costs of actions and of epidemic states
Do nothing
Review records
Investigate cases
Declare outbreak
Actio
n
Transitio
n
No OutbreakOutbreakdetectedD1 D2 D3 D4
(Izadi M & Buckeridge DL, 2007)
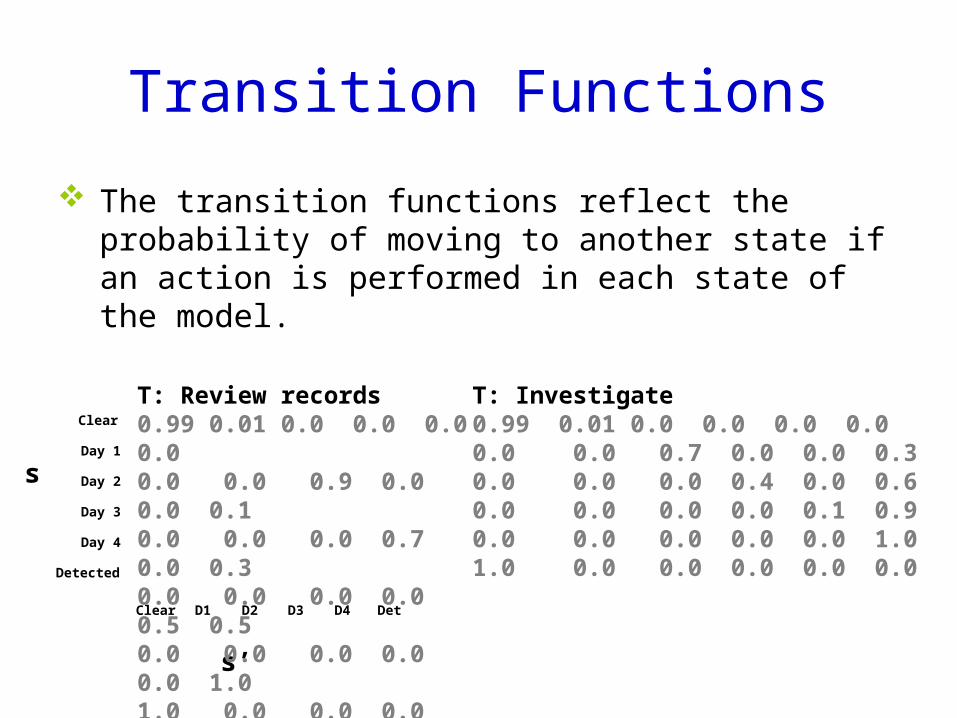
The transition functions reflect the probability of moving to another state if an action is performed in each state of the model.
Clear
Day 1
Day 2
Day 3
Day 4
Detected
Clear D1 D2 D3 D4 Det
s
s’
T: Review records0.99 0.01 0.0 0.0 0.0 0.0 0.0 0.0 0.9 0.0 0.0 0.10.0 0.0 0.0 0.7 0.0 0.30.0 0.0 0.0 0.0 0.5 0.50.0 0.0 0.0 0.0 0.0 1.01.0 0.0 0.0 0.0 0.0 0.0
T: Investigate 0.99 0.01 0.0 0.0 0.0 0.0 0.0 0.0 0.7 0.0 0.0 0.30.0 0.0 0.0 0.4 0.0 0.60.0 0.0 0.0 0.0 0.1 0.90.0 0.0 0.0 0.0 0.0 1.01.0 0.0 0.0 0.0 0.0 0.0
Transition Functions
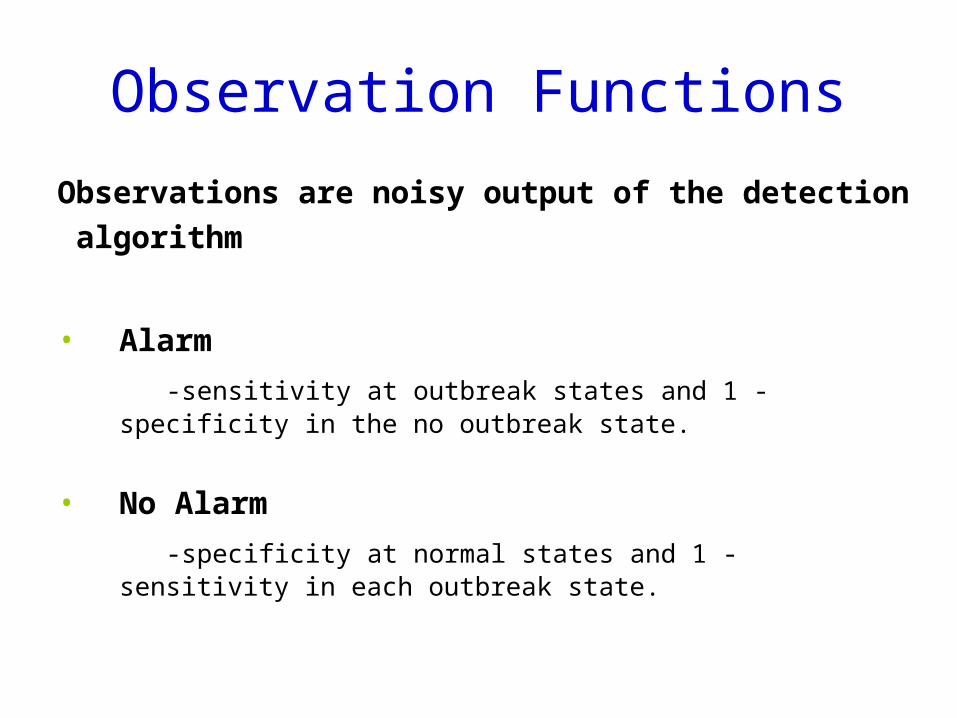
Observation Functions
Observations are noisy output of the detection
algorithm
• Alarm
-sensitivity at outbreak states and 1 - specificity in the no outbreak state.
• No Alarm
-specificity at normal states and 1 - sensitivity in each outbreak state.
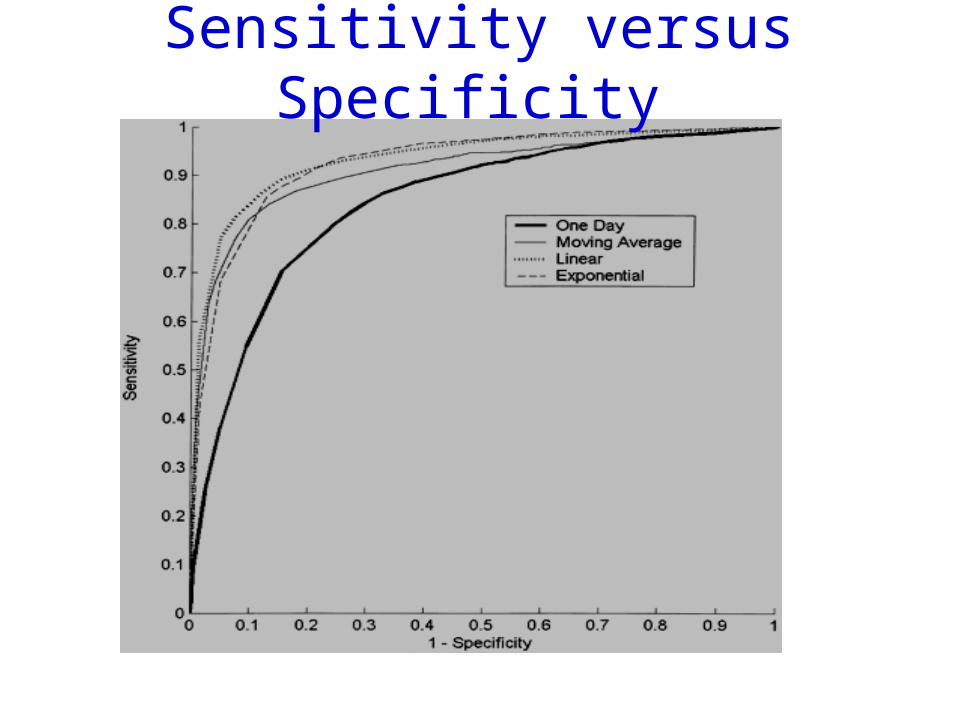
Sensitivity versus Specificity
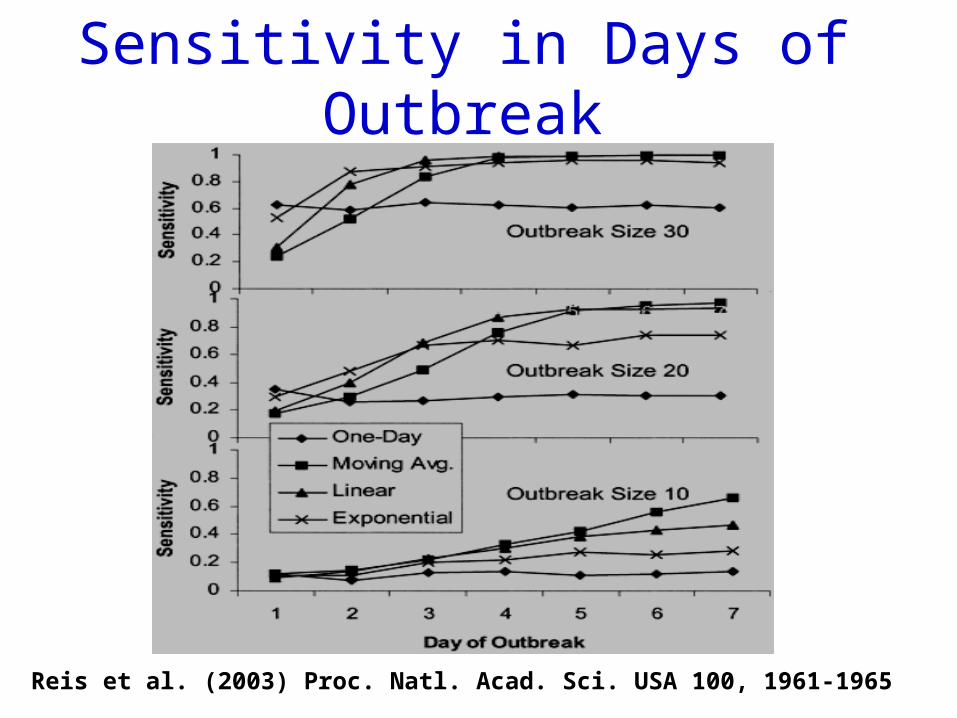
Sensitivity in Days of Outbreak
Reis et al. (2003) Proc. Natl. Acad. Sci. USA 100, 1961-1965
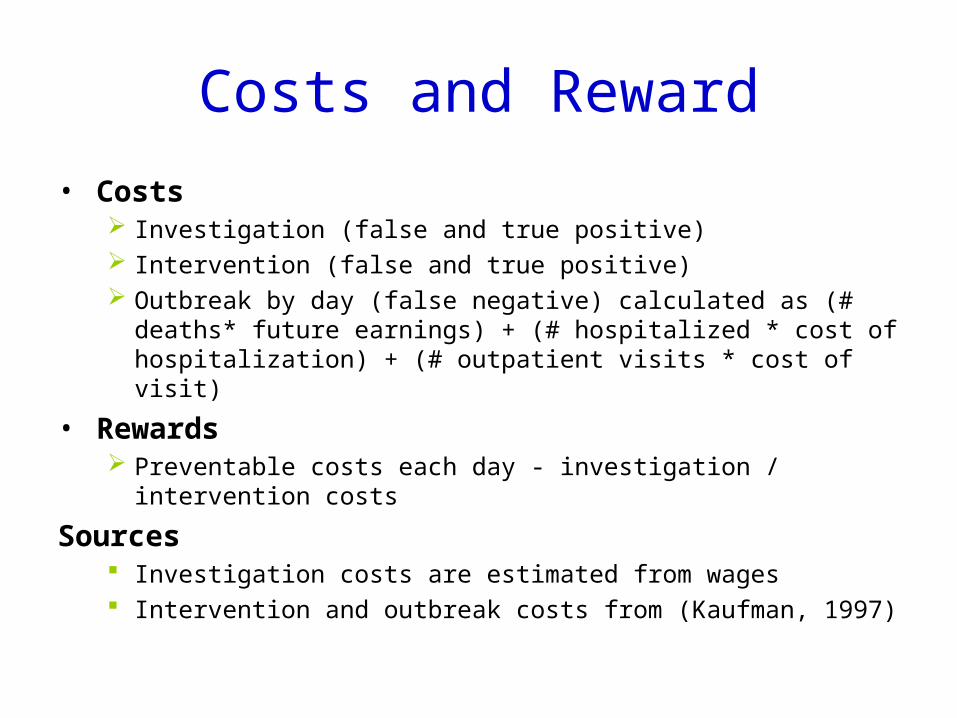
Costs and Reward
• Costs Investigation (false and true positive) Intervention (false and true positive) Outbreak by day (false negative) calculated as (# deaths* future
earnings) + (# hospitalized * cost of hospitalization) + (# outpatient visits * cost of visit)
• Rewards Preventable costs each day - investigation / intervention costs
Sources Investigation costs are estimated from wages Intervention and outbreak costs from (Kaufman, 1997)
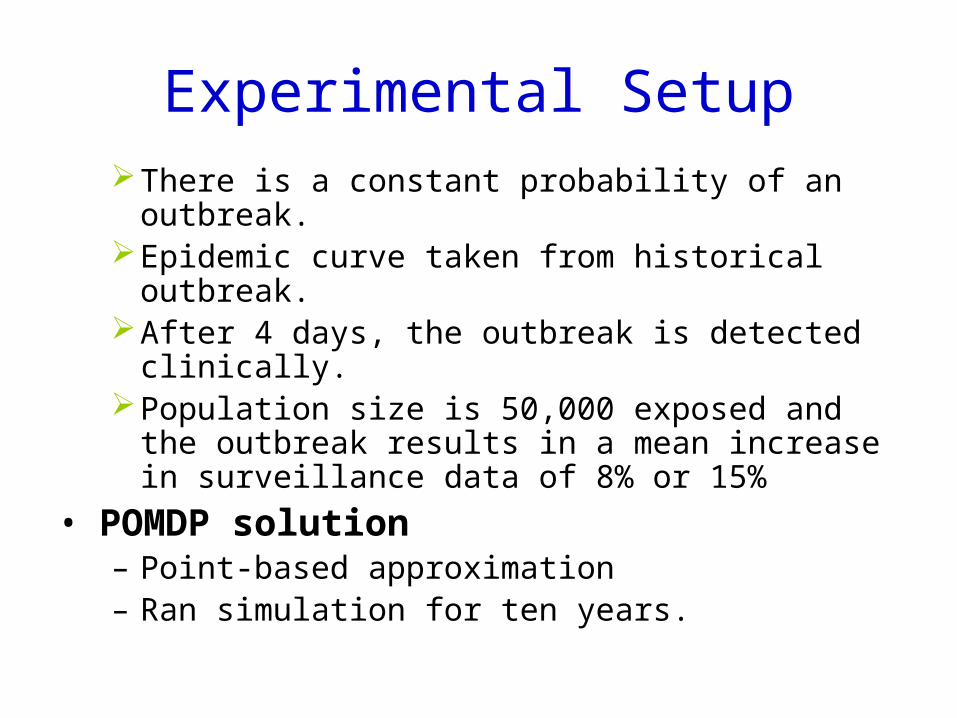
Experimental SetupThere is a constant probability of an outbreak.Epidemic curve taken from historical outbreak.After 4 days, the outbreak is detected clinically.Population size is 50,000 exposed and the outbreak
results in a mean increase in surveillance data of 8% or 15%
• POMDP solution– Point-based approximation – Ran simulation for ten years.
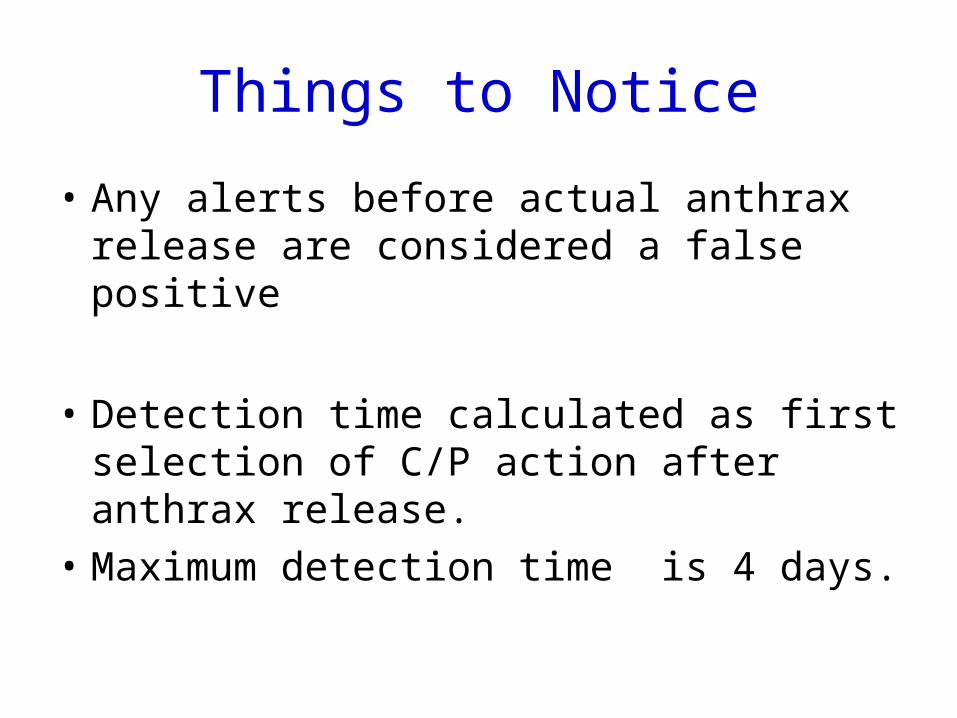
Things to Notice
• Any alerts before actual anthrax release are considered a false positive
• Detection time calculated as first selection of C/P action after anthrax release.
• Maximum detection time is 4 days.
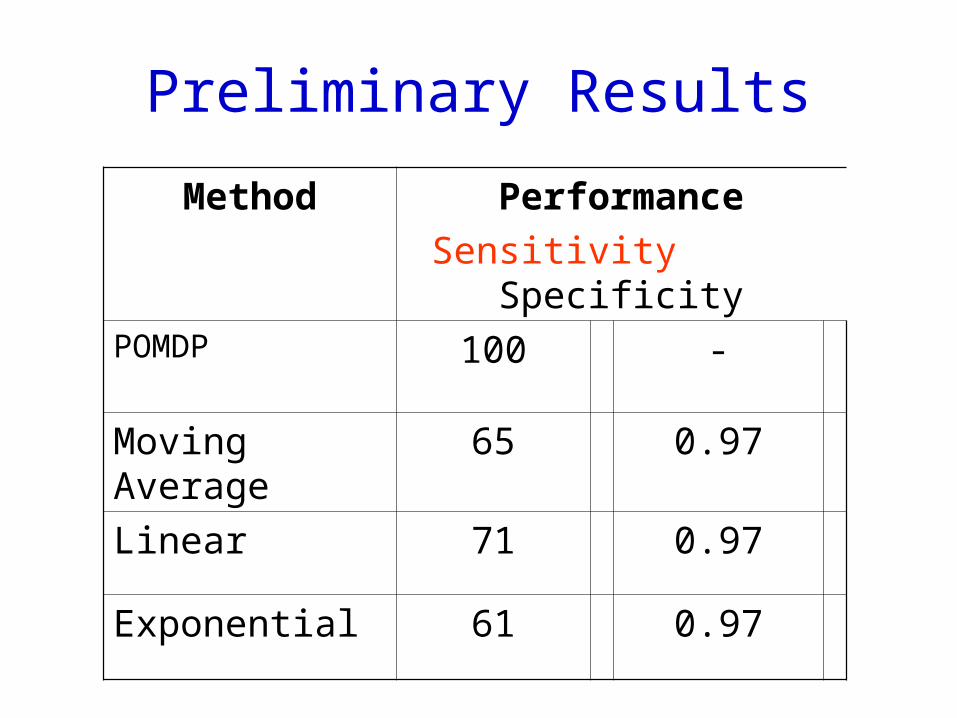
Preliminary Results
Method Performance
Sensitivity SpecificityPOMDP 100 -
Moving Average 65 0.97
Linear 71 0.97
Exponential 61 0.97
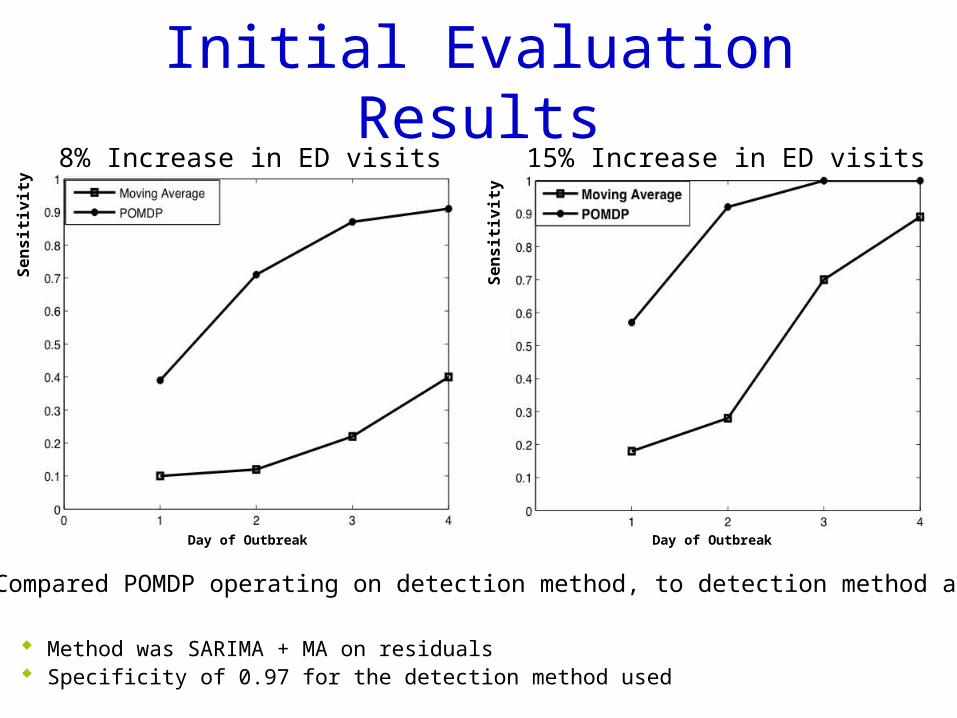
Initial Evaluation Results8% Increase in ED visits 15% Increase in ED visits
Day of Outbreak Day of Outbreak
Compared POMDP operating on detection method, to detection method alone
Method was SARIMA + MA on residuals Specificity of 0.97 for the detection method used
Se
ns
itiv
ity
Se
ns
itiv
ity
Final Words
Conclusion: POMDP improves the timeliness and
the sensitivity of detection processes
Future work: Sensitivity analysis over parameter values. Apply to other diseases and in other settings!

Thank You