optimizing floc formation and arsenic removal in drinking …€¦ · · 2013-06-18in drinking...
TRANSCRIPT

Optimizing Floc Formation and Arsenic Removal
in Drinking Water Supplies Containing Interfering Compounds
Benjamin Ware M.S.
Carl Garrison P.E.
2013 PNWS-AWWA Conference
May 9, 2013

Topic Overview
• Background
• Methods and Materials
• Results and Discussion
• Conclusion

Significance of Arsenic Contamination
• Acute and Chronic Toxicity, Class I Carcinogen
• Effective 2006, MCL was lower from 50 to 10 µg/L.
• 10 µg/L As Cancer risk = 1 in 10,000.

Background Location of Problem

Background • Isolated
locations
• Automated systems
• Variable source water quality
• Challenging treatment
Background
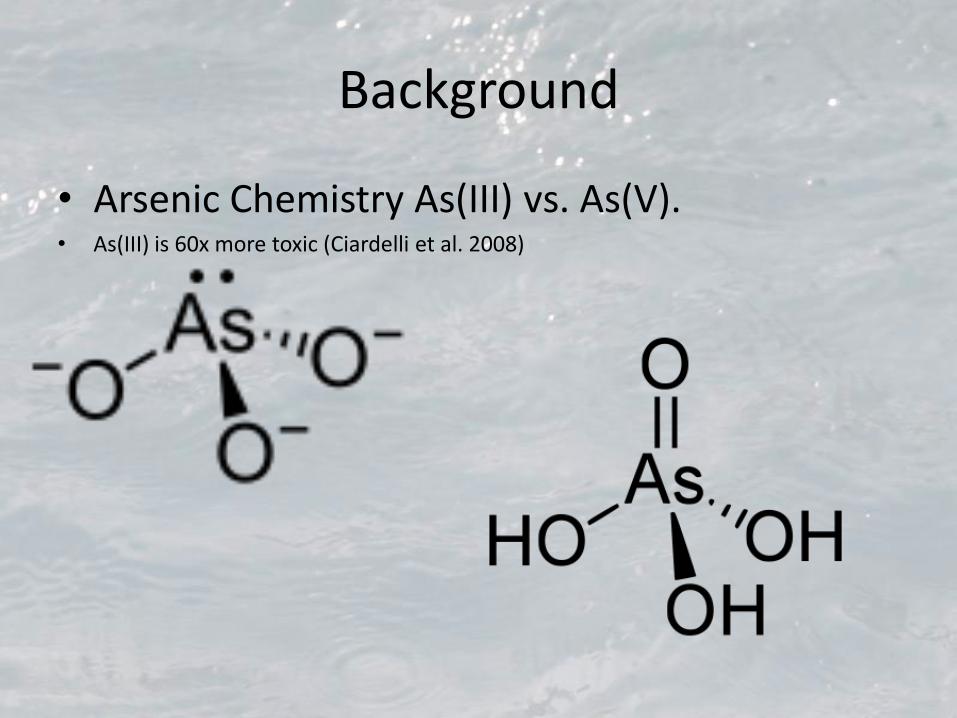
• Arsenic Chemistry As(III) vs. As(V). • As(III) is 60x more toxic (Ciardelli et al. 2008)

Background
• Ferric Chloride coagulation/flocculation
FeCl3∙ 6H2O+3(HCO3-)Fe(OH)3(am)+3Cl-+3CO2+6H2O
Background
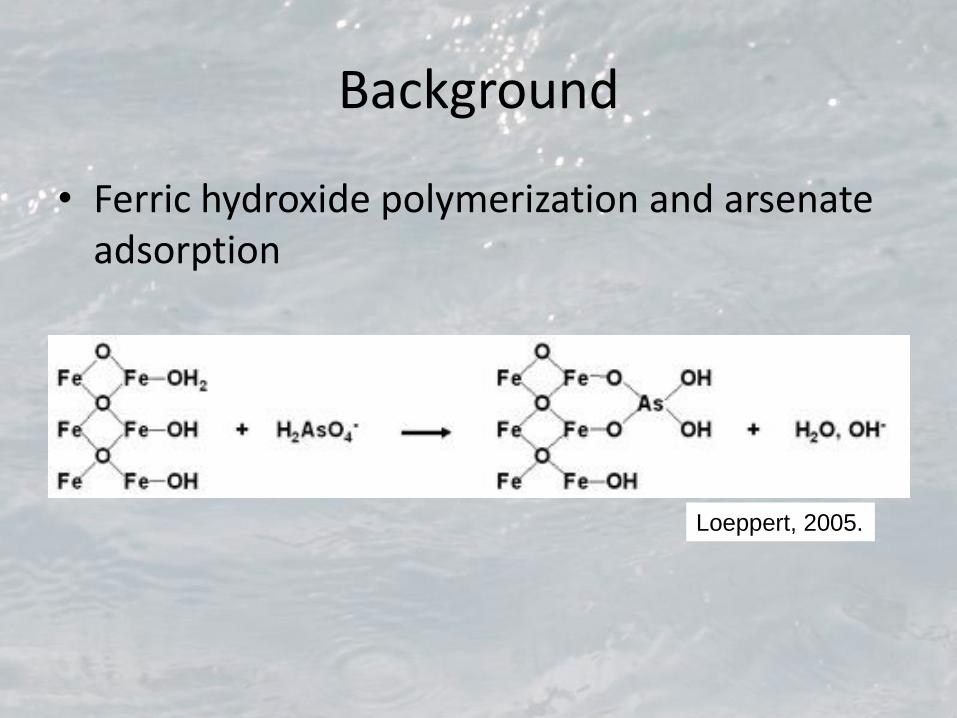
• Ferric hydroxide polymerization and arsenate adsorption
Loeppert, 2005.
Background
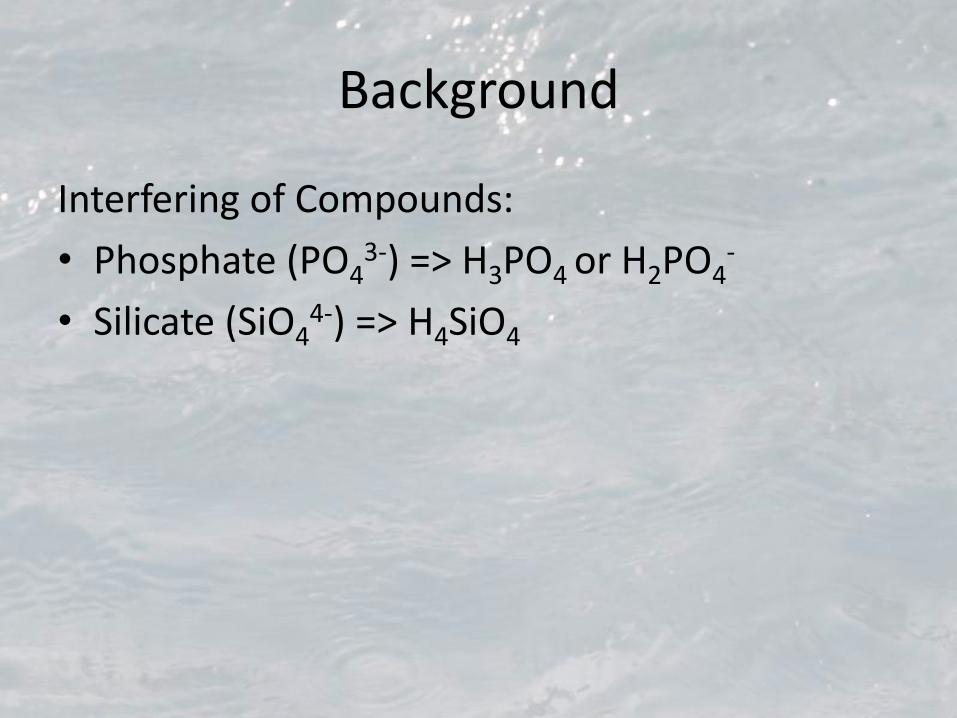
Interfering of Compounds:
• Phosphate (PO43-) => H3PO4 or H2PO4
-
• Silicate (SiO44-) => H4SiO4

Background
• Phosphate – competitive inhibitor (Laky et al, 2011; Guan et al, 2009; Roberts et al, 2004)

Background
• Silicate - Floc polymerization inhibitor
(Ruiping et al, 2007; Pokrovski et al, 2003)
Quartz (SiO₂) Silicate (SiO44-) → Orthosilicic Acid (H4SiO4)

Background XAFS (Pokrovski et al, 2003)

Objective
• Evaluate arsenic removal as a function of:
ferric chloride dose,
phosphate concentration,
silicate concentration,
in a representative groundwater of Island County, WA.

Methods and Materials
• Chemicals
• Field Tracer Study
• Synthetic Groundwater
• Jar Testing Conditions
• Chemical Analysis
• Factorial Experimental Design.
– Two level, three factor

Field Tracer Study
• NaCl impulse input tracer study Brutus system

Synthetic Groundwater Chemical characteristics of synthetic and Island County
groundwater.
Synthetic
Water
Natural
Water
pH 8.2 ± 0.1 8
Conductivity [μS/cm] 1060 400
Alkalinity[ mg/L as CaCO3] 125 136
Inorganic
Species [mg/L] [mg/L]
Cl- 100 30
NO3- 1.3 1.3
SO42- 20 20
CO32- 136 140
Na+ 105 60
K+ 3.3 3.3
Mg2+ 14.2 14.2
Ca2+ 40 40
Arsenic 0.075 -

Jar Testing

Jar Testing
• Arsenic removal under a range of
– iron doses (2, 4 and 6 mg/L as Fe)
– silicate concentrations (0, 10, 20, 40 mg/L as Si)
– and phosphate concentrations (0, 0.5, 1.0, 1.5 mg/L as PO43-)
– Variations form factorial analysis 36 cubes
• Coagulation/Flocculation Procedure
– ferric chloride was added
– flash mixed for 1 minute at 100 rpm a mean velocity gradient (G)
of G = 106 s-1
– 20 minutes of slow mixing (30 rpm; G = 42 s-1)
– 10 minutes of quiescent settling. The mixing intensity (G) values were calculated using data supplied by (Jones et al, 1978).

Chemical Analysis
• Arsenic concentration - Inductively Coupled Plasma Mass Spectrometry (ICP-MS)
• PO43- concentrations - Stannous chloride method
4500 – P D (Standard Methods, 2005)
• Fe concentrations - HACH method 8008 with a spectrophotometer set at a wave length of 510 nm.

0

Results
• Field Tracer Study
• Phosphate Interference
• Silicate Interference
• Combined Effect of Phosphate and Silicate

Tracer Results
0.0
0.1
0.2
0.3
0.4
0.5
0.6
0.7
0.8
0.9
1.0
0 10 20 30 40 50 60 70
No
rmal
ize
d C
on
du
ctiv
ity
Time [min]
Conductivity Data
2 Ideal CSTRs in Series 17.2 min
Normalized conductivity values
from Brutus tracer study and
two ideal CSTR’s in series
curve.
19.6 min

Phosphate Interference
2
4
6
0
0.005
0.01
0.015
0.02
0.025
0.03
0 0.5
1 1.5
Fe [
mg/
L]
As
[mg/
L]
PO4 [mg/L]
The effect of phosphate interference on arsenic removal.

Phosphate Interference
• This Study – Floc formation was not effected
– Dosed at 2 mg/L iron
– Phosphate levels of 1.0 and 1.5 mg/L,
– Arsenic concentration was 0.021 and 0.030 mg/L, respectively
– Dosed at 4 mg/L iron (100% increase) yielded arsenic concentration below MCL
• Similar to Laky et al, (2011)
– In the presence of 1.2 mg/L phosphate
– An 80% increase in iron dose reduced the arsenic concentration below MCL

Silicate Interference
2
4
6
0
0.005
0.01
0.015
0.02
0.025
0.03
0 10
20 40
Fe [
mg/
L]
As(
V)
[mg
/L]
Si [mg/L]
The effect of silicates interference on arsenic removal.

Silicate Interference • This Study – Floc formation was delayed, decreased floc size (more pin
floc)
– In the presence of 10 mg/L silicate at 2 mg/L iron dose, 95% arsenic removal was exhibited
• Guan et al, (2009)
– 80 percent arsenic removal in the presence of 10 mg/L silicate and iron dose of 2.5 mg/L
• Laky et al, (2011)
– Even lower arsenic removal (55 %) was observed at similar low range of iron (Fe = 1.5 mg/L) and silicate (Si = 10 mg/L) levels
• The decrease in arsenic removal could be due to the lack of Ca2+ ions in the Laky and Guan synthetic test water
• Calcium and magnesium, aids in ferric hydroxide formation in the presence of silicate (Ruiping et al, 2007)

Combined Phosphate and Silicate Interference
0
0.5
1
1.5
0
0.005
0.01
0.015
0.02
0.025
0.03
0.035
0.04
0 10
20 40
PO
4 (
mg
/L)
As
(mg
/L)
Silicate (mg/L)
Arsenic concentrations in filtrate as a function of varying phosphate and silicate
concentrations and a fixed dose of 2 mg/L Fe.

Combined Phosphate and Silicate Interference
Arsenic concentrations in filtrate as a function of varying phosphate and silicate
concentrations and a fixed dose of 4 mg/L Fe.
0
0.5
1
1.5
0
0.005
0.01
0.015
0.02
0.025
0.03
0.035
0.04
0 10
20 40
PO
4 [
mg
/L]
As
[mg
/L]
Si [mg/L]

Combined Phosphate and Silicate Interference
0
0.5
1
1.5
0
0.005
0.01
0.015
0.02
0.025
0.03
0.035
0.04
0 10
20 40
PO
4 [
mg
/L]
As
[mg
/L]
Si [mg/L]
Arsenic concentrations in filtrate as a function of phosphate and silicate
concentrations and a fixed dose of 6 mg/L Fe.

Statistical Significant Main Effects and Interactions
• 36 Factor increase variations (cubes)
– iron doses (2 and 4 mg/L as Fe)
– silicate concentrations (0, 10, 20, 40 mg/L as Si)
– and phosphate concentrations (0, 0.5, 1.0, 1.5 mg/L as PO4
3-)
• Only one significant phosphate-silicate interaction
– increase of phosphate from 0 to 0.5 mg/L and increase of silicate from 0 to 10 mg/L, which increased arsenic concentration by an average of 0.003 mg/L (Equation 5)

Statistical Significant Main Effects
• Phosphate Main Effects
• 29 of 36 conditions exhibited a significant main effect
• Increase of silicate from 0 to 10 mg/L and increase of phosphate from 0 to 1.5 mg/L resulted in increasing the arsenic concentration by an average of 0.017 mg/L (Equation 3)
• At all levels of silicate tested the increase of phosphate from 0 to 1.5 mg/L, resulted in a significant increase in average arsenic concentrations

Statistical Significant Main Effects
• Silicate Main Effects
• 15 of 36 conditions exhibited a significant main effects
• Increasing phosphate levels from 0 to 0.5 mg/L and increasing silicate from 0 to 40 mg/L, increased final arsenic concentration by an average of 0.011 mg/L (Equation 4)
• Over the range of phosphate levels, an increase of 0 to 40 mg/L silicate resulted in a significantly increased final arsenic concentrations

Between Run Precision
0
0.005
0.01
0.015
0.02
0.025
0.03
0.035
0.04
0.045
1 2 3 4 5 6 7
As
[mg/
L]
Fe [mg/L]
Original 0.5
Original 1.0
Original 1.5
Duplicate 0.5
Duplicate 1.0
Duplicate 1.5
The original and replicate arsenic removal data, each pair was within 0.002 mg/L

Conclusions
• Lack of statistical significant PO43- -Si interaction
• At low iron doses (e.g. 2 mg/L) phosphate and silicate can decrease arsenic removal from 97 to 59 percent.
• At a higher iron dose of 6 mg/L the interfering effects are significantly reduced.
• Over the range of concentrations studied, increasing iron dose can yield finished water that meets the 0.010 mg/L MCL
• Further Research
-Humic interference and combined interferences

Acknowledgement
• Carl Garrison, PE of Garrison Engineering
• Larry Henderson, Ph. D. Edge Analytical Laboratories
• The members of the Brutus Water System for the opportunity to perform the tracer study.
• David Yonge , Ph. D.
• and my Family.

References 1. Bilici Baskan, M.; Pala, A.; Turkman, A., 2010. Arsenate Removal by Coagulation Using Iron Salts and Organic Polymers.
Ekoloji, 19:74:69.
2. Berthouex, P.; Brown, L., 1994. Statistics for Environmental Engineers. CRC Press, Boca Raton, FL.
3. Brandhuber, P. Impact of the presence of silica on the treatment of arsenic on drinking water. Proc. 2004 AWWA WQTC.
4. Ciardelli, M.; Xu, H.; Sahai, N., 2008. Role of Fe(II), phosphate, silicate, sulfate, and carbonate in arsenic uptake by coeprecipitation in synthetic and natural groundwater. Water Research, 42:3:615.
5. Chwirka, J.; Colvin, C.; Gomez, J.; Mueller, P., 2004. Arsenic removal from drinking water using coagulation/microfiltration process. Journal of American Water Works Association, 96:3:106.
6. García-Lara, A.M.; Montero-Ocampo, C., 2010. Improvement of Arsenic Electro-Removal from Underground Water by Lowering the Interference of Other Ions. Water Air Soil and Pollution, 205:1-4:237.
7. Guan, X.; Dong, H.; Ma, J.; Jiang, L., 2009. Removal of arsenic from water: Effects of competing anions on As(III) removal in KMnO4–Fe(II) process. Water Research, 43:3891.
8. Holm, T., 2002. Effects of CO32-/bicarbonate, Si, and2 PO4
3- on Arsenic sorption to HFO. Journal of American Water Works Association, 94:4:174.
9. Jones, R.; Williams, R.; Moore, T., 1978. Development and Application of Design and Operation Procedures for Coagulation of Dredged Material Slurry and Containment Area Effluent. Environmental Laboratory U.S. Army Engineer Waterways Experiment Station, Technical Report D-78-54. 1-176.
10. Krauskopf, K., 1956. Dissolution and precipitation of silica at low temperatures. Geochimica et Cosmochimica Acta, 10:1-2:1.
11. Laky, D.; Licskó, I., 2011. Arsenic removal by ferric-chloride coagulation-effect of phosphate, bicarbonate and silicate. Water Science & Technology, 64:5:1046.
12. Levenspiel, O., 1962. Chemical Reaction Engineering, John Wiley and Sons, New York, N.Y.
13. Loeppert, R., 2005. “The Challenges of Arsenic in Agriculture & the Environment” Retrieved from http://arsenic.tamu.edu/about/course/mod2/notes/pg7.htm
14. Lytle, D.; Sorg, T.; Snoeyink, V., 2005. Optimizing arsenic removal during iron removal: Theoretical and practical considerations. Journal of Water: Research & Technology–AQUA, 54:8:545.
15. Matthess, G., 1982. The Properties of Groundwater. Trans. John C. Harvey, John Wiley and Sons, New York, N.Y.

References (continued)
16. Meng, X.; Bang, S.; Korfiatis, G., 2000. Effects of silicate, sulfate, and carbonate on arsenic removal by ferric chloride. Water Resource 34:4:1255.
17. Pokrovski, G.; Schott, J.; Farges, F.; Hazemann, J., 2003. Iron (III)-silica interactions in aqueous solution: Insights from X-ray absorption fine structure spectroscopy. Geochimica et Cosmochimica Acta, 67:19:3559.
18. Roberts, L.; Hug, S.; Ruettimann, T.; Billah, M.; Khan, A.; Rahman, M., 2004. Arsenic Removal with Iron(II) and Iron(III) in Waters with High Silicate and Phosphate Concentrations. Environmental Science & Technology, 38:1:307.
19. Ruiping, L,; Xing, L,; Shengji, X,; Yanling, Y,; Rongcheng, W,; Guibal, L., 2007. Calcium-enhanced ferric hydroxide co-precipitation of arsenic in the presence of silicate. Water Environment Research, 79:11:2260.
20. Standard Methods for the Examination of Water and Wastewater. 2005 (21th ed.). American Public Health, American Water Works Association, and Water Environment Federation, Washington.
21. Smith, S.; Ewards, M. The influence of water quality on arsenate sorption kinetics. Proc. 2002 AWWA WQTC.
22. Teichroew, D., 1956. Tables of Expected Values of Order Statistics and Products of Order Statistics for Samples of Size Twenty and Less from the Normal Distribution. The Annals of Mathematical Statistics, 27:2:410.
23. USEPA, 2000. “Technologies and Costs for Removal of Arsenic from Drinking Water.” EPA 815-R-00-028 Retrieved from www.epa.gov/safewater
24. USGS, 1968. Groundwater Resources of Island County. Water Resources Division VanDenburgh, A. Water Supply Bulletin No. 25, 22-26


0
0.2
0.4
0.6
0.8
1
1.2
1.4
1.6
0 5 10 15 20 25 30 35
No
rmal
ize
d C
on
du
ctiv
ity
Time [min]
Tank 1 Data
Ideal CSTR